Article

Seismic Response of Cable-Stayed Spanning Pipeline Considering Medium-Pipeline Fluid–Solid Coupling Dynamic Effect

School of Mechanical Engineering, Xi’an Shiyou University, Xi’an 710065, China
*
Author to whom correspondence should be addressed.
Processes 2023, 11(2), 313; https://doi.org/10.3390/pr11020313
Submission received: 6 December 2022 / Revised: 15 January 2023 / Accepted: 15 January 2023 / Published: 18 January 2023
(This article belongs to the Special Issue Numerical Calculation and Experimental Measurement in Multiphase Flow)

Abstract

:
With the aim of determining the influence of the fluid–structure coupling dynamic effect of the oil and gas transmission medium and pipeline on the seismic response, an oil pipeline supported by a cable-stayed spanning structure was taken as the study object. Kinetic equations taking into account the action of oil and gas medium were studied, and a finite element model structure considering the additional-mass method and the fluid–structure coupling effect were established separately. In addition, the mechanism of the oil–gas–pipeline coupling action on the seismic response of pipeline structure was analyzed, and the results were obtained. The results show that the pipeline has a minimal seismic response at the abutment location, the seismic response gradually increases along the abutment to the main tower, and the seismic response reach is maximized at about one-fifth of the bridge platform. The seismic response of the oil and gas pipeline model structure using the additional-mass method is generally more significant than that based on the fluid–solid coupled dynamic model; moreover, the maximum displacement response differs by about 24%, and the maximum acceleration response differs by approximately 30%, indicating that the oil and gas medium has a certain viscoelastic damping effect on the seismic response of the oil pipeline, which provides a reference for the seismic response calculation theory and analysis method of cable-stayed spanning oil pipelines.

1. Introduction

In an earthquake, an oil and gas pipeline rupture can cause many incalculable hazards [1]. Cable-stayed spanning oil and gas pipelines have especially severe and complicated effects on the environment and humans during an earthquake. There are still deficiencies in the seismic design of cable-stayed spanning oil and gas transmission pipelines, and there is no complete theoretical analysis and calculation method for the coupling action between oil and gas pipelines and the oil and gas transmission medium. A series of studies have investigated the seismic response of cable-stayed spanning oil and gas transmission pipelines considering the fluid–solid coupling effect. In terms of the additional-mass method, Westergaard proposed the concept of using additional mass to characterize the seismic action on the basis of the assumptions of incompressible fluids and rigid structures. Xiao [2] established a pipe fluid–structure-coupling additional-mass model on the basis of the unidirectional fluid–structure coupling mechanism, using the FEM method to conduct simulation analysis. It was concluded that the flow velocity increases with coupling mass, and the critical flow velocity subjects the pipe to the static buckling phenomenon. Although the effect of additional masses of fluid was analyzed in different flow states on pipeline vibration, the study did not take into account the damping and rigid effects of additional mass on the pipeline, which is not realistic. Li [3] analyzed the effect of the fluid in the pipe on the modal characteristics of the pipe by applying the Timoshenko beam theory and the energy method, introducing additional mass, stiffness, and damping; the results showed that the fluid pressure changes the stiffness of the pipe model, and the fluid flow rate is too high for the buckling instability phenomenon. Although additional stiffness and damping were added to more accurately consider the influence of pressure and flow rate of the fluid on the structure, pipe units such as Pipe 289 and Elbow 290 built into ANSYS software were abandoned, which presents certain limitations. Dante [4] applied the FSI simulation method to the bidirectionally coupled FSI solver to evaluate the additional mass and additional damping of rods under different levels of fluid excitation; the correlation between additional mass and additional damping with the characteristics of the fluid itself was proposed to derive the relationship between the additional mass of the rod structure in the liquid and the additional damping, which varied with the changes in fluid. Although the study covered more complete parameters, it ignored rod-related parameters such as rod constraints and different fluid velocity settings. Zhou [5], through the vibration test of a circular bending film in still air, obtained an additional mass coefficient of the circular bending film of 0.65 and verified the efficiency of the two additional mass models, concluding that there was essentially no significant difference in the additional mass of the bending film in vacuum and air. The study only discussed the additional mass of the structure in air and gave corresponding results, but did not evaluate the additional mass of the structure in the fluid, which is relatively incomplete. The theory of the additional-mass method has been studied for a long time with fruitful results; however, due to the complexity of practical problems, the additional-mass method cannot effectively determine the influence of the oil and gas medium on the dynamic characteristics and seismic response of in oil and gas pipelines. Therefore, Zhao [6] proposed a matrix transfer method based on Laplace changing for the vibration of pipes due to the flow of fluids in bent pipes; for the first time, it was pointed out that, when calculating the response of the clamped elastic support bend, a more stable combination of forces should be considered. The accuracy of the method was verified through comparison with other studies. Xu [7] derived equations according to fluid–solid coupled dynamics theory and elasticity theory to establish a finite element calculation program, and the dynamic response of large double-aqueduct structures was studied. The study showed that the fluid in the fluid–solid coupling effect increased the mass matrix of the overall structure and reduced the self-oscillation frequency; the seismic response considering the fluid–solid coupling effect was relatively large and unfavorable for the structure. The study did not take into account the damping and rigid effect of additional mass on the structure, which is not realistic, and the study lacked a comparative analysis of different flow velocities of fluids. Wang [8] studied the dynamic characteristics and seismic response of buried-water supply pipelines based on fluid–structure coupling theory to investigate the effects of fluid flow rate, working pressure, and other parameters on the seismic response of pipelines. In the safe operation of pipelines, considering the fluid–solid coupling makes the forces on the pipeline more consistent with the actual conditions, and the calculation results are, thus, more accurate [9]. Farhat et al. [10] introduced three formulations of fluid–solid coupling interactions; the fluid was modeled by the Euler equation or the N–S equation, and the structure was represented by a finite element model that combined theory with finite element software to precisely characterize the fluid–solid coupling effects. Nieto [11], using a rectangular cylinder as the test object, investigated the application of the 2D URANS method and the Mentor SST k–ε turbulence model to the fluid–solid coupling problem and demonstrated the method’s feasibility in identifying the fluid–solid coupling response. This study provided a new SST k–ε turbulence model and compared it with Shimada and Ishihara et al. through the modified k–ε turbulence model, revealing that the SST k–ε turbulence model had higher accuracy and, thus, could be applied to bridge deck optimization with aeroelastic constraints. Wang [12] numerically analyzed the fluid and pipe model in a horizontal pipe by combining the fluid volume model and the k–ε turbulence model and established the FSI framework to study the response results of the fluid–solid coupling interaction, and the results showed that the dynamic response was relatively flat under stratified flowing conditions, while the dynamic response of the horizontal pipe under turbulent flow conditions showed periodic fluctuations. It is necessary to analyze the fluid–solid coupling effect (FSI) for flexible pipe structures, which may cause local damage to the pipe structure. Guo [13] established the FSI model by using eight control equations; three main coupling modes were considered in the FSI analysis, including frictional coupling, Poisson coupling, and joint coupling; and the finite volume (FVM) method was applied for the complete solution. It was concluded that different stiffnesses would cause different FSI responses; however, the study did not perform linear decoupling of non-planar pipeline vibrations, which is incomplete. Rakhsha [14] compared two techniques based on Lagrangian methods for fluid dynamics problems and computational fluid dynamics problems and concluded that fluid dynamics is the most commonly used alternative to computational fluid dynamics for solving complex, moving, fluid–solid coupled problems. However, the relative error of the average drag coefficient in the last 2 s of the study was large, which may have been caused by different time integration schemes, thus necessitating improvement. Liu [15] proposed an immersed over-interface finite element method to simulate the fluid–solid coupling problem and demonstrated the method’s accuracy by simulating fluids with different Reynolds numbers and examples of finite deformation interactions of the structure caused by fluid flow. This approach needs to be explored in depth in terms of compressible fluids, three-dimensional problems, and the enrichment of solid components, but the proposed ITI-FEM theory can be extended to solve problems in civil engineering. Wang [16], using fluid–solid coupled systems of fluid immersion structures, explored the singular value decomposition-based modeling approach and the modal superposition method, and numerical simulations showed that the hybrid finite element formulation could predict the frequencies of fluid–solid coupled systems in different physical fields without being affected by the nonphysical mode of nonzero frequency, laying the foundation for future research on analog linear and nonlinear FSI systems. Richter [17] compared two models based on fluid–solid coupled problems and proposed a model based on fully Eulerian coordinates, which was solved using an implicit method to introduce and validate a new Eulerian coordinate model based on fluid–solid coupled problems. The discretization of this Eulerian coordinate model and the solution of time programming were not studied, leading to differences in the solution results. Wu [18] studied the flow–solid coupling between the pipe structure and the internal airflow of the pipe on the basis of a large eddy simulation with dynamic meshing. The results showed that the overall vibration frequency of the coupled pipe was close to the intrinsic frequency of the pipe structure when the inlet flow rate was stable. There was no external excitation, and the vibration of the pipe became more and more excited when the pressure inside the pipe increased. The large eddy current simulation LES was more realistic than the k–ε turbulence model, and the study confirmed the usability of this simulation through the comparison of experimental and numerical results, which can be used in engineering practice. Wang [19] conducted numerical simulations for the evolution characteristics of pipe flow in a 90° bend to study the response of fluid–structure interaction, and the results showed that an increase in surface flow velocity led to a decrease in the maximum total deformation and equal force of the pipe, the maximum total deformation and equal force fluctuated periodically, and the plug flow with higher gas velocity caused more severe effects at the 90° bend. This study did not adequately reduce the cost of optimizing the medium–structure interaction, which can provide some guidance for the design and seismic resistance of 90° bends. Benedikt [20] combined the novel Eulerian method with a different approach to establishing an arbitrary Lagrangian–Eulerian (moving mesh) finite element formulation, revealing the benefits of solving moving domain mesh problems by applying cut finite element techniques and providing a highly flexible discretization method. Gu [21] proposed a stochastic dynamics model to analyze the vibration characteristics of the fluid for the effect of deterministic parameters on the fluid vibration in the tube and verified the correctness of the proposed model and analysis method. The parameter fluctuation led to a change in the dynamic characteristics of the pipeline, and this method can play an important role in suppressing this situation, representing a certain theoretical reference for the safe transportation of the industrial engineering pipeline. Andrade [22] extended the quasi-two-dimensional flow model and proposed a method to analyze the energy transfer and dissipation effects in fluid piping systems. The model established by the thermomechanical consistency framework could accurately describe the internal structure of the fluid, and the results showed that the method better described the frictional coupling mechanism between the fluid and the solid, as well as the distribution of shear stress in a non-constant fluid. Liang [23] used a simultaneous two-thread analysis method to analyze the dynamic characteristics of the elbow considering fluid–solid coupling. It elucidated the vibration variation law caused by the gas–liquid two-phase flow in the elbow. However, in the bending part, in addition to the interaction force of the fluid–structure interaction, it is affected by the reaction force of the gravity of the two-phase flow between the gas and the liquid, which is more obvious for the shock and vibration of the bend, thus necessitating a deeper study. Kushagra [24] modeled a computational fluid dynamics solver based on the finite volume method by proposing a partitioned fluid–solid coupled solver to simulate dynamic pressure lubrication of an elastic fluid in line contact and assuming that the fluid is ideal in the inviscid state, and the results showed that the model was in general agreement with the results of the Reynolds equation-based solution. Teng [25] derived an expression for the axial stress of the oil pipeline and analyzed the seismic response of the buried pipeline by using a finite element software to build a model, and the results showed that the influence of the coupled thermal–fluid–solid field on the pipeline was more obvious, and the pipeline frequency decreased by more than 89%, and the axial stress increased by 46%. This indicates that heat–fluid–solid coupling should be added to the seismic response of oil pipelines, which provides technical and theoretical support for the design and seismic resistance of oil and gas pipelines in cold regions. Bhavana [26] presented a model with a combination of equivalent mass and other types of hydrodynamic models because the effect of hydrodynamic forces in themselves is often neglected in elevated ferries, and the seismic response analysis of the model considering hydrodynamic and soil–structure interactions indicated that the effect of fluid mass on the ferry was significant in the frequency domain. However, this study did not take into account the hydrodynamic effects that occur when the bridge structure is completely submerged in water, thus only providing theoretical insights for the modeling and seismic response of an elevated aqueduct. Li [27] established a three-phase coupling model of pipe–soil–liquid based on fluid–solid coupling and studied the effects of piping, fluid, and other parameters on the mechanical properties of buried oil and gas pipelines, and the results showed that the oil and gas pipelines with the fluid–solid coupling effect considered could effectively simulate the actual conditions of the pipelines and provide references for the design of flow transmission pipelines. Vieir [28] compared the simulation results of a flexible riser considering the fluid–solid coupling effect with the experiments of a flexible riser conveying gas–liquid flow, and the simulation results obtained were in general agreement with the experiments, with a frequency deviation of 5–25% for the flexible tube. However, this study lacked the experimentation and analysis of large-scale flexible risers with high-order modal response and resonance, which can improve the accuracy of the interaction between real fluids and flexible risers. Deng [29] constructed a three-dimensional finite element model to study the longitudinal seismic response of bridges for the effects of the impact and fluid–solid coupling on bridge piers, and the study showed that the fluid–solid coupling effect was one of the causes of the impact in deep-water bridges, whereby the fluid–solid coupling amplified the seismic displacement of deep-water bridges. However, both fluid–structure interactions and individual collision effects of structures in the natural environment lead to an increase in bridge displacement; hence, the causes of bridge displacement should be explored in depth in deterministic analysis.
The available research results focus on deterministic seismic response analysis; however, studies of the seismic response from the perspective of considering the fluid–structure interaction of the medium mass and viscoelastic effect are relatively rare. Therefore, this paper proposes a calculation theory and simulation method of dynamic response by simultaneously considering the mass and viscoelastic effect of the oil and gas transmission medium, establishes a finite element calculation model, simulates and calculates the seismic response of the cable-stayed spanning oil and gas pipeline, reveals the influence of the fluid–solid coupling interaction on the seismic response of the cable-stayed spanning oil and gas pipeline considering the viscoelastic effect, and provides a reference for the seismic theory and safe operation of a cable-stayed spanning oil and gas pipeline.
The dynamic equation considering the action of oil and gas medium is studied, and the finite element model structures considering the additional-mass method and the fluid–structure coupling effect are established separately. Moreover, the dynamic parameters of oil and gas medium and the input parameters of seismic action are set. The mechanism of oil–gas medium coupling action on the seismic response of pipeline model structure is analyzed, and the calculation results of four points of the pipeline cross-section located at the bridge platform and the partial pipeline cross-section are extracted. The displacement and acceleration time history curves, as well as the peak values based on the additional-mass method and the fluid–structure coupling dynamic model, are given.

2. Theory and Simulation Experiments

2.1. Prototype Structure of Oil and Gas Transmission Pipeline

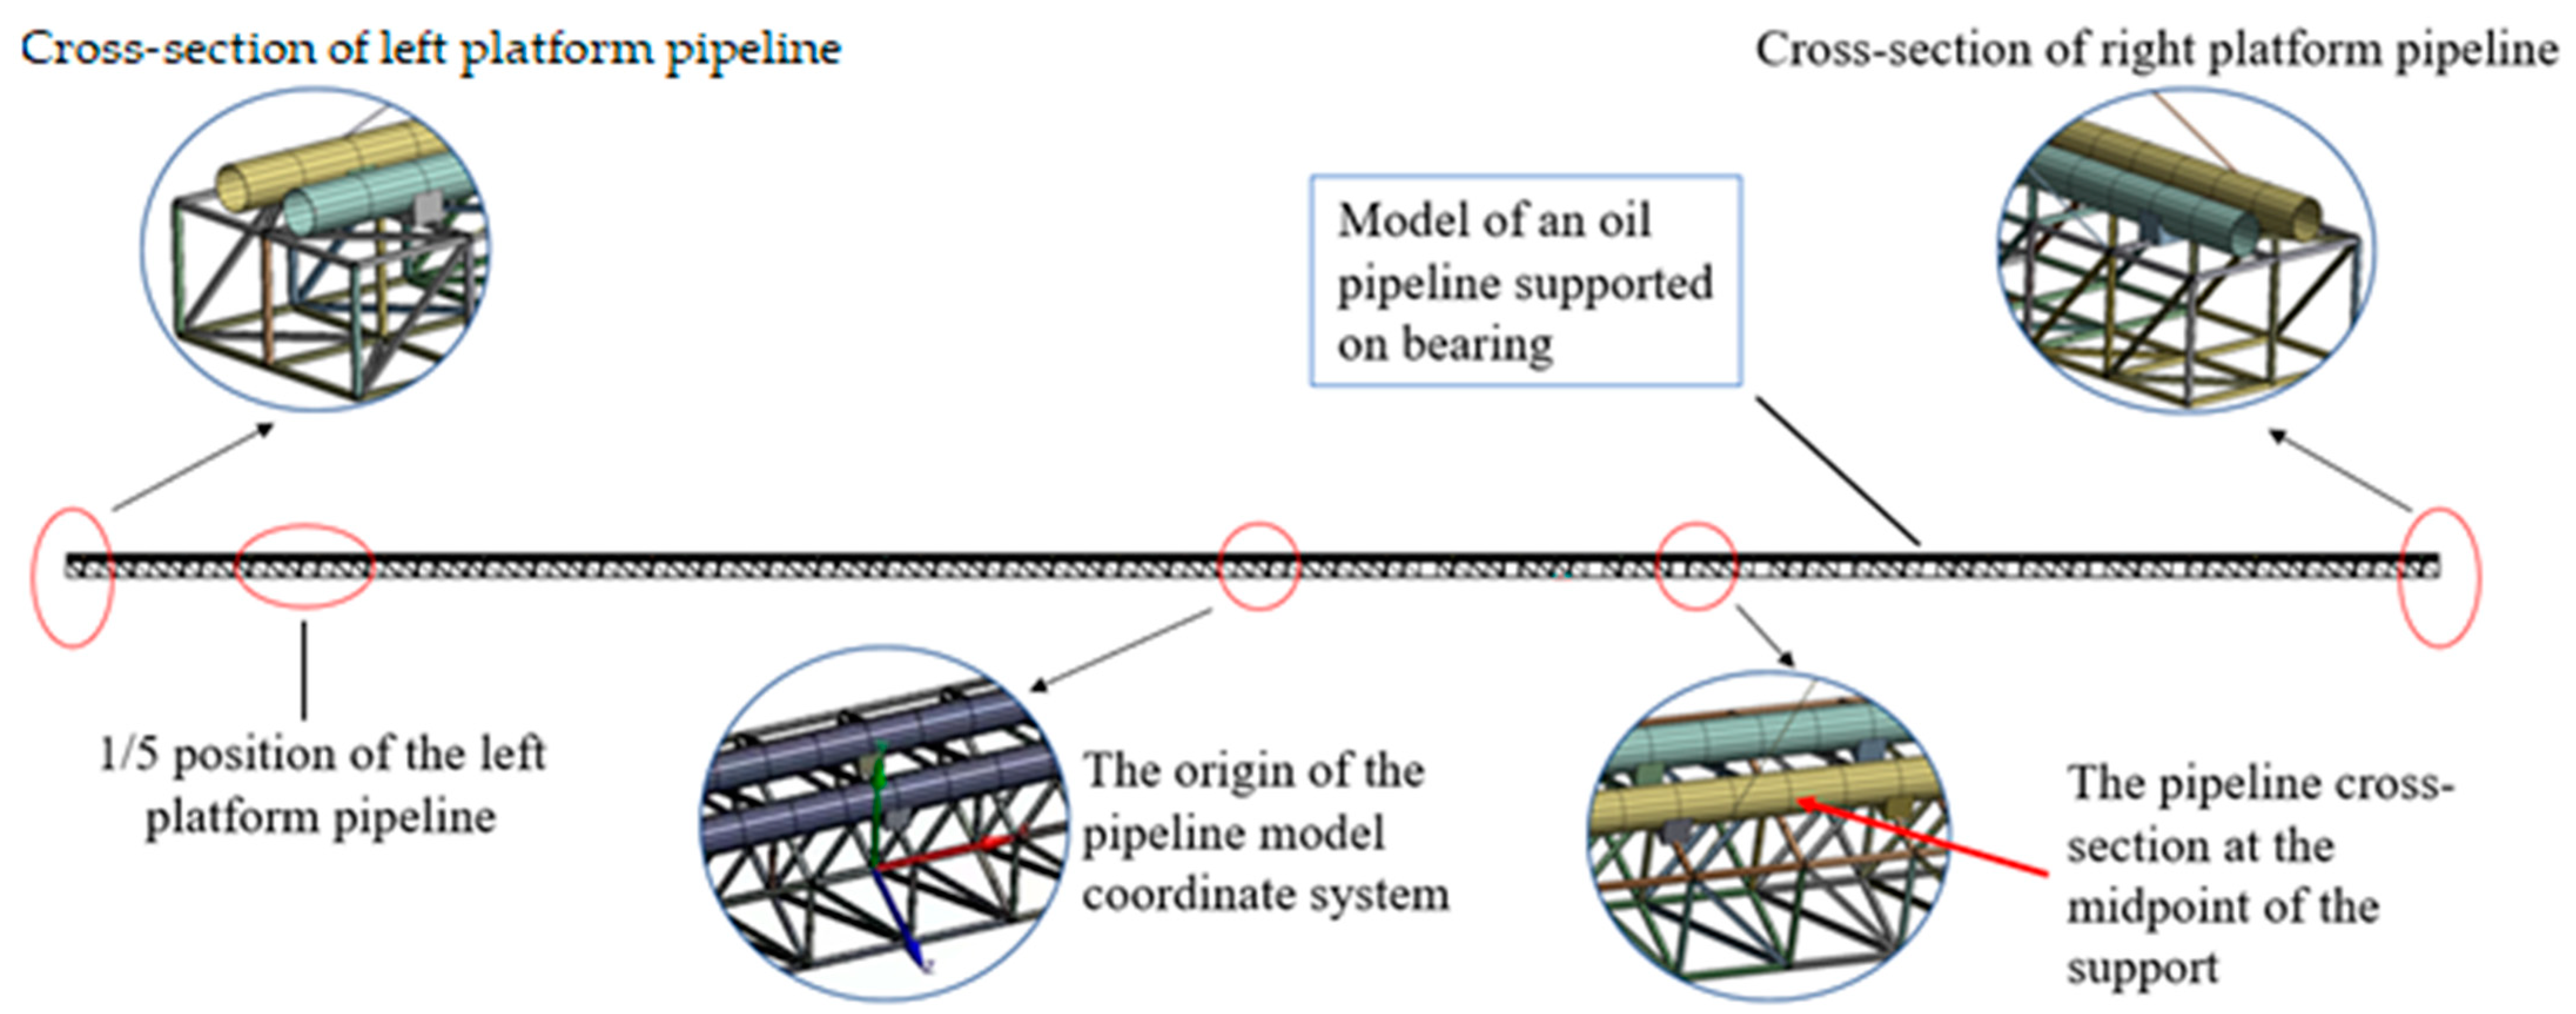
This paper uses an oil and gas pipeline supported on a single-tower double cable-stayed pipe bridge as a prototype structure. The total length of the oil and gas pipeline is 284 m, consistent with the cable-stayed span, and the bridge span arrangement is 142 m + 142 m. The joist beam is 0.284 m wide and consists of vertical rods, chords, diagonal webs, etc., all of which are made of Q345 structural steel. The length of each bracket beam is 2 m, and one support is laid for every two brackets. Two oil and gas transmission pipes are set side-by-side on the truss girders of the cable-stayed bridge. The pipes are made of X60 pipeline steel with a specification of Φ711 × 12.7 mm, the design transmission pressure is 6.3 MPa, and the maximum oil transmission temperature is 70 °C. The main tower is 72 m high for the vase type of structure, and Q345 bridge structural steel is selected. The cable is made of 6 × 37 galvanized steel wire rope, the basic cable distance is 10 m, and the cable distance on the main tower is 1.5 m, with specifications of Φ25.5, Φ36, Φ42, and Φ45. The prototype structure of the cable-stayed pipe bridge and the oil and gas transmission pipeline is shown in Figure 1.
The cable-stayed pipe bridge structure is in the eight-degree zone, a Class II site, with a characteristic period Tg of 0.35 s. This paper selects a typical seismic wave, EL-Centro wave, as the longitudinal bridge direction seismic excitation input to the cable-stayed pipe bridge. The first 40 s of earthquake excitation was selected, and the time interval was set to 0.02 s, with a total of 2000 data points. The structural parameters of the cable-stayed pipe bridge are shown in Table 1.

2.2. Dynamics Theory and Simulation for the Seismic Response of Oil and Gas Transmission Pipeline with the Additional-Mass Method

2.2.1. Dynamics Theory for the Seismic Response of Oil and Gas Transmission Pipeline Based on Additional-Mass Method

The additional-mass method is an analytical method that simplifies the dynamic effect of the oil and gas medium on the additional mass force of the oil and gas pipeline structure, and it solves the dynamic equations of the oil and gas pipeline structure by using the mass of the oil and gas transport medium inside the pipeline structure as the additional mass of the pressure on the inner wall of the oil and gas pipeline [2]. Taking the continuous simply supported spanning oil and gas pipeline as an example, the structural dynamics equation of the cable-stayed spanning oil and gas pipeline considering the action of oil and gas medium and seismic action is established using the additional-mass method. The fluid micro-element δ x equilibrium equation for any point x on the inner wall of the oil and gas pipeline is expressed as
F p A f 2 y x 2 = ρ f A f t + V 0 x 2 y . A f p x + q s = 0 .
The equilibrium equation for the micro-element δ x of the pipe section at point x is expressed as
Q x + T 2 y x 2 F m s 2 y t 2 = 0 . T x + q s Q 2 y x 2 = 0 .
In Equations (1) and (2), m s is the mass of the per unit length pipe, A f represents the medium through-flow area, ρ f represents the density of the medium, p is the pressure of the medium, V 0 is the flow rate in the pipe, F is the force exerted on the unit tube length medium, q represents the vertical shear stress, Q is the shear stress, T is the longitudinal tensile stress, y is the micro-element displacement of the pipe section, and s is the inner wall boundary of the pipe.
The static pressure at any point x on the inner wall of the oil and gas pipeline is expressed as
P = ρ f V 0 2 2 C p ( x , t ) ,
where ρ f is the fluid density inside the pipe, V 0 is the fluid flow rate inside the pipe, and C p ( x , t ) denotes the fluid pressure coefficient. Considering the pulsating nature of fluid motion inside the oil and gas pipeline, the addition of the pulsation coefficient α = 2 k + 1.414 V 0 k / V 0 2 is introduced, where k is the turbulence energy. From this, the pulsating quasi-static pressure can be obtained as follows:
P s = ρ f V 0 2 2 α C p ( x , t ) .
The pressure coefficient in Equation (4) is C p ( x , t ) = C p , max ( t ) sin ( n π x l ) . C p , max ( t ) represents the maximum value of the pressure coefficient, for which a Fourier expansion can be obtained:
C p , max ( t ) = A 0 + A k cos ω s , n t + B k sin ω s , n t ,
where A 0 , A k , and B k are the Fourier expansion term coefficients, and ω s , n = 2 π f n denotes the angular frequency corresponding to the n order vibration mode.
Then, the additional mass formed by the quasi-static pressure of the fluid in the pipe is expressed as
m 0 = 1 2 α ρ f V 0 2 A f y 0 ω s , n 2 ,
In Equation (6), α is the fluid pulsation coefficient, y 0 is the amplitude of the oil and gas pipeline, and A f is the oil and gas medium flowthrough area.
The inherent frequency of the vibration of the oil and gas pipeline in the air can be expressed as
ω s , n = K s m s ,
where K s and m s denote the modal stiffness and mass of the oil and gas transmission pipeline, respectively. When considering the effect of the pressure-added mass generated by the oil and gas transmission medium, Equation (6) can be written as
ω f , n = K s m s + m 0 ,
where ω f , n represents the coupling frequency under the influence of the oil and gas transmission medium in the oil and gas transmission pipeline. The pressure additional mass of the oil and gas transmission medium to the oil and gas transmission pipeline can be obtained from the ratio of Equations (7) and (8):
M 0 = f s , n f f , n 2 1 m s ,
where f s , n indicates the n -order modal inherent frequency of the oil and gas pipeline, and f f , n is the n -order fluid–solid coupling vibration inherent frequency.
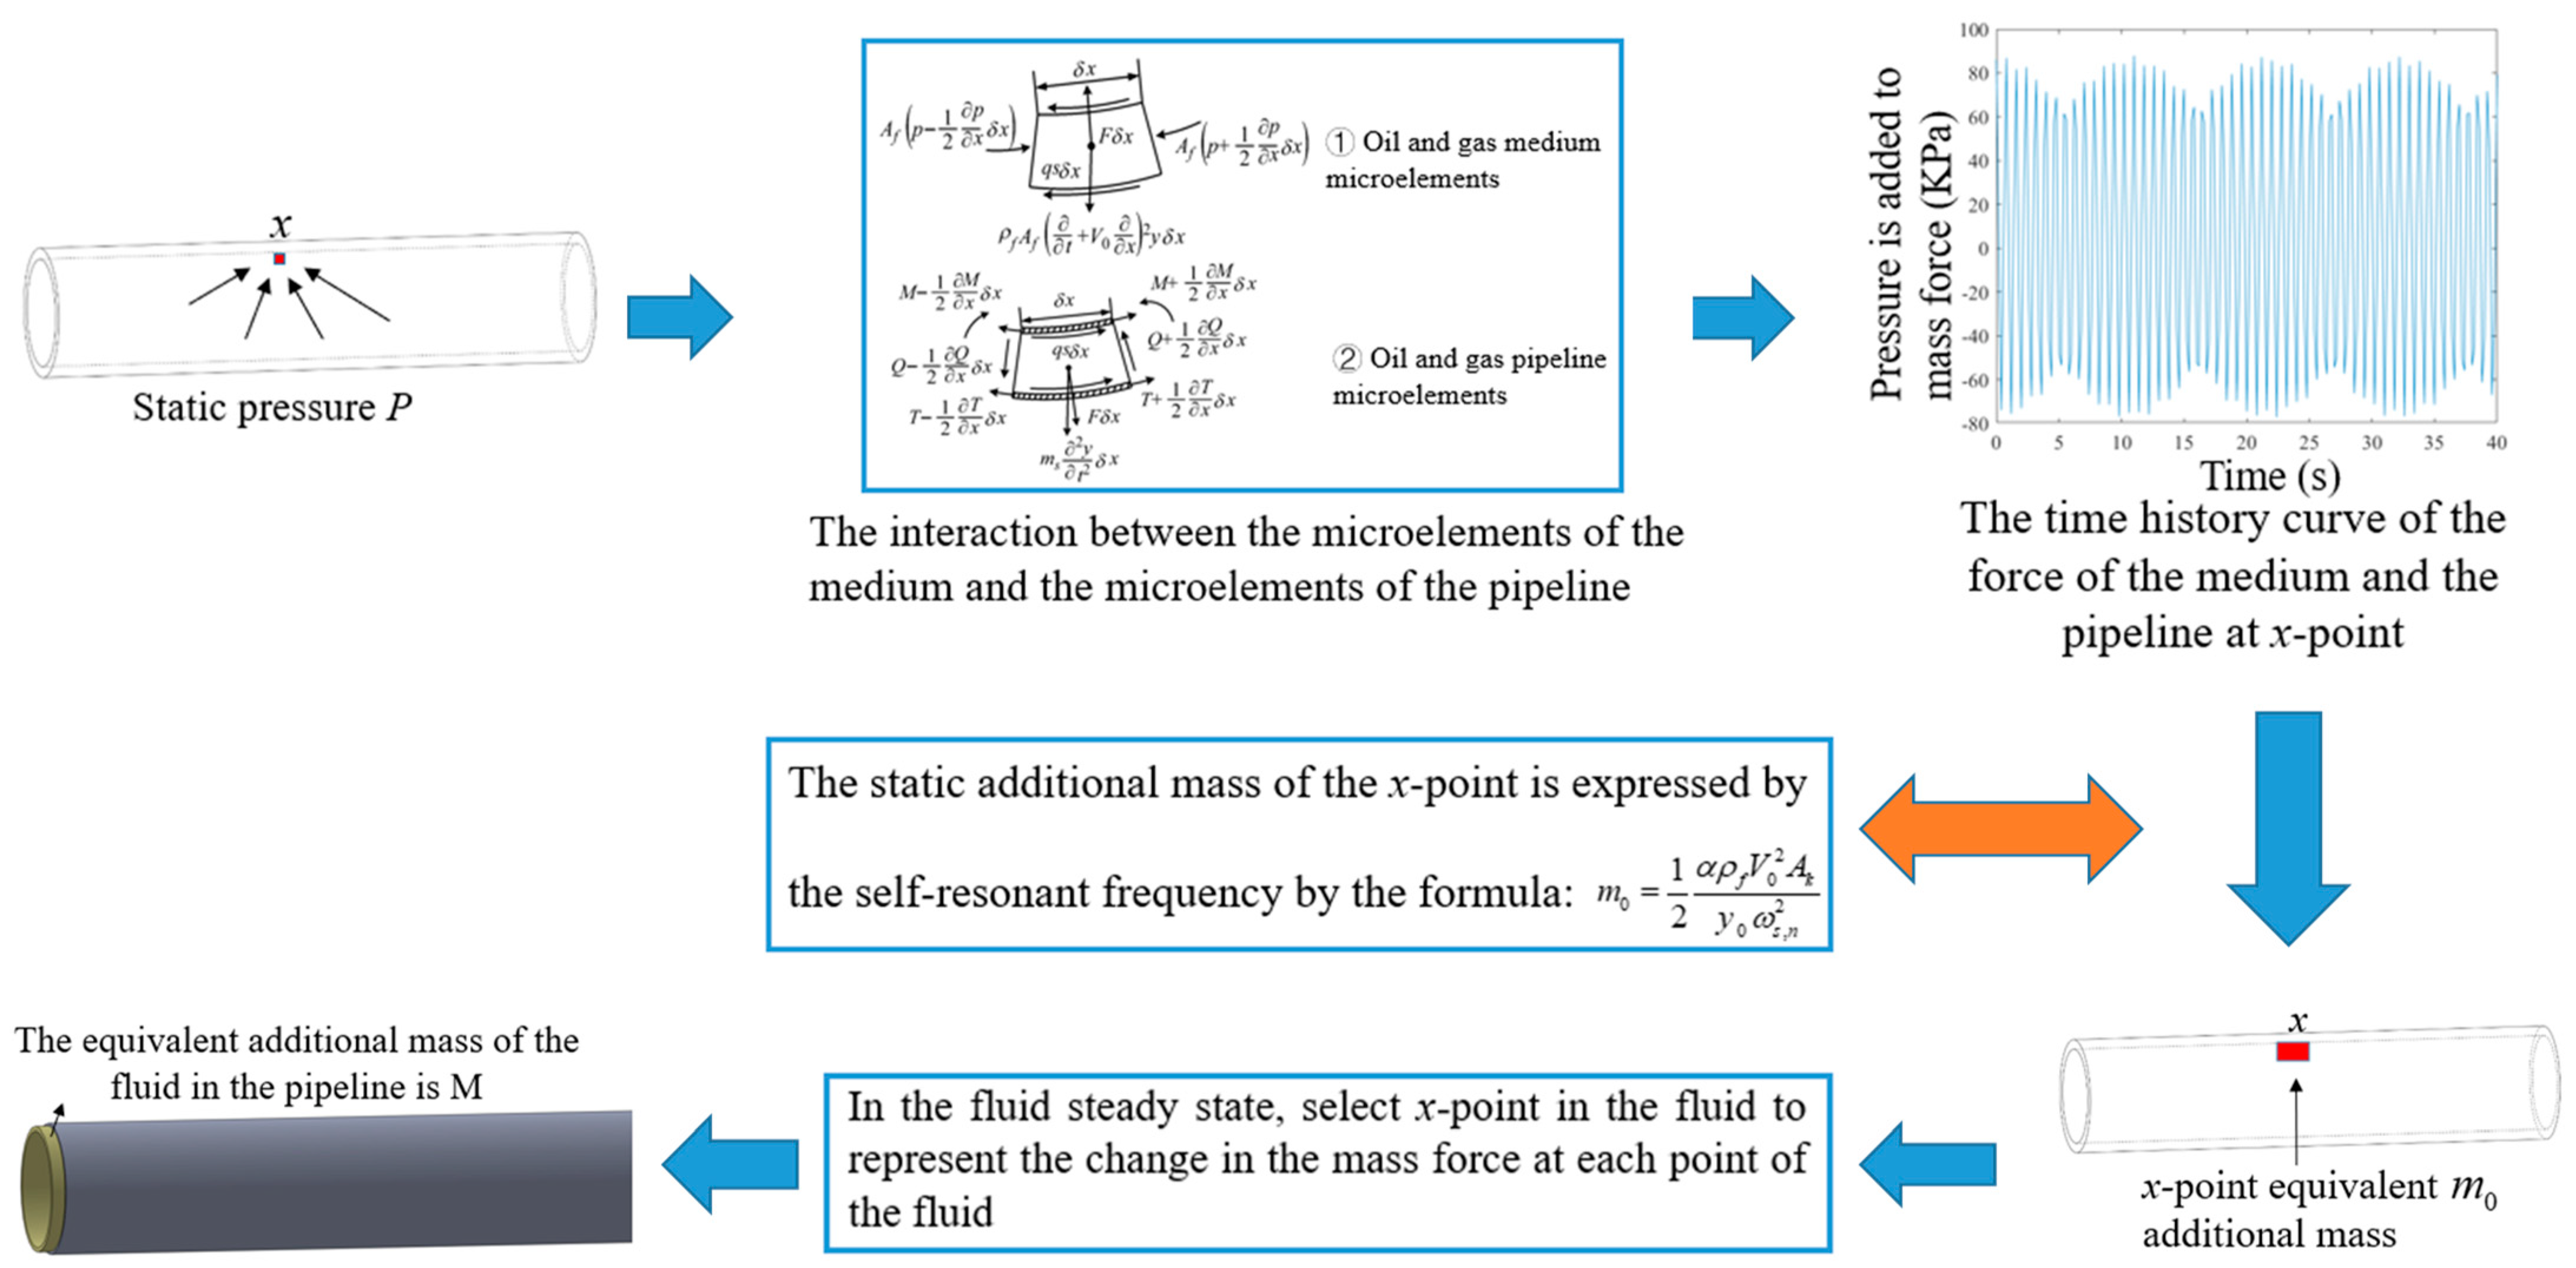
The basic idea of the theoretical analysis of the fluid–structure interaction problem between the oil and gas medium and the pipeline using the additional-mass method is shown in Figure 2.
The additional mass force parameters are used as matrices, and the structural dynamics equation, Equation (10), of the cable-stayed spanning oil and gas pipeline considering the action of oil and gas medium, as well as the seismic effects, is analyzed using the additional-mass method as follows:
( M + M 0 ) x ¨ + C x ˙ + K x = F t ,
where M denotes the mass matrix of the oil and gas transmission pipeline; M 0 denotes the pressure additional mass matrix of the oil and gas medium uniformly attached to the inner wall of the oil and gas transmission pipeline; C denotes the damping matrix of the oil and gas transmission pipeline; K represents the stiffness matrix of the oil and gas transmission pipeline; the displacement, velocity, and acceleration vectors of the oil and gas pipeline are represented by x , x ˙ and x ¨ , respectively; and F t represents the seismic load on the oil and gas pipeline cable-stayed spanning bridge structure system.

2.2.2. Calculating the Finite Element Model for the Seismic Response of Oil and Gas Transmission Pipelines Based on the Additional-Mass Method

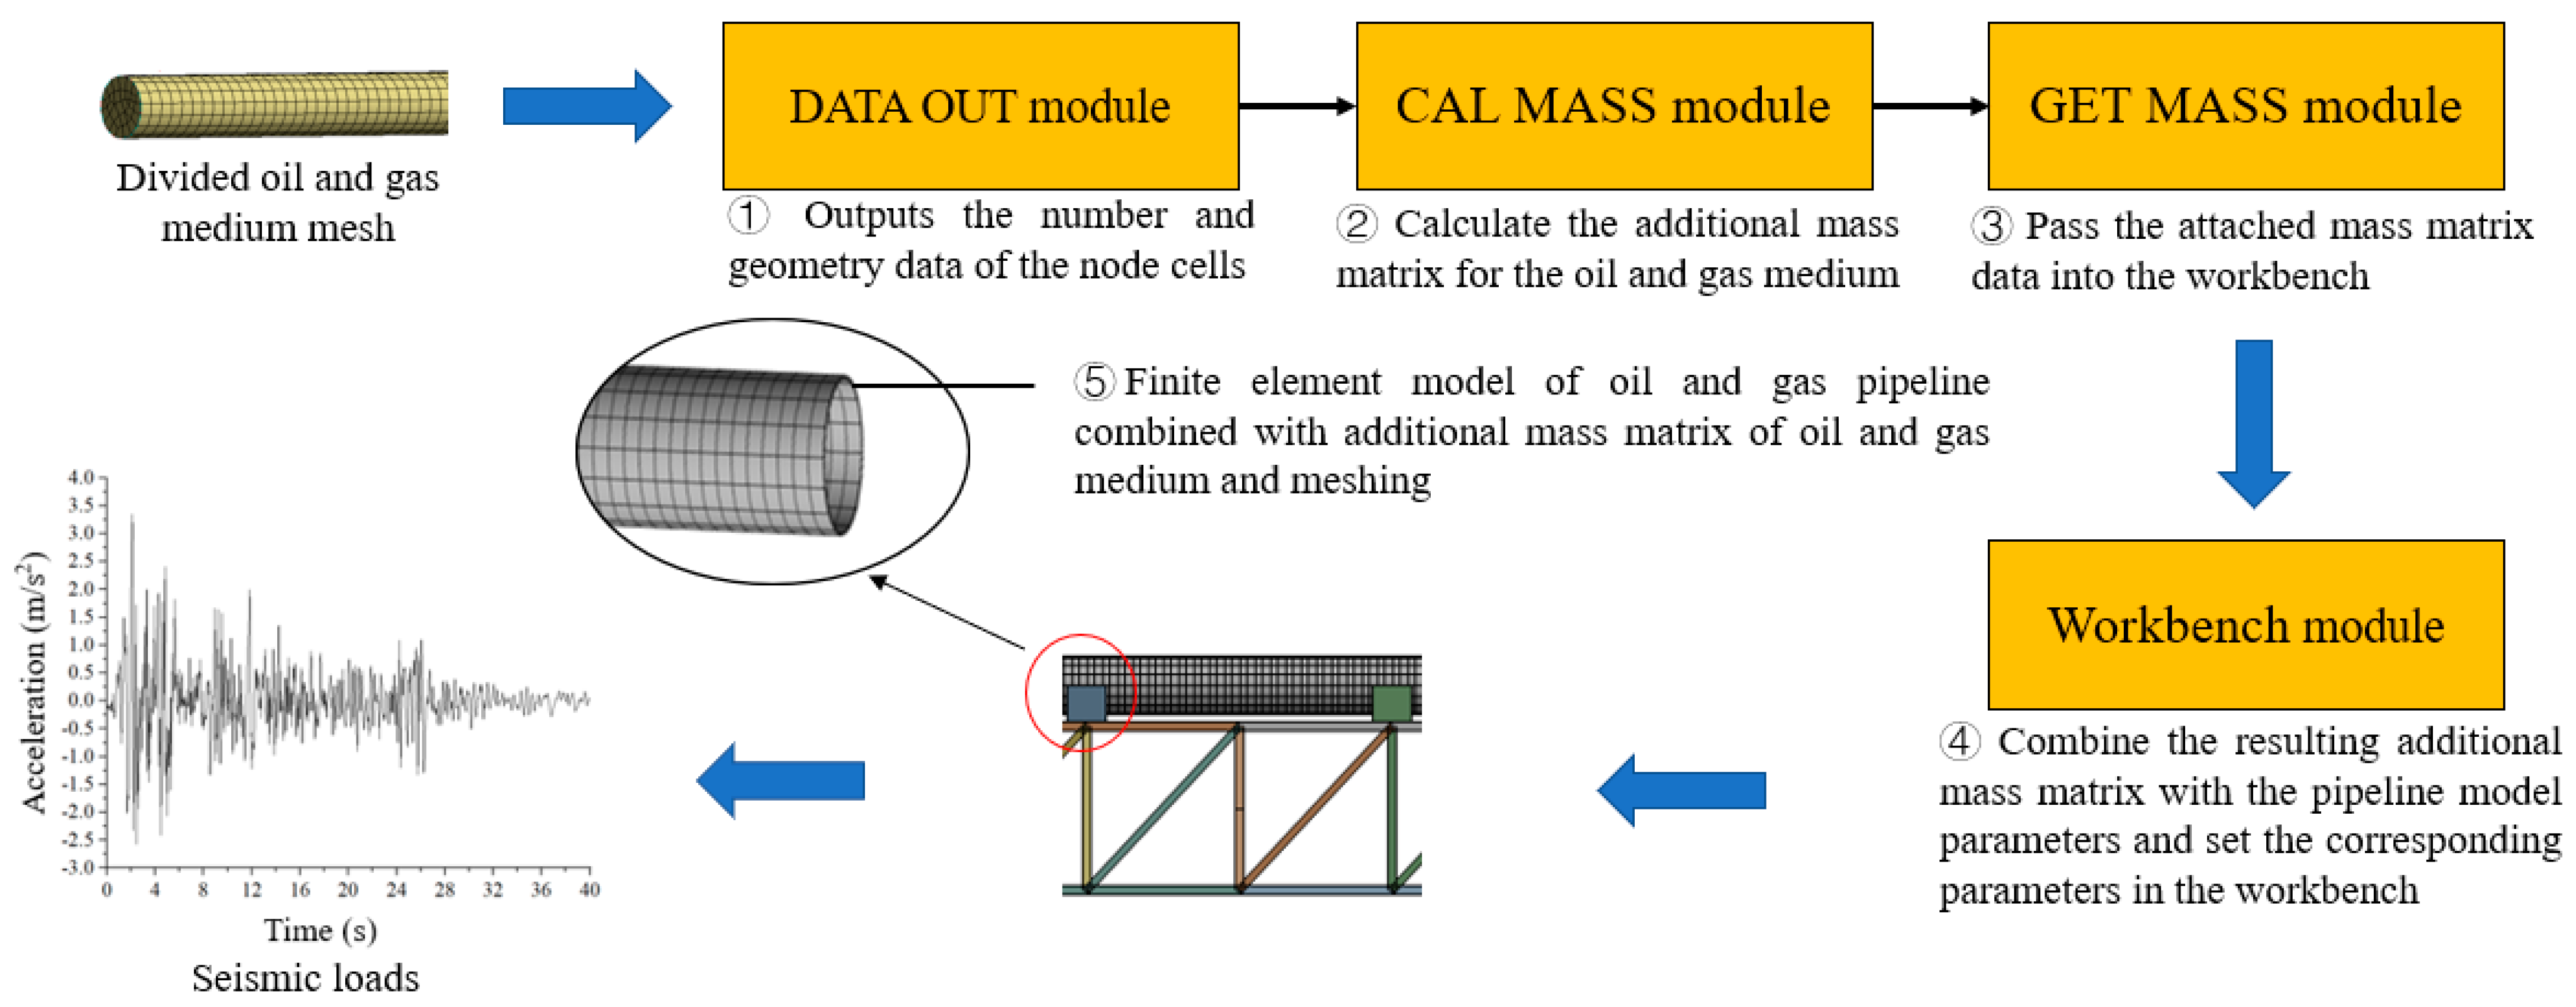
The finite element calculation simulation model of the cable-stayed spanning oil transmission pipeline was established using a WORKBENCH provided by ANSYS finite element analysis software (Figure 3), and Solid 186 units were used for the main_tower, bearings, and oil and gas transmission pipelines, Beam 188 units were used for truss beams, and Link 180 units were used for the cable. For the continuous-simple-support oil and gas transmission pipeline, fixed constraints were applied at both ends, fixed constraints were set between the pipeline and each bearing, and most ends of the pipeline were fixed constraints with the bridge platform. The pipeline, bearings, and truss beam were rigid connections. The conveying medium in the pipeline was treated as an incompressible fluid in ANSYS software, with a density of 889 kg/m3 and a flow rate of 2 m/s, using a hexahedral eight-node element, as well as the stiffness, damping, and mass matrix provided by the element, combined with the formula from Section 2.2.1. According to the data transmission form in the software, the automatic calculation and input of the mass matrix were realized [30]. First, three modules were established using the tools in the software, namely, DATA_OUT, CAL_MASS, and GET_MASS. The DATA_OUT module extracts the corresponding node number, geometry data, and element properties for the hexahedral eight-node cell. The additional mass matrix is calculated by entering the corresponding parameters of the oil and gas transmission pipeline mentioned above in the CAL_MASS module. The GET_MASS module can store the additional mass matrix obtained above in a certain data-saving form and then read the obtained additional mass matrix data of oil and gas medium pressure into the Workbench pipeline simulation model. In the engineering data module, the material parameters were set as follows: the wall thickness of the oil and gas transmission pipeline was 12.7 mm, the outer diameter was 711 mm, the elastic modulus was 2 × 10¹¹ Pa, the density was 7850 kg/m3, the Poisson’s ratio was 0.3, and the pipeline inlet and outlet were filled with fluid. In the modal module, the model was mesh-partitioned, and the primary process of the finite element model and modeling based on the additional-mass method was conducted as shown in Figure 3.
In this paper, only seismic loads were considered, and seismic excitation was applied at the bottom of the main tower in the transient module (transient structural).

2.3. Dynamics Theory and Simulation for the Seismic Response of Oil and Gas Transmission Pipeline with the Fluid–Solid Coupling Effect

2.3.1. Dynamics Theory for the Seismic Response of Oil and Gas Transmission Pipeline Based on the Fluid–Solid Coupling Effect

When considering the oil and gas pipeline in the normal transmission of oil and gas medium, as well as the collection of open and closed state oil and gas medium in the pipeline under the action of internal pressure at different speeds through the pipeline, the oil and gas medium was shown to induce random vibration of the oil and gas pipeline, which could disturb and change the flow state of oil and gas medium, according to a coupled dynamic effect. Taking the continuous, simply supported span type oil and gas transmission pipeline as an example, the structural dynamics analysis equation of the oil and gas medium–oil and gas pipeline structure considering the fluid–solid coupling effect is as follows:
M x ¨ + C x ˙ + K x = F ( t ) ,
where M is the overall mass matrix of the oil and gas pipeline structure containing the transport medium; C is the damping matrix of the oil and gas pipeline structure considering the damping effect of the transport medium; K is the stiffness matrix of the oil and gas pipeline structure, which can ignore the influence of the stiffness of the transport medium fluid; x ¨ is the acceleration vector of the oil and gas pipeline structure; x ˙ is the velocity vector of the oil and gas pipeline structure; x is the displacement vector of the oil and gas pipeline structure; and F ( t ) is the seismic load of the coupling effect between the fluid field of the conveyed medium and the pipeline considered.
The oil and gas medium is considered an incompressible ideal liquid; thus, the continuity equation of its fluid domain is as follows:
d i v V ¯ = 0 ,
where V ¯ denotes the velocity vector of the transported oil and gas medium and d i v represents the dispersion.
The equation of motion (N–S equation) for the transported oil and gas medium is as follows:
V ¯ t + ( V ¯ ) V ¯ = F ¯ 1 ρ ω p + 2 V ¯ ,
where denotes the gradient, 2 represents the Laplace operator, F ¯ denotes the mass force of the transport oil and gas medium acting on the structure of the oil and gas pipeline, ρ ω is the density of the oil and gas medium, p is the pressure in the pipeline, and V ¯ denotes the viscosity coefficient of the oil and gas medium flow.
The conditions of interaction between the oil and gas medium and the structure of the transport oil and gas pipeline are as follows:
V ¯ n ¯ s 1 = ( V ¯ U n + U ˙ n ) s 1 ,
where U ˙ n s 1 represents the normal motion velocity of the fluid–solid coupling contact surface of the oil and gas pipeline, U n s 1 represents the normal motion displacement of the fluid–solid coupling contact surface of the oil and gas pipeline, and n ¯ represents the normal direction.
From Equations (11)–(14), it can be seen that the solution of the structural dynamics equations of the oil and gas pipeline considering the transport of oil and gas medium requires the determination of the effect of fluid–solid coupling on the fluid–solid coupling contact surface of the oil and gas pipeline.
The oil and gas medium is considered a continuous, incompressible, ideal liquid. The kinetic equations of the oil and gas transport medium can be established from Equations (13) and (14) as follows:
Ω N · N T d Ω p + ρ ω s 1 N N s T d s 1 Λ U ¨ n s 1 + q 0 = 0 ,
where Ω is the volume of the transport oil and gas medium, N represents the shape function vector matrix, N T represents the transpose matrix of the shape function vector matrix, p represents the pressure in the pipeline, N s T represents the transpose matrix of the insertion function vector of the oil and gas pipeline structure, s 1 represents the flow–solid coupling contact surface of the oil and gas pipeline, Λ is the coordinate transformation matrix, U ¨ n s 1 represents the normal motion acceleration of the flow–solid coupling contact surface of the oil and gas pipeline, Λ U ¨ n s 1 represents the normal acceleration of the nodes of the flow–solid coupling contact surface of the oil and gas pipeline, and q 0 represents the input excitation of the flow–solid coupling contact surface of the oil and gas pipeline.
When the oil and gas pipeline is subjected to the dynamic effect generated by the transported oil and gas medium, its kinetic equation can be expressed as:
M s x ¨ + C s x ˙ + K s x s 1 N N s T d s 1 Λ T p + f 0 = 0 ,
where M s , C s , and K s represent the mass matrix, damping matrix, and stiffness matrix of the transport oil and gas pipeline, respectively, and f 0 represents the external excitation vector of the transport oil and gas pipeline, which corresponds to q 0 in Equation (15), confirming that Equations (15) and (16) are coupled.
The joint vertical Equations (15) and (16) can be solved for the oil and gas pipeline oil and gas medium impact at any moment of the dynamic effect on the pipeline, revealing that the fluid field of the transmission medium in Equation (11) acts on the oil and gas transmission pipeline flow–solid coupling effect. This paper ignores the influence of the change in the state of motion of the oil and gas medium in the oil and gas pipeline caused by seismic effects on the calculation of the fluid–solid coupling effect.
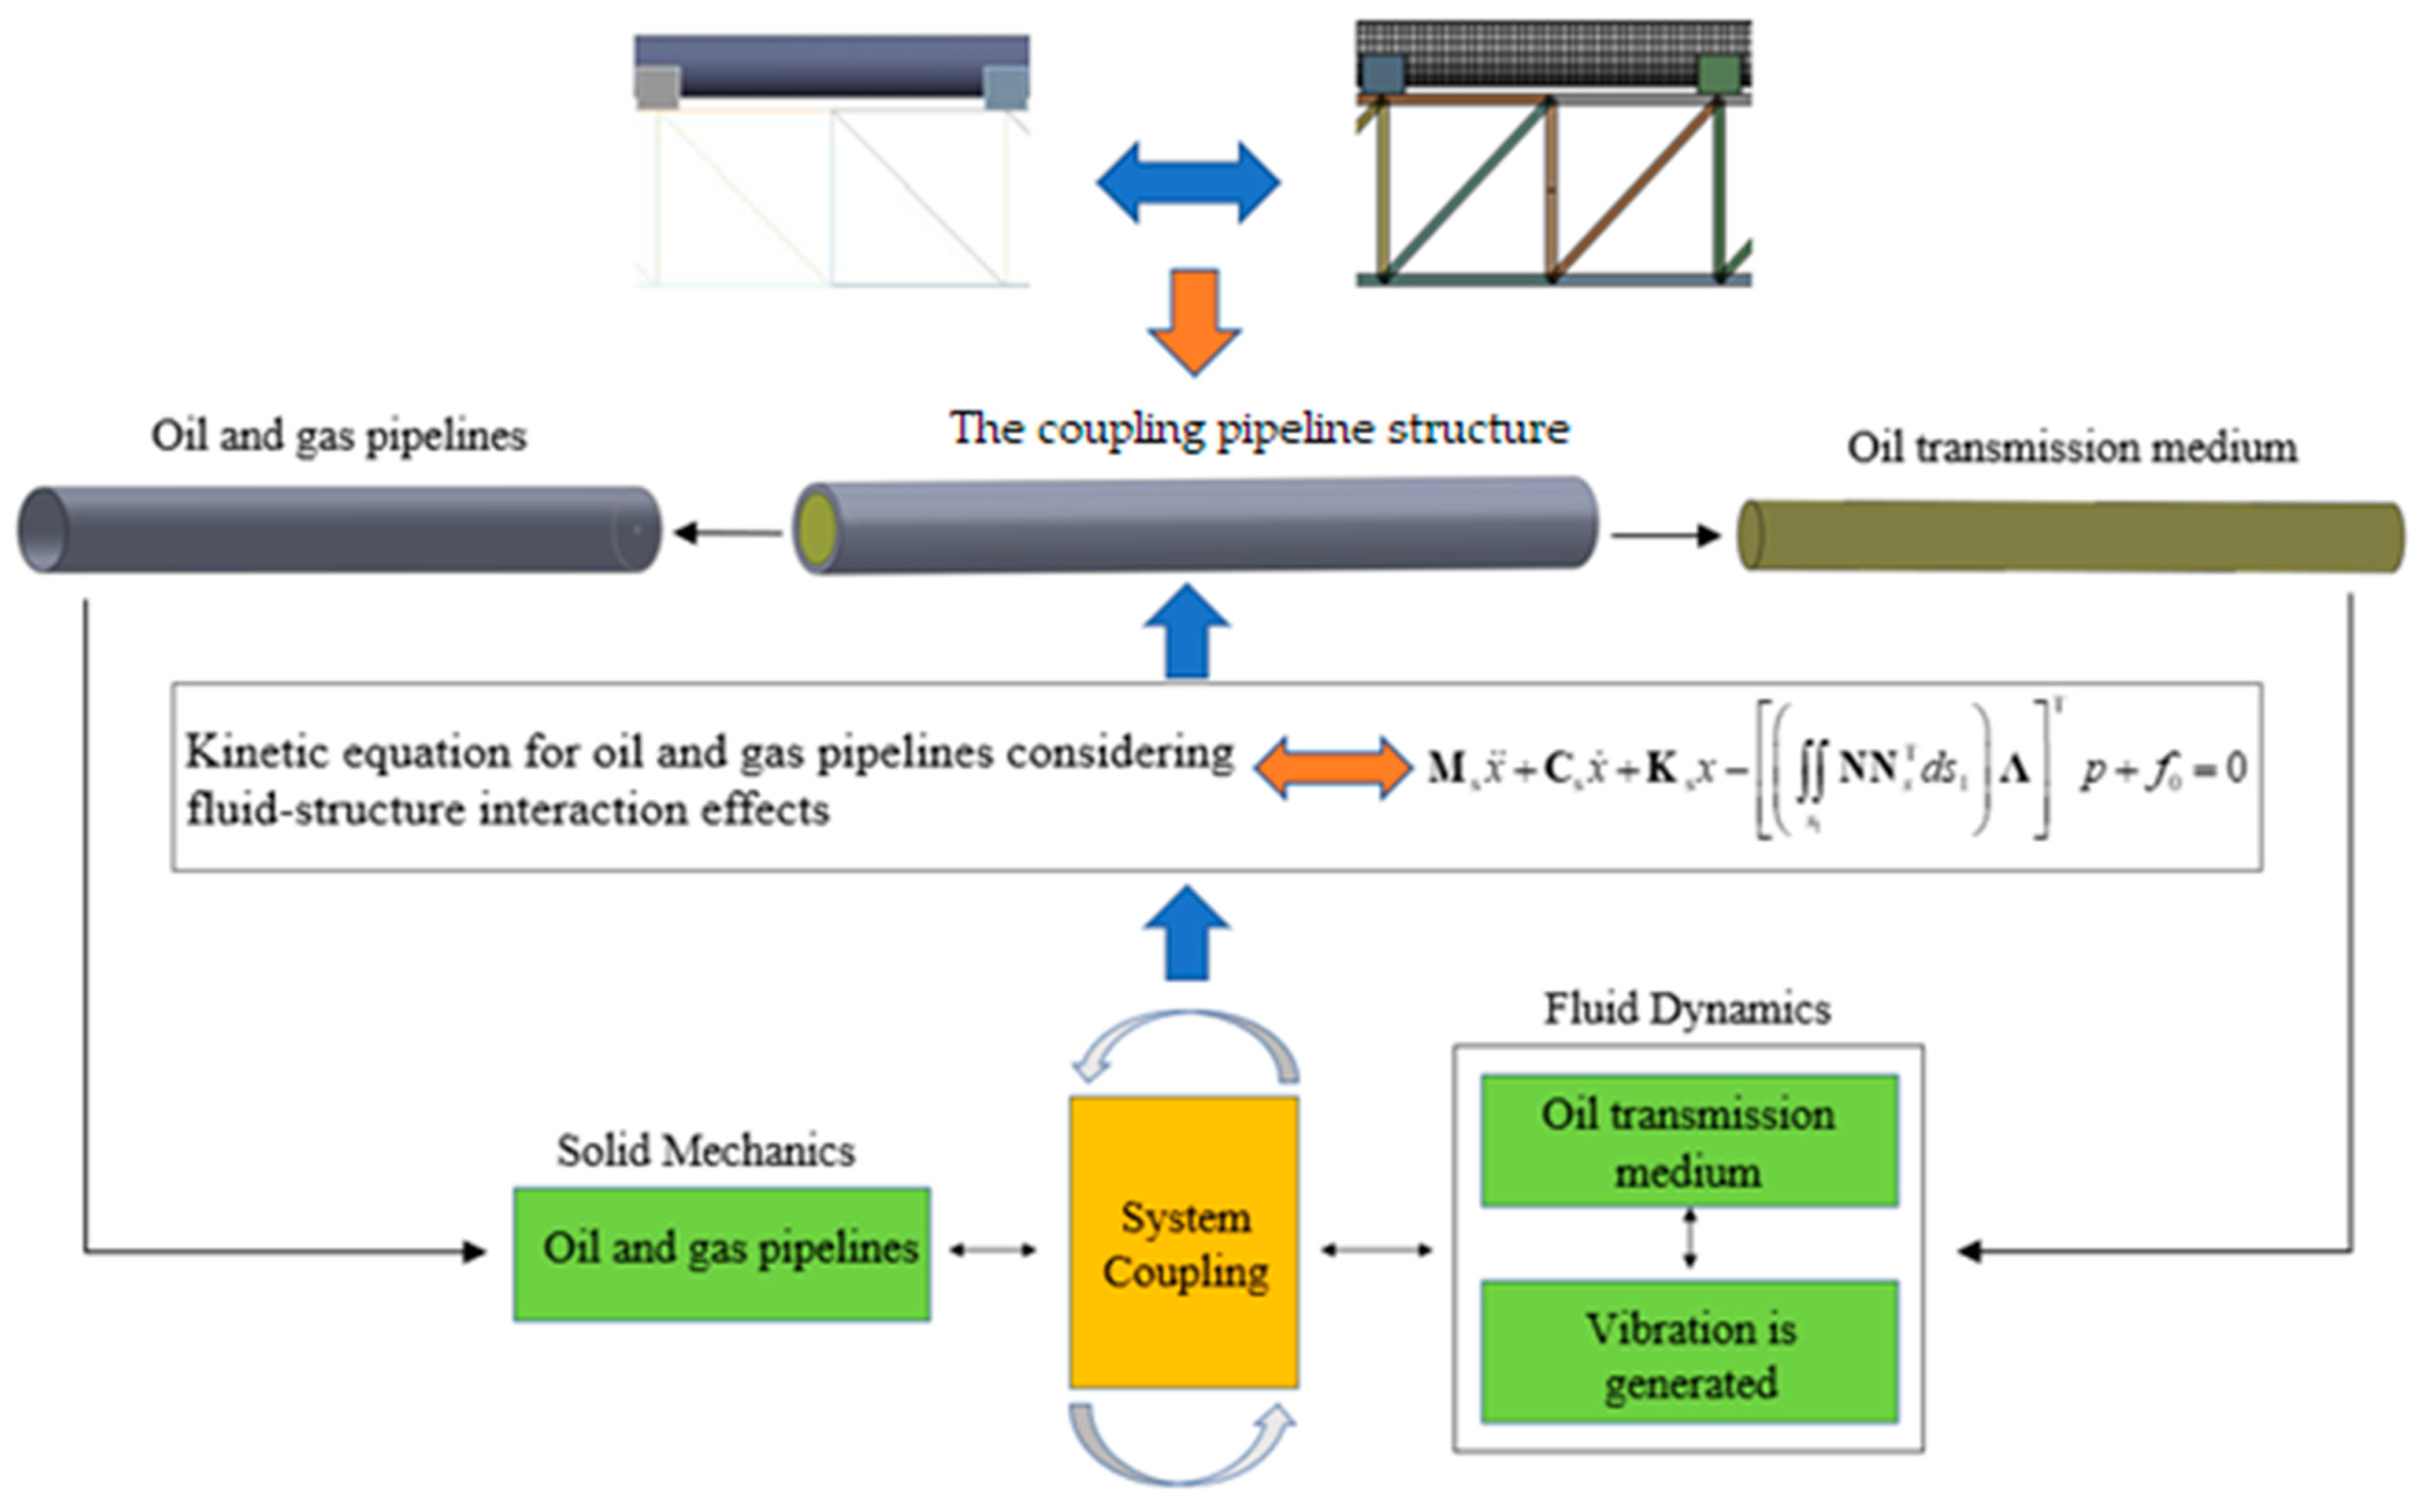
Figure 4 shows the schematic diagram of the fluid–solid coupling of the transport oil and gas pipeline considering the viscoelastic effect of the medium.

2.3.2. Calculating Finite Element Model for the Seismic Response of Oil and Gas Transmission Pipelines Based on Fluid–Solid Coupling Effect

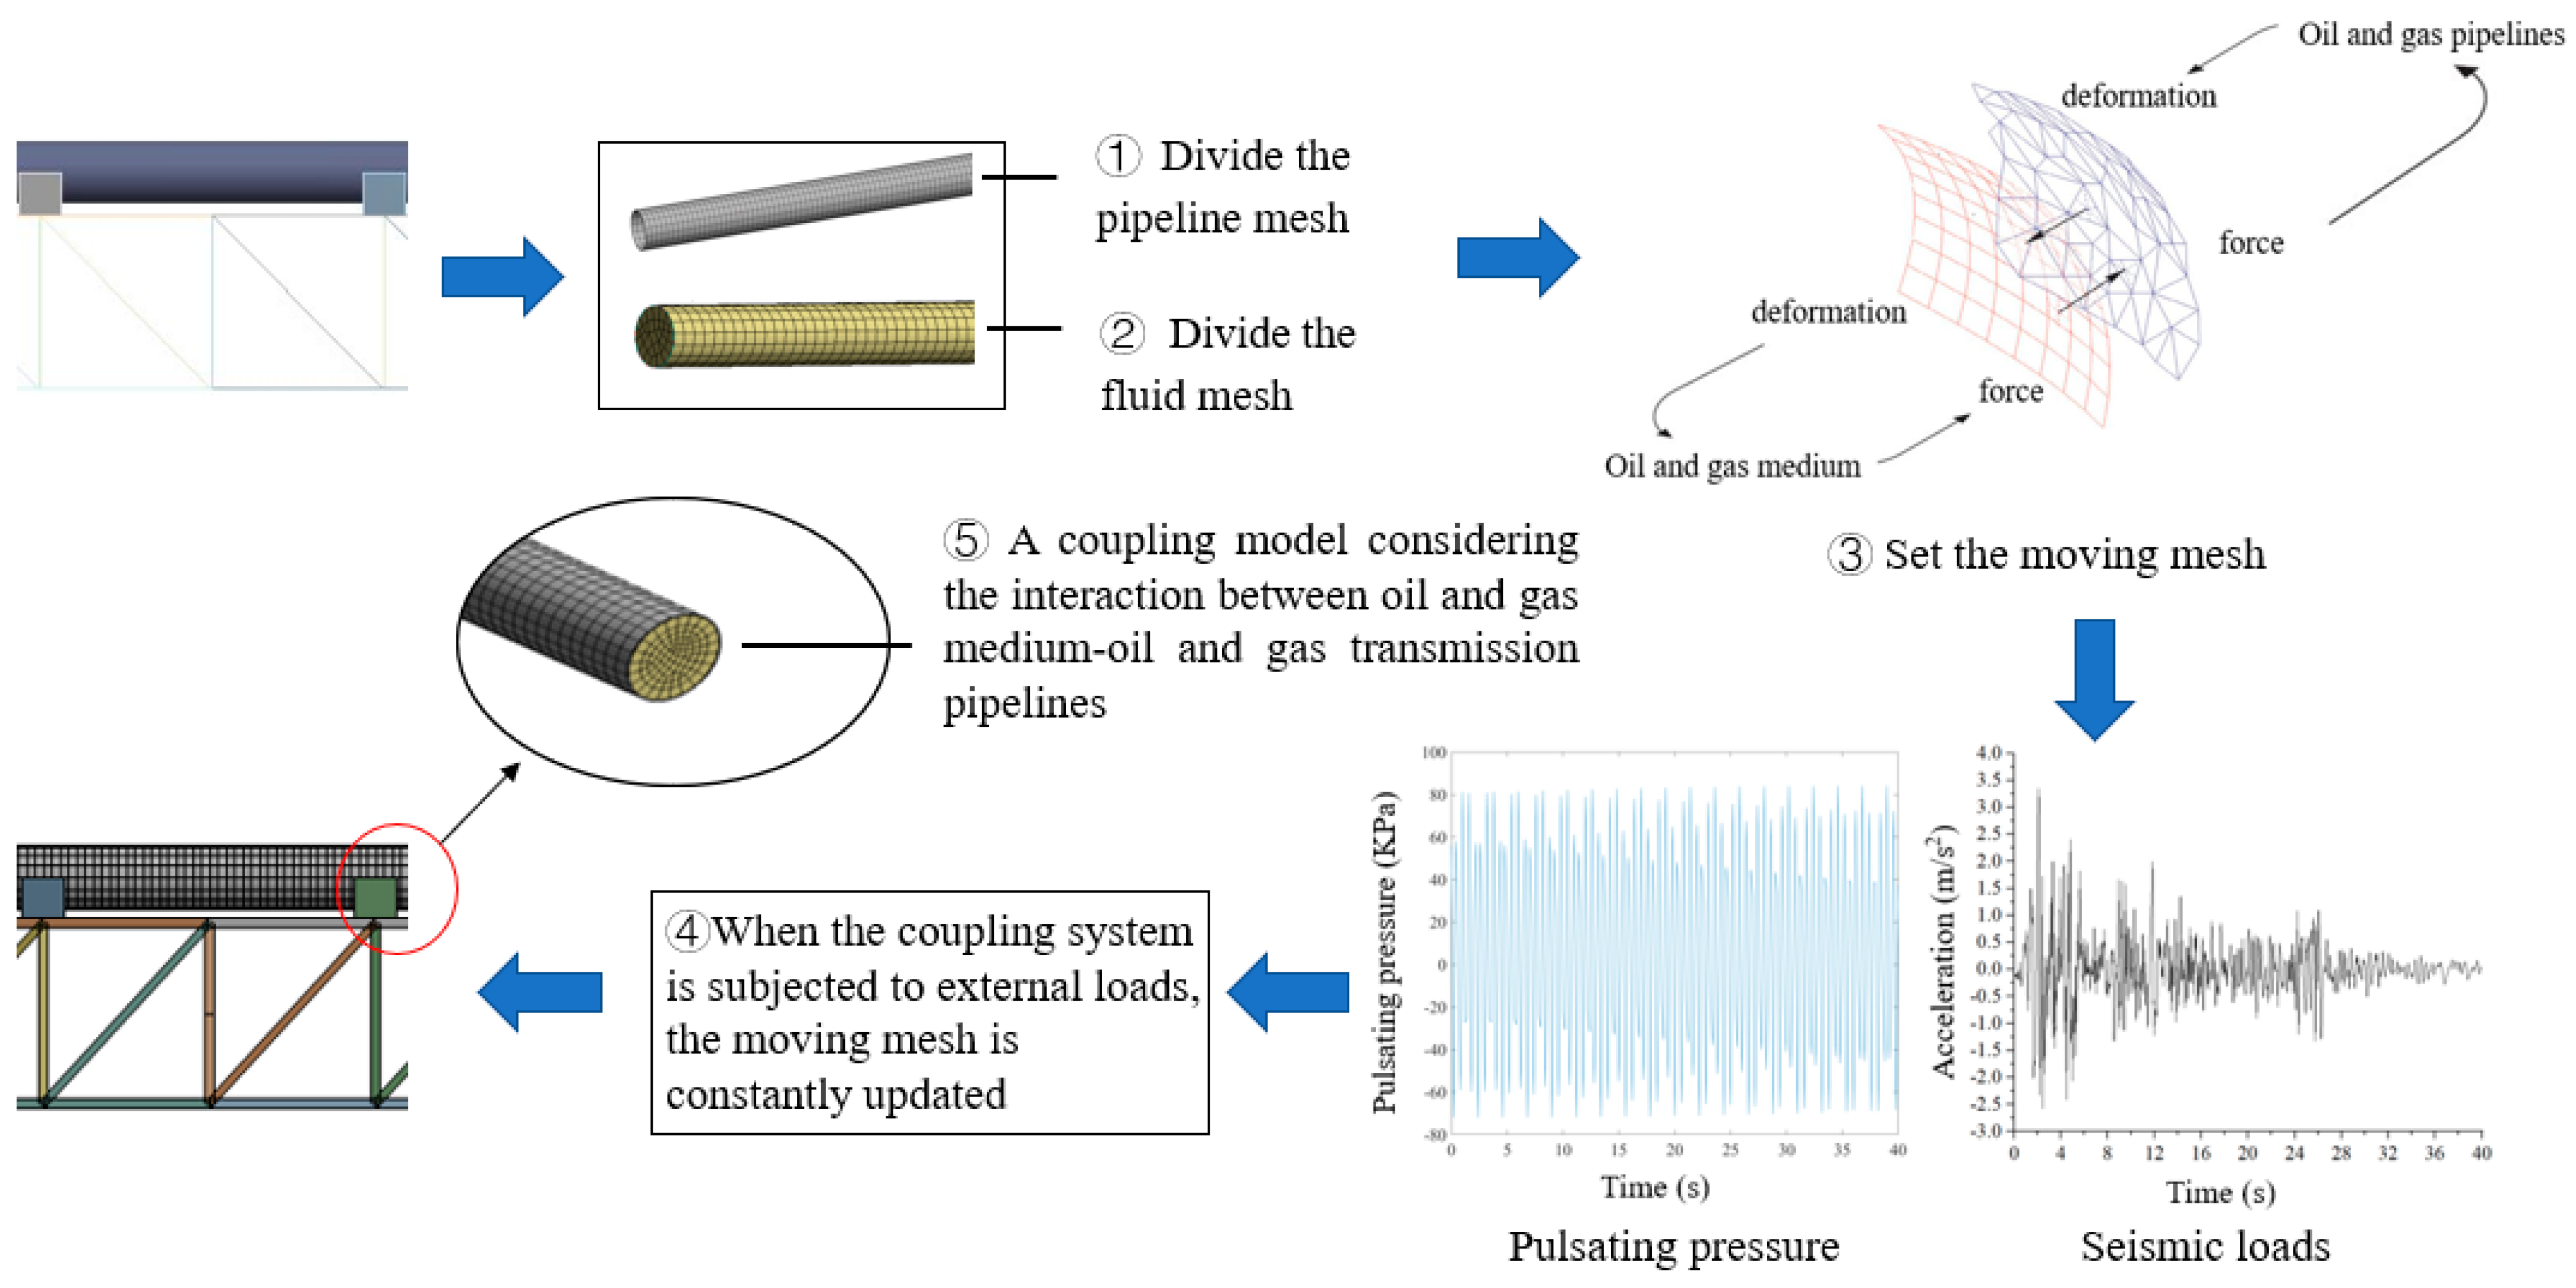
According to the basic theory of fluid–solid coupling in Section 2.3.1, a finite element model is established for seismic response calculation of the fluid field–solid field coupling of the cable-stayed spanning-type oil and gas pipeline. The fluid–solid coupling surface includes the inner wall surface of the oil and gas transmission pipeline and the outer wall surface of the pipeline’s oil and gas transmission medium, where the oil and gas transmission pipeline vibrates under the excitation of seismic load, and the oil and gas transmission medium grid expands or contracts as a function of the change in the pipeline. When the data of the solid phase are transferred to the coupling surface of the fluid phase, the fluid grid should be adjusted accordingly. In the software, the N–S equations in Euler coordinates are mapped to an arbitrary Lagrangian–Eulerian coordinate system using Euler cells for the fluid region and Lagrange cells in the solid region, converting both parts of the finite element analysis into ALE (arbitrary Lagrange–Euler) [31] coordinates.
When the oil and gas transmission pipelines vibrate under the action of an earthquake, the fluid domain mesh shrinks and expands under the drive of the solid domain mesh; therefore, to ensure that the solid domain coupling surface data transmission to the fluid domain coupling surface makes the corresponding adjustments, the mesh of the coupling surface must be updated in real time. In the ALE (arbitrary Lagrange–Euler) coordinate system, in order to achieve a real-time update of the mesh, the corresponding mesh node velocity or displacement vector must be assigned at each calculation timestep, which requires that the updated mesh be kept as regular as possible to avoid the deformation of mesh elements, thus reducing the error of the calculation result. In order to achieve the accuracy of the calculation results, it is very important to set the mesh sensitivity, which can be updated as follows:
p n e w = p o l d α f ( p ) d f d p T / d f d p T 2 ,
where f represents the mesh node variable for the structure domain, p represents a mesh node variable on a coupling surface, p n e w represents the updated fluid domain mesh node variable, p o l d represents a fluid domain mesh variable before the update, and α indicates a relaxation factor.
Firstly, a geometric model of the cable-stayed spanning oil and gas transmission pipeline was established and imported into the transient structural module, setting the material properties and constraints as presented in Section 2.2.2. A multizone-type, hexahedral eight-node cell division was used to mesh the oil and gas pipeline with high smoothness and refinement of the span center angle with a minimum grid of 1000 mm, and a total of 77,582 nodes and 144,214 cells were divided. For the oil- and gas-conveying medium part in the pipeline, the standard k ε turbulence model was set, the heat exchange between the oil- and gas-conveying medium and the inner wall of the pipeline during the transportation process in the pipeline were ignored, and the inlet end face and outlet end face of the oil and gas conveying medium were defined, level with the end faces of both ends of the pipeline; furthermore, the free surface was not constrained, the fluid velocity of the oil- and gas-conveying medium was set to 2 m/s, and the direction was perpendicular to the boundary. For the fluid–solid coupling surface, the fluid was set to not slip when flowing through the inner wall of the pipeline, the roughness constant of the coupling surface was set to 0.5, the fluid domain was meshed using tetrahedral cells, and the corresponding elastic-smoothing method and local mesh reconstruction method were set in the software to solve the dynamic mesh problem, setting the yield strength coefficient of the spring to 0.5 and the Laplace node relaxation coefficient to 0.5. The maximum bias of the cell and the surface in the mesh reconstruction were 0.4 and 0.6, respectively, and the mesh size re-division interval was set to 10. A total of 156,880 nodes and 125,440 cells were divided, and the minimum length was 500 mm. The finite element model for the seismic response calculation of the oil and gas pipeline considering the fluid–solid coupling effect is shown in Figure 5.
For the continuous, simply supported, span-type oil- and gas-transport pipeline, a fixed restraint is applied at both ends, and the fixed restraint is set between the pipeline and each support, for the oil and gas transmission medium part of the pipe. It is set as a standard k ε turbulence model, the heat exchange between the oil and gas transmission medium and the inner wall of the tube during the transport process is ignored, the inlet end face and the outlet end face of the oil and gas transmission medium are defined to be flush with the two end faces of the pipe, it is set as a free unconstrained surface, the fluid velocity of the oil and gas transmission medium is set to 2 m/s, and the direction is set to be perpendicular to the boundary. For the fluid–solid coupling surface, the fluid is set in the flow through the inner wall surface of the pipe such that it will not slip with it, and the coupling surface roughness constant is taken to be 0.5.

3. Analysis of Simulation Calculation Results

3.1. Cloud Atlas for the Seismic Response of the Model of Oil- and Gas-Transmission Pipeline

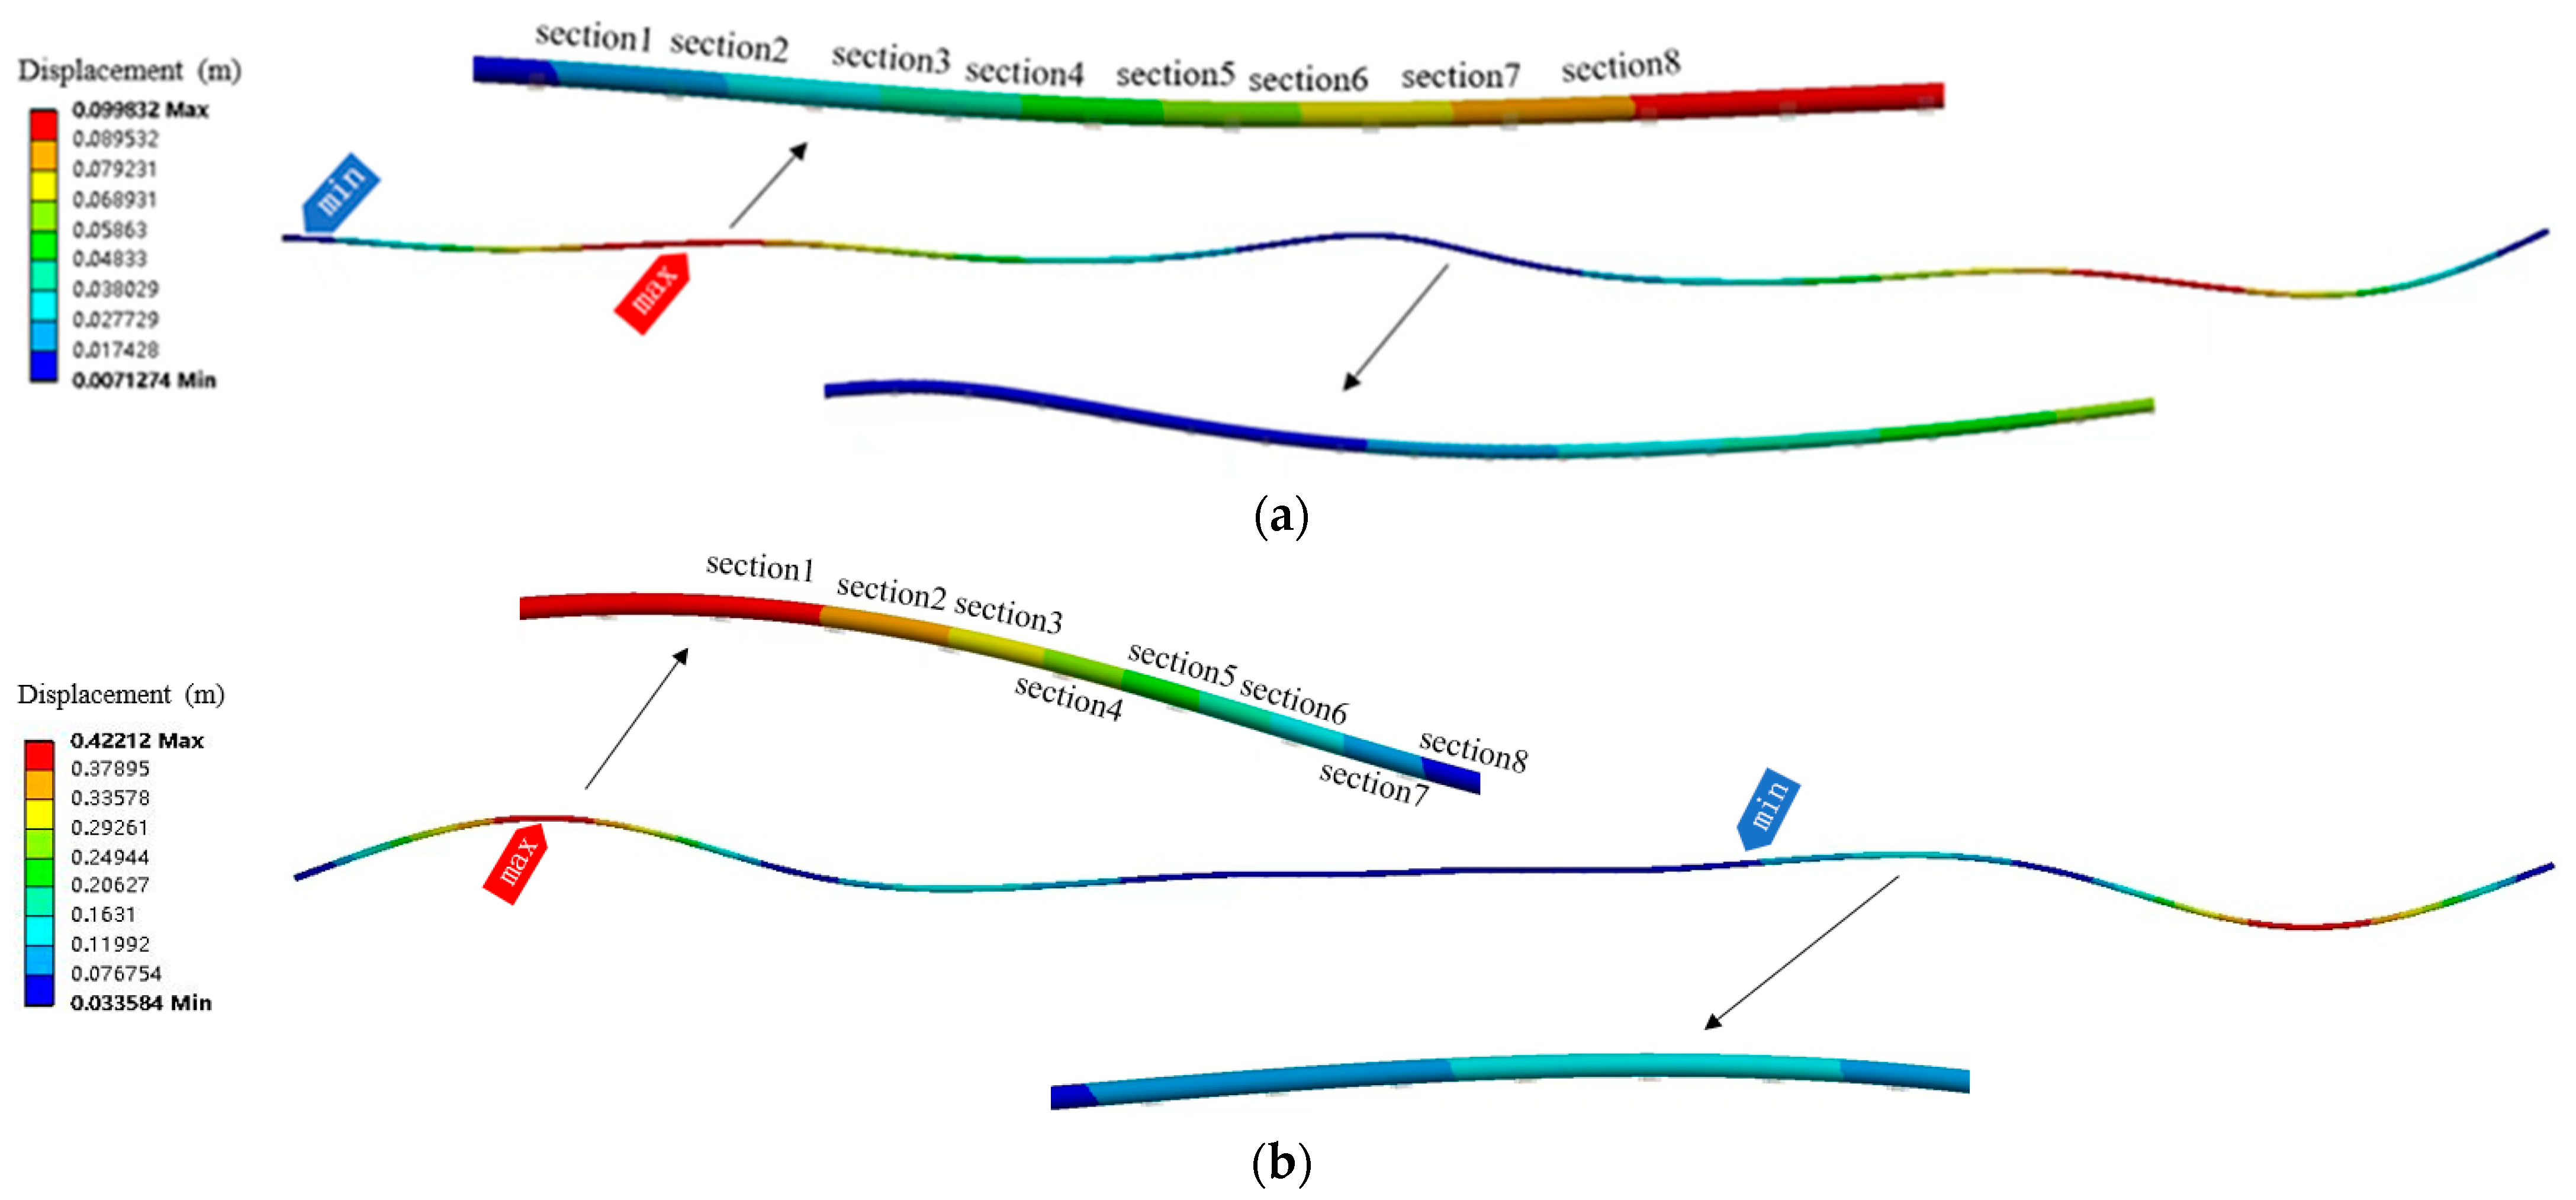
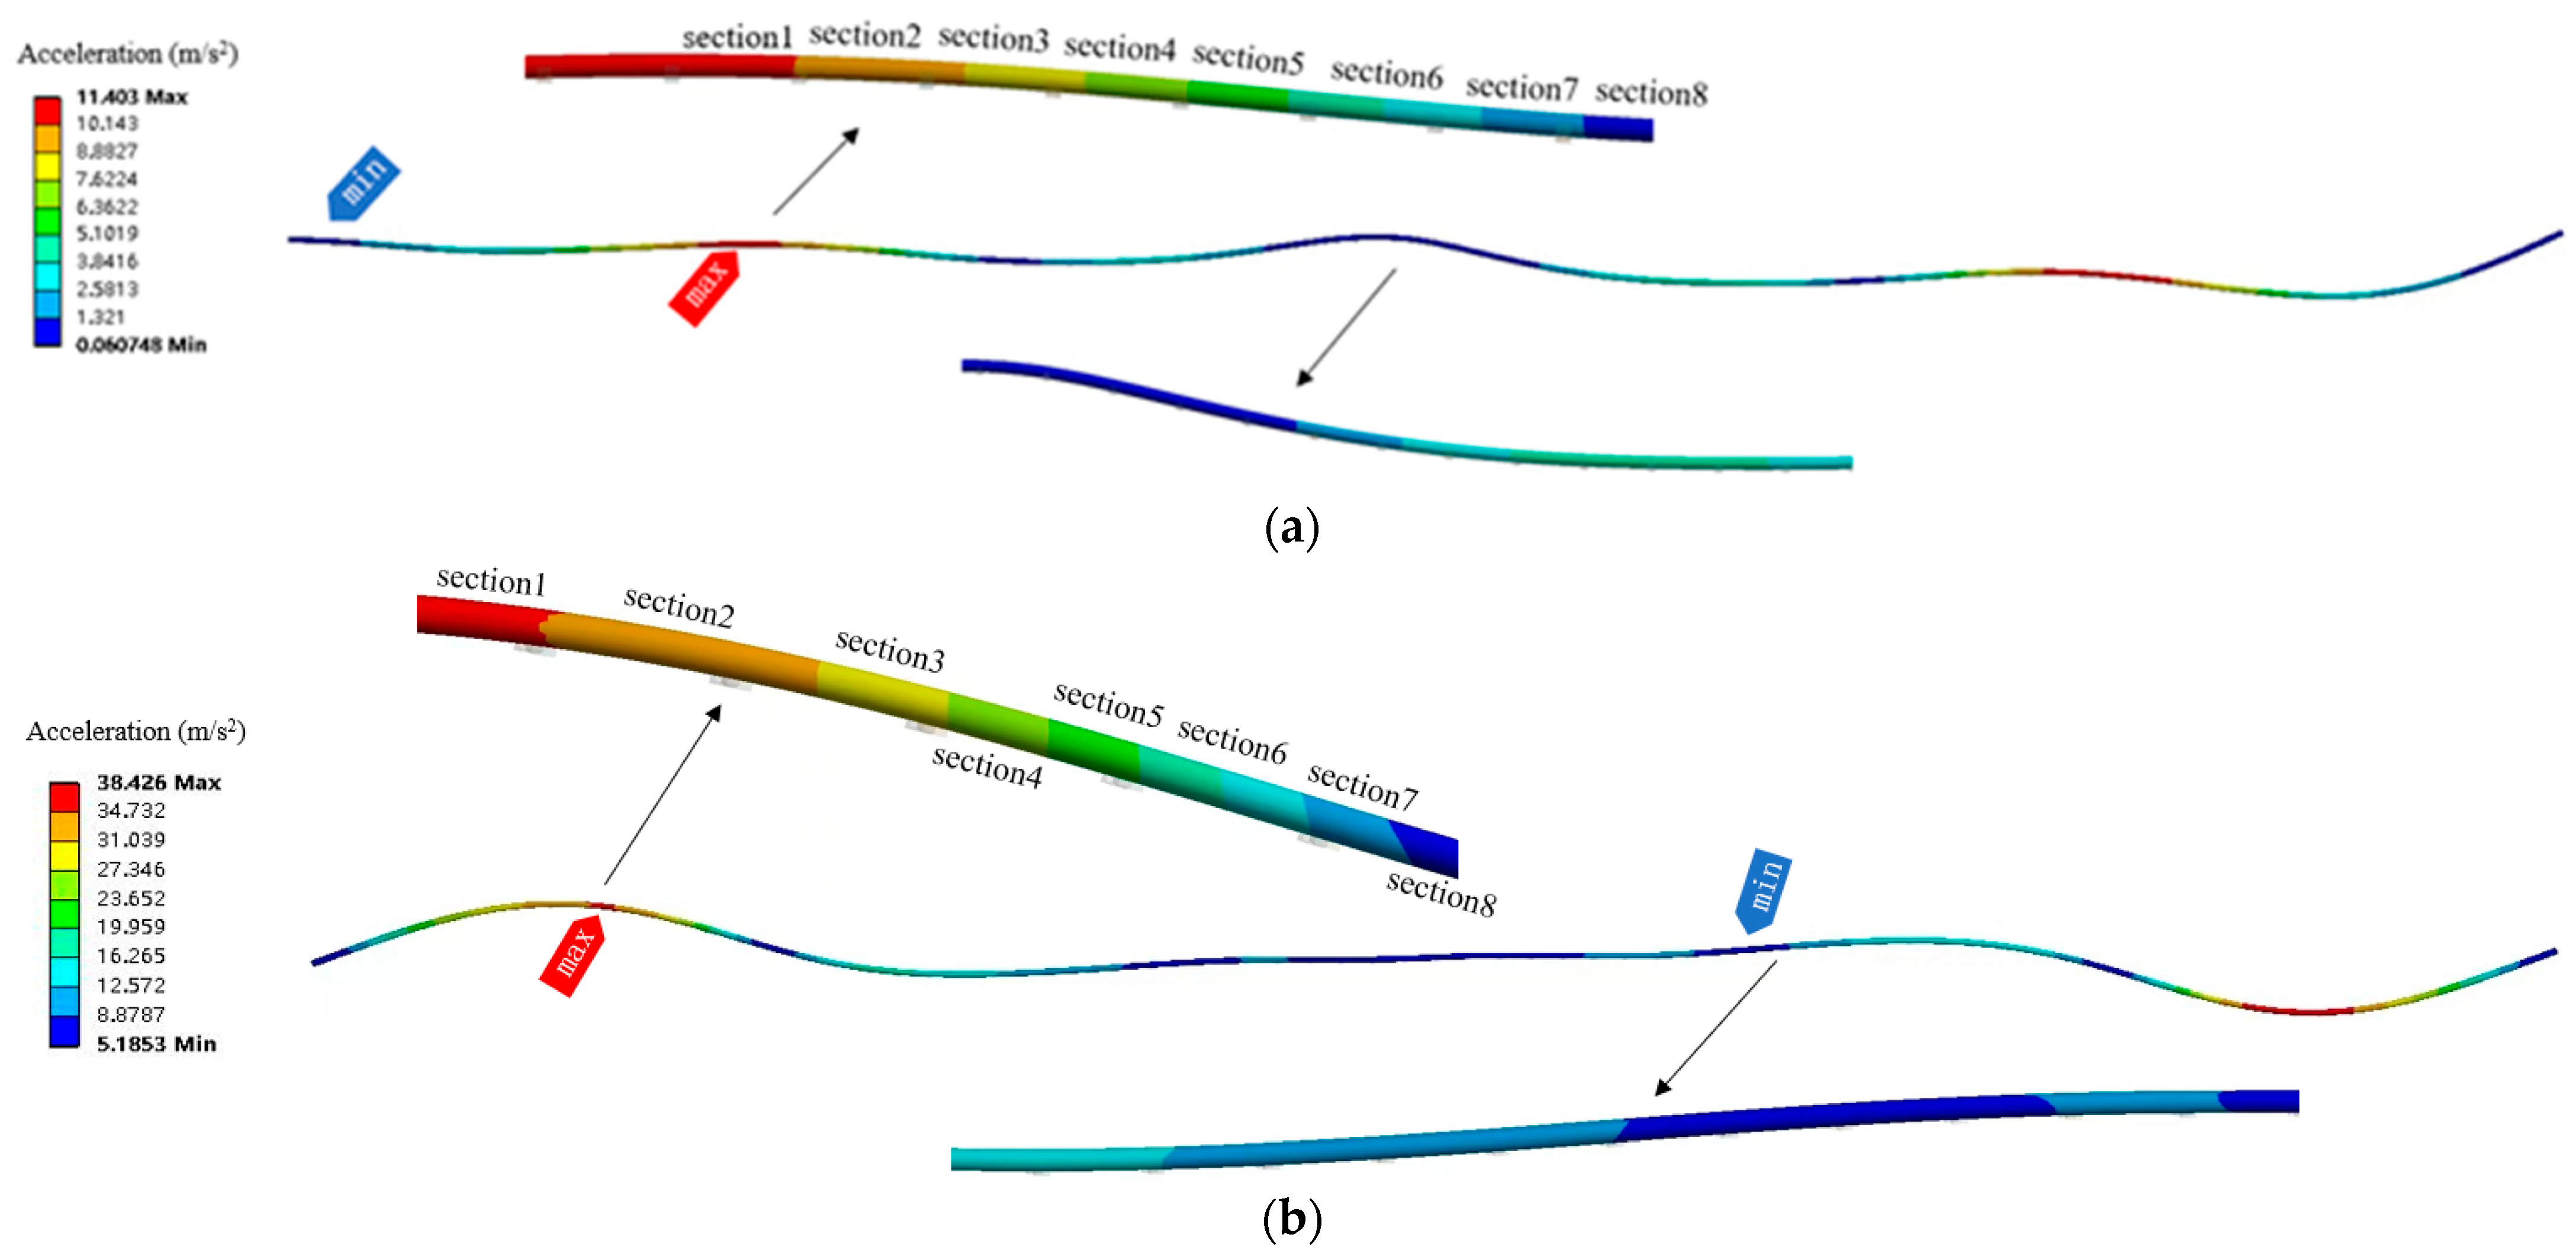
The displacement and the acceleration response cloud atlases of the slant-span oil and gas pipeline considering the fluid–solid coupling effect and seismic effect are shown in Figure 6 and Figure 7, respectively.
It can be seen from Figure 6 and Figure 7 that the seismic response of the cable-stayed spanning pipeline model based on the two methods considering the fluid–solid coupling effect was antisymmetrically distributed with the main tower as the center as a whole. The displacement and acceleration responses of the pipeline using the additional-mass method and the fluid–solid coupling effect were roughly the same, and the seismic response of the pipeline was the smallest near the end of the pipeline and the position of the main tower of the pipeline, while the seismic displacement and acceleration responses reached the maximum at the position of nearly one-fifth of the bridge platform. Teng [25], according to an analysis of the pipe-mode shape, found a similar position of the maximum deformation. The maximum seismic displacement and acceleration responses of the oil pipeline based on the fluid–solid coupling effect were smaller than with the additional-mass method; the maximum displacement response of the oil and gas pipeline obtained using the fluid–solid coupling method was 0.099 m, and the maximum acceleration was 11.403 m/s2, similar to the seismic displacement response of pipelines considering the fluid–structure interaction effect in [25]. In comparison, the maximum displacement response obtained using the additional-mass method was 0.422 m, and the maximum acceleration was 38.426 m/s2. At the location of the main tower of the pipeline model, vertical deformation occurred in the seismic displacement and the acceleration response of the pipeline with the fluid–solid coupling effect; in contrast, the pipeline model with the additional-mass method was relatively smooth. It can be seen that the seismic response of an oil pipeline considering the fluid–structure coupling was more complicated, as well as the seismic response of an oil pipeline considering the viscoelastic effect of the medium; hence, a more comprehensive theoretical analysis and calculation method was needed for the fluid–structure coupling problem of cable-stayed spanning oil and gas pipeline.

3.2. Analysis of the Seismic Response of the Model of Oil and Gas Transmission Pipelines

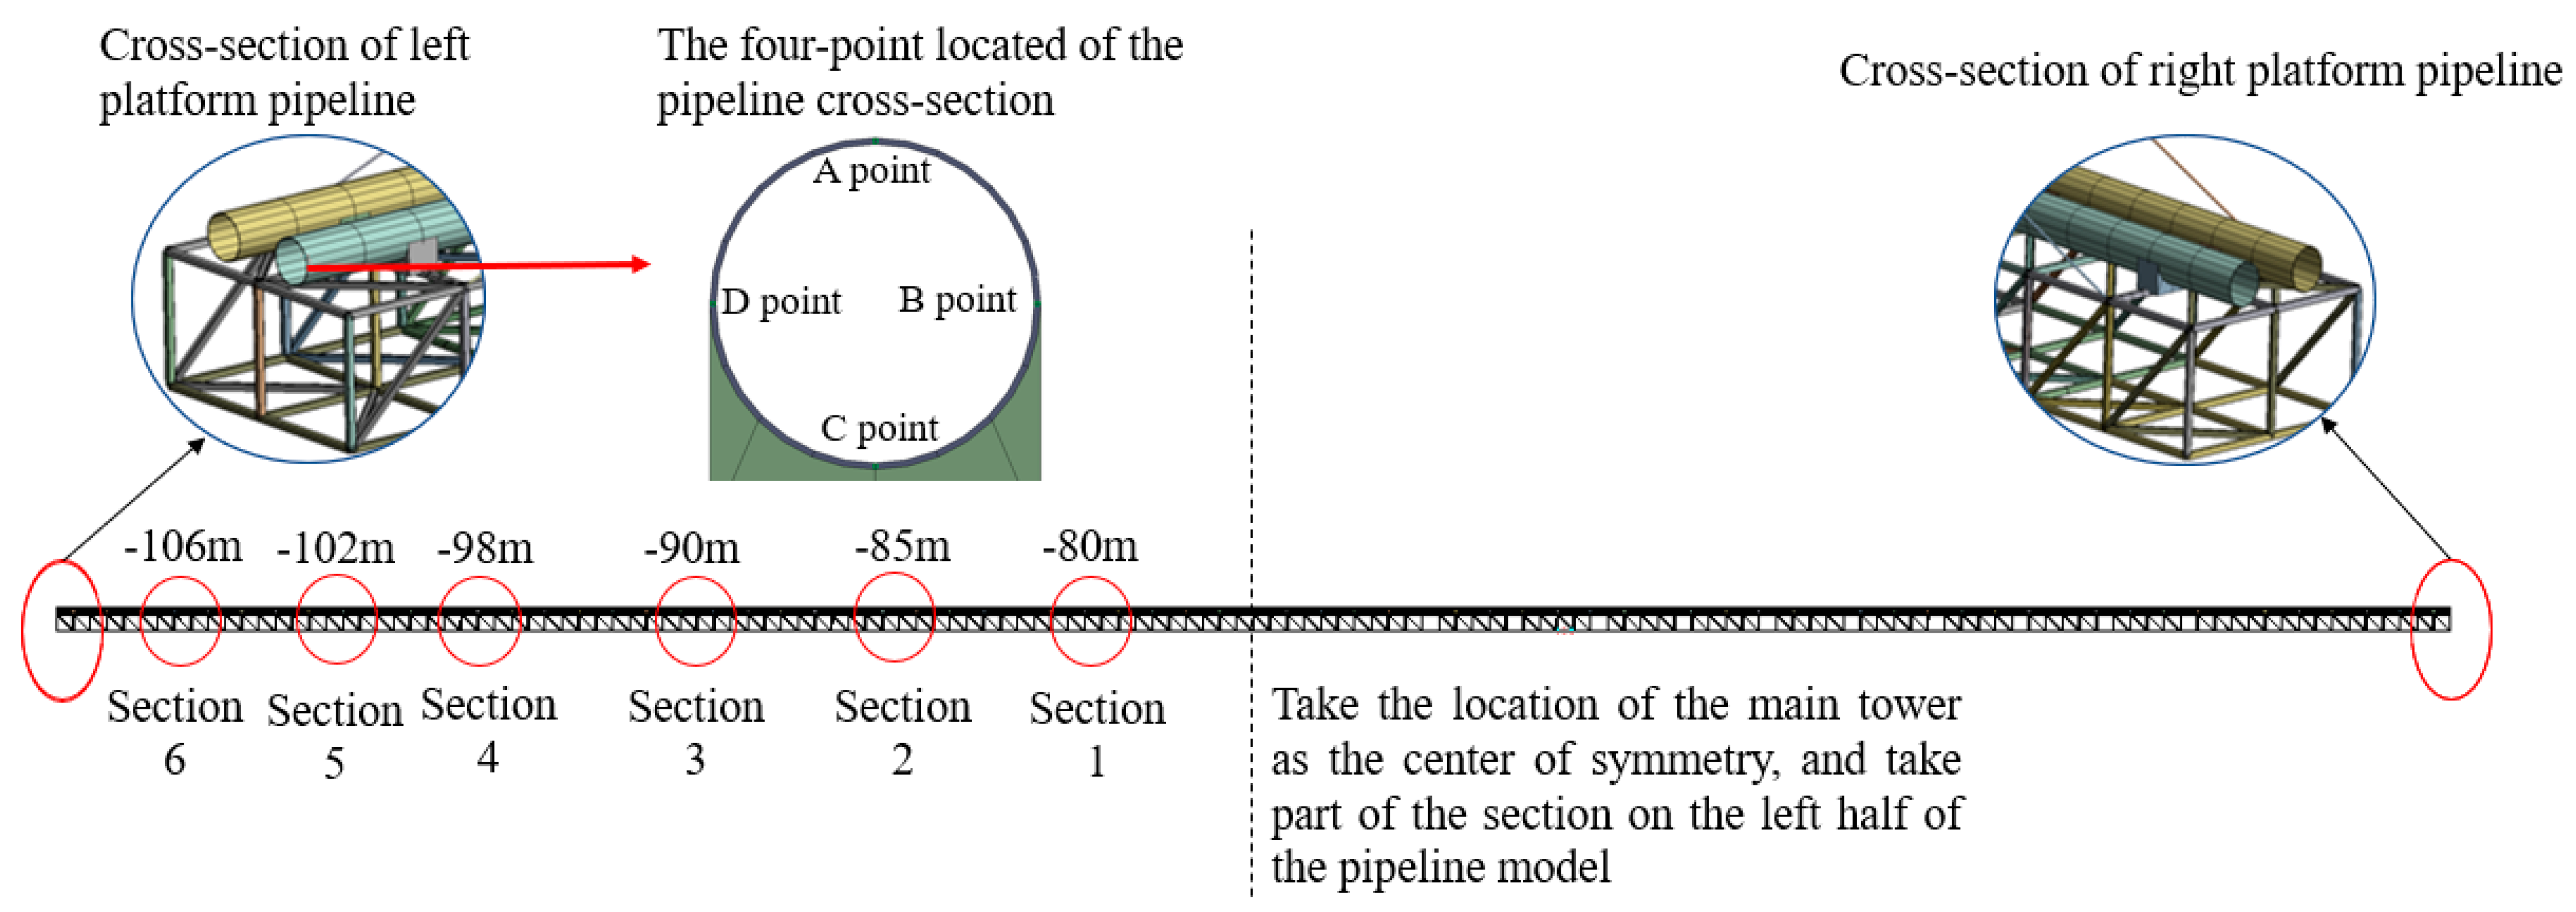
To further investigate the effect of coupling considering the viscoelastic effect of the medium on the seismic response of the cable-stayed spanning oil pipeline, in this paper’s pipe model, the bridge platform and span locations of −80 m, −85 m, −90 m, −98 m, and −106 m were evaluated (see Figure 8). The seismic response at four points of the pipe section, i.e., points A, B, C, and D, was analyzed.

3.2.1. Seismic Response of Pipeline Cross-Section at Bridge Platform Location

  • Time History Curve of Displacement Response of Pipeline Cross-Section
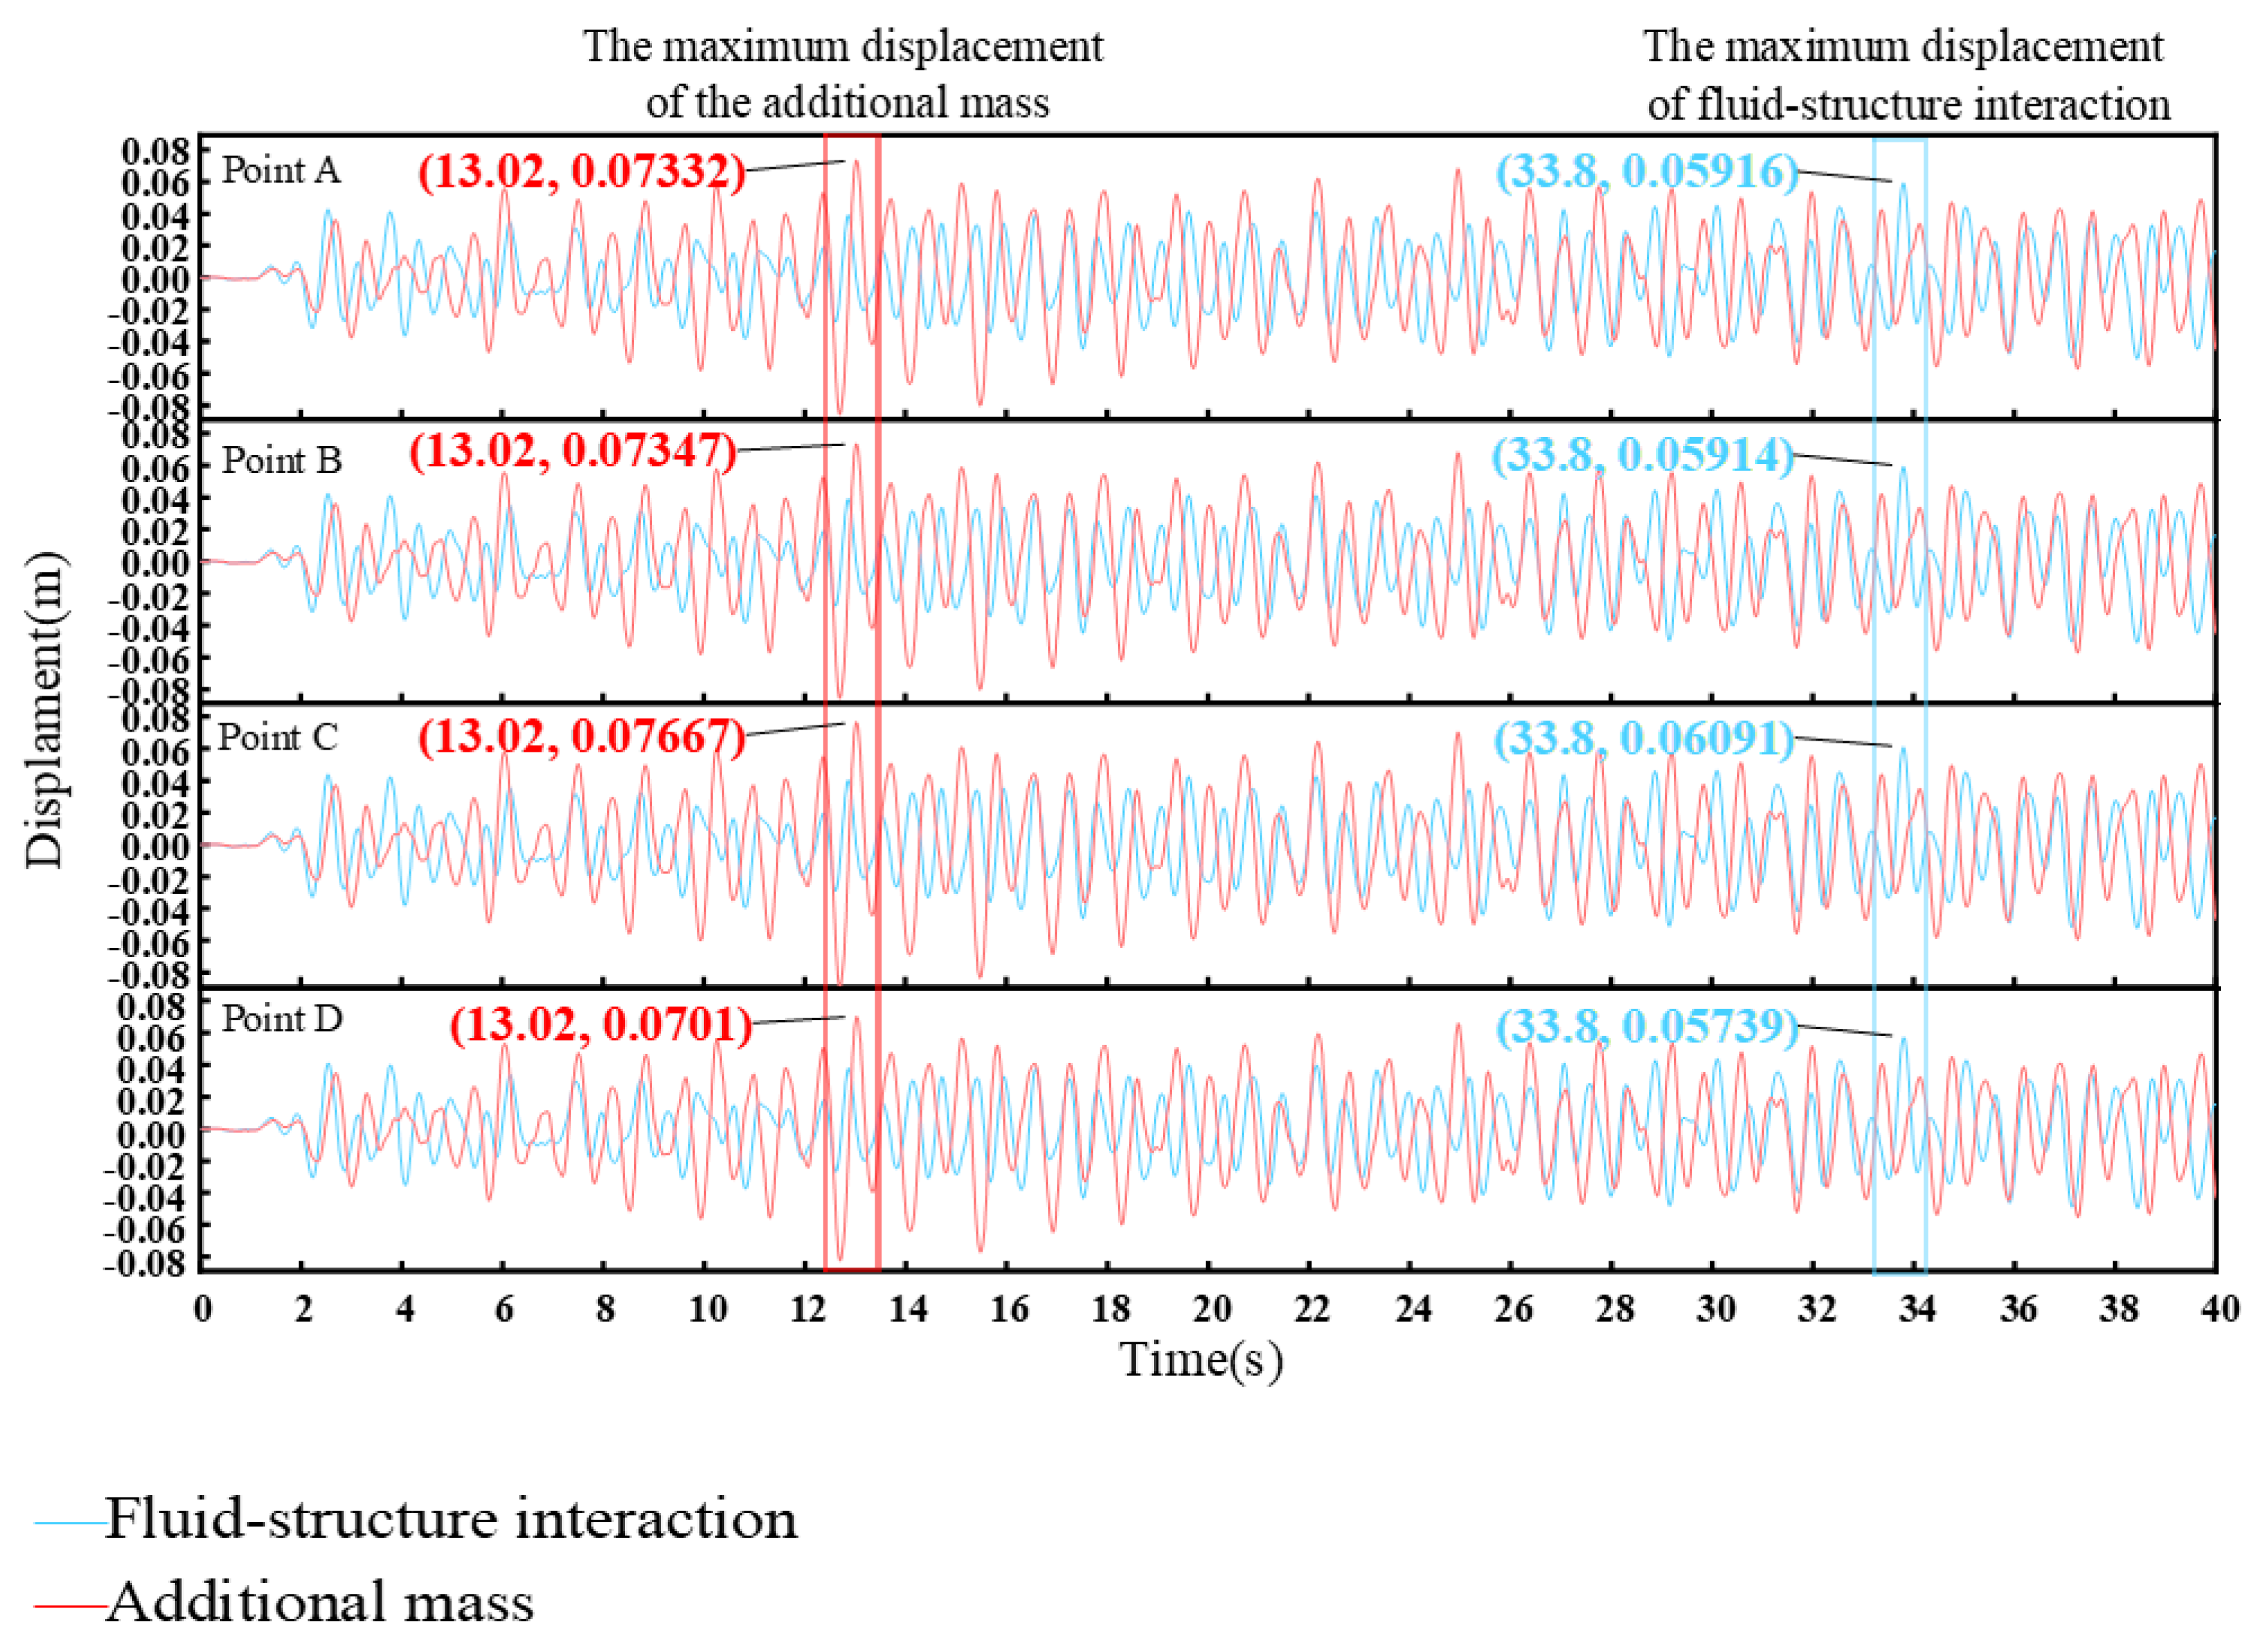
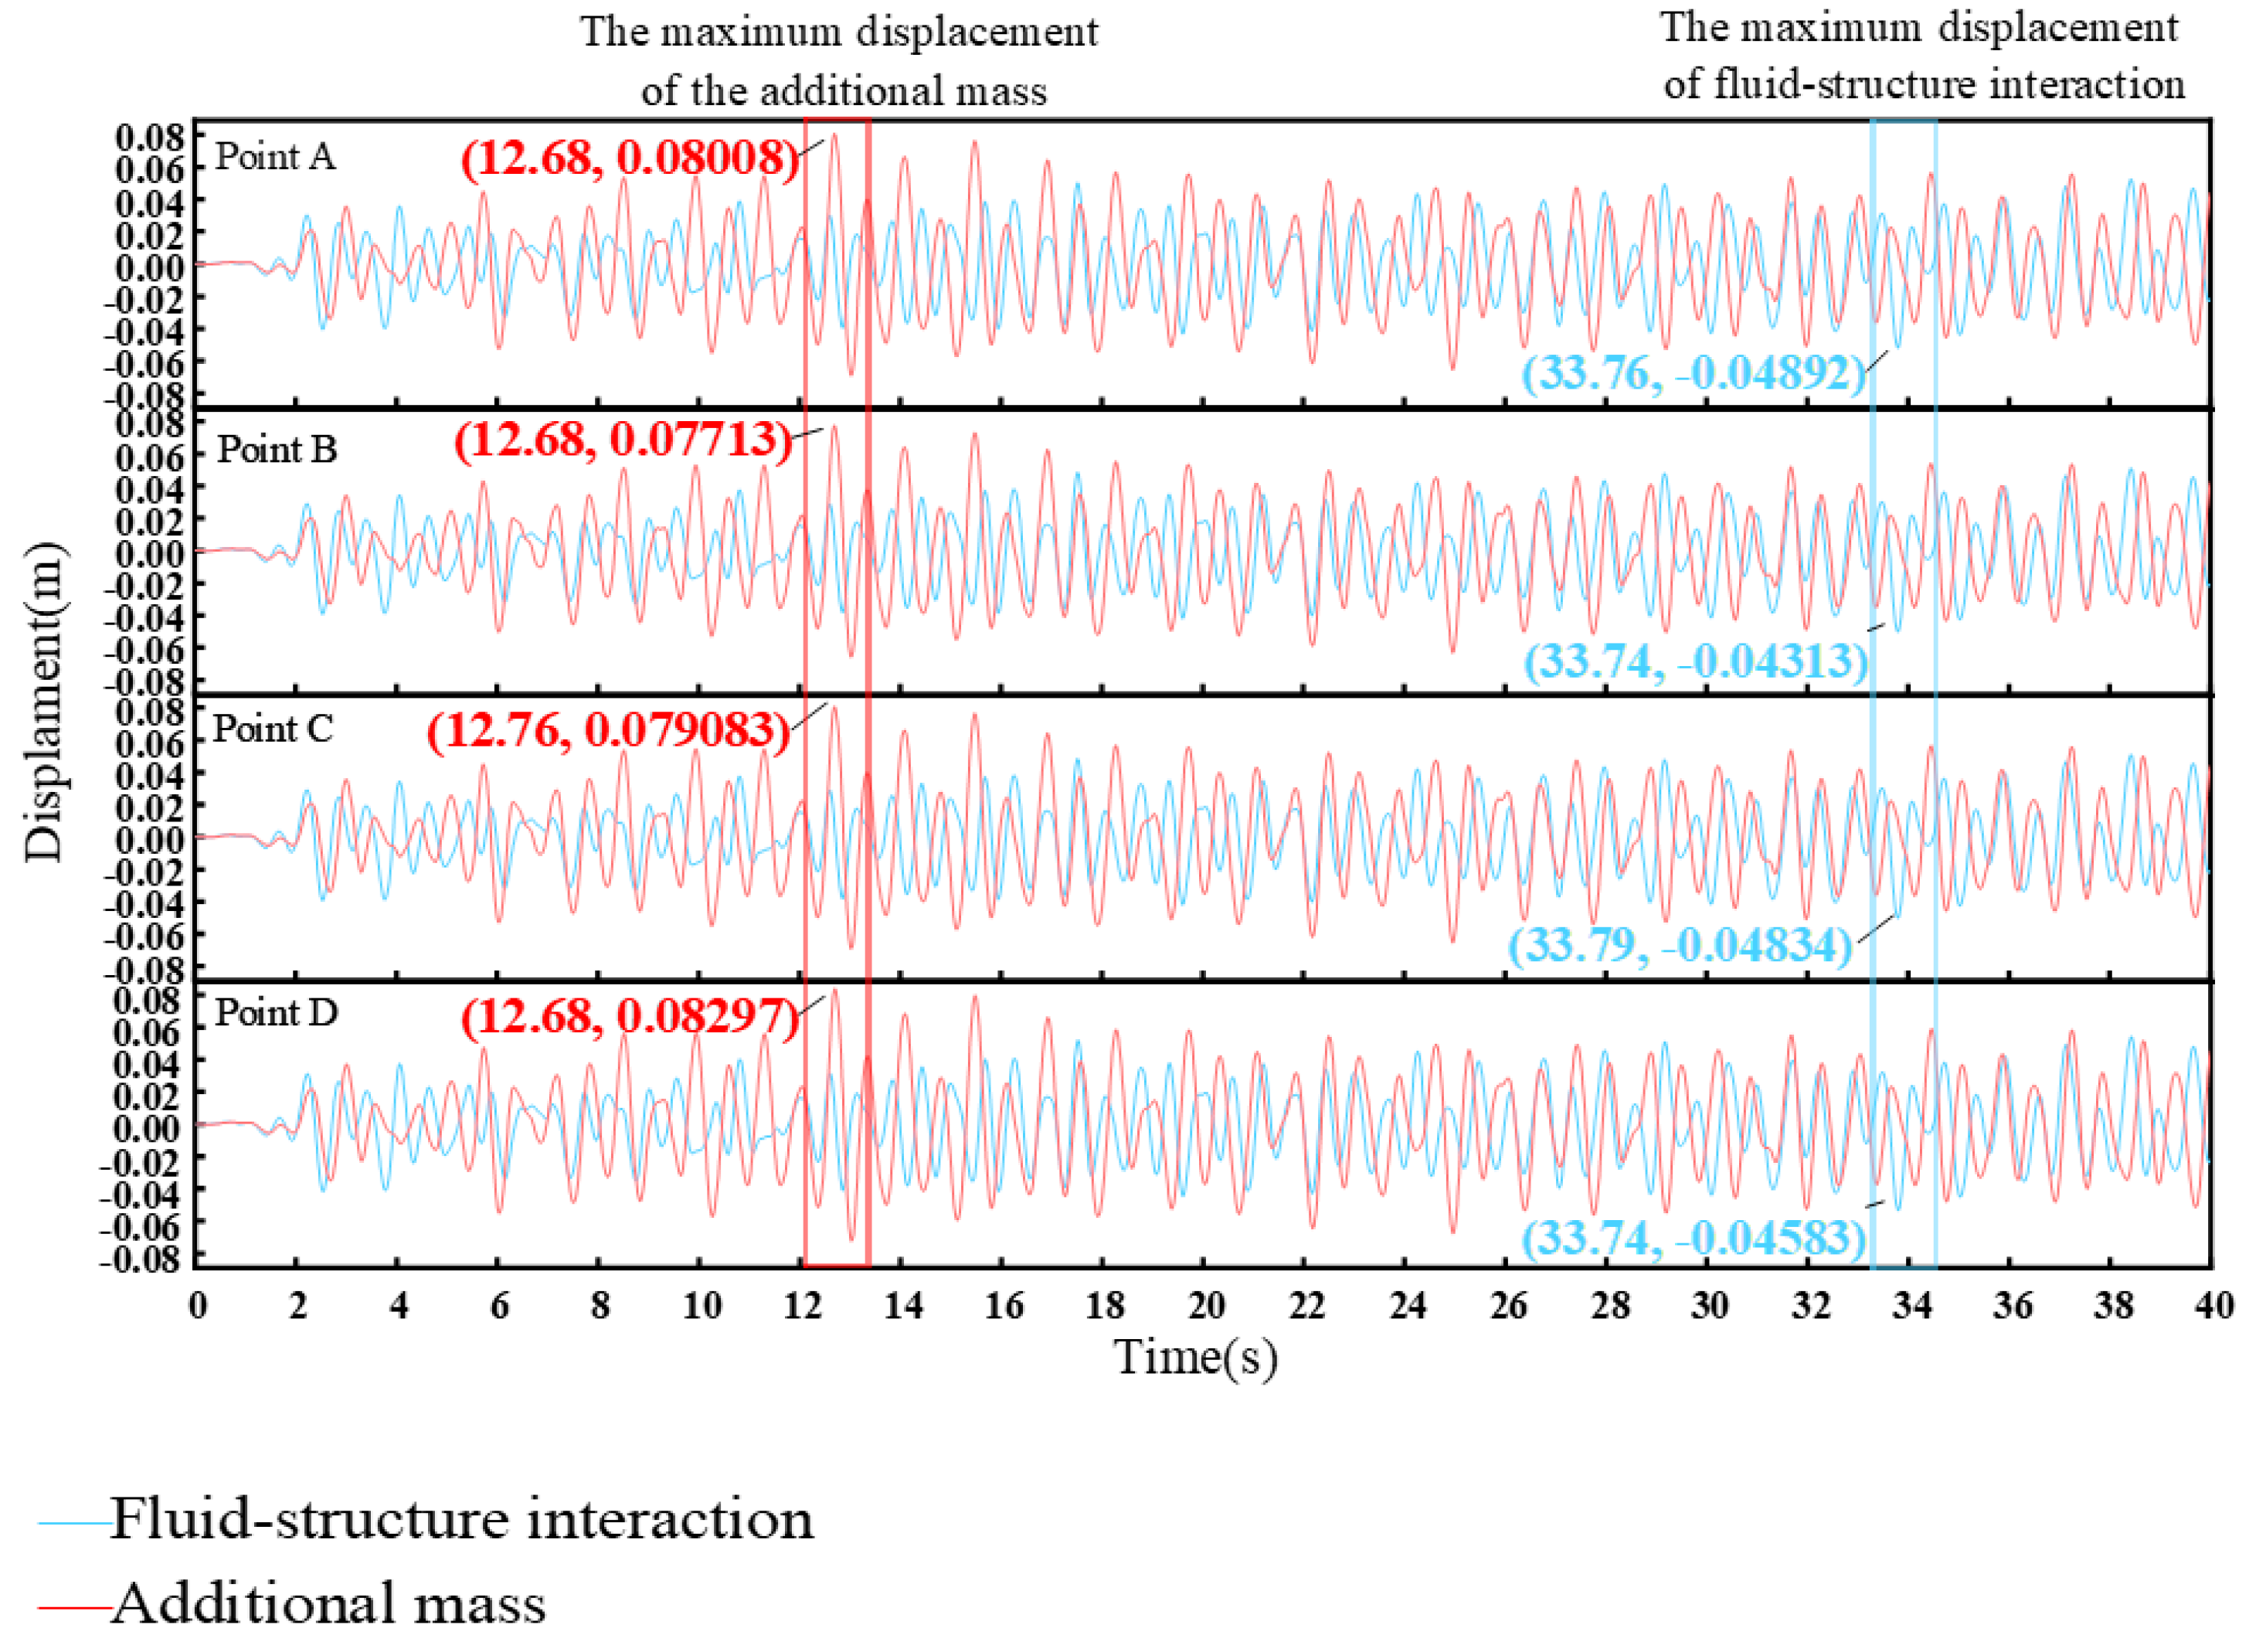
Figure 9 and Figure 10 show the seismic displacement response time curves of the cable-stayed spanning oil pipeline model considering the fluid–solid coupling effect and the additional-mass method at four points (A, B, C, and D) of the pipeline cross-section at the left and right platform positions, respectively.
From Figure 9 and Figure 10, which depict the seismic displacement response of the pipeline cross-sectional bridge platform position based on the two methods, it can be seen that the seismic displacement response of the oil pipeline cross-section using the additional-mass method was overwhelmingly larger than that based on the fluid–solid coupling effect. The latter was larger than the former within the first 4 s, after which the former grew in amplitude, influenced by the earthquake, and underwent large displacement changes, reaching a peak at about 13 s. The overall seismic displacement response of the pipeline cross-section, considering the fluid–solid coupling effect, oscillated continuously along a more uniform amplitude, whereby the displacement change amplitude was not as obvious as the additional-mass method, and the peak displacement response was reached around 34 s. This indicates that the viscoelastic damping effect of the oil and gas medium in the oil and gas pipeline had a counteracting effect on the seismic load, such that the oil pipeline did not have a large displacement change; thus, the fluid–solid coupling effect considering the medium viscoelastic effect was more realistic.
2.
Time History Curve of Acceleration Response of Pipeline Cross-Section
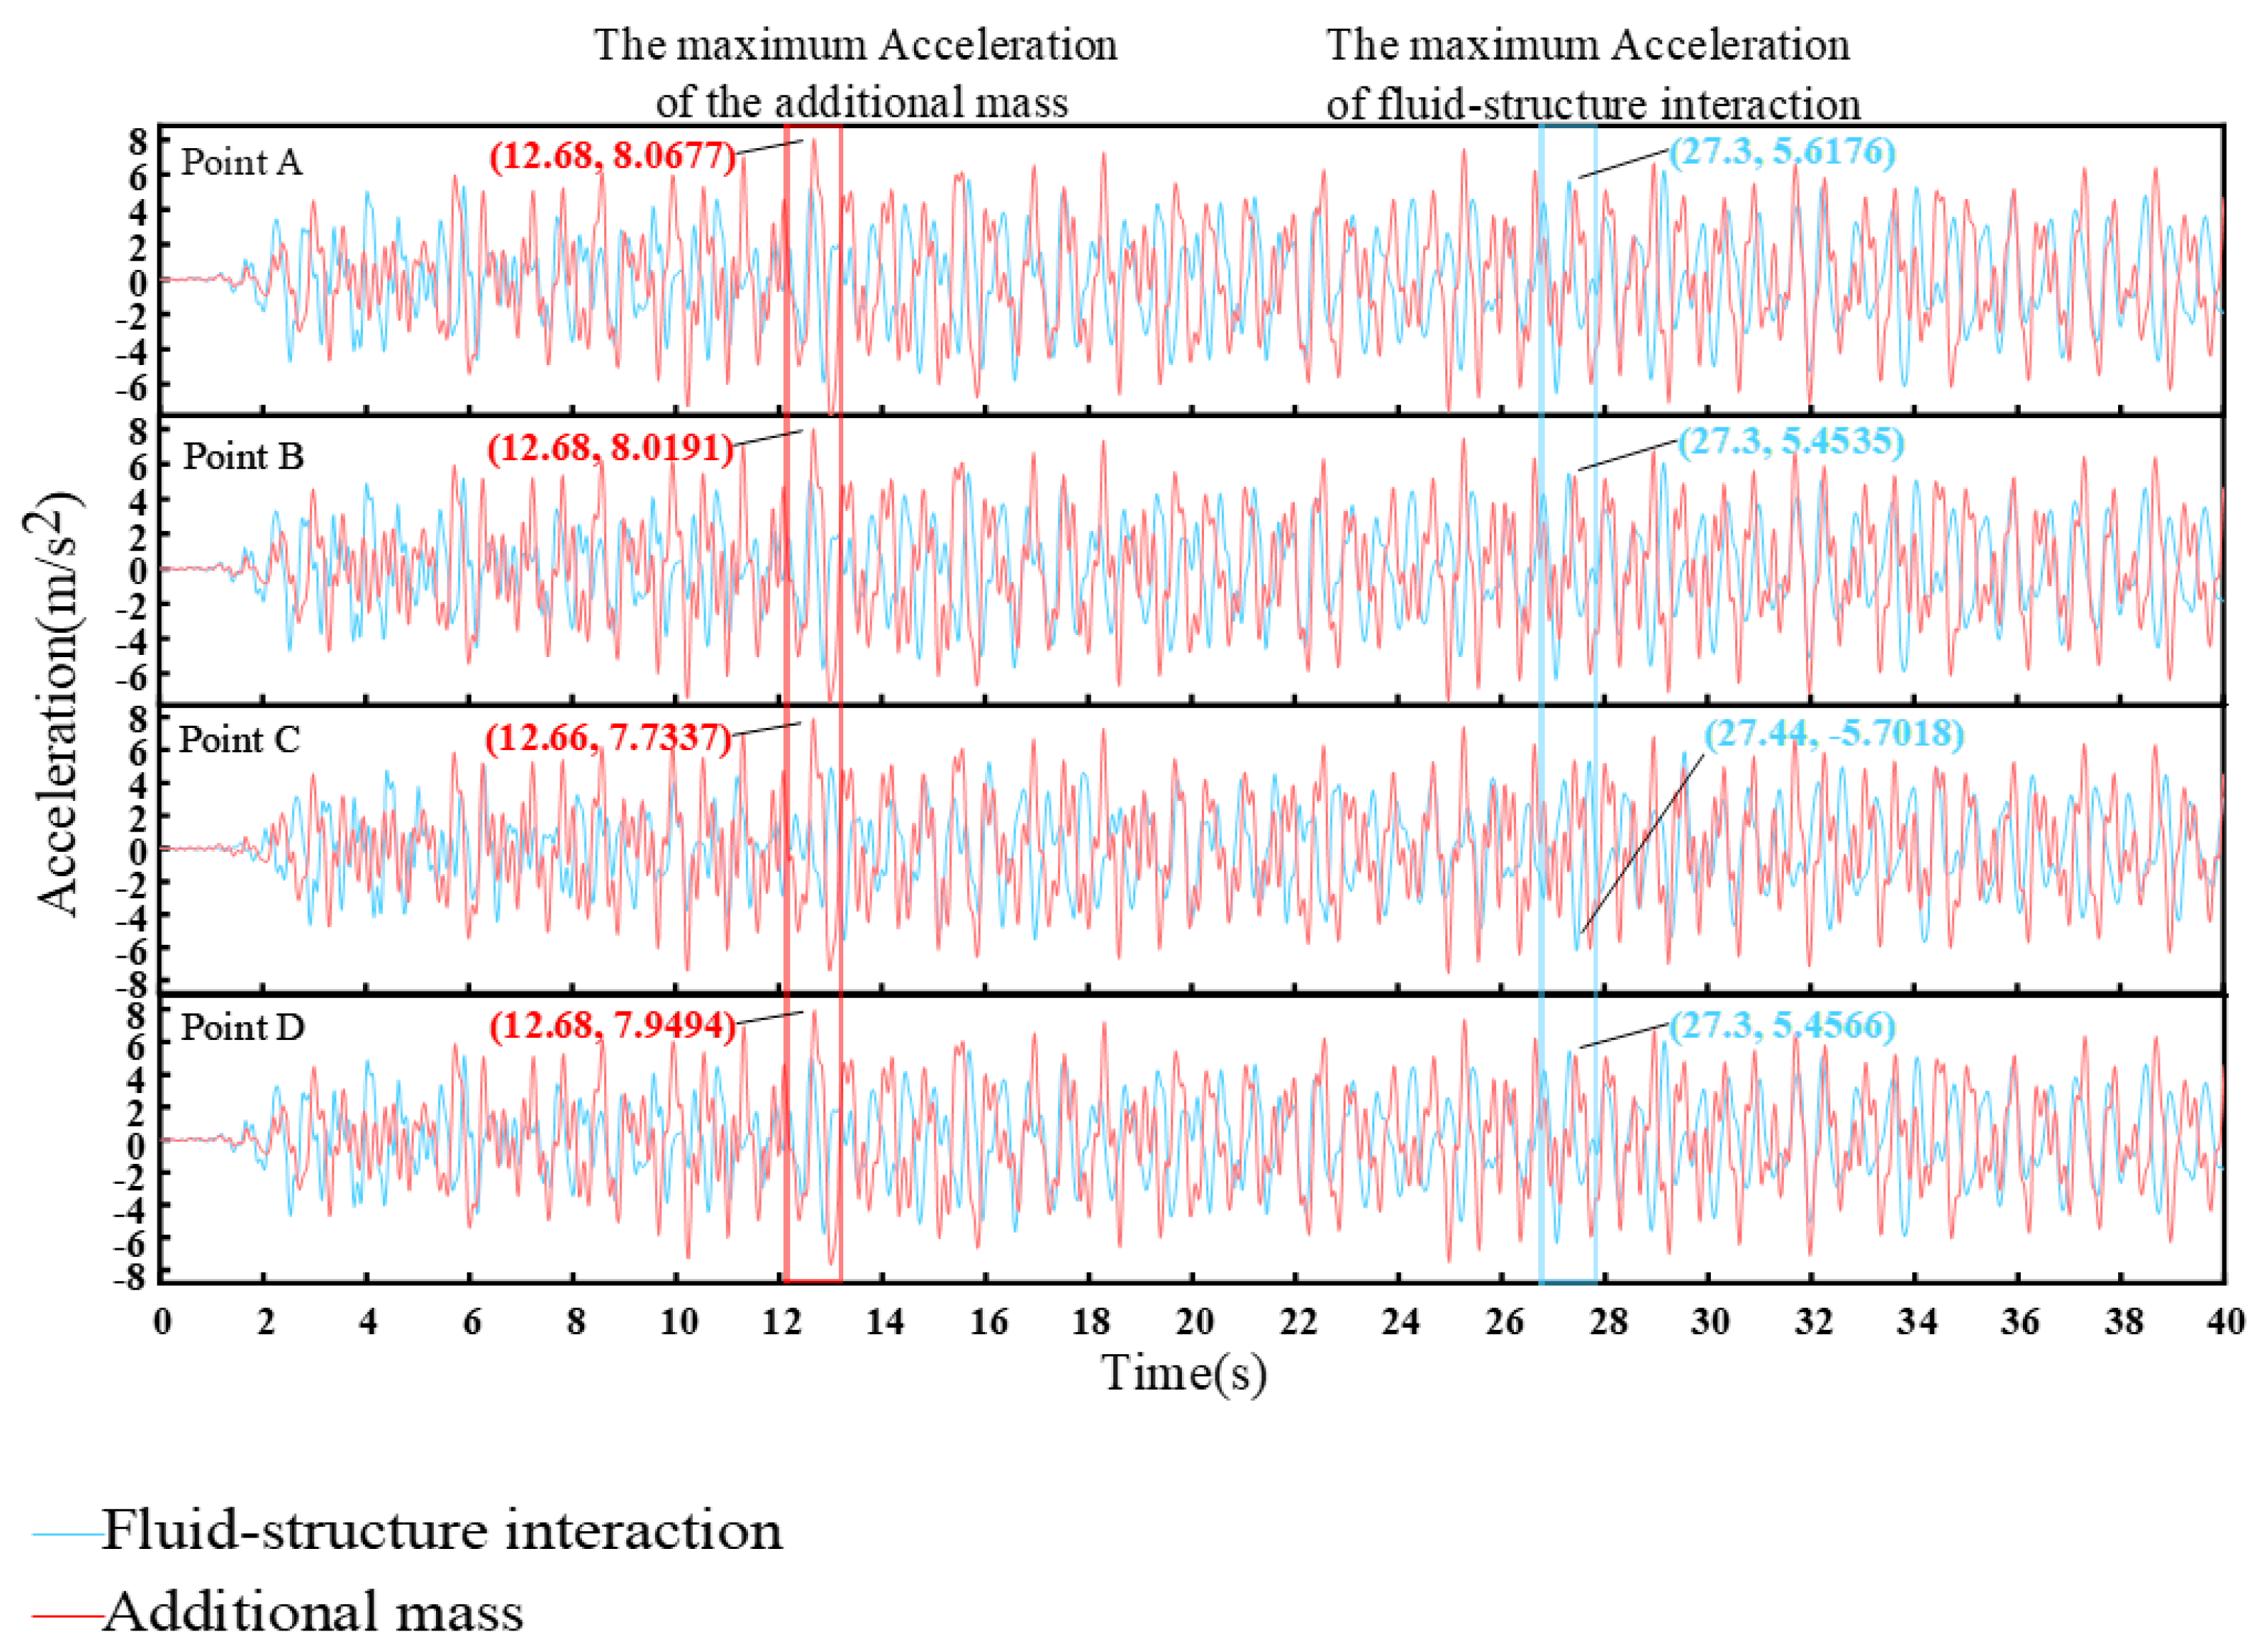
Figure 11 and Figure 12 show the seismic acceleration response curves of the cable-stayed spanning oil pipeline model considering the fluid–solid coupling effect and the additional-mass method at four points (A, B, C, and D) of the pipeline cross-section at the left and right platform positions, respectively.
From Figure 11 and Figure 12, it can be seen that the seismic acceleration response of the right platform of the pipe section based on the fluid–structure coupling effect increased in comparison with the left platform as a whole, and the peak acceleration response of the pipe section of the right platform was less than that of the left platform, while the seismic acceleration response of the platform position of the pipe section using the additional-mass method reached the peak acceleration response in about 13 s, with no significant difference. Most of the acceleration responses of the pipeline cross-sectional platform positions based on the fluid–structure coupling effect were smaller than those of the pipeline cross-sectional acceleration responses using the additional-mass method. This shows that the influence of the cable-stayed spanning oil pipeline considering the medium–pipeline fluid–solid coupling effect on the seismic response is more complicated and that the fluid–solid coupling effect of the pipeline considering the medium viscoelastic effect plays a certain mitigating effect on the seismic response and weakens the effect of earthquakes.
3.
Peak of Seismic Response of Pipeline Cross-Section at the Bridge Platform Location
Table 2 and Table 3 show the peak seismic response of the pipeline cross section at the left and right platform positions for the cable-stayed spanning pipeline, respectively.
From Table 2 and Table 3, we can see that the peak of the pipe section’s seismic displacement and acceleration response, considering the fluid–structure coupling effect, were smaller than the seismic response of the pipe section using the additional-mass method, with the peaks at the left and right platform positions based on the flow–solid coupling effect, and the additional-mass method was in opposite directions. This shows that the influence of the flow–solid coupling effect on the cable-stayed spanning type oil pipeline under seismic action is more complicated and that the results of the medium–pipeline flow–solid coupling effect considered using the additional-mass method are large, which is safer for the seismic design of the oil pipeline.
Table 2 and Table 3 show that the seismic displacement and acceleration responses of the pipe section platform position were the largest at point B, with those at the left platform being larger than those at the right platform. The maximum displacement based on the additional-mass method was 0.089 m, and the maximum acceleration was 8.07 m/s2; the maximum displacement based on the fluid–solid coupling method was 0.061 m, and the maximum acceleration was 6.55 m/s2. This shows that, under the excitation of seismic loads, pipeline point B of the bridge platform was deformed and displaced the most. The seismic response of the left bridge platform pipeline section was affected the most; thus, the safety protection of the left bridge platform point B of the pipeline should be thoroughly considered in the operation of the diagonal-span-type oil pipeline.

3.2.2. Seismic Response at the Position of the Partial Pipeline Cross-Section

At the six locations of the pipeline model (−80 m, −85 m, −90 m, −98 m, −102 m, and −106 m, as shown in Figure 8), the seismic response of the pipeline considering the fluid–structure coupling effect was calculated, and the seismic displacement and acceleration response curves of the pipeline were plotted.
1.
Time History Curve of Displacement Response of Pipeline Cross-Section
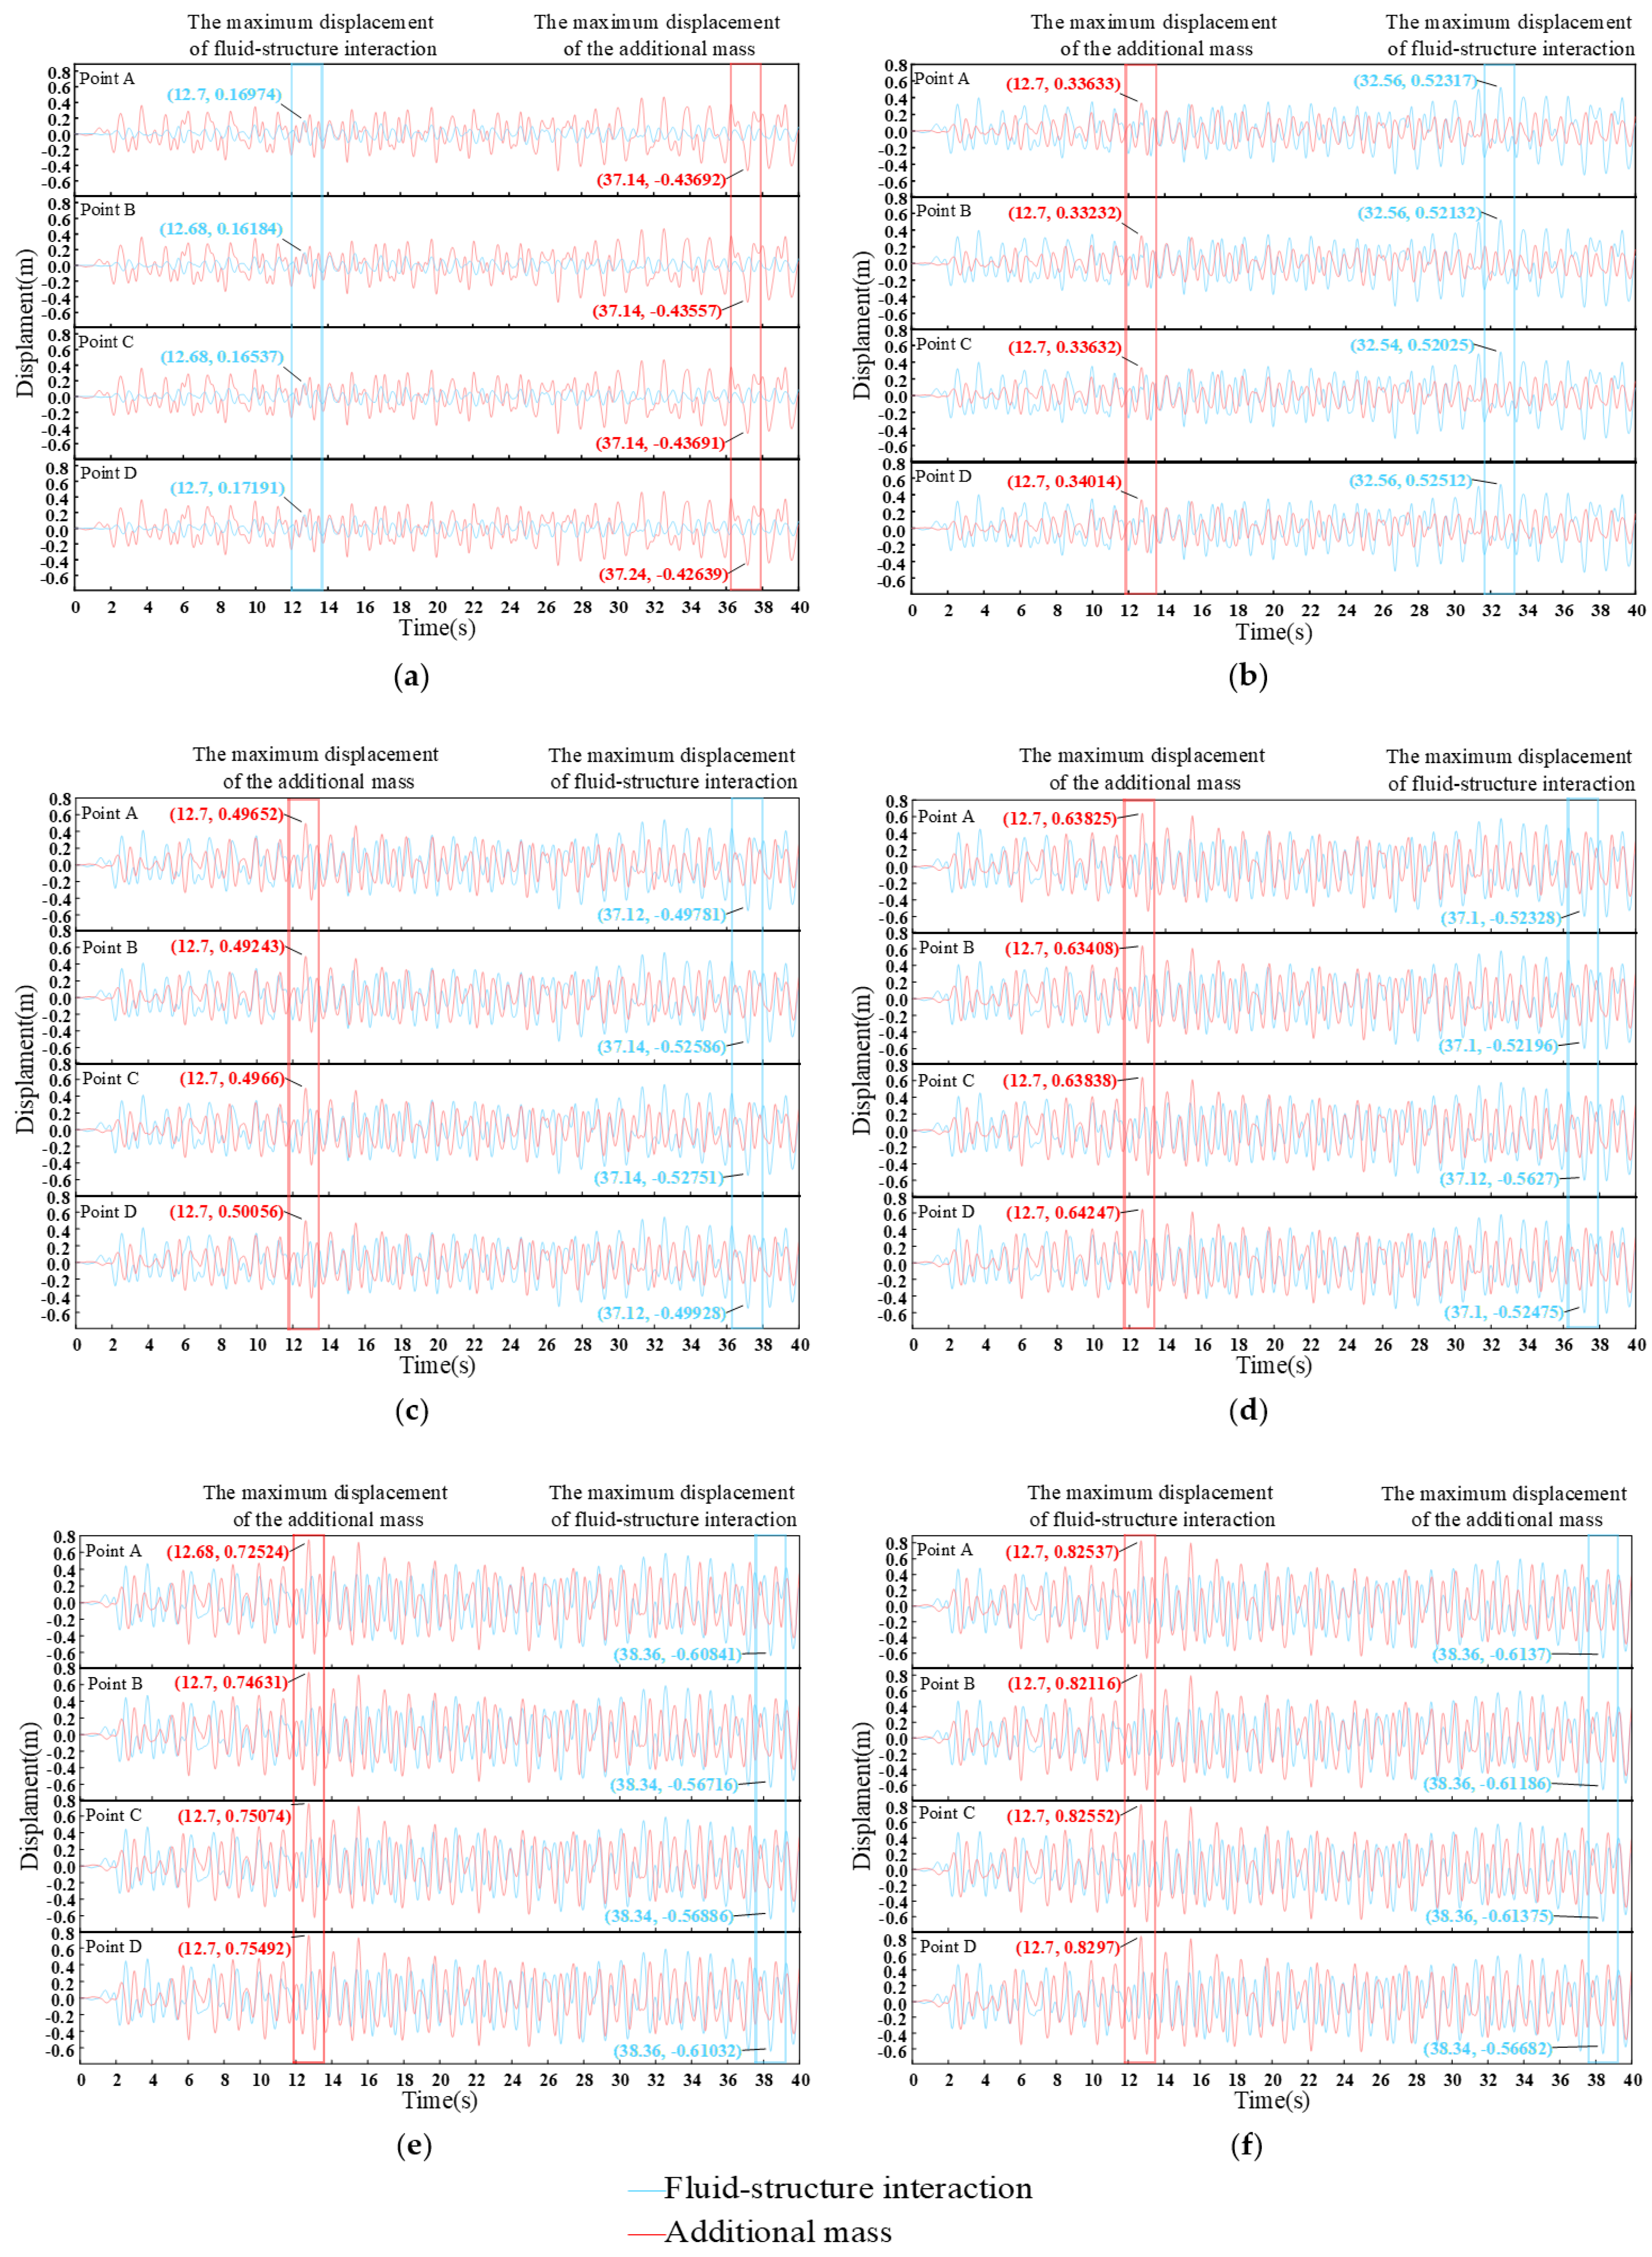
The displacement response results for six pipeline sections of the above pipeline model at four points were extracted, and their seismic displacement response time curves are shown in Figure 13.
As shown in Figure 13, the seismic displacement response of the pipe section based on the fluid–solid coupling effect gradually increased as the pipe section approached the left platform position. In the pipeline cross-sectional displacement response, the vast majority of Section 1 was smaller than when using the additional-mass method; in the pipeline cross-sectional displacement response, section 6 was partially larger than when using the additional-mass method. The time for the displacement response to reach its peak at each position of the pipeline cross-section varied, the most obvious of which was cross-section 1, further highlighting the complexity of the effect of the fluid–solid coupling on the seismic response of the transmission pipeline.
2.
Time History Curve of the Acceleration Response of the Pipeline Cross-Section
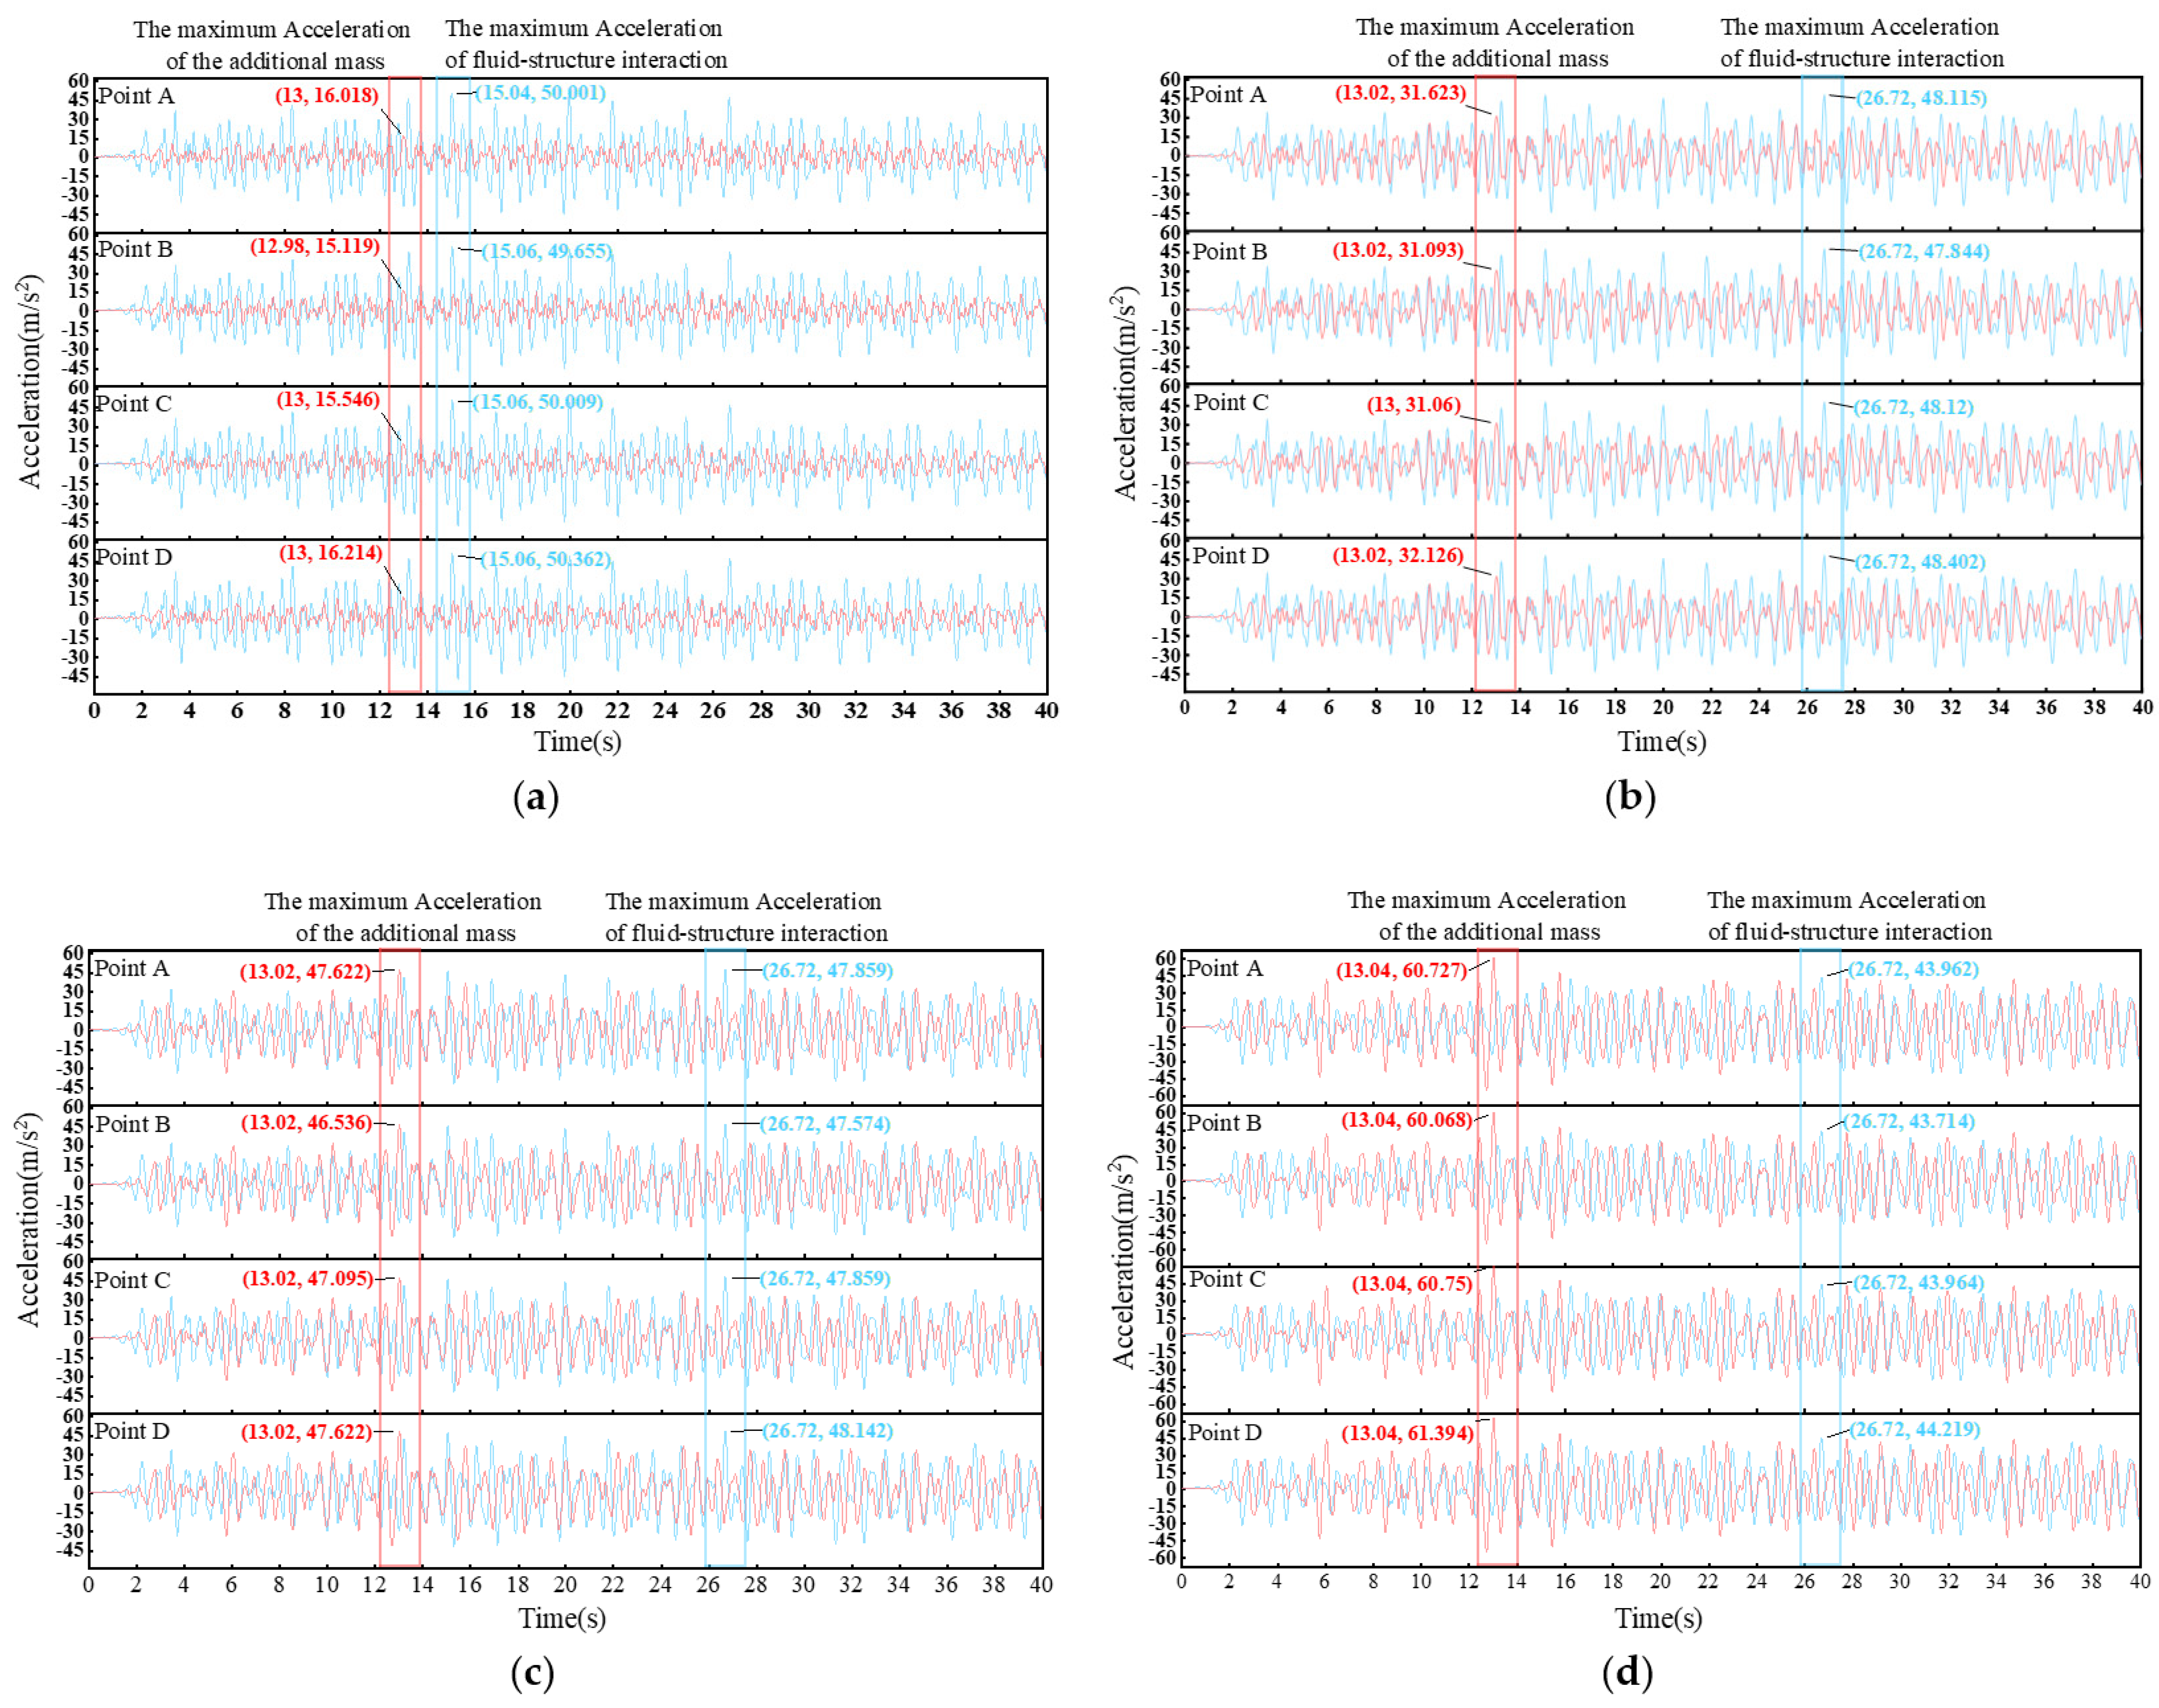
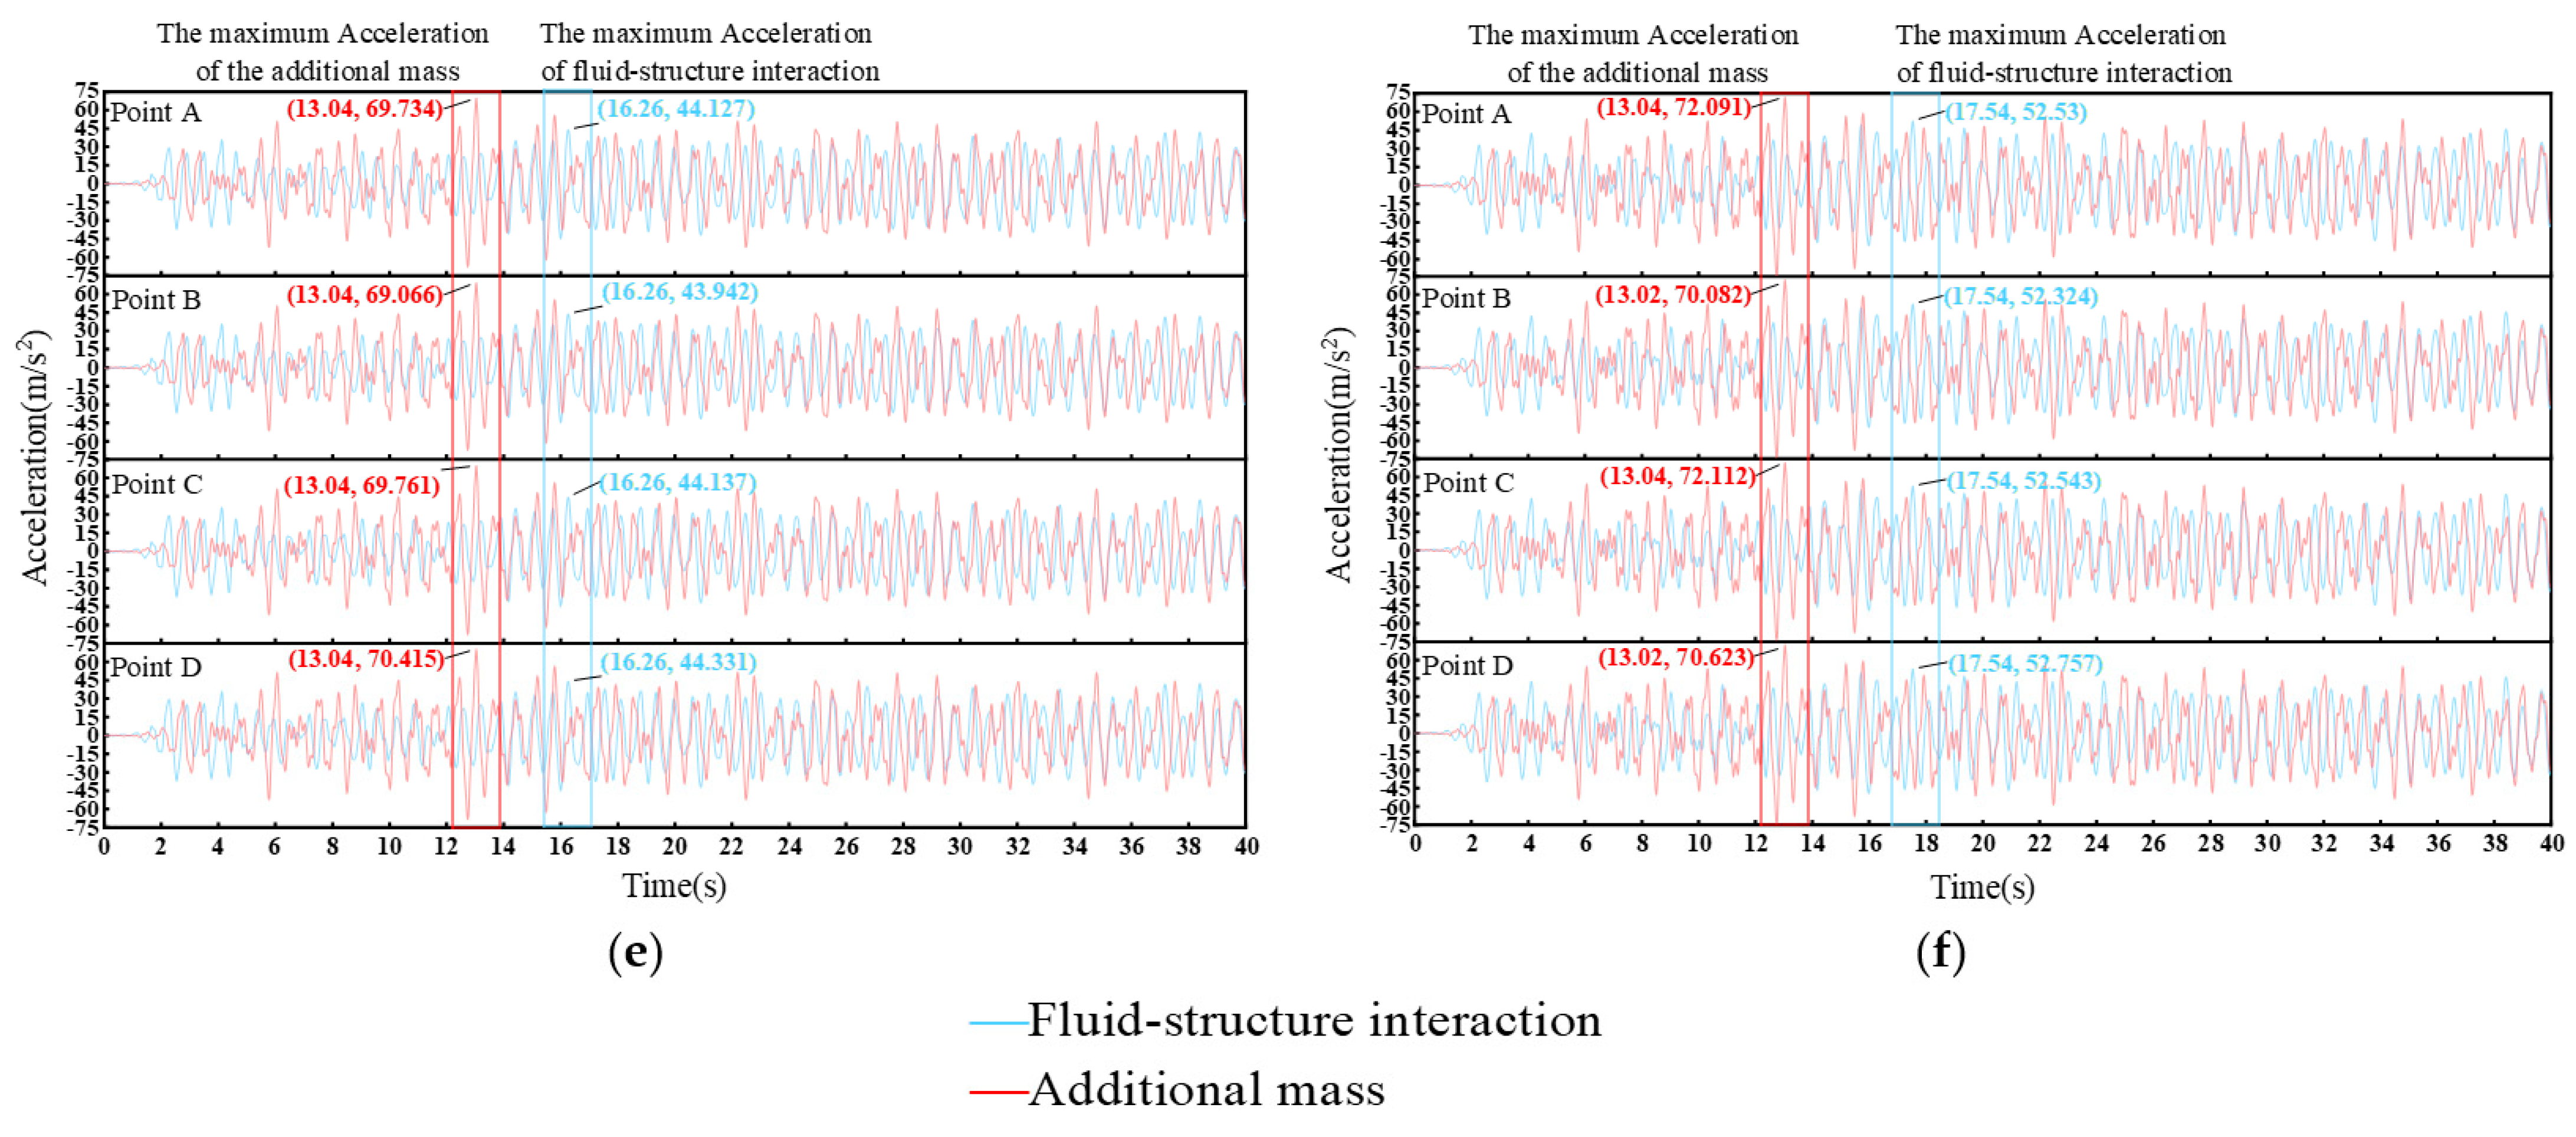
Figure 14 shows the time course curves of the seismic acceleration response drawn by extracting four-point acceleration data from six sections of the pipe model.
It can be seen from Figure 14 that the seismic acceleration response of the pipeline cross-section based on the additional-mass method gradually increased as the pipeline cross-section approached the left platform position, and the peak time of the seismic acceleration response of the oil pipeline cross-section based on the flow–solid coupling effect showed a trend of first increasing and then decreasing. The time when the seismic acceleration response of the pipeline cross-section reached its peak using the additional-mass method was the same, indicating that, at the early stage of seismic action, the response of the fluid–solid coupling action of the medium pipeline considering the viscoelastic effect of the medium to the seismic load was larger, resulting in a greater tendency of displacement or deformation of the cable-stayed spanning type pipeline. With the propagation of the earthquake, the seismic response of the pipe section based on the fluid–solid coupling effect was relatively stable, while the seismic response of the pipe section based on the additional-mass method without considering the viscoelastic effect of the medium gradually increased.
3.
Peak of the Seismic Response of the Partial Pipeline Cross-Section
Table 4 and Table 5 show the peaks of the seismic acceleration response of the pipeline section at the left and right platform positions for the cable-stayed spanning type pipeline, respectively.
From Table 4 and Table 5, it can be seen that the seismic response of the four points of the pipeline section at different locations of the cable-stayed spanning type pipeline based on the two methods showed an increasing trend, and the peak of the seismic response of the pipeline section reached its maximum in section 6. According to Xiao [1], the amplitude of the displacement response at a velocity of flow of 5 m/s was 1.0, while the maximum displacement response of the additional mass of the pipeline cross-section in this paper was 0.83. As shown in Table 4, the peak values of the displacement response of the pipe section based on the fluid–structure coupling effect were all negative, indicating that the maximum displacement was along the negative direction of the vertical bridge, while the peak values of the displacement response of the pipe section using the additional-mass method were all positive, in contrast. This indicates that the influence of the fluid–structure medium–pipeline coupling on the seismic response of pipeline cross-section differs according to the methods, highlighting the complexity of the situation. It can also be seen that most of the seismic responses of the pipeline sections based on the two different methods reached the maximum at point D, corresponding to the maximum seismic response at point B of the bridge platform on both sides of the pipeline model; thus, attention should be paid to the reinforcement of both sides of the pipeline in the safe operation and seismic design of the oil and gas pipeline to prevent vertical fracture.
From Table 4 and Table 5, it can be seen that a larger part of the peak displacement response in the seismic response of the pipe section based on the fluid–solid coupling effect was larger than that of the additional-mass method before cross-section 4, after which the opposite scenario occurred. This indicates that, before Section 4, the medium–pipeline coupling effect based on the fluid–structure coupling effect could resonate with the seismic load, increasing the impact of the earthquake on the pipeline section. As shown in Table 4, the peak variation of the four-point displacement response of the pipe section at the midpoint of the support based on the fluid–structure coupling method was approximately 20%, while the variation based on the additional-mass method was approximately 65%, highlighting that the flow–solid coupling effect considering the medium mass and viscoelastic effect attenuated the impact of the seismic load on the pipeline under the seismic excitation of the cable-stayed spanning type pipeline, whereas the use of the additional-mass method exaggerated the seismic response of the pipeline, making the calculation results conservative. Therefore, the fluid–structure coupling method can be used to consider the fluid–structure coupling effect of oil and gas pipelines, which is more practical and can reflect the motion law of oil and gas pipelines under seismic loading.

4. Discussion

In order to specifically analyze the influence of fluid–structure interaction on the seismic response of oil and gas pipelines, the additional-mass method and the fluid–structure interaction method were used to compare and study them. The additional-mass method is an analysis method that simplifies the dynamic effect of a fluid into an additional mass force, which is a virtual mass that is considered to encompass the additional inertial and dissipative forces acting on the structure. In this study, the mass of the oil and gas transmission medium in the oil and gas transmission pipeline was used as the pressure additional mass of the inner wall of the oil and gas pipeline to solve the dynamic equation of the structure of the oil and gas pipeline. In terms of theoretical research, Westergaard et al. first proposed the concept of additional mass based on the assumption of incompressible fluid and rigid structure, and they achieved fruitful results after long-term research. However, due to the complexity of the actual situation and the limitations of simulation software, the additional-mass method cannot take into account the viscoelastic effect of the fluid and the effect of the rigid effect of the fluid on the structure; however, this method is also a typical method to study the fluid–structure interaction of a dielectric structure.
In this study, the fluid–structure interaction method was also used to solve the problem that the additional-mass method was missing in terms of the viscoelastic effect and rigid effect of the medium. Thus, the fluid–structure interaction method is relatively practical and accurate in describing the fluid–structure interaction effect. In Section 3.1, it can be seen that the seismic response cloud of pipelines using the additional-mass method changed more significantly compared to the fluid–structure interaction method. The simulation results in Section 3.2 show that the response of the additional-mass method was mostly greater than that of the fluid–structure interaction method; however, in practice, the seismic response of pipelines should change at different flow velocities, and the seismic response of pipelines will also be affected by the pile–soil–structure interaction. The finite element calculation method considering the fluid–structure interaction seismic response proposed by this institute has a good application background, which can provide a theoretical reference for experimental research and field testing.

5. Conclusions

(1)
In the seismic response of the oil pipeline cross-section considering the medium–pipeline flow–solid coupling effect, the influence of the oil pipeline flow–solid coupling effect on the seismic response is more complicated; the seismic response of the pipe section is the smallest at the location of the main tower and the bridge platform on both sides, and the seismic response of the pipe section is the largest at one-fifth of the bridge platform on the left side.
(2)
In the seismic response of the pipeline cross-section at the bridge location, the seismic response at point B in the pipeline cross-section reached the maximum; the peak of the seismic response of the pipeline cross-section at the left bridge platform was slightly larger than that at the right bridge platform, related to the propagation direction of seismic waves.
(3)
As for the seismic response of the pipe section at different locations, the seismic response at point D in the pipe section reached the maximum, corresponding to the seismic response of the pipe section at the bridge platform location; the changing trend of seismic displacement and acceleration response based on the fluid–solid coupling method was more stable, while the changing trend of the seismic response of the oil pipeline cross-section using the additional-mass method increased first and then decreased. Most of the seismic response of the oil pipeline based on the fluid–solid coupling effect was smaller than that of the additional-mass method because of the viscoelastic damping effect of the medium in the pipeline. The peak variation range of the seismic response of the pipeline using the additional-mass method was much larger than that of the seismic response based on the fluid–solid coupling effect; the maximum displacement response of the pipeline section using the additional-mass method was increased by 24%, and the maximum acceleration response was increased by 30%.
(4)
The coupling effect considering the mass of the oil and gas transmission medium and the viscoelastic effect had a weakening effect on the seismic response of the oil and gas transmission pipeline, while the additional-mass method without considering the viscoelastic effect of the medium exaggerated the seismic response of the cable-stayed spanning type oil transmission pipeline, whereby the calculation results were on the conservative side, and the design of the project was on the safe side.
Restricted by fluid tests, it is difficult to carry out simulated seismic shaking-table tests. The finite element calculation method considering the fluid–solid coupling seismic response proposed in this paper has a good application background; it can provide a theoretical reference for trial studies and scene tests. Furthermore, the simulated seismic shaking table test system for the oil and gas pipeline model structure integration considering the fluid–solid coupling effect is an urgent problem to be solved.

Author Contributions

G.W.: Formal analysis, Methodology, Validation, Visualization, Conceptualization. Q.X.: Formal analysis, Methodology, Software, Writing—Review and Editing. C.X.: Software, Supervision. P.Z.: Resources, Methodology. X.Z.: Resources, Supervision. All authors have read and agreed to the published version of the manuscript.

Funding

The financial support for this work is provided by the National Natural Science Foundation of Chian (No. 52174061); the Natural Science Foundation of Shaanxi Province, China (2022JM-279); the Yulin Science and Technology Plan Project (CXY-2020-095); and the key laboratory of well stability and fluid and rock mechanics in the oil and gas reservoir of Shaanxi Province (grant number WSFRM20200102001).

Data Availability Statement

Not applicable.

Conflicts of Interest

The authors declare no conflict of interest.

References

  1. Hao, J.; Liu, P.; Zhang, J.; Jing, Y.; Han, B.; Wu, Z. Risk of Earthquake Hazard to Long-distance Oil and Gas Pipelines. Oil Gas Storage Transp. 2009, 28, 27–30. [Google Scholar]
  2. Xiao, B.; Zhou, Y.; Gao, C.; Cao, Y.; Shi, S.; Liu, Z. Analysis of vibration characteristics of pipeline with fluid added mass. J. Vib. Shock. 2021, 40, 182–188. [Google Scholar] [CrossRef]
  3. Li, J.; Zhang, D.; Wang, L.; Lin, D.; Hong, J. Modal characteristics analysis for pipelines considering influence of fluid medium. J. Aerosp. Power 2019, 34, 671–677. [Google Scholar] [CrossRef]
  4. Dante, D.; Afaque, S. Scaling of added mass and added damping of cylindrical rods by means of FSI simulations. J. Fluids Struct. 2019, 88, 241–256. [Google Scholar] [CrossRef]
  5. Zhou, Y.; Li, Y.; Yu, Z.; Yoshida, A. Study on added mass of a circular curved membrane vibrating in still air. Thin-Walled Struct. 2018, 127, 200–209. [Google Scholar] [CrossRef]
  6. Zhao, Q.; Sun, Z. Flow-induced vibration of curved pipe conveying fluid by a new transfer matrix method. Eng. Appl. Comput. Fluid Mech. 2018, 12, 780–790. [Google Scholar] [CrossRef]
  7. Xu, J.; Fan, Y. Finite Element Analysis of Seismic Response of Two-Span Aqueduct with Fluid-Structure Coupling. Yellow River 2012, 34, 95–97. [Google Scholar] [CrossRef]
  8. Wang, L.; Zhang, J.; Zhang, H.; Zhang, R. Seismic response analysis of buried water supply pipeline based on fluid-solid interaction. J. Shenzhen Univ. Sci. Eng. 2020, 37, 271–278. [Google Scholar] [CrossRef]
  9. Wylie, E.; Streeter, V.; Wiggert, D. Multidimensional Fluid Transients by Latticework. J. Fluids Eng. 1980, 102, 384–385. [Google Scholar] [CrossRef]
  10. Farhat, C.; Geuzaine, P.; Brown, G. Application of a three-field nonlinear fluid-structure formulation to the pre-diction of the aeroelastic parameters of an F-16 fighte. Comput. Fluids 2003, 32, 3–29. [Google Scholar] [CrossRef]
  11. Nieto, F.; Hargreaves, D.; Owen, J.; Hernández, S. On the applicability of 2D URANS and SST k-ω turbulence model to the fluid-structure interaction of rectangular cylinders. Eng. Appl. Comput. Fluid Mech. 2015, 9, 157–173. [Google Scholar] [CrossRef]
  12. Wang, Z.; He, Y.; Li, M.; Qiu, M.; Huang, C.; Liu, Y.; Wang, Z. Numerical Investigation on Dynamic Response Characteristics of Fluid-Structure Interaction of Gas-Liquid Two-Phase Flow in Horizontal Pipe. J. Shanghai Jiaotong Univ. Sci. 2022, 1–8. [Google Scholar] [CrossRef]
  13. Guo, Q.; Zhou, J.; Guan, X. Fluid–structure interaction in Z shaped pipe with different supports. Acta Mech. Sin. 2020, 36, 513–523. [Google Scholar] [CrossRef]
  14. Rakhsha, M.; Yang, L.; Hu, W.; Negrut, D. On the use of multibody dynamics techniques to simulate fluid dynamics and fluid–solid interaction problems. Multibody Syst. Dyn. 2021, 53, 29–57. [Google Scholar] [CrossRef]
  15. Liu, X.; Liu, L. An immersed transitional interface finite element method for fluid interacting with rigid/deformable solid. Eng. Appl. Comput. Fluid Mech. 2019, 13, 337–358. [Google Scholar] [CrossRef] [Green Version]
  16. Wang, X.; Yang, S.; Tao, Y. Model studies of fluid-structure interaction problems. CMES Comput. Model. Eng. Sci. 2019, 119, 5–34. [Google Scholar] [CrossRef] [Green Version]
  17. Richter, T.; Wick, T. Finite elements for fluid–structure interaction in ALE and fully Eulerian coordinates. Comput. Methods Appl. Mech. Eng. 2010, 199, 2633–2642. [Google Scholar] [CrossRef]
  18. Wu, J.; Zheng, S.; Wang, C.; Yu, Z. Study on pipeline self-excited vibration using transient fluid-structure coupling method. Int. J. Adv. Manuf. Technol. 2020, 107, 4055–4068. [Google Scholar] [CrossRef]
  19. Wang, Z.; He, Y.; Li, M.; Qiu, M.; Huang, C.; Liu, Y.; Wang, Z. Fluid−Structure Interaction of Two-Phase Flow Passing Through 90°Pipe Bend Under Slug Pattern Conditions. China Ocean. Eng. 2021, 35, 914–923. [Google Scholar] [CrossRef]
  20. Benedikt, S.; Christoph, A.; Wolfgang, A. Monolithic cut finite element–based approaches for fluid-structure interaction. Int. J. Numer. Methods Eng. 2019, 119, 757–796. [Google Scholar] [CrossRef] [Green Version]
  21. Gu, Z.; Bai, C.; Zhang, H. Stochastic Finite-Element Modeling and Dynamic Characteristics Analysis of Pipe-Conveying Fluid. J. Vib. Eng. Technol. 2019, 7, 251–259. [Google Scholar] [CrossRef]
  22. Andrade, D.; Freitas, R.; Tijsseling, A. A new model for fluid transients in piping systems taking into account the fluid–structure interaction. J. Fluids Struct. 2022, 114, 103720. [Google Scholar] [CrossRef]
  23. Liang, C.; Guo, Z.; Wang, C. The Connection between flow pattern evolution and vibration in 90-degree pipeline: Bidirectional fluid-structure interaction. Energy Sci. Eng. 2022, 10, 308–323. [Google Scholar] [CrossRef]
  24. Singh, K.; Sadeghi, F.; Russell, T.; Lorenz, S.J.; Peterson, W.; Villarreal, J.; Jinmon, T. Fluid–Structure Interaction Modeling of Elastohydrodynamically Lubricated Line Contacts. J. Tribol. 2021, 143, 091602. [Google Scholar] [CrossRef]
  25. Teng, Z.; Liu, Q.; Ten, Y.; Zhao, Y.; Ji, J. Seismic response of buried oil pipeline based on heat fluid-solid multi-fields coupling. J. Northeast. Pet. Univ. 2021, 45, 99–110. [Google Scholar] [CrossRef]
  26. Bhavana, V.; Samit, R.; Prishati, R. Seismic response of an elevated aqueduct considering hydrodynamic and soil-structure interactions. Int. J. Adv. Struct. Eng. 2016, 8, 53–71. [Google Scholar] [CrossRef] [Green Version]
  27. Li, Q.; He, S. Research on Effect Factors of Mechanical Response of Cross-Fault Buried Gas Pipeline Based on Fluid-Structure Interaction. J. Press. Vessel. Technol. 2021, 143, 061402. [Google Scholar] [CrossRef]
  28. Vieir, J.; Akhiiartdinov, A.; Sævik, S.; Larsen, C.; Nydal, O. Two-way coupled fluid-structure interaction of gas-liquid slug flow in a flexible riser: Small-scale experiments and simulations. Multiph. Sci. Technol. 2019, 31, 17–43. [Google Scholar] [CrossRef]
  29. Deng, Y.; Guo, Q.; Xu, L. Effects of Pounding and Fluid–Structure Interaction on Seismic Response of Long-Span Deep-Water Bridge with High Hollow Piers. Arab. J. Sci. Eng. 2019, 44, 4453–4465. [Google Scholar] [CrossRef]
  30. Pan, Y.; Zhong, M. Implementation of the additional mass method in ANSYS. J. Comput. Appl. 2003, 23, 448–449. [Google Scholar]
  31. Peng, J.; Xi, D.; Feng, X. An ALE formulation for compressible flows based on multi-moment finite volume method. Eng. Appl. Comput. Fluid Mech. 2018, 12, 791–809. [Google Scholar] [CrossRef]
Figure 1. Schematic diagram of the prototype structure of the cable-stayed pipe bridge and the oil and gas transmission pipeline (unit: m).
Processes 11 00313 g001aProcesses 11 00313 g001b
Figure 2. Additional-mass-dynamics analysis of oil and gas transmission pipe.
Processes 11 00313 g002
Figure 3. Finite element model and establishment method of an oil and gas transmission pipeline by the additional-mass method.
Processes 11 00313 g003
Figure 4. Flow-solid coupling dynamics analysis of oil and gas transmission pipeline.
Processes 11 00313 g004
Figure 5. Finite element model of oil transmission pipeline calculation based on fluid–solid coupling.
Processes 11 00313 g005
Figure 6. (a) The displacement response cloud atlas of the pipeline model with the fluid–structure coupling effect; (b) the displacement response cloud atlas of the pipeline model with the additional-mass method.
Processes 11 00313 g006
Figure 7. (a) The acceleration response cloud atlas of the pipeline model with the fluid–structure coupling effect; (b) the acceleration response cloud atlas of the pipeline model with the additional-mass method.
Processes 11 00313 g007
Figure 8. Schematic diagram of the cross-sectional location of the oil and gas transmission pipeline.
Processes 11 00313 g008
Figure 9. Displacement response time history curve of the left platform pipeline cross-section.
Processes 11 00313 g009
Figure 10. Displacement response time history curve of the right platform pipeline cross-section.
Processes 11 00313 g010
Figure 11. Acceleration response time history curve of the left platform pipeline cross-section.
Processes 11 00313 g011
Figure 12. Acceleration response time history curve of the right platform pipeline cross-section.
Processes 11 00313 g012
Figure 13. Seismic displacement response (a) Pipeline cross-section 1 displacement response time history curve; (b) pipeline cross-section 2 displacement response time history curve; (c) pipeline cross-section 3 displacement response time history curve; (d) pipeline cross-section 4 displacement response time history curve; (e) pipeline cross-section 5 displacement response time history curve; (f) pipeline cross-section 6 displacement response time history curve.
Processes 11 00313 g013
Figure 14. Seismic acceleration response (a) Pipeline cross-section 1 acceleration response time history curve; (b) pipeline cross-section 2 acceleration response time history curve; (c) pipeline cross-section 3 acceleration response time history curve; (d) pipeline cross-section 4 acceleration response time history curve; (e) pipeline cross-section 5 acceleration response time history curve; (f) pipeline cross-section 6 acceleration response time history curve.
Processes 11 00313 g014aProcesses 11 00313 g014b
Table 1. Parameters of the cable-stayed pipe bridge.
PartMaterialElastic Modulus (Pa)Poisson’s RatioDensity (Kg/m3)Spec
PipeX602.06 × 10110.37850Φ711 × 12.7 mm
Supportrubber support0.78 × 1090.470.94
Joist beamQ3452.1 × 10110.37850
Main TowerQ3452.1 × 10110.37850
Cable6 × 37galvanized steel wire rope2.06 × 10110.35200Φ25.5, Φ36, Φ42, Φ45
Table 2. Peak displacement response of the pipeline cross-section at the platform (unit: m).
Section PositionPoint APoint BPoint CPoint D
Fluid–Solid CouplingAdditional MassFluid–Solid CouplingAdditional MassFluid–Solid CouplingAdditional MassFluid–Solid CouplingAdditional Mass
Left platform0.059−0.0810.061−0.0890.059−0.0860.057−0.083
Right platform−0.0500.081−0.0530.084−0.0520.081−0.0500.078
Table 3. Peak acceleration response of the pipe section at the platform (unit: m/s2).
Section PositionPoint APoint BPoint CPoint D
Fluid–Solid CouplingAdditional MassFluid–Solid CouplingAdditional MassFluid–Solid CouplingAdditional MassFluid–Solid CouplingAdditional Mass
Left platform−6.387.95−6.558.07−6.388.02−6.107.90
Right platform6.04−7.386.247.596.01−7.455.82−7.46
Table 4. Peak of displacement response of different pipeline cross-sections (unit: m) – left platform.
SectionPoint APoint BPoint CPoint D
Fluid–Solid CouplingAdditional MassFluid–Solid CouplingAdditional MassFluid–Solid CouplingAdditional MassFluid–Solid CouplingAdditional Mass
1−0.4720.170−0.4700.1650.4710.1680.4370.172
2−0.5280.336−0.5270.332−0.5280.336−0.5300.340
3−0.5490.497−0.5430.492−0.5490.497−0.5510.501
4−0.6050.638−0.6030.634−0.6050.638−0.6070.642
5−0.6390.751−0.6370.747−0.6390.751−0.6410.756
6−0.6600.825−0.6580.821−0.6610.826−0.6630.830
Table 5. Peak of displacement response of different pipeline cross-sections (unit: m) – right platform.
SectionPoint APoint BPoint CPoint D
Fluid–Solid CouplingAdditional MassFluid–Solid CouplingAdditional MassFluid–Solid CouplingAdditional MassFluid–Solid CouplingAdditional Mass
143.96216.01843.71415.70943.96415.88944.21916.214
248.11523.59645.02123.25545.20023.59944.84124.079
347.85947.08247.57446.53647.85947.09548.14247.622
449.20859.93848.86259.38149.20659.95949.54660.012
550.00169.73449.65569.06650.00969.76150.36270.415
652.53072.09152.32473.49552.54371.90952.75774.712
Disclaimer/Publisher’s Note: The statements, opinions and data contained in all publications are solely those of the individual author(s) and contributor(s) and not of MDPI and/or the editor(s). MDPI and/or the editor(s) disclaim responsibility for any injury to people or property resulting from any ideas, methods, instructions or products referred to in the content.