Abstract
An experimental investigation of the characteristics and transformation mechanism of Jimsar oil shale and derived shale oil was conducted using a solid-state nuclear magnetic resonance spectrometer (13C NMR), Fourier transform infrared spectroscopy (FT-IR), liquid 1H NMR, and gas chromatography-mass spectrometry (GC-MS) techniques. The carbon skeleton structure of Jimsar oil shale is mainly composed of aliphatic carbons (70.5%), mostly containing straight-chain methylene (CH2), and aromatic carbon (29.31%). Derived shale oil is primarily made of aliphatic compounds that are dominated by n-alkanes and alkenes (comprising more than 70%). The nature of the conversion of oil shale to shale oil is the decomposition of aliphatic groups dominated by methylene structures in organic matter. Additionally, as the heating rate is increased, the secondary cracking reactions in shale oil could increase the contents of short-chain alkanes and alkenes, which could then enhance the secondary polymerization reactions that increase the generation of cycloalkanes and aromatic compounds. Shale oil demonstrates a maximum yield value of 6.32%, the largest carbon, hydrogen, and nitrogen contents, and a minimum oxygen content at the pyrolysis heating rate of 5 °C/min.
1. Introduction
Oil shale, a non-renewable fossil energy source, has been recognized by various countries around the world as a precious supplement and replacement energy source for traditional petroleum [1,2,3,4]. Over the years, a number of different industrial applications have been found for oil shale, including making shale oil and providing electricity or heat [5,6,7,8]. Developing efficient and inexpensive ways to develop oil shale as an alternative energy source has drawn the interest of the global community in an era of severe energy shortages and rising oil prices [9,10,11].
The carbon skeleton structure analysis has been an useful method for exploring the reaction mechanism of organic matter. Analysis using a solid-state nuclear magnetic resonance spectrometer (NMR) could identify the carbon types of oil shale by detecting their resonance absorption peaks. In recent years, with the help of the 13C NMR technique, there have been several researchers working to analyze the distribution of carbon skeleton structures (such as primary carbon, secondary carbon, tertiary carbon, quaternary carbon, etc.) of raw oil shale. However, few works have investigated the carbon skeleton structure of spent shale obtained under different pyrolysis conditions, meaning that the conversion of carbon structures during oil-shale decomposition has not been sufficiently verified. For example, You et al. [12] investigated the carbon skeleton of Huadian oil shale kerogen using 13C NMR and showed that the carbon skeleton is dominated by aliphatic carbon and exists mainly as straight methylene chains. Bouamoud et al. [13] studied oil shales from Central Kongo (CK) in the Democratic Republic of the Congo, and observed that the carbon skeleton of the oil shale is predominantly aliphatic with methylene chains and that aliphatic groups dominate over aromatic groups. Although oil shale carbon structures from different countries have the similar composition, some structural differences exist based on the data obtained for each carbon function. Hence, more work should be done to study the transformation process of carbon skeleton structure during the pyrolysis process to prove the conversion nature of oil shale to shale oil.
The study of shale oil properties also has an important part revealing the characteristics and transformation mechanism of oil shale to shale oil [14,15,16,17]. You et al. [18] studied the gaseous products (CH4, H2, CO2, CO, and shale oil) of three Chinese oil shale based on structural characteristics using the TG-FTIR-MS technique, and considered the gas to be dependent on the structure of several precursors and that shale oil is primarily derived from the cleavage of aliphatic structures in the kerogen. Wang et al. [19] investigated the distribution of various types of hydrogen and carbon atoms and related structural parameters in >300 °C fractions using 1H nuclear magnetic resonance and 13C nuclear magnetic resonance; they found that the hydrogen and carbon atoms mainly existed in the aliphatic hydrocarbons. Wang et al. [20] studied the fraction changes of shale oil with four different heating rates (5, 8.5, 12, and 20 °C/min) and found that an increase in the heating rate led to a decrease in the alkane content, aliphatic hydrocarbon content, and aromatic hydrocarbon content. Al-Harahsheh et al. [21] discovered that as the heating rate (0.2–6 °C/min) increased, the aliphatic content in shale oil also increased and the aromatic content decreased.
Jimsar is the first national demonstration area of land-phase shale oil in China, where the oil-shale resource is estimated at more than 1.112 billion tons. To study the characteristics and transformation mechanism of Jimsar oil shale and derived shale oil, this paper conducts a series of experiments using various advanced techniques. Solid-state 13C NMR was used to analyze the carbon structure qualitatively and quantitatively in the oil shale and spent shale. FT-IR (Fourier Transform infrared spectroscopy) was to obtain the composition of oil shale and the aliphatic and aromatic structure in oil shale and spent shale. Liquid NMR (1H NMR) and gas chromatography–mass spectrometry (GC-MS) were conducted to characterize the aliphatic and aromatic groups in shale oil. The main objective of this work is to understand the properties of the Jimsar oil shale and the mechanism of shale-oil generation through these measurements, and to study the effect of the application of heating rates (2, 5, 8, and 10 °C/min) on shale-oil characteristics.
2. Experimental
2.1. Samples
Oil-shale samples for use within this work were obtained from the Jimsar oil shale mineralized belt in northwestern China [22]. The raw oil-shale samples were crushed and screened to a size of 100 mesh. The characteristics of oil shale are presented in Table 1. Shale oil and spent shale samples were obtained from the low-temperature pyrolysis experiments.

Table 1.
Characteristics of Jimsar oil shale samples (wt. %).
2.2. Pyrolysis Experiments
Oil-shale pyrolysis experiments were performed in a low-temperature aluminum retort without an inert gas purge. Approximately 50 ± 0.1 g of each sample was heated from room temperature to 520°C at a heating rate of 2, 5, 8, and 10 °C/min, and held at that temperature for 20 min. The yields of the pyrolysis products obtained at different heating rates were calculated as follows. (1) The mass difference of the product in the conical flask before and after the experiment is the sum of the masses of shale oil and water, (2) the shale-oil and water yields were calculated by two sets of experiments; one set obtained the shale-oil product by standing and one set obtained the water yield by the azeotropic boiling of xylene to obtain the shale-oil yield, (3) the spent-shale yield was obtained by weighing the mass of the remaining solids after pyrolysis, and the gas yield and losses were obtained by differential subtraction method, and (4) the obtained pyrolysis-product yields were averaged from three experiments.
2.3. FT-IR Experiments
An FTIR analysis for solid samples was carried out using a Thermo Nicolet 6700 instrument. The solid samples were tested using the KBr tablet method. The mass ratio of the solid sample to KBr was 1:100, and the spectrum was collected in the 400–4000 cm−1 wavenumber range.
2.4. Ultimate Analysis
The analysis of the CHNS elements of the shale-oil samples was carried out using a Vario EL cube CHNOS elemental analyzer from Germany.
2.5. GC MS Experiments
The GC-MS analysis of the shale-oil samples was performed using a 7890A-5975C instrument (Agilent Technologies, USA). The chromatographic used in the assay was an HP-5MS (30.0 m × 250 μm, 0.25 μm). The oven was initially held at 40 °C for 3 min, and the temperature was then increased to 300 °C at 4.0 °C/min and kept at the final temperature for 10 min. For MS detection, the ionization potential was 70 EV, the mass range of the scan was between 30 and 600 M/Z, and the ion source temperature was 230 °C.
2.6. NMR Experiments
Solid-state 13C NMR spectroscopy of the Jimsar oil shale and its spent shale was measured on a Bruker 400 M spectrometer at 100.62 MHz at room temperature. The experimental resonance frequency was 100.62 MHz, the spectral width was 24kHz, and the number of scans was 3600.
Shale oil 1H NMR was also performed on a liquid spectrometer model Bruker 400 M. The solvent used was deuterated chloroform (CDCl3), and the measurement temperature to 25 °C. The resonance frequency of the 1H NMR was 400.15 MHz, and the spectral width was 8 kHz. Furthermore, the scan number of the 1H-NMR was 64.
3. Results and Discussion
3.1. Solid Analysis
3.1.1. 13C NMR Analysis
The 13C NMR spectra of Jimsar oil shale and its spent shale, obtained at a heating rate of 5 °C/min, are illustrated in Figure 1 and provide the qualitative carbon characteristics. Similar to the structures of oil shale from other mines [12,13,23], the Jimsar oil shale is made up of aliphatic carbon (0–90 ppm), aromatic carbon (90–165 ppm), and carboxy carbon (165–220 ppm). Additionally, it is abundantly visible from Figure 1a that aliphatic and aromatic carbons play a major role in the carbon skeleton structure of the Jimsar oil shale.
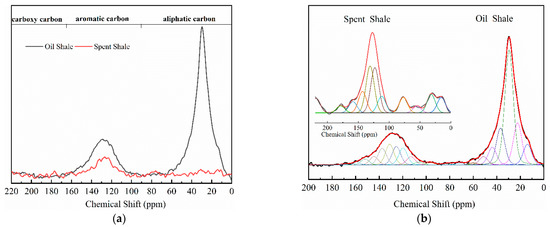
Figure 1.
Solid-state 13C NMR spectra (a) and fitted curves (b) of Jimsar oil shale and its spent shale, obtained at a heating rate of 5 °C/min.
Table 2 emphasizes that the carbon structure of Jimsar oil shale is mainly composed of methylene carbon (22–36 ppm), which has a 44.61% relative content. Meanwhile, by combining the average chain length (Cn) in Table 3 with the study of Wang et al. [23], it can be concluded that the carbon structure of Jimsar oil shale is mainly in the form of long chains. Several researchers [24,25,26] also discovered that the aliphatic carbon is dominated by the methylene structure in oil shale and its kerogen from different mining areas. This suggests that the Jimsar oil shale has a high capacity for liquid hydrocarbon production. Additionally, the carbon skeleton parameters shown in Table 3 indicate that aromatic carbon (90–165 ppm) is an essential part of the carbon structure of Jimsar oil shale, accounting for 29.31% of the total carbon.
Table 2.
Displacement and relative content of different types of carbon in Jimsar oil shale and its spent shale, obtained at different heating rates.
Table 3.
Distribution of structural carbons in the 13C NMR spectra of Jimsar oil shale and its spent shale, obtained at different heating rates.
It can be observed from Figure 1 that the aliphatic carbon spectrum of raw oil shale almost disappeared through the pyrolysis process. Table 2 and Table 3 show that the relative content of the methylene and methine in the aliphatic carbon groups (fal) of raw oil shale decreased substantially as the raw oil shale conversed to spent shale. The aromatic carbon spectrum varied slightly during the pyrolysis process. The main carbon structures of spent shale are aromatic carbon groups (far), which are more than 60% of the content. Additionally, the ratio of farB to farC changed from 1:1 to more than 2:1, which indicates that the co-existing monocyclic and polycyclic forms of aromatic carbon in oil shale changed to a dominant polycyclic form after the pyrolysis reaction. The comparison of the 13C NMR results demonstrates that the nature of oil-shale decomposition is that the aliphatic carbon in oil shale decomposes into gases and shale oil, and the aromatic carbon in oil shale condenses to fixed carbon.
In addition, Table 3 shows that the average chain length of the carbon structures in the spent shale gradually decreased with the increase in the heating rate, which reveals that the increased heating rate contributed to the pyrolysis of the long-chain carbon structure of the oil shale.
3.1.2. FT-IR Analysis
Several structural features of aliphatic, aromatic, and minerals can also be identified by FT-IR techniques. The bands near 450–550 cm−1 and the bands near 1000–1100 cm−1 in Figure 2 are probably attributable to any silicate mineral, including quartz, clay mineral kaolinite, and montmorillonite [23,27]. The absorption peak of the spectra at 796 cm−1 is due to Si-O-Si bond vibrations. A characteristic band of CO32- at 1437 cm−1 is also observed in the Jimsar oil shale spectra on the basis of the study of Alstadt et al. [28] Hence, the Jimsar oil shale also contains calcite-type carbonate minerals. Additionally, it is worth noting that there is a band at 425 cm−1 in the FT-IR spectrum of Jimsar oil shale (Figure 2), which may be dedicated to the presence of pyrite.
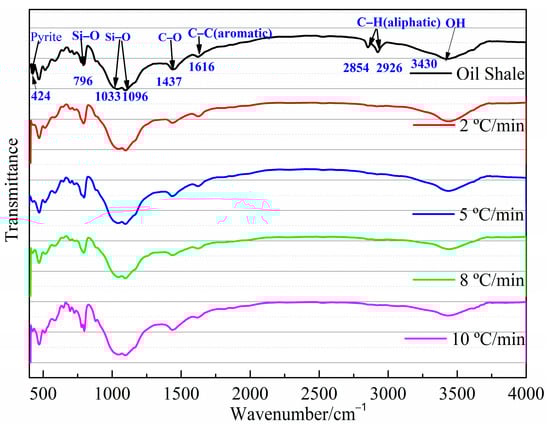
Figure 2.
FT-IR spectra of Jimsar raw oil shale and its spent shale.
The aliphatic structure (3000~2800 cm−1) and aromatic structure (900~700 cm−1) in the Jimsar oil shale is relatively tiny when compared to minerals [23,29,30,31]. The aliphatic region was pyrolyzed completely as the oil shale underwent pyrolysis at different heating rates. However, the spectral range of 900–700 cm−1 for the spent shale obtained at different heating rates was unchanged when compared to that of the raw oil shale. The two spectral ranges in the oil shale and spent shale, from 3000 cm−1 to 2800 cm−1 and 900 cm−1 to 700 cm−1, are fitted separately to further clarify the effect of pyrolysis on the aliphatic and aromatic regions, as is shown in Figure 3 and Figure 4.
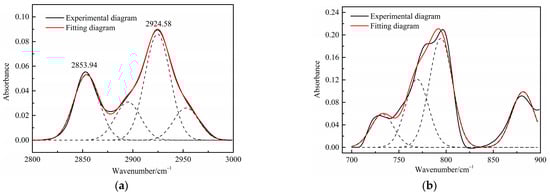
Figure 3.
Curve-fitted FT-IR spectra of the aliphatic C–H stretching bands and (a) aromatic out-of-plane C-H stretching vibration (b) of oil shale.
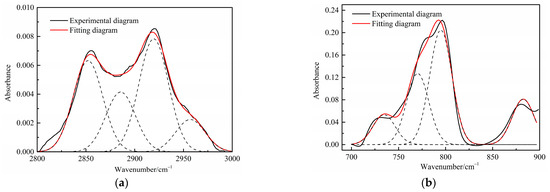
Figure 4.
Curve-fitted FT-IR spectra of the aliphatic C–H stretching bands and (a) aromatic out-of-plane C-H stretching vibration (b) of spent shale obtained at a heating rate of 5 °C/min.
Table 4 presents the contents of the aliphatic functional groups in the spectral range of 2800–3000 cm−1. It is noticeable in Table 4 and Figure 3a that the Jimsar oil shale exhibits two prominent peaks at 2853.94 cm−1 (27.03%) and 2924.58 cm−1 (43.83%), which could be attributed to the symmetric and anti-symmetric-CH2 stretching, respectively. This indicates that methylene is the major functional group in the aliphatic structure. This is similar to the structure of oil shales in other mines. [23,24] This result further evidences that aliphatic hydrocarbons in the Jimsar oil shale exist primarily in the form of long chains. As the raw oil shale was pyrolyzed, the functional group in the aliphatic region of the spent shale is still dominated by methylene. However, the area of the aliphatic region of the spent shale obtained at different heating rates was much smaller than that of the raw oil shale and decreased gradually with an increasing heating rate. The results indicate that the pyrolysis of the oil shale aliphatic was essentially complete, and the increased heating rate contributed to oil shale pyrolysis. Additionally, the pyrolysis process had a considerable impact on the content of methine (-R2CH), anti-symmetric methylene (R2CH2), and anti-symmetric methyl (R2CH3) of the oil shale functional group. The content of methine (-R2CH) and anti-symmetric methylene (R2CH2) decreased obviously at different pyrolysis heating rates. These results are consistent with the solid 13C NMR analysis in the above work.
Table 4.
Variation of functional groups during pyrolysis in the aliphatic region of the Jimsar oil shale.
The C-H outside the aromatic plane is mainly caused by the stretching vibration of the adjacent H deformation. [19] The contents of different substitution patterns of the aromatic rings in Jimsar oil shale are shown in Table 5. The raw oil shale has four peaks in this region, representing three different substitution patterns: di-substitution, tri-substitution, and penta-substitution. The substitution patterns of spent shale obtained at different pyrolysis heating rates also consist of di-substitution, tri-substitution, and penta-substitution. The content of the penta-substitution in spent shale decreased gradually with the increase in the pyrolysis heating rate, while the content of tri-substitution decreased firstly and then increased, reaching a minimum value of 71.16% at the heating rate of 5°C/min. This was probably the result of cyclization of aliphatic chains, the dehydroaromatization of cycloalkanes, and the substitution of positioned groups on aromatic rings with the increasing heating rates. Additionally, there is also a remarkable discovery in Table 5 that the relative area of the aromatic region in spent shale increased obviously with the increase in heating rate. These results are consistent with the above 13C NMR analysis, suggesting that the aromatic region in the organic matter is hardly cleaved to produce the oil and gas during the pyrolysis of oil shale. Additionally, the increase in the aromatic area may be attributed to condensation reactions of the aromatic functional groups during the oil-shale pyrolysis or to reactions such as aliphatic chain cyclization and cycloalkane dehydro-aromatization.
Table 5.
Variation of functional groups during pyrolysis in the aromatic region of the Jimsar oil shale.
3.2. Shale Oil Analysis
3.2.1. Yield of Shale Oil
The yields of pyrolysis products derived at different heating rates are shown in Figure 5. As the heating rate increased from 2 to 5 °C/min, the shale oil yield increased obviously from 5.44 to 6.32 wt.%. This is in accordance with research reported by Nazzal [32]. Furthermore, Nazzal [32] and Wang et al. [20] observed that the yield of shale oil increased as the heating rate increased from 5 °C/min to 12 °C/min. However, in this work, the oil yield decreased by approximately 0.42 wt.% and 0.64 wt.%, respectively, as the heating rate increased to 8 and 10 °C/min. The decrease in the oil yield was mainly caused by the tempestuously generation of pyrolysis gas at the end of pyrolysis. The gas generation temperature increases with the increase in the heating rate due to the thermal hysteresis, and the pyrolysis gas generated at the final temperature range cannot be completely exported due to the absence of an inert gas purge, which increases the occurrence of secondary reactions. Additionally, the pyrolysis gas cannot be completely cooled in the ice–water mixture due to the bulk pyrolysis gas flow, causing the shale oil yield to decrease while the gas and loss yield increase.
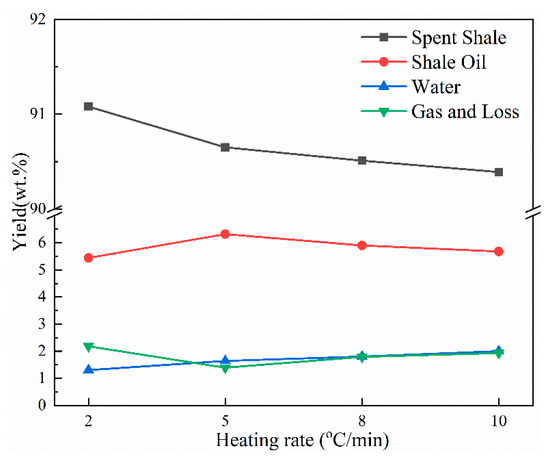
Figure 5.
Yields of pyrolysis products of Jimsar oil shale at different heating rates.
In addition, the water yield increased gradually and the yield of spent shale decreased gradually with the increase in the heating rate, representing that the aliphatic carbons in oil shale could pyrolyze more completely with a higher heating rate. These results correspond to the solid 13C NMR and FT-IR analyses of the aliphatic structure of oil shale and its spent shale.
3.2.2. Ultimate Analysis of Shale Oil
Table 6 shows the contents of carbon, hydrogen, oxygen, nitrogen, and sulfur, as well as the atomic H/C ratio of the shale oil derived at different pyrolysis heating rates.
Table 6.
Ultimate analysis of the shale oil derived at different heating rates (wt.% of the shale oil).
The carbon, hydrogen, and nitrogen contents of shale oil first increased firstly and then decreased as the heating rate increased from 2 to 10 °C min−1, reaching a maximum at 5 °C min−1 with 84.7 wt.%, 11.10 wt.%, and 2.19 wt.%, respectively. The relative contents of carbon and hydrogen in Table 6 are analogous to the variation of the shale-oil yield with the heating rate shown in Figure 5, suggesting that the carbon and hydrogen contents of shale oil are dependent on the yield. The H/C ratio in shale oil remained essentially constant as the heating rate increased. This is different to the findings of Nazzal [32] and Wang et al. [20], who reported that the carbon, hydrogen and nitrogen contents increased and the H/C and oxygen contents decreased with the increase in the heating rate to above 5 °C min−1. This difference may be attributed to the retained pyrolyzed gas, which had not completely discharged out of the aluminum retort during the violent generation period due to the thermal hysteresis in larger heating rates, which increases the chance of secondary reactions.
Wang et al. [20] suggested that the sulfur content in shale oil is not affected by the heating rate (in the argon atmosphere) due to its entanglement with metal oxides and the nature of chemical bonding with hydrocarbons. However, Table 6 shows that the sulfur content of the shale oil decreased with the increase in heating rate. In this work, this may have been caused by the secondary reaction of the pyrolysis products in the retort at a higher pyrolysis heating rate.
3.2.3. 1H NMR Analysis of Shale Oil
The 1H NMR spectra of derived shale oil obtained at different heating rates are similar. Figure 6 shows the 1H NMR spectra of shale oil derived at 10 °C/min. On the basis of the previous work [22], this paper further discussed the effects of the heating rate on hydrogen distribution in shale oil (including alkenes, cycloalkanes, etc.) according to the analytical methods suggested by Chi et al. [33]. The method of 1H NMR analysis of shale oil in this paper improves the spectral classification when compared to previous methods. The attributions of the chemical shifts of the spectra are listed in Table 7.
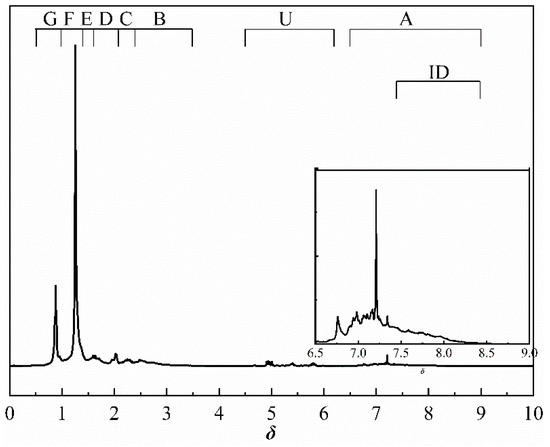
Figure 6.
1H NMR spectrum of shale oil derived at 10 °C/min.
Table 7.
Distribution of hydrogen of shale oil derived at different heating rates.
The methylene group within region F is the predominant hydrogen species in shale oil, and the relative contents of region F at different heating rates are greater than 45%. This verifies the results of the solid 13C NMR and FT-IR analyses of oil shale and its spent shale, which indicate that the main source of derived shale oil is from the pyrolysis of the methylene of the aliphatic group in oil shale. The methyl content of the corresponding region G is relatively tiny and accounts for about one-third of the methylene content. The variation trends of F and G have the same regularity in that the relative content decreased with the increase in the heating rate. The possible explanation for this is that the long-chain aliphatic groups in shale oil underwent reactions such as cleavage with the increasing heating rates. This is consistent with other studies on the effect of heating rates on shale oil [20,32]. The content of aromatic hydrogen (region A) is relatively lower than that of F and G. This is consistent with the 13C NMR analysis of the oil shale that yields much less aromatic carbon than aliphatic carbon. Additionally, regions B and C in Table 7 represent the alkyl protons of the aromatic rings α-CH2 and α-CH3. It can be found that the relative content of region B is more significant than that of region C. This is another verification that the hydrogen in shale oil is mainly from the pyrolysis of methylene hydrogen in raw oil shale. Differing from the variation trends of F and G, the contents of A, B, and C increased with the increase in heating rate. This may be because the aromatic compounds in shale oil are mainly in the form of aromatic rings combined with aliphatic chains, which are more susceptible to cleavage than aromatic rings. This suggests that the increase in heating rate contributes to the increase in aromatic contents. A similar regularity was found by Lu et al. [22] and Nazzal [32].
Similar to aromatic hydrogen, the relative contents of alkene hydrogen (region U) and cycloalkane hydrogen (region D) both increased with the increase in heating rate. The increase in alkene content (region U) is ascribed to the intensified cracking reactions of shale oil with the increased heating rate during pyrolysis: aliphatic long-chain alkanes would crack into alkenes and shorter alkyl groups [34,35]. Additionally, the increase in cycloalkane content (region D) is caused by the increase in alkene content (region U), due to the fact that cycloalkanes were produced partly by separating cycloalkyl groups from kerogen and partly through the cyclization reactions of alkanes and alkenes [34,35].
The region H stands for isomeric alkanes hydrogen. Similar to the variations of F and G, the isomeric alkanes hydrogen decreased with the increase in heating rate.
3.2.4. Shale Oil GC-MS Analysis
The constituents detected by the GC-MS experiments were qualitatively analyzed using the MS database NIST11, for which the ion-flow chromatogram obtained at a heating rate of 5 °C/min is shown in Figure 7. The relative contents of the substances were calculated using the chromatographic peak area normalization method. Due to the complex composition of shale oil, this work mainly discusses substances with a similarity of constituents of more than 80% and a relative content more significant than 0.1% (the removal of the solvent chloroform).
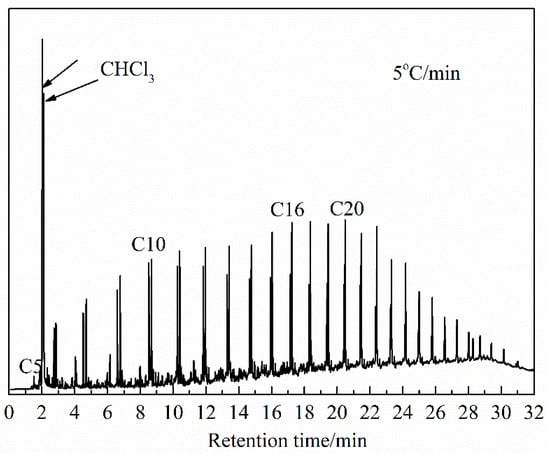
Figure 7.
Ion-flow chromatogram of shale oil, derived at a heating rate of 5 °C/min.
The results of the relative contents of the main components of shale oil are given in Figure 8. The sum content of n-alkanes and n-alkenes in shale oil obtained at different heating rates is greater than 70%. The results represent that the main components of shale oil primarily derive from the pyrolysis of the aliphatic functional group in oil shale. Aromatic and heteroatomic compounds also exist in shale oil. In this work, aromatic compounds are composed of monocyclic and polycyclic aromatic hydrocarbons, of which the polycyclic aromatic hydrocarbons mainly include fused cyclic aromatic hydrocarbons such as naphthalene and indene. Heteroatomic compounds are primarily oxygenate compounds (alcohols, aldehydes, and lipid compounds). A further analysis is performed below, mainly addressing aliphatic compounds and aromatic compounds to correspond to the shale oil analysis above.
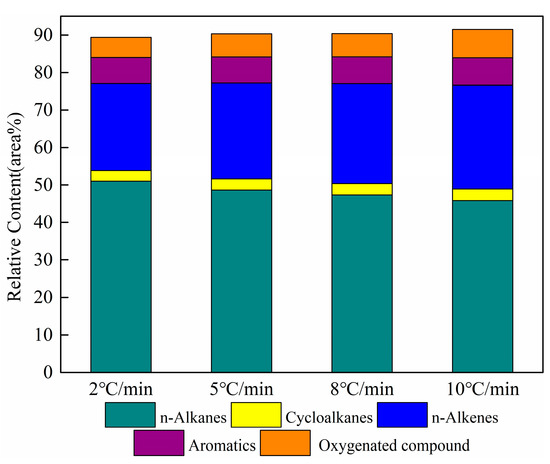
Figure 8.
Relative contents of the main components of shale oil at different heating rates.
Effect of Heating Rate on Aliphatics
As is shown in Figure 8, aliphatic compounds are the major components of shale oil. To further analyze the effect of the heating rate on the aliphatic compounds in shale oil, n-alkanes and alkenes were statistically distributed according to the carbon number as C5-C10, C11-C15, C16-C20, and C20+. Table 8 lists the n-alkanes and alkenes with different carbon numbers for shale oil, derived at different heating rates. The sum of n-alkanes and n- alkenes is referred to as aliphatic hydrocarbons in the following.
Table 8.
Carbon number distribution of n-alkanes and alkenes.
The relative content of n-alkanes in the aliphatic group of shale oil is approximately twice that of n-alkenes. Additionally, the relative content of C16-C20 in the n-alkanes is the largest, followed by C20+. This phenomenon demonstrates that the aliphatic chains are principally long-chain alkanes. Meanwhile, a notable point in Table 8 is that the relative contents of C20+ in both n-alkanes and alkenes gradually decreased with the increased heating rate. This is attributed to the secondary cracking of long-chain aliphatic hydrocarbons in shale oil with an increase in the heating rate. The same result was found by Al-Harahsheh et al. [21].
It is also apparent in Table 8 that the relative contents of n-alkanes and aliphatic groups gradually reduced when the total carbon number of alkenes increased with the heating rate. The result is consistent with the 1H NMR analysis discussed above. These results suggest that the long-chain alkanes in shale oil have a greater tendency to crack to alkenes as the heating rate increases. Many researchers have found similar trends. Campbell et al. [36,37] and Williams and Taylor [38] found that fewer alkenes at low heating rates were associated with secondary reactions. Tiwari and Deo [39] studied the impact of temperature and heating rate by using TGA-MS on the composition of shale oil, and suggested that lower temperatures favor the formation of alkanes over alkenes in oil gases. Williams and Nazzal [40] have reported that oil-shale pyrolysis at high heating rates in a fluidized bed produces shale oil with higher aromatic concentrations and lower aliphatic concentrations. Wang et al. [20] also demonstrated an increased alkene content and decreased alkane and aliphatic hydrocarbon contents in shale oil following an increased heating rate.
3.2.5. Effect of Heating Rate on Aromatics
Figure 9 shows the variation curves of aromatic and cycloalkane contents in shale oil as a function of the heating rate. The most apparent aspect of this graph is that the relative content of aromatics and cycloalkanes increased with the heating rate. The result is similar to the 1H NMR analysis and can be explained based on the increased alkene content with the increased heating rate. The analysis of shale oil in this work has revealed that shale oil will undergo secondary reactions that crack long-chain alkanes to short-chain alkanes and alkenes in the retort. Burnham [41] suggested that the gas-phase cracking reactions selectively produce oils with increasing aromatic concentrations because aromatic compounds are more thermodynamically stable and are more resistant to thermal cracking than aliphatic compounds when gas-phase oils undergo cracking reactions in which long-chain aliphatic hydrocarbons are converted to lower-molecular-weight hydrocarbons. Additionally, Williams and Nazzal [40] reported that less-severe levels of oil cracking produced mainly alkenes, and further cracking produced mainly aromatic compounds. Other researchers [42,43,44] have similarly observed that the increased alkene concentrations could cause aromatization reactions. These results suggest that, as the heating rate increased, the secondary cracking reactions in shale oil could increase the contents of short-chain alkanes and alkenes, which could then enhance the secondary polymerization reactions that increase the generation of cycloalkanes and aromatic compounds.
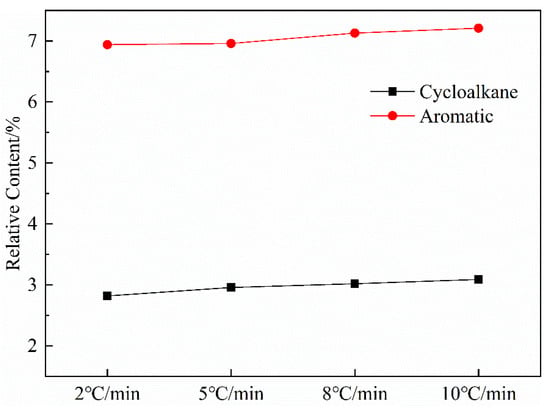
Figure 9.
Curves of aromatic hydrocarbon and naphthenic hydrocarbon content in shale oil with heating rate.
4. Conclusions
In this paper, the chemical structure and transformation mechanism of Jimsar oil shale were investigated using solid-state 13C NMR and FT-IR. the effect of the heating rate on the properties of the derived shale oil was discussed using 1H NMR and GC-MS.
(1) The carbon skeleton of Jimsar oil shale is mainly made up of aliphatic carbon (70.50% of the content) and aromatic carbon (29.31% of the content). The aliphatic structure is characterized by the predominance of methylene (CH2) carbon in the straight-chain form. The substitution mode of aromatic rings in oil shale is mainly the trisubstituted mode;
(2) The nature of oil-shale decomposition is that the aliphatic carbon/ functional group (especially the methylene) in kerogen decomposes to gases and shale oil, and the aromatic carbon/ functional group in kerogen condenses to fixed carbon;
(3) The yield of shale oil first increased and then decreased as the heating rate increased from 2 to 10 °C/min. The shale oil had a maximum yield value of 6.32%; the largest carbon, hydrogen, and nitrogen content; and the minimum oxygen content at the pyrolysis heating rate of 5 °C/min. The yield of water increased gradually, and the yield of spent shale decreased gradually with the increasing heating rate because the aliphatic carbons in oil shale were able to pyrolyze more completely at a higher heating rate;
(4) Shale oil primarily consists of aliphatic compounds dominated by n-alkanes and alkenes (the sum of which is greater than 70%). The cracking reactions of long-chain alkanes to short-chain alkanes and alkenes intensified in the pyrolysis process with the increased heating rate. Additionally, the long-chain alkanes were more preferred to be cleaved to alkenes, which contributed to the increase in the alkene content and the decrease in alkanes and aliphatic compounds;
(5) The aromatic content of shale oil is relatively small compared to the aliphatic content. Additionally, the aromatic content in shale oil increases with the increased alkene concentration in aliphatic compounds.
Author Contributions
Conceptualization, H.L. and L.P.; methodology, L.P.; validation, Q.X.; formal analysis, H.L.; investigation, H.L. and L.P.; resources, S.W.; writing—original draft preparation, H.L. and L.P.; writing—review and editing, L.P. and Y.G.; supervision, F.D. and L.P.; project administration, L.P.; funding acquisition, L.P. All authors have read and agreed to the published version of the manuscript.
Funding
This research was funded by the National Natural Science Foundation of China grant number 51904209.
Data Availability Statement
No new data were created or analyzed in this study. Data sharing is not applicable to this article.
Acknowledgments
Project 51904209 was supported by the National Natural Science Foundation of China.
Conflicts of Interest
There are no conflicts of interest to declare.
References
- Baird, Z.S.; Listak, M.; Mozaffari, P.; Oja, V. Vapor pressures of narrow gasoline fractions of oil from industrial retorting of Kukersite oil shale. Oil Shale 2020, 37, 288. [Google Scholar]
- Ding, H.; Ma, Y.; Li, S.; Wang, Q.; Hong, W.; Jiang, H.; Li, H.; Jiang, M. Pyrolytic characteristics of Fushun oil shale and its by-products. J. Therm. Anal. Calorim. 2021, 147, 5255–5267. [Google Scholar] [CrossRef]
- Guo, W.; Yang, Q.; Sun, Y.; Xu, S.; Kang, S.; Lai, C.; Guo, M. Characteristics of low temperature co-current oxidizing pyrolysis of Huadian oil shale. J. Anal. Appl. Pyrolysis 2020, 146, 104759. [Google Scholar] [CrossRef]
- Amer, M.W.; Alhesan, J.S.A.; Marshall, M.; Al-Ayed, O.S.; Awwad, A.M. Low temperature retorting of Jordanian oil shales using semi-continuous apparatus. J. Anal. Appl. Pyrolysis 2019, 142, 104639. [Google Scholar] [CrossRef]
- Hotta, A.; Parkkonen, R.; Hiltunen, M.; Arro, H.; Tiikma, T. Experience of Estonian oil shale combustion based on CFB technology at Narva Power Plants. Oil Shale 2005, 22, 381–397. [Google Scholar] [CrossRef]
- Sidorkin, V.T.; Tugov, A.N.; Vereshchetin, V.A.; Mel’Nikov, D.A. Assessment of combustion of oil shale refinery by-products in a TP-101 boiler. Therm. Eng. 2015, 62, 271–277. [Google Scholar] [CrossRef]
- Kairbekov, Z.K.; Masuda, N.; Ohshima, M.A.; Myltykbaeva, Z.K.; Miura, H. Preliminary Analysis of Oil Shale Obtained from Kalynkara in Kazakhstan. J. Jpn. Pet. Inst. 2014, 57, 192–195. [Google Scholar] [CrossRef]
- Yuan, Z.Y. Comprehensive Utilization of Oil Shale with Analysis of Material Properties. Adv. Mater. Res. 2013, 625, 247–250. [Google Scholar] [CrossRef]
- Amer, M.W.; Alhesan, J.S.A.; Marshall, M.; Awwad, A.M.; Al-Ayed, O.S. Characterization of Jordanian oil shale and variation in oil properties with pyrolysis temperature. J. Anal. Appl. Pyrolysis 2019, 140, 219–226. [Google Scholar] [CrossRef]
- Guo, W.; Zhang, X.; Deng, S.H.; Sun, Y.H.; Han, J.; Bai, F.T.; Kang, S.J.; He, W.T. Enhanced pyrolysis of Huadian oil shale at high temperature in the presence of water and air atmosphere. J. Pet. Sci. Eng. 2022, 215, 110623. [Google Scholar] [CrossRef]
- Wu, Z.H.; Xu, Z.G. Experimental and molecular dynamics investigation on the pyrolysis mechanism of Chang 7 type-II oil shale kerogen. J. Pet. Sci. Eng. 2022, 209, 109878. [Google Scholar] [CrossRef]
- You, Y.; Han, X.; Liu, J.; Jiang, X. Structural characteristics and pyrolysis behaviors of huadian oil shale kerogens using solid-state 13C NMR, Py-GCMS and TG. J. Therm. Anal. Calorim. 2018, 131, 1845–1855. [Google Scholar] [CrossRef]
- Bouamoud, R.; Mulongo-Masamba, R.; El Hamidi, A.; Halim, M.; Arsalane, S. Structural assessments of kerogen-rich oil shale from the Central Kongo formation by solid-state 13C nuclear magnetic resonance and thermal processes. J. Pet. Sci. Eng. 2022, 147, 3483–3494. [Google Scholar] [CrossRef]
- Zou, Y.R.; Sun, J.N.; Li, Z.; Xu, X.Y.; Li, M.W.; Peng, P.A. Evaluating shale oil in the Dongying Depression, Bohai Bay Basin, China, using the oversaturation zone method. J. Pet. Sci. Eng. 2018, 161, 291–301. [Google Scholar] [CrossRef]
- Zhao, S.; Sun, Y.H.; Lu, X.S.; Li, Q. Energy consumption and product release characteristics evaluation of oil shale non-isothermal pyrolysis based on TG-DSC. J. Pet. Sci. Eng. 2020, 187, 106812. [Google Scholar] [CrossRef]
- Xu, Y.; Lun, Z.M.; Pan, Z.J.; Wang, H.T.; Zhou, X.; Zhao, C.P.; Zhang, D.F. Occurrence space and state of shale oil: A review. J. Pet. Sci. Eng. 2022, 211, 110183. [Google Scholar] [CrossRef]
- Yang, D.; Wang, L.; Zhao, Y.S.; Kang, Z.Q. Investigating pilot test of oil shale pyrolysis and oil and gas upgrading by water vapor injection. J. Pet. Sci. Eng. 2021, 196, 108101. [Google Scholar] [CrossRef]
- You, Y.; Han, X.; Wang, X.; Jiang, X. Evolution of gas and shale oil during oil shale kerogen pyrolysis based on structural characteristics. J. Anal. Appl. Pyrolysis 2019, 138, 203–210. [Google Scholar] [CrossRef]
- Wang, Q.; Cui, D.; Wang, P.; Bai, J.; Wang, Z.; Liu, B. A comparison of the structures of >300 °C fractions in six Chinese shale oils obtained from different locations using 1H NMR, 13C NMR and FT-IR analyses. Fuel 2018, 211, 341–352. [Google Scholar] [CrossRef]
- Wang, S.; Liu, J.X.; Jiang, X.M.; Han, X.X.; Tong, J.H. Effect of heating rate on products yield and characteristics of non-condensable gases anf shale oil obtained by retoring dachengzi Oil Shale. Oil Shale 2013, 30, 27–47. [Google Scholar] [CrossRef]
- Al-Harahsheh, A.; Al-Ayed, O.; Al-Harahsheh, M.; Abu-El-Halawah, R. Heating rate effect on fractional yield and composition of oil retorted from El-lajjun oil shale. J. Anal. Appl. Pyrolysis 2010, 89, 239–243. [Google Scholar] [CrossRef]
- Lu, H.; Pan, L.W.; Guo, Y.; Dai, F.Q.; Pei, S.H.; Huang, J.N.; Liu, S. The effect of pyrolysis conditions on the composition of Chinese Jimsar shale oil using FT-IR, 1H-NMR and 13C-NMR techniques. Oil Shale 2022, 39, 37–60. [Google Scholar] [CrossRef]
- Wang, Q.; Ye, J.-b.; Yang, H.-y.; Liu, Q. Chemical Composition and Structural Characteristics of Oil Shales and Their Kerogens Using Fourier Transform Infrared (FTIR) Spectroscopy and Solid-State 13C Nuclear Magnetic Resonance (NMR). Energy Fuels 2016, 30, 6271–6280. [Google Scholar] [CrossRef]
- Tong, J.; Han, X.; Sha, W.; Jiang, X. Evaluation of Structural Characteristics of Huadian Oil Shale Kerogen Using Direct Techniques (Solid-State 13C NMR, XPS, FT-IR, and XRD). Energy Fuels 2011, 25, 4006–4013. [Google Scholar] [CrossRef]
- Solum, M.S.; Mayne, C.L.; Orendt, A.M.; Pugmire, R.J.; Adams, J.; Fletcher, T.H. Characterization of Macromolecular Structure Elements from a Green River Oil Shale, I. Extracts. Energy Fuels 2014, 28, 453–465. [Google Scholar] [CrossRef]
- Fletcher, T.H.; Gillis, R.; Adams, J.; Hall, T.; Mayne, C.L.; Solum, M.S.; Pugmire, R.J. Characterization of Macromolecular Structure Elements from a Green River Oil Shale, II. Characterization of Pyrolysis Products by 13C NMR, GC/MS, and FTIR. Energy Fuels 2014, 28, 2959–2970. [Google Scholar] [CrossRef]
- Yürüm, Y.; Dror, Y.; Levy, M. Effect of acid dissolution on the mineral matrix and organic matter of Zefa EFE oil shale. Fuel Process. Technol. 1985, 11, 71–86. [Google Scholar] [CrossRef]
- Alstadt, K.N.; Katti, D.R.; Katti, K.S. An in situ FTIR step-scan photoacoustic investigation of kerogen and minerals in oil shale. Spectrochim. Acta Part A Mol. Biomol. Spectrosc. 2012, 89, 105–113. [Google Scholar] [CrossRef]
- Washburn, K.E.; Birdwell, J.E. Multivariate analysis of ATR-FTIR spectra for assessment of oil shale organic geochemical properties. Org. Geochem. 2013, 63, 1–7. [Google Scholar] [CrossRef]
- Chen, B.; Han, X.; Jiang, X. In Situ FTIR Analysis of the Evolution of Functional Groups of Oil Shale During Pyrolysis. Energy Fuels 2016, 30, 5611–5616. [Google Scholar] [CrossRef]
- Chen, Y.; Furmann, A.; Mastalerz, M.; Schimmelmann, A. Quantitative analysis of shales by KBr-FTIR and micro-FTIR. Fuel 2014, 116, 538–549. [Google Scholar] [CrossRef]
- Nazzal, J.M. Influence of heating rate on the pyrolysis of Jordan oil shale. J. Anal. Appl. Pyrolysis 2002, 62, 225–238. [Google Scholar] [CrossRef]
- Chi, M.S.; Wang, Q.; Shi, J.X.; Liu, Q.; Cui, D.; Pan, S. 1H Nuclear Magnetic Resonance-Based Chemical Structure Characteristics Analysis of Huadian Shale Oil. Sci. Technol. Eng. 2018, 11, 82–87. (in Chinese). [Google Scholar]
- Huang, Y.-R.; Han, X.X.; Jiang, X.M. Comparison of fast pyrolysis characteristics of Huadian oil shales from different mines using Curie-point pyrolysis-GC/MS. Fuel Process. Technol. 2014, 128, 456–460. [Google Scholar] [CrossRef]
- Huang, Y.; Han, X.; Jiang, X.M. Characterization of Dachengzi Oil Shale fast pyrolysis by Curie-point pyrolysis-GC-MS. Oil Shale 2016, 32, 134. [Google Scholar] [CrossRef]
- Campbell, J.; Koskinas, G.H.; Coburn, T.T.; Stout, N.D. Oil shale retorting—Effects of particle size and heating rate on oil evolution and intraparticle oil degradation. Situ 1977, 2, 1–43. [Google Scholar]
- Campbell, J.H.; Koskinas, G.J.; Gallegos, G.; Gregg, M. Gas evolution during oil shale pyrolysis. 1. Nonisothermal rate measurements. Fuel 1980, 59, 718–726. [Google Scholar] [CrossRef]
- Williams, P.T.; Taylor, D.T. The molecular weight range of pyrolytic oils derived from tyre waste. J. Anal. Appl. Pyrolysis 1994, 29, 111–128. [Google Scholar] [CrossRef]
- Tiwari, P.; Deo, M. Compositional and kinetic analysis of oil shale pyrolysis using TGA–MS. Fuel 2012, 94, 333–341. [Google Scholar] [CrossRef]
- Williams, P.T.; Nazzal, J.M. Polycyclic aromatic compounds in oils derived from the fluidised bed pyrolysis of oil shale. J. Anal. Appl. Pyrolysis 1995, 35, 181–197. [Google Scholar] [CrossRef]
- Burnham, A. Chemistry of Shale Oil Cracking. In Oil Shale, Tar Sands, and Related Materials; American Chemical Society: Washington, DC, USA, 1981; 163.39-60. [Google Scholar]
- Cypres, R. Aromatic hydrocarbons formation during coal pyrolysis. Fuel Process. Technol. 1987, 15, 1–15. [Google Scholar] [CrossRef]
- Fairburn, J.A.; Behie, L.A.; Svrcek, W.Y. Ultrapyrolysis of n-hexadecane in a novel micro-reactor. Fuel 1990, 69, 1537–1545. [Google Scholar] [CrossRef]
- Depeyre, D.; Flicoteaux, C.; Chardaire, C. Pure n-hexadecane thermal steam cracking. Ind. Eng. Chem. Process Des. Dev. 1985, 24, 1251–1258. [Google Scholar] [CrossRef]


Disclaimer/Publisher’s Note: The statements, opinions and data contained in all publications are solely those of the individual author(s) and contributor(s) and not of MDPI and/or the editor(s). MDPI and/or the editor(s) disclaim responsibility for any injury to people or property resulting from any ideas, methods, instructions or products referred to in the content. |
© 2023 by the authors. Licensee MDPI, Basel, Switzerland. This article is an open access article distributed under the terms and conditions of the Creative Commons Attribution (CC BY) license (https://creativecommons.org/licenses/by/4.0/).