Abstract
A transformer is an important part of the power system. Existing transformer fault diagnosis methods are still limited by the accuracy and efficiency of the solution and excessively rely on manpower. In this paper, a novel neural network is designed to overcome this issue. Based on the traditional method of judging the ratio of dissolved gas in transformer internal insulation oil, a fast fault diagnosis model of a transformer was built with an improved probabilistic neural network (PNN). The particle swarm optimization (PSO) algorithm was used to find the global optimal smoothing factor and improve the fault diagnosis accuracy of PNN. The transformer fault diagnosis model based on improved PNN not only eliminates the influence of human subjective factors but also significantly improves the diagnosis speed and accuracy, meeting the requirements for real-time application in practical projects. The feasibility and effectiveness of the method proposed in this paper are illustrated by a case study of actual data. Through analysis and comparison, the diagnostic accuracy of the proposed method is 10% higher than that of the general BPNN and 5% higher than that of the traditional PNN on the premise of ensuring the efficiency of the solution.
1. Introduction
Under the background of rapid economic development and continuous improvement of residents’ living standards, requirements for power demand, power quality and power supply reliability are constantly improving []. In the process of power transmission, distribution and transformation, power transmission and transformation equipment, as an important hub and carrier of energy, play a pivotal role []. Among them, the normal operation of a transformer is the basis of power system security. At present, the annual failure rate of transformers can reach 3~5%. Transformer fault has gradually become the main fault of distribution networks. Damaged transformers not only increase the pressure of management costs but also affect the normal power consumption of residents’ living and production, which has become the actual problem that most often complicates power supply management. Against this backdrop, how to ensure that the power transmission and transformation equipment is in normal operation condition, find potential faults in the equipment in time and carry out rapid maintenance and equipment replacement has become a hotspot of current research [].
Fault diagnosis refers to judging whether the equipment is in a normal working state according to the operation and maintenance data fed back by monitoring equipment []. With the development and improvement in power grid monitoring systems and data collection platforms, a large amount of data reflecting the working status of equipment and its components can be easily obtained []. Based on these data, the power grid operators and relevant experts can evaluate the equipment status, determine the fault type and scope of influence, predict the changing trend of the fault and then take effective measures to eliminate the fault, determine the appropriate maintenance time and reduce the downtime loss and maintenance costs caused by the fault event [,].
In the power system, power transmission and transformation equipment play an important role and are the basis for the normal operation of the power system []. Typical transmission and transformation equipment includes transmission lines, transformers, circuit breakers and some relay protection devices. Because power transmission and transformation equipment have different characteristics, many scholars have carried out research. In this paper, the transformer is taken as the research object. The literature [] proposes a transformer fault diagnosis model using a support vector machine algorithm, establishes a hierarchical decision-making scheme based on historical statistical data and finally uses the k-means clustering algorithm to accurately approximate the final classification results. The given example illustrates the feasibility and good classification effect of this method: the literature [] proposed a transformer fault diagnosis model based on the mathematical rough set theory considering the omission or missing of monitoring information of the transformer operation state. When key information is missing, Euclidean distance and neural network are used for fault diagnosis, and the decision table constructed has the ability of self-improvement and updating. Considering the shortcomings of traditional neural networks, such as weak generalization ability, narrow scope of application, excessive dependence on training samples and long training time, the literature [] uses the extreme learning machine algorithm and has achieved good diagnosis results. According to the frequency and times of transformer faults in the system, the literature [] established a fault tree model to facilitate a system reliability evaluation. According to the different ratios of dissolved gases in transformers, the literature [] combined genetic algorithms to build a transformer fault diagnosis model.
As pointed out in the literature [,,], several types of faults that are often encountered in transformers mainly include short circuit faults, insulation damage faults and overheating faults. Among them, various short circuit faults in transformers, such as single phase to ground, two phases to ground or three phases to ground, are most serious. The insulation damage fault in transformers accounts for 70~80% of total faults, which is mainly caused by mechanical force or overheating. Overheating faults are mainly caused by abnormal currents, and the occurrence probability of such faults is 10~12%. In generally, the causes of distribution transformer faults are various. By analyzing the common faults in transformers and taking reasonable solutions and preventive measures, the losses caused by transformer faults can be minimized to ensure the safe and reliable operation of distribution lines. However, the methods mentioned above are still limited by the accuracy and speed of the solution and excessively rely on manpower. In order to solve this problem, this paper proposes a data-driven transformer fault diagnosis model, which is jointly optimized by PSO and PNN. The contribution of the paper is summarized as follows:
(1). With the help of artificial intelligence technology, this paper applies the probabilistic neural network model to transformer fault diagnosis. The combination of PNN and traditional three-ratio method can set the judgment threshold and boundary conditions more reasonably. Adjusting the original static three-ratio method to a dynamic adaptive method can improve the accuracy of the traditional method. At the same time, it can meet the need for efficient processing under a large number of data samples in engineering practice and reduce the dependence of traditional methods on manual work.
(2). When the number of samples is large, the probabilistic neural network model converges slowly and easily falls into the local optimum. Therefore, appropriate methods are needed to adjust and update parameters. Therefore, this paper uses the PSO algorithm to select the global optimal smoothing factor, which improves the applicability and accuracy of the proposed method.
The framework of the article is as follows: In Section 1, the types of transformer faults and existing diagnosis methods are introduced and their shortcomings are analyzed. In Section 2, the application of PNN in transformer fault diagnosis is introduced and the optimal smoothing factor is selected through PSO. The effectiveness and feasibility of the method proposed method are verified through numerical analysis in Section 3. Finally, Section 4 summarizes the full paper.
2. Transformer Fault Types and Existing Diagnosis Methods
2.1. Classification of Transformer Fault Types
As shown in Figure 1, below, transformer faults can be divided into the following categories []:
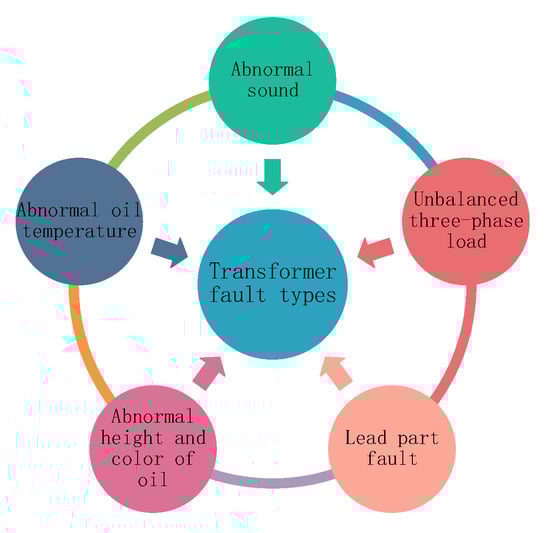
Figure 1.
Classification of transformer fault types.
- (1)
- Abnormal sound: When the transformer is in normal operation, the transformer keeps silent or emits regular noise. With a sudden increase in the load carried by the transformer, looseness of internal parts or aging of insulation performance will cause the transformer to emit noise. This kind of fault generally occurs in summer, especially when the high-temperature power load is heavy.
- (2)
- Abnormal oil temperature: The mineral oil inside the transformer not only plays the role of insulation protection but also plays the role of cooling. The reason for the high temperature of transformer mineral oil is generally either the insulation of the internal threading screw is damaged or the short circuit of the internal winding of the transformer generates a short circuit current much higher than the rated operating state, and generates a lot of heat, resulting in the abnormal temperature of the internal insulation oil of the transformer [].
- (3)
- Abnormal height and color of mineral oil inside the transformer: When the transformer is operating under high temperatures and heavy load in summer, the temperature inside the transformer is high, which makes black particles such as black carbon appear in the oil, thus causing the color of insulating oil to be too heavy. In addition, when the sealing property of the transformer decreases, the leakage and volatilization of the transformer will occur, resulting in an abnormal oil level. If the internal insulating oil of the transformer is lower than the minimum mark, manual refueling is required to maintain the thermal insulation requirements of the transformer during normal operation [].
- (4)
- Unbalanced three-phase load: When the load carried by the transformer is three-phase unbalanced, the three-phase current is often asymmetric, which leads to unbalanced three-phase voltage. It should be pointed out that when ferromagnetic resonance and turn-to-turn short circuits occur in the power system, an unbalanced three-phase load fault state will also occur [].
- (5)
- Lead part fault: Common faults of the lead part include poor contact caused by loose wiring, lead burnout caused by overcurrent, etc. In the case of such faults, it is necessary to handle the faults and cut off the power supply as soon as possible to avoid further expansion of the fault scope.
2.2. Analysis of Deficiencies in Existing Diagnostic Methods
At present, most substation and power grid maintenance personnel in China mainly use the dissolved gas analysis method to calculate the ratio of different types of gas by measuring the content of dissolved gas in transformer insulation oil, based on which personnel judge the type of transformer fault.
As shown in Figure 2, this method has the following limitations:
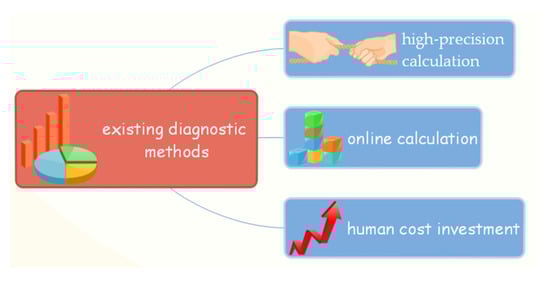
Figure 2.
Limitation of existing diagnostic methods.
- (1)
- Limitations of high-precision calculation: The accuracy of the traditional three-ratio method and Dornerburg method, derived from the dissolved gas analysis method, is not high, and the diagnosis is based on a single method, which cannot fully reflect the complex mapping relationship between transformer fault causes and fault types. Due to the differences in transformer capacity, voltage level, operation history, manufacturer and system environment, the accuracy of transformer fault diagnosis can only reach about 80%. In addition, traditional methods such as the three-ratio method can be used to analyze the nature of the fault only when the content of each component of the gas in the oil is high enough (generally, it means that it exceeds the set critical value). Therefore, if the three-ratio method is used to judge the real-time status monitoring of the transformer, it will often lead to misjudgment and unnecessary economic losses.
- (2)
- Limitations of online calculation: Traditional methods have high requirements for external environmental conditions when conducting gas composition analysis, requiring skilled operators to conduct on-site operations, which costs a lot of time and generally takes more than 3 h. On the other hand, it cannot be ignored that the longer the time spent, the change in the gas composition may be caused by the sampling and storage process of dissolved gas in the transformer, which will eventually lead to a deviation in the accuracy of the calculation results and cannot meet the requirements of online monitoring. When the internal faults in transformers develop rapidly, it is difficult for relevant operators and maintenance personnel to quickly obtain the internal dynamic information from transformers, thus causing huge economic losses.
- (3)
- Limitations of human cost investment: Traditional methods rely on skilled operators for analysis and calculation. With the growing scale of the power grid, the number of transformers increases sharply, the corresponding types and voltage levels of transformers are different and the amount of transformer status data fed back is large, which greatly increases the difficulty in fault diagnosis and analysis by staff. In the case of time constraints and numerous data dimensions, due to subjective factors such as fatigue operation, data entry and calculation errors inevitably occur.
3. Model and Application of Improved PNN
In this section, an improved PNN model is designed to realize accurate and efficient diagnosis of transformer faults. In detail, Section 2.1 gives the coding rules for the ratio of dissolved gas in the transformer according to the traditional three-ratio method. Then, Section 2.2 clearly introduces the flow chart of the selection of smoothing factor through the PSO algorithm, through which the global optimal solution can be obtained. Finally, the complete solution process is described in Section 3.3.
3.1. Introduction of PNN
Many researchers and engineers have carried out relevant research on transformer fault diagnosis. At present, the most widely used method in China is the three-ratio (SR) method [,]. The SR method is to judge the working state and corresponding fault type of the transformer by analyzing the ratio between the dissolved gases in the insulating oil and using coding technology. The coding rules and fault criteria of the SR method are shown in Table 1 and Table 2, respectively. It should be noted that the symbol ~ represents the ratio range of dissolved gas in transformer.

Table 1.
Coding rules for the ratio of dissolved gas in the transformer.
Table 2.
Coding and diagnosis methods for transformer internal fault types.
Combined with Table 1 and Table 2, relevant staff can obtain the working state of the transformer as long as they make corresponding calculations according to the monitoring data for the dissolved gas in the transformer. However, in actual operation, because of the huge amount of information and high dimensions of the monitoring data, it is inevitable that relying solely on human data entry, analysis and processing will be affected by subjective factors such as staff fatigue, carelessness and errors in recording data, which not only reduces work efficiency but also may lead to missing or even false diagnosis of transformer faults.
In order to overcome the above issues and fully exploit the value of existing monitoring information, this paper combines data monitoring and artificial intelligence technology and uses probabilistic neural network (PNN) to diagnose transformer faults. On the premise of ensuring accuracy, it improves work efficiency and eliminates the impact of human subjective factors.
After decades of development and improvement, PNN has been widely used in data classification and nonlinear regression fitting problems because of its simple structure and clear training rules. In addition, the weights of PNN are essentially the distribution of pattern samples, and the network does not need to be trained, so its solution speed is very fast, which can meet the needs of real-time fault diagnosis in the actual power grid. As shown in Figure 3, the typical structure of PNN consists of four layers, from top to bottom, namely, the input layer, schema layer, summation layer and output layer. PNN is a kind of feedforward neural network, so it has unique advantages in pattern classification. The value of the training sample is the input through the input layer. It should be noted that the sample dimension is equal to the number of neurons in the input layer. The number of neurons in the schema layer is generally the largest among the four layers, which is equal to the sum of the number of training samples for each category. The output of each schema unit of the schema layer can be calculated by Formula (1):
where x represents the input value of the input layer, wi represents the connection weight between the schema layer and input layer and represents the smoothing factor in the schema classification process.
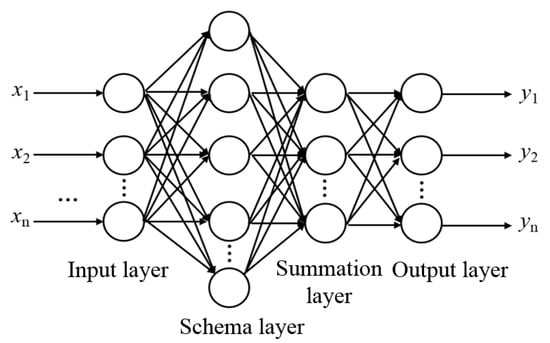
Figure 3.
Typical structure of PNN.
The third layer is the summation layer, which is mainly used to accumulate the probabilities of different schemas in the second layer, and then obtain the corresponding probability density function of the schema. The fourth layer is the output layer, which is composed of a simple threshold recognizer. Its main function is to select output neurons for the trained neural network model. Different from neurons at other layers, output layer neurons are competitive neurons. This competition is mainly reflected in that the output of the neuron with the largest probability density function is 1, and that of other neurons is 0.
Combined with the principle of the SR method described previously, this paper selects the coding combination corresponding to the three gas ratios in the transformer insulating oil as the input of the PNN. The number of input nodes in the PNN model is set to 3, which corresponds to the three-fault characteristic information of CH4/H2, C2H2/C2H4 and C2H4/C2H6, respectively. If the transformer fault type is taken as the output of PNN, then there are nine output nodes, respectively corresponding to nine fault diagnosis results, as shown in Table 2. The number of nodes in the schema layer generally depends on the capacity of the input samples.
3.2. Introduction of PSO Algorithm
As mentioned in Section 2.1, the fault diagnosis accuracy of PNN is directly related to the selection of smoothing factor . The local optimal smoothing factor selected by the empirical method or conventional optimization algorithm often leads to low accuracy of PNN. In this paper, particle swarm optimization (PSO) is adopted to find the global optimal smoothing factor and improve the accuracy of PNN. PSO is a global optimization algorithm based on stochastic optimization technology. The main process of PSO can be described as follows: initialize the current population; set the necessary parameters such as algorithm learning factor, inertia factor and maximum iteration number; establish fitness function; calculate the fitness of each particle in the population; and use the velocity and position formula to update the population iteratively and calculate the optimal solution. The random particle has two attributes: velocity and position. In the iteration process, the velocity and position of the i-th particle in the k + 1 iteration can be updated by Equations (2) and (3):
Here, is the inertia factor; and are learning factors; k is the current iteration number; is the velocity of the i-th particle in the k-th iteration; is the position of the i-th particle in the k-th iteration; and are random numbers between 0 and 1; is the extreme point location of the i-th particle in the k-th iteration; is the global extreme point position. When the set number of iterations meets the minimum limit, the PSO algorithm will terminate, as shown in the following Figure 4.
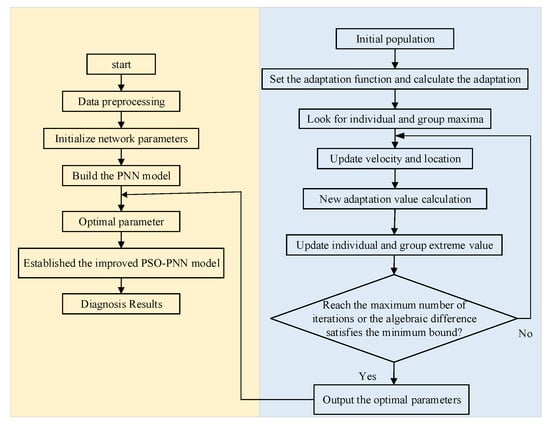
Figure 4.
Flow chart of selection of smoothing factor through PSO algorithm.
3.3. Solution Process of Improved PNN
As shown in Figure 5 below, transformer fault diagnosis mainly includes three steps: information coding, data training and fault diagnosis, of which the data training module and fault diagnosis module are the core parts of transformer fault diagnosis. The input data of PSO-PNN fault diagnosis is the dissolved gas, and the output result is the fault type. When the data sample obtained is the content of CH4, H2, C2H2, C2H4 and C2H6, it needs to be coded according to the coding rules shown in Table 1. If the data sample obtained is the ratio of the three gases, it can directly carry out data training and fault diagnosis.
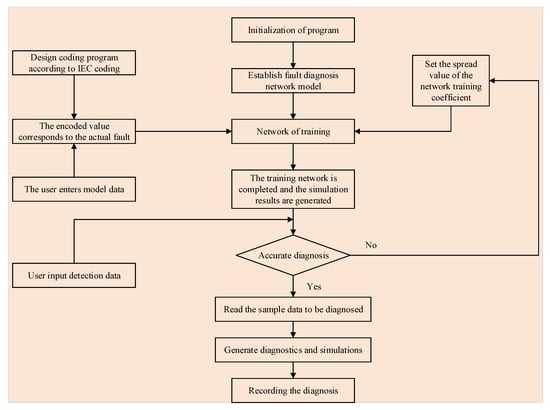
Figure 5.
Flow chart of fault diagnosis using the improved PNN.
4. Results
4.1. Fault Diagnosis Results Analysis of the Proposed Method
The accuracy of transformer fault diagnosis results based on PSO-PNN is affected by the number of samples and spread value. In this paper, the sample size is set to 20, 40, 60 and 80, respectively, and the transformer fault diagnosis results under different input sample numbers are compared and analyzed, which is shown in Table 3. It should be noted that the faults data comes from the power grid maintenance department.
Table 3.
Transformer fault diagnosis results with different input sample numbers.
As shown in Table 3, with the increase in training sample size, the fault diagnosis accuracy of PNN gradually increases. In addition, the fault diagnosis results of the 4-th, 20-th, 23-rd and 28-th groups of data have a lot of errors, which indicates that the fault diagnosis accuracy of PNN is closely related to the sample quality. The more prominent the typical characteristics of the sample and the wider the coverage, the higher the diagnosis accuracy of the model. On the contrary, when the data sample cannot reflect the typical characteristics of the fault, the diagnosis accuracy of the model is low.
On the other hand, the spread value will also affect the accuracy of fault diagnosis. In order to more intuitively analyze the impact of the spread value, this paper divides the spread value from 0.1 to 0.9 into eight values and uses the same training data and test data for verification and analysis. A total of 130 groups of data are used for analysis during the verification of numerical examples. Because of the large number of samples, they will not be expanded in detail. Figure 6 shows the fault diagnosis accuracy of PNN under different spread values.
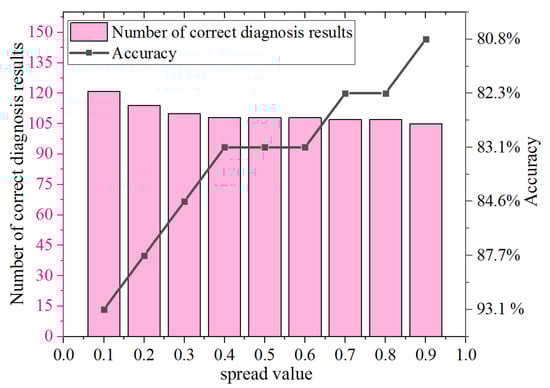
Figure 6.
Fault diagnosis accuracy of PNN under different spread values.
Obviously, it can be found that for the PNN model, the spread value and diagnosis accuracy are inversely correlated. That is, the smaller the spread value, the higher the fault diagnosis accuracy. When the spread value is 0.1, the prediction accuracy of the system is the highest, reaching 93.1%, meeting the needs of practical engineering applications.
4.2. Comparison with Other Methods
Meanwhile, in order to further illustrate the diagnosis accuracy of the PSO-PNN model, this paper compares it with the general BPNN model and traditional PNN model, where the spread value in PNN is 0.1. The comparison results are shown in Figure 7. It is not difficult to see that with the continuous increase in sample size, the diagnostic accuracy of BPNN, PNN and PSO-BPNN models for fault types is also increasing, and the diagnostic accuracy of the PSO-PNN model is significantly higher than that of BPNN and traditional PNN models. Under the same number of training samples, the accuracy of the PNN transformer fault diagnosis model used in this paper is about 10% higher than that of the general BPNN, and their junction calculation time is basically the same. Therefore, the method proposed in this paper has more advantages in practical application, especially in the case of fewer training samples. In addition, when the number of data samples is 80, the calculation time for BPNN is 64.5 s, whereas the calculation time for the method proposed in this paper is 46.5 s. This is because BPNN belongs to a feedforward neural network and uses a gradient descent iterative algorithm to update the weight parameters, which has obvious defects: firstly, the learning speed is slow, so the system calculation time increases; secondly, the learning rate is difficult to determine and easy to fall into the local minimum; finally, it is prone to over-training, resulting in the reduction of generalization performance. Especially when the number of samples is large, the convergence speed is slow, obviously.
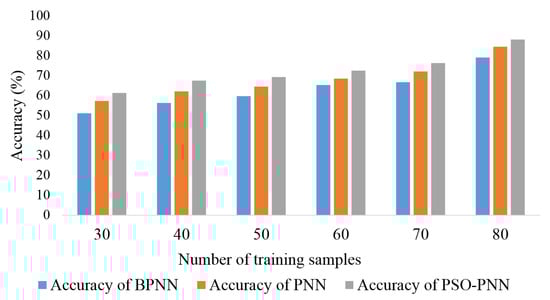
Figure 7.
Accuracy comparisons of different methods.
Considering that the support vector machine proposed in the literature [] and the extreme learning machine proposed in the literature [] are also widely used in transformer fault diagnosis, this paper analyzes and compares the two dimensions of calculation efficiency and accuracy with the proposed method. The specific calculation results are given in Table 4.
Table 4.
Transformer fault diagnosis results with other common methods.
According to the results in Table 4, the calculation accuracy of the extreme learning machine and the method proposed in this paper is higher, but the calculation time of the extreme learning machine is longer. The random initialization of the feature map in an extreme learning machine brings it the advantage of generalization, but it also means that the extreme learning machine needs more nodes than the gradient descent algorithm []. The increase in nodes leads to an increase in computing burdens. When the amount of training data is large, redundant nodes will consume additional computing resources, resulting in an increase in computing time. The support vector machine method has a fast training speed, but it also has the situation that boundary points are easy to be incorrectly classified []. It is necessary to optimize its hyperplane construction method and boundary point division problem, so its solution accuracy is low. On the other hand, although support vector machine can process high-dimensional and large amounts of data, it is more oriented to data with complex information such as pictures. Fault diagnosis based on dissolved gas in oil involves a relatively small number of features, so it cannot fully play its advantages. To sum up, the method proposed in this paper can maximize calculation accuracy on the premise of ensuring calculation efficiency.
5. Conclusions
A transformer is an important bridge for energy transmission and transformation in power systems, which is of great significance for the safe operation of the system. In order to realize the accurate diagnosis of transformer faults, a novel PSO-PNN diagnosis model is proposed in this paper. Firstly, the types of transformer faults and existing diagnosis methods are introduced and their shortcomings are analyzed. Then, the application of PNN in transformer fault diagnosis is introduced, and the optimal smoothing factor is selected through PSO. The effectiveness and feasibility of the proposed method are verified through numerical analysis. In general, the advantages of the method proposed in this paper are mainly reflected in the following two points: the accuracy of the PSO-PNN transformer fault diagnosis model is about 10% higher than that of the traditional method and 5% higher than that of the traditional PNN. In addition, the method proposed in this paper has more advantages in practical application, especially in the case of fewer training samples. Through the analysis of cases and comparison with traditional algorithms including BPNN, traditional PNN, extreme learning machine and support vector machine, the proposed method can obtain more accurate fault diagnosis results on the premise of ensuring the efficiency of the solution.
Author Contributions
Conceptualization, X.Z. and Z.S.; methodology, X.Z.; software, X.Z.; resources, X.Z.; data curation, Z.S.; writing—original draft preparation, X.Z.; writing—review and editing, X.Z. and Z.S. All authors have read and agreed to the published version of the manuscript.
Funding
This research was funded by Key Natural Science Research Projects of Colleges and Universities in Anhui Province, grant number 2022AH051831.
Conflicts of Interest
The authors declare no conflict of interest.
References
- Mohsen, F.; Abouzar, S.; Abolfazl, S. Reliability evaluation of a composite power system in the presence of renewable generations. Reliab. Eng. Syst. Saf. 2022, 222, 108396. [Google Scholar]
- Mahdavi, M.; Javadi, M.S.; Catalão, J.P.S. Integrated generation-transmission expansion planning considering power system reliability and optimal maintenance activities. Int. J. Electr. Power Energy Syst. 2023, 145, 108688. [Google Scholar] [CrossRef]
- Shen, Y.; Rong, X.; Ma, J.; Zhou, J.; Zhang, H.; Yang, H. A reliability review on electrical collection system of battery energy storage power station. Energy Rep. 2021, 7, 1336–1343. [Google Scholar] [CrossRef]
- Rachna, V.U.D.; Saurabh Tewari, S.M.T. Machine learning applications in power system fault diagnosis: Research advancements and perspectives. Eng. Appl. Artif. Intell. 2021, 106, 104504. [Google Scholar]
- Akshay, A.; You, F. Quantum computing based hybrid deep learning for fault diagnosis in electrical power systems. Appl. Energy 2021, 303, 117628. [Google Scholar]
- Liu, S.; Sun, Y.; Zhang, L.; Su, P. Fault diagnosis of shipboard medium-voltage DC power system based on machine learning. Int. J. Electr. Power Energy Syst. 2021, 124, 106399. [Google Scholar] [CrossRef]
- Soufiane, B.; Noureddine, B.; Azzeddine, B.; Bousaadia, B.; Karim, A. Deep learning through LSTM classification and regression for transmission line fault detection, diagnosis and location in large-scale multi-machine power systems. Measurement 2021, 177, 109330. [Google Scholar]
- Wang, S.; Zhao, D.; Yuan, J.; Li, H.; Gao, Y. Application of NSGA-II Algorithm for fault diagnosis in power system. Electr. Power Syst. Res. 2019, 175, 105893. [Google Scholar] [CrossRef]
- Dong, M.; Meng, Y.; Xu, C. Research on fault diagnosis model of large power transformer based on support vector machine and dissolved gas analysis. J. Chin. Electr. Eng. Sci. 2003, 14, 88–102. [Google Scholar]
- Mo, J.; Wang, X.; Dong, M. Power transformer fault diagnosis method based on rough set theory. J. Chin. Electr. Eng. Sci. 2004, 12, 166–175. [Google Scholar]
- Medeiros, R.P.; Costa, F.B. A wavelet-based transformer differential protection with differential current transformer saturation and cross-country fault detection. IEEE Trans. Power Deliv. 2017, 17, 11–27. [Google Scholar] [CrossRef]
- Kim, J.W.; Park, B.K.; Jeong, S.C. Fault diagnosis of a power transformer using an improved frequency-response analysis. IEEE Trans. Power Deliv. 2005, 20, 169–178. [Google Scholar] [CrossRef]
- Xie, K.; Luo, A. Application of Genetic Algorithm in Transformer Fault Diagnosis. Electr. Power Autom. Equip. 2005, 25, 55–68. [Google Scholar]
- Dawood, K.; Çınar, M.A.; Alboyacı, B. Diagnosis of axial displacement in transformer windings using finite element analysis. J. Math. Sci. Model. 2018, 1, 27–32. [Google Scholar] [CrossRef]
- Moradnouri, A.; Vakilian, M.; Hekmati, A.; Fardmanesh, M. HTS Transformer’s Partial Discharges Raised by Floating Particles and Nitrogen Bubbles. J. Supercond. Nov. Magn. 2020, 33, 3027–3034. [Google Scholar] [CrossRef]
- Moradnouri, A.; Vakilian, M.; Hekmati, A.; Fardmanesh, M. The end part of cryogenic H. V. bushing insulation design in a 230/20 kV HTS transformer. Cryogenics 2020, 108, 103090. [Google Scholar] [CrossRef]
- Ji, L.; Bao, L.; Li, K.; Huang, Y.; Zhang, P. Research on Fault Identification Method of Dry-type Transformers Based on Support Vector Machine. In Proceedings of the 22nd International Conference on Electrical Machines and Systems (ICEMS), Harbin, China, 11–14 August 2019; pp. 1–6. [Google Scholar]
- Yu, T.; Wang, H.; Chen, X.; Tan, K. Fault Diagnosis and Fault Tolerant Method of Single Stage Matrix Type Power Electronic Transformer. In Proceedings of the 2021 IEEE 1st International Power Electronics and Application Symposium (PEAS), Shanghai, China, 12–15 November 2021; pp. 1–4. [Google Scholar]
- Zhang, M.; Wang, N.; Ding, X. Improved Artificial Fish Swarm Algorithm for Fault Diagnosis of Dry-Type Transformer. In Proceedings of the 2013 Fourth International Conference on Digital Manufacturing & Automation, Shinan, China, 29–30 June 2013; pp. 679–683. [Google Scholar]
- IEEE. Approved Draft Guide for Dry-Type Transformer through-Fault Current Duration; IEEE PC57.12.59/D3.1; IEEE: Picataway, NJ, USA, 2015; pp. 1–22. [Google Scholar]
- Xu, Y.; Hu, Y. Fuzzy comprehensive evaluation method of transformer fault based on improved three-ratio method. Power Energy 2017, 38, 132–136. [Google Scholar]
- Sun, D.; Jiang, L. Application of improved three-ratio method in transformer fault diagnosis. Power Saf. Technol. 2014, 16, 65–67. [Google Scholar]
- Huang, G.B.; Zhou, H.; Ding, X.; Rui, Z. Extreme learning machine for regression and multiclass classification. IEEE Trans. Syst. Man Cybern. Part B 2012, 42, 513–529. [Google Scholar] [CrossRef] [PubMed]
- Saunders, C.; Stitson, M.O.; Weston, J. Support Vector Machine. Comput. Sci. 2002, 1, 1–28. [Google Scholar]
Disclaimer/Publisher’s Note: The statements, opinions and data contained in all publications are solely those of the individual author(s) and contributor(s) and not of MDPI and/or the editor(s). MDPI and/or the editor(s) disclaim responsibility for any injury to people or property resulting from any ideas, methods, instructions or products referred to in the content. |
© 2023 by the authors. Licensee MDPI, Basel, Switzerland. This article is an open access article distributed under the terms and conditions of the Creative Commons Attribution (CC BY) license (https://creativecommons.org/licenses/by/4.0/).