Abstract
For a PEMFC to work better, adding baffles to a flow channel can improve reactant transfer. As a result, the work starts by developing a 3-D numerical model for the vanadium redox flow battery (VRFB) using COMSOL Multiphysic Simulation Software. By incorporating baffles into the serpentine flow channel, it is possible to simulate changes in ion concentration and terminal voltage. The findings indicate that the battery efficiency will be impacted by adding baffles. The authors also studied the effect of baffle height and baffle count. The baffle height of 0.9 times the channel height and baffle number of 9 has a better performance on the battery. There are four cases for installing nine baffles and four arranging types in the entire serpentine flow using such baffle height and number. In Case 4, baffles are placed uniformly at the location of channel numbers 1, 9, and 17 in the serpentine flow path. It has a better voltage and ion concentration reaction than the other cases. The unit tests for cell performances were experimentally analyzed for a smooth-serpentine channel and a baffled-serpentine one. According to the experimental findings, a higher volume rate (300 mL/min) and lower current per area (40 mA/cm2) acquire the best energy efficiency. Case 4 has a higher energy efficiency than the smooth channel.
1. Introduction
With the replacement of fossil fuels by renewable energy sources like solar, wind, and hydropower, there is now constant building momentum. However, most of these sources are intermittent, which causes a gap between the energy’s availability and the users’ usage. Overcoming these issues will need the development of electrochemical energy conversion and storage (EECS) devices for the electrical grid. As a potential EECS, VRFBs has attracted attention. It is suitable for stationary energy storage because of its high level of safety and relatively low energy density [1]. It offers the benefits of high current discharge, long life cycles, safety, and minimal emissions [2]. The primary drawback of RFBs is lower energy density compared to other ECCS. VRFBs have several disadvantages that currently prevent this technology from being widely used and extending its lifespan. There are issues with electrolyte degradation, membrane crossing, self-discharge, restricted reactivity, and kinetics for the vanadium species on the electrode [3]. Yue et al. [4] focused on porous electrode materials of VRFBs, through sputtering nickel (Ni) metal in porous electrodes to improve battery power efficiency. Some scholars discussed how the thickness and compressing of the holey electrode improved the VRFB performance through the mass-transferring influence of the electrolyte in the holey electrode [5,6]. VRFBs operated at a variable volume rate and produced a great capacity with a greater energy efficiency [7]. Furthermore, Lallo and Lindstroem [8] employed Aemion™ Anion Exchange Membranes in VRFBs to have better cycling efficiency and rate performance compared with Nafion® 212.
On the other hand, the homogenous profile in the electrolyte is another factor influencing the performance of the VRFB. When both sides of the ion exchange membrane undergo a chemical reaction, the design of the flow channel and the electrolyte activity can dictate the electrolyte distribution. The reaction range influences the battery performance. Because the proper flow channel structure could intensify the VRFB performance, some scholars have looked into how the flow field affects battery performance. Aaron et al. [9] first applied a “zero-space” VRFB designed in a serpentine channel. It had a greater power density and current density using this flow field channel, which could significantly lower the capital expenses. Xu et al. [10,11] analyzed the VRFB’s performance without or with flow channels. Their results showed that the VRFB with flow channels increased the regularity of the electrolyte distribution and got a higher round-trip efficiency. In the identical situation, the VRFB with a serpentine flow channel performs roughly 5% more efficiently than the VRFB without one. The serpentine flow could effectively manage the reactant concentration distribution within the electrode. Using a computational model, Ke et al. [12] investigated the flow profile in the connecting surface caused by a serpentine flow over a holey electrode. Due to interference from the electrolyte flowing inside the channel corners, the pierced electrode was most at a region close to the channel corners. Maurya et al. [13] pointed out that the serpentine channel exhibited a higher efficiency in some conditions as the VRFB cell used a thick graphite felt electrode. It was due to the effective exchange of charged-discharged electrolytes and shorter electrolyte residence periods caused by convective forces.
The appropriate channel arrangement in VRFB results in low delivery power and a consistent reactant content profile. Then, Latha et al. [14] looked into the flow speed and loss for the serpentine flow channel. Huang et al. [15] analyzed the VRFB’s performance concerning the geometry and organization of the flow field with different transversal sections. They contrasted the current channel ideas and spoke about the benefits and drawbacks of alternate designs. Ke et al. [16,17] applied a numerical model for a serpentine channel to evaluate the maximal current densities by changing the stoichiometric ratio. The flow inside the porous electrode achieved higher performance against the no-flow channel design. They also developed a simple VRFB model to calculate the flow rate for a serpentine flow within the holey layer. They found the maximal current per area (377 mA cm−2) for the flow speed (33.3 cm s−1) and showed that the analytical model helped design and optimize the battery performance. Therefore, researching the electrolyte distribution past the holey electrode will be a trend. Messaggi et al. [18] created 3D modeling to compute the fluid flow in a vanadium redox battery. The uniform distribution of the electrolyte over the porous electrode, which led to a larger over-potential at a high current and a restricted power density of the system, was the fundamental barrier to the commercialization of vanadium redox flow batteries. Therefore, it was necessary to comprehend the physical processes involved in altering the mass transfer in the electrolyte. They displayed serpentine and interdigitated flow fields. The interdigitated flow channel had a more heterogeneous distribution than the serpentine-flow channel under the same conditions, but it performed better and lost more pressure. Gundlapalli et al. [19] acquired VRFB design with different blends of serpentine channel dimensions and the electrochemical performance at varied current densities and volume rates. They presented life cycle characteristics and strengthened the significance of channel configurations, volume rate, and homogeneous profile of electrolytes against the over-potential.
Several studies [20,21] also developed and evaluated the flow channel plate of the fuel cell. Cell efficiency may be considerably increased by the uniformity of the flow field, according to simulation and laboratory results that supported one another [22,23]. Recent research has looked into ribs and baffles being added to the channel of a PEMFC to enhance reactant transport. Liu et al. [24] created a 2D model of a PEMFC employing a baffle-placed flow channel. Their findings showed that the higher current density would happen while going against the baffles. The better cell performance was across the baffle positions. Gu and Wu [25] applied a 3D modeling of a PEMFC. They observed that the ribbed rectangular channel had better power than the smooth channel. The study also built the Taguchi methodology to assess the optimal operating factors. The best results for multi-objective optimization increased by 30% electrical power compared to the minimum pressure drops optimization and decreased the pressure drops by 275% compared to the maximum electrical power optimization. Perng and Wu [26] studied the blockage influence using the trapezoid baffles and found that increasing the height and the angle can promote cell performance. They found that increasing the baffle height and angle could intensify cell performance. Compared with the traditional ones, the trapezoid baffle with 1.125 mm height and 60 degrees of angle got about 90% cell net power. As a result, the reaction extent could improve higher than the channel without adding obstacles. Wu et al. [27] investigated how inserting cuboid baffles in the interdigitated channel impacted the high-temperature PEM fuel cell performance via numerical simulations and experiments. The numerical findings depicted that inserting four cuboid baffle rows could intensify the cell net power, and Case I achieved the best net power. Therefore, experimenting on Case I with Taguchi’s L27 orthogonal array evaluates the optimum parameter for the best net power output.
Numerous articles showed how a serpentine flow field performed better than an interdigitated one for VRFB. According to several studies, adding ribs and baffles into the channel could enhance the PEMFC performance. However, no literature examined how baffles in a flow channel influenced the VRFB performance. Therefore, this study numerically and experimentally examines how baffles into a serpentine-flow channel affect the VRFB performance and compares the results with the smooth one during the discharging and charging processes. The investigation’s primary objective is to identify the best type of baffle location for boosting the voltage and ion concentration reaction using numerical modeling. The other is to experimentally analyze the unit tests cell performance for a smooth-serpentine channel and a baffled-serpentine channel with the baffle-placement way at various flow rates and current densities. The baffle-placement method enhances VRFB energy efficiency, according to the experimental results.
2. Mathematic Formulas and Numerical Modeling
2.1. Geometry Parameter
Numerical modeling has become critical in forecasting the VRFB’s performance to reduce the test cost and required time. The channel used in the article is a serpentine flow field having a maximum reaction area of 2500 mm2. The flow field has a width and height of 1.5 mm. Figure 1 displays the geometric parameter.
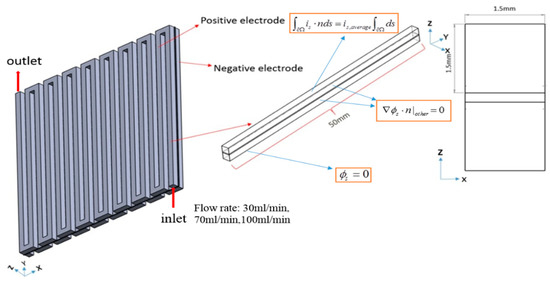
Figure 1.
3D modeling of a VRFB for serpentine flow channel.
This study chooses baffles placed in the full-scale channel in the middle and close to the exit to raise the concentration of the reactant gases because the concentration distribution of the reactant gases is lower in such places. The baffles are arranged in the different rows in the channel from Case 1 to Case 4 in Figure 2. In Case 1, baffles are installed uniformly in the first and second rows. In Case 2, the baffles are uniformly placed two rows from the exit position of 16th and 17th. In Case 3, baffles are set uniformly in the middle of the channel of the 8th and 9th. In Case 4, baffles are installed uniformly at the position of channel numbers 1, 9, and 17.
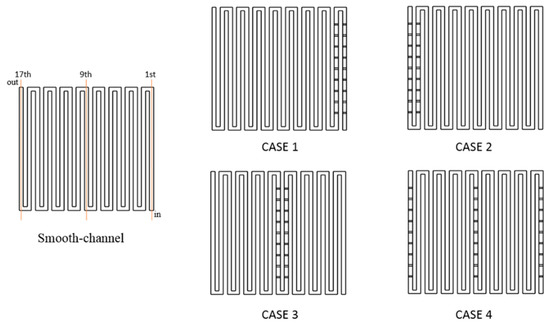
Figure 2.
Schematic layout of smooth channel and installations of baffle row.
2.2. Assumptions
With flow field, concentration profile, electric field, and electrochemical reaction, 3D steady numerical modelings of the VRFB involve the conservations of charge, momentum, and electrochemical kinetics in battery operation. Several assumptions for the numerical modeling are the following. (a) The flow is considered laminar as well as incompressible. (b) Homogeneous and isotropic materials include electrolytes, electrodes, and membranes. (c) All domains are considered isothermal. (d) It does not think of the creation of bubbles caused by incidental reactions like the development of hydrogen and oxygen. (e) Effects from gravity are negligible. (f) The cell’s exterior surfaces do not allow any reactant or charge leakage. (g) It ignores whether water permeates or drags across the membrane.
2.3. Mathematic Formulas [10]
The mathematical formulas are below, and Table 1 shows the physical characteristics of the parameters for the VRFB component. The mathematical formulas are below, and Table 1 displays the physical characteristics of the parameters for the VRFB component. The flow velocity of electrolytes in the serpentine channel with or without baffles in the VRFB using Equations (1) and (2) needs to be determined.

Table 1.
Parameter used in the model.
Momentum conservation equation
Continuity equation
For the flow past the porous electrode, the molar flux of each species, (in which i stands for VO2+, VO2+, V2+, V3+, HSO4+, and H+), can be written in respect to Equation (3).
Species transport equation
The charge leaving the solid phase balances the one entering the electrolyte solution owing to the conservation of charge as follows.
Charge equation
The electrochemical reaction of the vanadium species during the charging/discharging process occurs in the electrodes.
The negative electrode reaction:
The positive electrode reaction:
Using the Nernst equations according to Equations (8) and (9) calculates the electrode equilibrium potentials.
where E0,pos (1.004 V) represents the standard potential of the positive electrode reaction, E0,neg (−0.255 V) denotes that of the other electrode reaction, and R represents the gas constant. T symbolizes the cell temperature, F represents Faraday’s constant (96,485 s·A/mol), and αi denotes the chemical activity of species i.
and are the exchanging current per area of the reactions of positive and negative electrodes computed by Butler–Volmer correlation [28]:
where
In which A is the specific area (SI unit: m−2), i0, posrepresents the transferring current density of the positive electrode reaction, and i0, neg denotes that of the other electrode reaction. αpos symbolizes the transfer coefficient for positive, αneg represents that of another electrode reaction, and the k is constant for the reaction rate.
The over-potential, (SI unit: V), is defined as:
where denotes the electrical potential for the solid phase of the electrode (SI unit: V), symbolizes the electrolyte potential (SI unit: V), and Eeq represents the equilibrium potential.
2.4. Boundary Conditions
The boundary conditions are at the current profile connection through the membrane. The negative and positive electrodes are at the tertiary current distribution interface. The current density of electrolytes has the same current per area on the membrane.
In which denotes the electrolyte current per area, and represents the membrane current density.
Based on Faraday’s law, the proton flux is in proportion to the current as follows:
For species existing on both sides of the membrane and electrode, we have the following relation between the potentials and the concentrations:
In which c+,m represents the penetrable ion concentration within the membrane, and c+,e denotes the permeable ion concentration within the electrolyte. The potential shift caused by the above equation above is called Donnan potential [29].
Since no substance allows ions to penetrate, there is no charge flux of the entire boundary of the battery:
The electronic passes through a current accumulator to an electrode during the reduction. The electronic passes through an electrode to a current accumulator during oxidation. The negative electrode is set to 0 V connecting to the ground:
where represents the collector boundary for positive. The other presents that there is no electron passing. At the inlet (y = 0), , . On the surface of the wall, . The pressure is 1 atm at the outlet.
2.5. Numerical Method
Some researchers have examined the relations between the fluid flow and the electrode in a serpentine or interdigitated flow channels. In addition, the serpentine flow could promote the mass transfer of electrolytes. Designing the fluid flow can raise the performance of the VRFB efficiency. The COMSOL program using the finite element method offers the combinations of Multiphysics and the Battery Design Module, helping the simulation work advance. The finite element method uses physical variables discretized as sums over a set of shape functions defined on finite elements assembled by creating a mesh. The authors then employ the software COMSOL to solve the 3D flow velocity and electrolyte potential in the VRFB with the smooth serpentine channel and a serpentine channel adding the baffles. The COMSOL uses the standard size to create a mesh consisting of elements. The Newton–Raphson iteration is applied to the fully coupled problem with the corresponding boundary conditions until the solution to the convergence is found. The study performed the calculations by using an i7-6700 PC. Figure 3 depicts the results of a mesh independence study for the smooth channel of serpentine under the same conditions (30 mL/min and 100 mA/cm2). The numerical calculation needs to pass a mesh-independence test. As the mesh is refined, the number of elements increases differently and separately uniformly, and the finest occurs in the membrane and the boundary layer. The mesh type uses the structured mesh in a hexahedron at the same boundary conditions with mesh numbers 132,470; 185,600; and 243,200. The relative error of the terminal voltage between 185,600 nodes and 243,200 nodes is less than 1%. This study employs 185,600 nodes for the simulation of all cases.
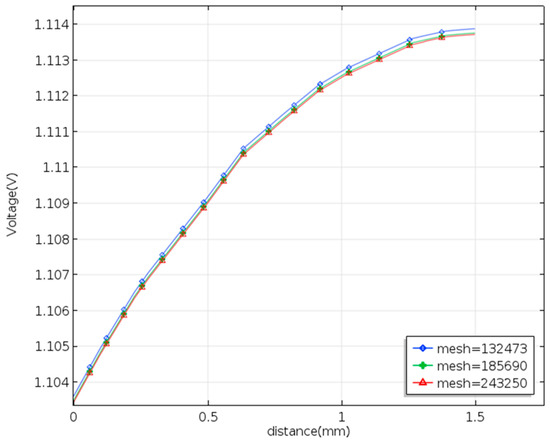
Figure 3.
Mesh independence study in a three-dimensional modeling of the VRFB with terminal voltage.
3. Experimental Method
3.1. Experimental Instrument
The Industrial Technology Research Institute (ITRI) [30] provided the experiment instrument for a VRFB, and Figure 4 displays an illustrative drawing of such an instrument. The experiment instrument includes flow meters to control the flow rate, pumps, two tanks for keeping the Vanadium solution, and an electronic power supply plus load. The pumps connect with the input side, and the Teflon pipe is used for the flow meter to prevent erosion. The connected pumps (Micro liquid pump, PT27WD01, and DC12.0V) supplied a fixed electrolyte flow rate and maintained flows in the VFRB and reservoir cans. The battery test instrument (FLUKE 289) stores the results of the VRFB charge and discharge tests. The VRFB’s voltage range is determined during the experiment so that you can analyze its efficiency. The voltage ranges from 0.8 V to 1.67 V at its lowest point. Carefully controlling the upper limit voltage is necessary to prevent damage to the electrolyte and crystallization. Additionally, if the electrolyte crystallizes, the graphite felt will be harmed and become worthless.
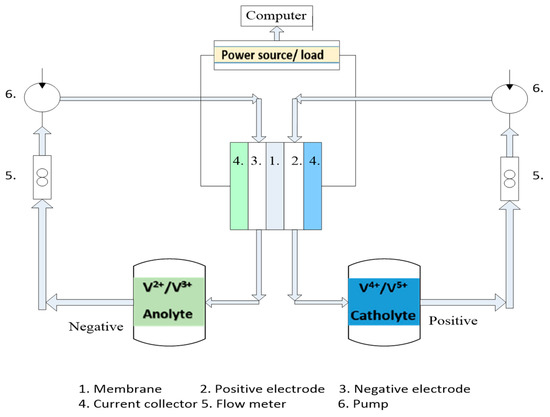
Figure 4.
Schematic layout of experimental instruments.
3.2. VRFB Experimental Composition
Figure 5 shows the end plate, gasket, current collector, graphite plate, graphite felt, and ion exchange membrane as the components of the vanadium battery in this experiment from the external to the internal. The material of the end plate is aluminum to secure the entire battery. The gasket holds the membrane to prevent the leakage of electrolytes. The current collector made of copper picks up the electric current produced at the electrodes and links it with external circuits. Make a groove in the graphite plate and put it into the graphite felt as a battery internal electrode. Due to the porosity of the graphite felt, the electrolyte can fill it and cause an electrochemical reaction. An ion-exchange membrane that enables the movement of ions (mainly protons) between the two cell compartments keeps the two solutions apart within the cell [31]. Ion-exchange Membrane is Nafion 121 with a thickness of 50.8 μm and a basis weight of 100 g/m2 (Dupont Co., Wilmington, DE, USA). Eight bolts on the cell are applied 4N-m of torque when assembling the cell.
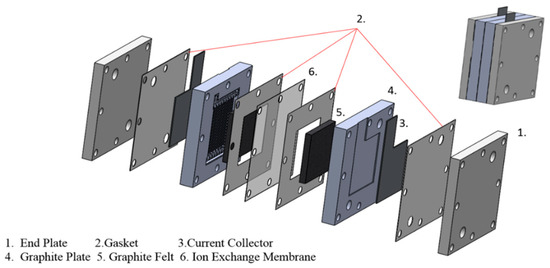
Figure 5.
Compositions of the vanadium battery.
3.3. VRFB Charge-Discharge Curve Test
To analyze the battery that has better performance, the authors address the efficiencies in each case, voltage efficiency (VE), columbic efficiency (CE), as well as energy efficiency (EE). Equation (10) shows the voltage efficiency obtained by combining the mean charge voltage and discharge voltages. Equation (11) denotes columbic efficiency acquired by the charging time and the discharge time, and Equation (12) represents energy efficiency obtained by the time of the voltage efficiency and the Coulombic efficiency.
where Vdis represents the averaged discharging voltage, Vch the averaged charging voltage, Tdis the discharging time, and Tch the charging time. For comparing the performance of the VRFB, the greater the energy efficiency is, the higher the battery performance obtained. The columbic efficiency of this study has the same charging and discharging current densities. By setting the same value for the current density, this study only needs to calculate the charge and discharge time.
4. Results and Discussion
4.1. Impact of Baffle Height on Charge/Discharge Voltage and Concentration Distribution of the VRFB
This paper investigates how the placement of the baffles influences the VRFB performance. Before determining the arrangement of the baffles rows in a channel, it is necessary to choose the baffle height and number. Figure 6 shows the three-dimensional VRFB model geometry with baffles. Baffles have a 0.5 mm thickness. The authors set baffles on the first row on the inlet side and vary the height of the baffle (h).
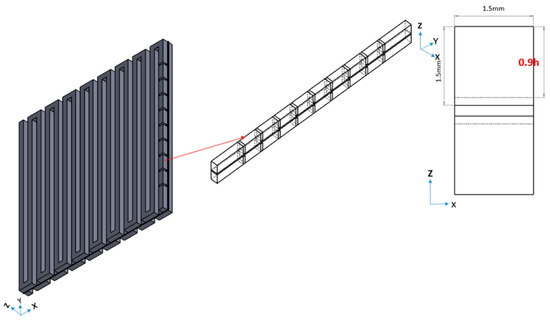
Figure 6.
Three-dimensional model of a VRFB with baffle array.
Figure 7 demonstrates the variation ion concentration distribution of V3+ for smooth and the baffles (0.9 h). In Figure 7b, the ion concentration of the V3+ transported to 935 mol/m3 is higher than that of the smooth channel. Setting the baffles will affect the ion concentrations in the terminal voltage channel. As a result, the baffles can influence the ion concentration and the terminal voltage.
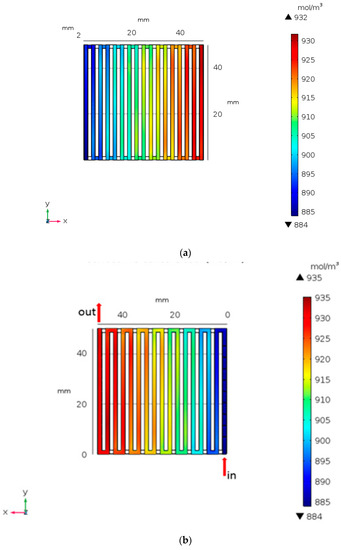
Figure 7.
Concentration distribution for of (a) smooth and (b) setting baffle height at 0.9 h from numerical analysis.
Figure 8 depicts the pattern of positive electrode voltage for different baffle heights during the discharging process. The smooth channel’s terminal voltage in Figure 8a is around 1.1035 V close to the positive electrode side. The positive terminal voltage drops as height rises due to installation baffles. Near the positive electrode with baffles (0.5 h), the terminal voltage is 1.1022 V with 1.3 mV lower than the terminal voltage in the smooth channel. The terminal
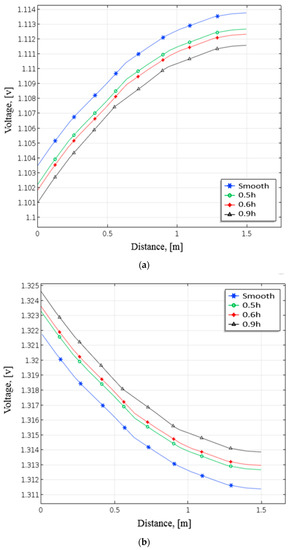
Figure 8.
Distribution of terminal voltage at positive electrode under different heights of baffle during (a) discharging and (b) charging from numerical analysis.
Voltage comes to 1.101 V when the height of the baffles is at 0.9 h and drops to roughly 2.5 mV. Figure 8b demonstrates that the terminal voltage with the smooth channel is about 1.3218 V near the positive electrode side. When the baffle height increases, the terminal voltage increases. The terminal voltage increased by about 1.5 mV compared with the smooth channel while setting the height at 0.5 h. When the baffles were at 0.9 h, the terminal voltage increased to 1.3245 V. These results indicate that the terminal voltage rises with raising the height of the baffles. As a result, the performance can improve by raising the baffle height. This research employs the baffle height of 0.9 h for all simulation cases.
4.2. Effect of Design Case with Voltage of the VRFB
Figure 9 demonstrates the profile of positive electrode voltage with the smooth channel and four cases. Figure 9a shows the terminal voltage in the discharging process, while Figure 9b indicates the terminal voltage in the charging process. Case 2 discharges at a lower voltage of roughly 1.098 V. It implies that placing the baffles close to the outlet side impacts more than those close to the input side. In Figure 9a, Case 4 has a voltage of around 1.096 V with 7.5 mV less than the smooth channel. On the contrary, the terminal voltage of Case 4 is higher than those of the other cases indicated in Figure 9b. Case 4 has a voltage of about 1.33 V and is higher than the smooth channel by 8.2 mV. The battery performance increases with setting the baffles in the 1st, 9th, and 17th rows.
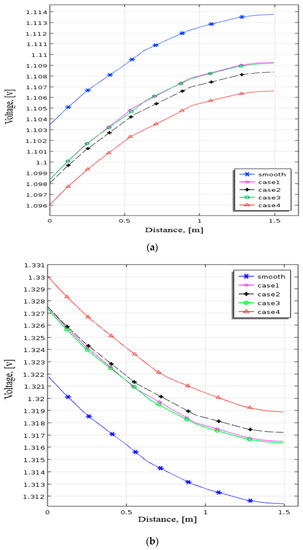
Figure 9.
Profile of terminal voltage at positive electrode for smooth channel and varied baffle row cases during (a) discharging and (b) charging from numerical analysis.
Figure 10 illustrates this comparison process for reader visibility and comprehension. In the study, Nt is equal to four. This flow chart finds the final fourth case from a higher terminal voltage during the charging process, starting with a beginning state as a base.
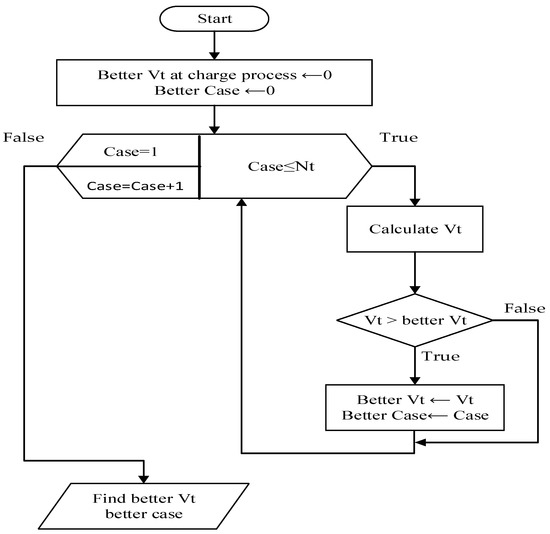
Figure 10.
Process flow chart.
Table 2 indicates the convection mass transfer coefficient in different cases for H+ ions before the reaction at the ion exchange membrane in the discharging process [32]. For Case 4, the ion H+ convection mass transfer coefficient is roughly 4.05 × 10⁻¹⁰ m/s. In the flow field of the channel, Case 4’s convective mass transfer coefficients are superior to those of the other examples. Figure 11 illustrates how the baffle’s row design affected the first channel. Figure 11a demonstrates the flow parallel to an ion exchange membrane within the smooth one, while Figure 11b indicates the flow field of Case 4. Because of the confined-flow zone between the baffle and the ion exchange membrane in Case 4, the streamline profiles for both channels contain recirculation zones across the left side that bring closer streamlines around their tops. It has the effect of accelerating the reactant fluid velocity in a jet-like manner. As a result of this appearance, ions pass through the ion exchange membrane with a higher convective mass transfer coefficient, intensifying the chemical process. It causes the terminal voltage to perform better when charging and worse during discharging.
Table 2.
Convection mass transfer coefficient.
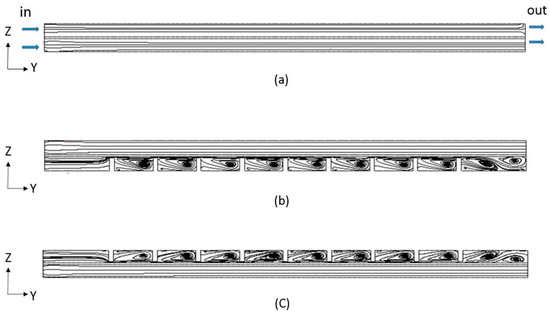
Figure 11.
The flow field variation of flow channel for (a) the smooth-channel, (b) first channel for positive electrode, and (c) first channel for negative electrode with nine baffles from numerical analysis.
4.3. Experimental Analysis for the VRFB
The authors use the Case 4 channel design and a smooth serpentine channel (Figure 2) made using computer numerical control machining in the graphite plate following the numerical results. As a result, the Case 4 channel is employed and the smooth one performs experiments. All physical quantity measurements must meet the reliability criteria outlined in the ANSI/ASME standard [33]. The total error (δk) consists of two components: a fixed bias error (B) and the precision error (γk), such that:
δk = B + γk
The precision error from the repeated measurements is determined and the characteristics are approximated by the precision index(s):
where is the average value of X.
The uncertainty (U) is expressed as follows:
where fe is a function of the degrees of freedom used in calculating U. The uncertainty values of measuring data are obtained and listed in Table 3.
Table 3.
Uncertainty of measurement.
The experimental design factors have the volume rate and current per area. The current per area has three conditions, which are 40 mA/cm2, 60 mA/cm2, and 70 mA/cm2. The flow velocity has two cases, with the volume rates having 100 mL/min (Re = 300) and 300 mL/min (Re = 891).
4.4. Impact of Current Density
Figure 12 illustrates how the current density affects a 25 cm2 ion exchange membrane under 40 mA/cm2, 60 mA/cm2, and 70 mA/cm2 current densities controlled at a 300 mL/min constant flow rate. Figure 12a is the charge–discharge curve of the smooth channel, and Figure 12b is the charge–discharge curve of Case 4. Because of the abrupt spike in charge voltage towards the end of the charging process, it is expectable that the battery quickly consumes vanadium at higher current densities.
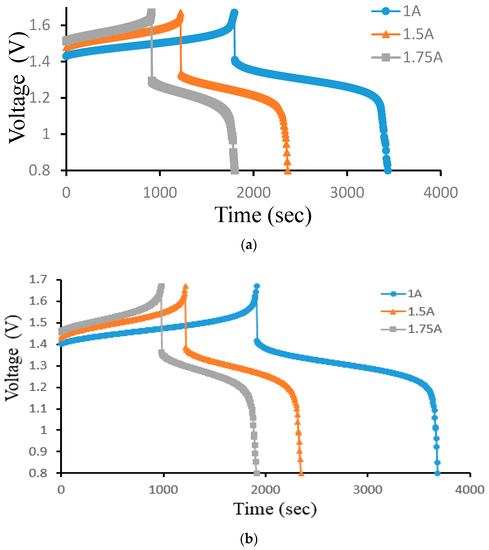
Figure 12.
Cell voltage varied through time to reflect charge–discharge characteristics at controlled current density (40, 60, and 70 mA/cm2) at a 300 mL/min flow rate for (a) smooth and (b) Case 4 from the experiment.
4.5. Effect of Flow Rates
Figure 13 displays the charge–discharge curve of Case 4 at a controlled flow rate. As the flow rate increases, the initial voltage decreases. The voltage rises during the charging process as the volume rate does. The charging and discharging procedures lengthen considerably more as the volume rate rises. The higher capacity of the VRFB is the cause of the longer cycle time. As the flow rate drops, the reactive species are no longer evenly distributed throughout the VRFB. It, therefore, decreases the mass transfer coefficient and impacts the thickness of the Nernst diffusion layer. At 300 mL/min, the cell’s capacity offers a higher gain in volume rate. During the small velocity, the electrolyte transfers in time; the time is less than the large velocity.
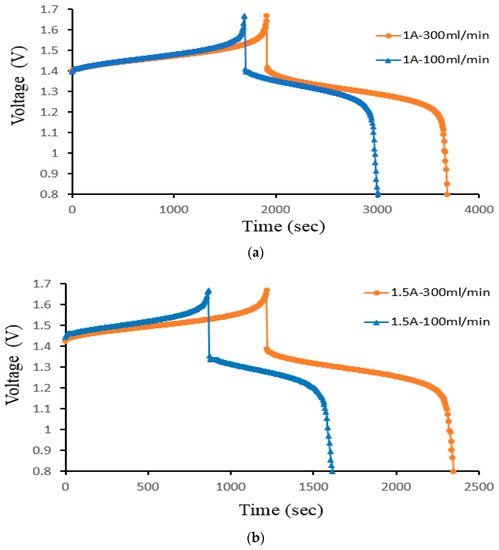
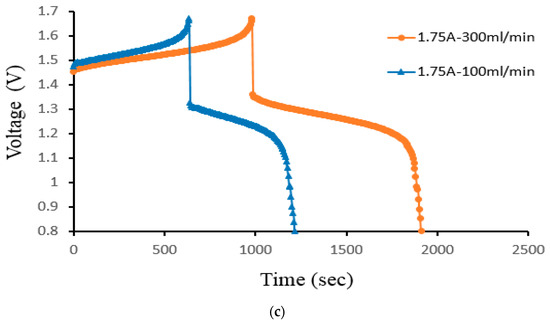
Figure 13.
Cell voltage varied through time to reflect charge/discharge characteristics of Case 4 at the controlled flow rates (100 mL/min and 300 mL/min) for current density (a) 40 mA/cm2, (b) 60 mA/cm2, and (c) 70 mA/cm2 from the experiment.
4.6. Comparison between the Three Types of VFRB Efficiency
Finally, the authors examined the efficiency of the three different experimental cases. Figure 14 demonstrates the efficiency of the smooth channel, whereas Figure 15 shows the efficiency of Case 4. The coulombic efficiencies range between 77.2% and 97.8%, and the voltage efficiency is between 75% and 88.6% (excluding the pumping losses). The best condition occurs at the lower current density (40 mA/cm2) and the flow velocity is set at 300 mL/min. Moreover, compared with the smooth flow field (Figure 14a and Figure 15a), case 4 has the highest energy efficiency of about 81.12% through a relative increase rate of about 4.5%.
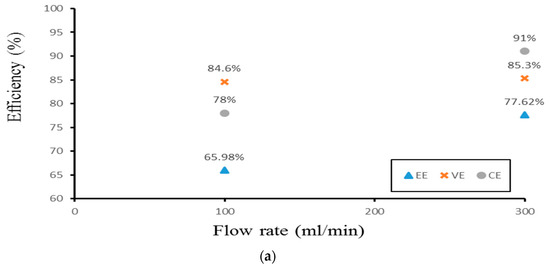
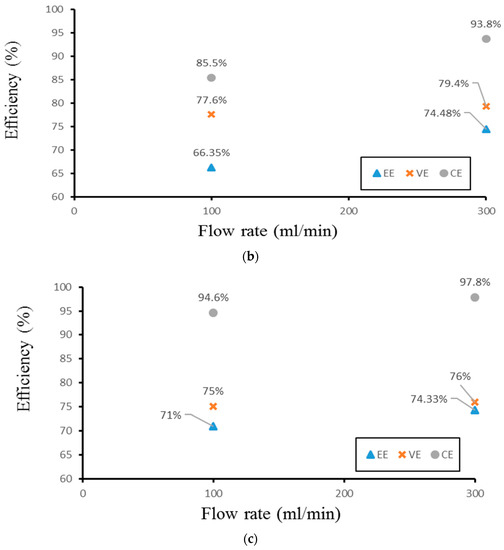
Figure 14.
Efficiencies between flow rates of the smooth channel at (a) 40 mA/cm2, (b) 60 mA/cm2, and (c) 70 mA/cm2 from the experiment.
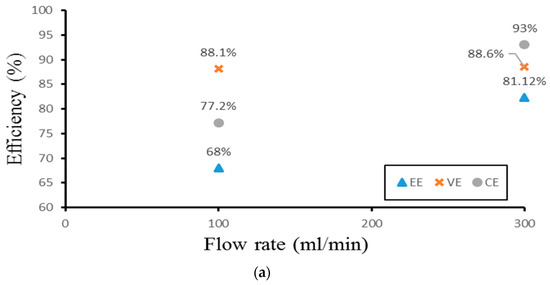
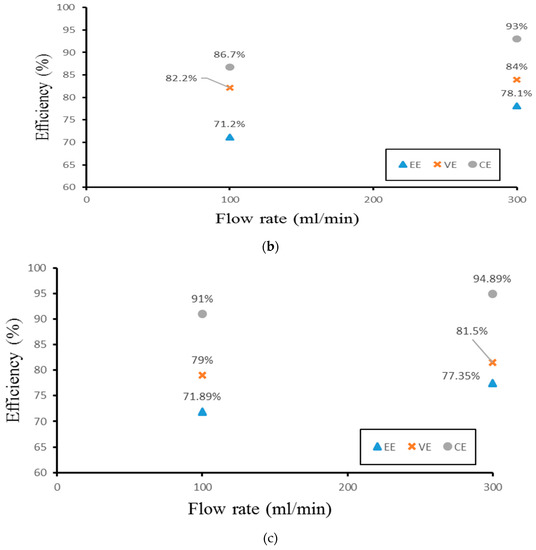
Figure 15.
Efficiencies between flow rate of Case 4 at (a) 40 mA/cm2, (b) 60 mA/cm2, and (c) 70 mA/cm2 from experiment.
5. Conclusions
This study first used the numerical method of the 3-D VRFB model based on COMSOL to look at the impacts of the electrolyte volume rate, electrolyte content distribution, and current per area on terminal voltage for the cell. The investigation also explored the numbers and the height of the baffle. The baffles rows were arranged in the flow channel to realize whether the efficiency improves. This work examined a 25 cm2 VRFB for experiments, measuring the electrolyte volume rate, various parameters, and current per area. Analyzing how the current density impacts the efficiency determines the best combination of the VRFB. The following conclusions for VRFB with numerical and experimental analysis results are:
- The baffle height of 0.9 h has the lowest terminal voltage by about 1.101 V at the discharge process. It is lower than the smooth by about 2.5 mV.
- For the number of baffles with 9, the terminal voltage at the discharging process is lower than the single baffle row, which is about 2.2 mV. This result shows that the charging efficiency increases and the internal loss declines.
- The terminal voltage for Case 4 is lower than for Case 2 by about 2 mv. Furthermore, Case 4 has a lower terminal voltage against the smooth channel by about 7.5 mv. The battery performance increases with setting the baffles in the 1st, 9th, and 17th rows. In contrast to the other cases, Case 4’s baffles promote ion transfer and cause mass transport.
- As the current density increases, the Coulombic efficiency improves. Because the charge and discharge cycle is quicker with a larger current per area, the battery has a better charge agreement. Furthermore, the voltage efficiency drops as the current density rises because of an ohmic drop during the discharging process.
- The velocity impacts how long the charge and discharge process takes when comparing the operating voltage for the VRFB at 300 mL/min and 100 mL/min. The VRFB’s higher capacity is the cause of the longer cycle time. Different flow rates can alter the voltage at which the charge/discharge process starts. With an increase in volume rate, the energy efficiency slightly climbs.
- The best condition occurs at the lower current density (40 mA/cm2) and flows velocity set at 300 mL/min. In addition, against the smooth flow field, case 4 has the highest energy efficiency of about 81.12%, which increased by about 4.5%.
The authors suggest that various VRFBs for assessing power in future work take pressure drop and pumping loss into account. The greater current density of the multi-cell VRFBs maintains a consistent voltage during the discharging process.
Author Contributions
Conceptualization, H.-W.W. and Y.-K.Z.; methodology, H.-W.W.; software, Y.-K.Z.; formal analysis, Y.-K.Z.; investigation, Y.-K.Z.; writing—original draft preparation, Y.-K.Z.; writing—review and editing, H.-W.W.; funding acquisition, H.-W.W. All authors have read and agreed to the published version of the manuscript.
Funding
Partial financial assistance from the Ministry of Science and Technology of the Republic of China, Taiwan, MOST 104-2221-E-006-197-MY3 for the partial financial assistance.
Institutional Review Board Statement
Not applicable.
Informed Consent Statement
Not applicable.
Data Availability Statement
Not applicable.
Acknowledgments
The authors really appreciate the Ministry of Science and Technology of the Republic of China, Taiwan, for the partial financial assistance.
Conflicts of Interest
The authors declare no conflict of interest.
Nomenclature
| A | Specific area () | |
| B | Fixed bias error | |
| c | Molar concentration () | |
| CE | Columbic efficiency | |
| D | Diffusivity of vanadium ions () | |
| E | Equilibrium potential (V) | |
| EE | Energy efficiency | |
| F | Faraday’s coefficient (96478, ) | |
| fe | Function of the degrees of freedom | |
| h | Channel height (mm) | |
| i | Exchanging current per area () | |
| Ich | Charging current (A) | |
| Idis | Discharging current (A) | |
| k | Reaction rate coefficient () | |
| Molar flux of species i | ||
| Nt | Total number of case | |
| n | Number | |
| unit normal vector | ||
| P | Pressure (Pa) | |
| Rd | Dissociation rate of HSO4 () | |
| R | Gas constant (8.314, ) | |
| S | Source item | |
| T | Temperature (K) | |
| Tch | Charging time (s) | |
| Tdis | Discharging time (s) | |
| U | Uncertainty | |
| Velocity vectors () | ||
| Vch | Averaged charging voltage (V) | |
| Vdis | Averaged discharging voltage (V) | |
| VE | Voltage efficiency | |
| Inlet velocity | ||
| z | Charge number | |
| Greek symbols | ||
| α | Transfer coefficient | |
| γk | Precision error | |
| δk | Total error | |
| ε | Porosity | |
| η | Over-potential | |
| μ | Dynamic viscosity | () |
| ρ | Density of fluid () | |
| σ | Effective conductivity () | |
| Φ | Potential (V) | |
| Superscript | ||
| eff | Effective property | |
| pos | Positive electrode | |
| neg | Negative electrode | |
| 0 | Standard condition | |
| s | Compared with surface | |
| T | Transposed | |
| t | Terminal | |
| Subscript | ||
| H+ | Protons | |
| SO42- | Sulphate ions | |
| HSO4- | Hydrogen sulphate ions | |
| i | i-th chemical species | |
| l | Liquid phase | |
| m | Membrane | |
| s | Solid phase | |
| e | Electrolyte | |
| + | Ion | |
References
- Sun, C.; Negro, E.; Vezzu, K.; Pagot, G.; Cavinato, G.; Nale, A.; Bang, Y.H.; Di Noto, V. Hybrid inorganic-organic proton-conducting membranes based on SPEEK doped with WO3 nanoparticles for application in vanadium redox flow batteries. Electrochim. Acta 2019, 309, 311–325. [Google Scholar] [CrossRef]
- Iwakiri, I.; Antunes, T.; Almeida, H.; Sousa, J.P.; Figueira, R.B.; Mendes, A. Redox Flow Batteries: Materials, Design and Prospects. Energies 2021, 14, 5643. [Google Scholar] [CrossRef]
- Di Noto, V.; Vezzu, K.; Crivellaro, G.; Pagot, G.; Sun, C.Y.; Meda, L.; Rutkowska, I.A.; Kulesza, P.J.; Zawodzinski, T.A. A general electrochemical formalism for vanadium redox flow batteries. Electrochim. Acta 2022, 408, 139937. [Google Scholar] [CrossRef]
- Yue, M.; Lv, Z.; Zheng, Q.; Li, X.; Zhang, H. Battery assembly optimization: Tailoring the electrode compression ratio based on the polarization analysis in vanadium flow batteries. Appl. Energy 2019, 235, 495–508. [Google Scholar] [CrossRef]
- Brown, L.D.; Neville, T.P.; Jervis, R.; Mason, T.J.; Shearing, P.R.; Brett, D.J.L. The effect of felt compression on the performance and pressure drop of all-vanadium redox flow batteries. J. Energy Storage 2016, 8, 91–98. [Google Scholar] [CrossRef]
- Tain, H.; Chein, R.Y.; Hsueh, K.L.; Wu, C.H.; Tsau, F.H. Design and modeling of electrolyte pumping power reduction in redox flow cells. Rare Met. 2011, 30, 6–21. [Google Scholar]
- Karrech, A.; Regenauer-Lieb, K.; Abbassi, F. Vanadium flow batteries at variable flow rates. J. Energy Storage 2022, 45, 103623. [Google Scholar] [CrossRef]
- Lallo, E.; Khataee, A.; Lindstroem, R.W. Vanadium Redox Flow Battery Using Aemi-on™ Anion Exchange Membranes. Processes 2022, 10, 270. [Google Scholar] [CrossRef]
- Aaron, D.S.; Liu, Q.; Tang, Z.; Grim, G.M.; Papandrew, A.B.; Turban, A.; Zawodzinski, T.A.; Mench, M.M. Dramatic performance gains in vanadium redox flow batteries though modified cell architecture. J. Power Sources 2012, 206, 450–453. [Google Scholar] [CrossRef]
- Xu, Q.; Zhao, T.S.; Leung, P.K. Numerical investigations of flow field designs for vanadium redox flow batteries. Appl. Energy 2012, 105, 47–56. [Google Scholar] [CrossRef]
- Xu, Q.; Zhao, T.S.; Zhang, C. Performance of a vanadium redox flow battery with and without flow fields. Electrochim. Acta 2014, 142, 61–67. [Google Scholar] [CrossRef]
- Ke, X.; Prahl, J.M.; Alexander, J.I.; Savinell, R.F. Mathematical modeling of electrolyte flow in a segment of flow channel over porous electrode layered system in vanadium flow battery with flow field design. Electrochim. Acta 2017, 233, 124–134. [Google Scholar] [CrossRef]
- Maurya, S.; Nguyen, P.T.; Kim, Y.S.; Kang, Q.; Mukundan, R. Effect of flow field geometry on operating current density, capacity and performance of vanadium redox flow battery. J. Power Sources 2018, 404, 20–27. [Google Scholar] [CrossRef]
- Latha, T.J.; Jayanti, S. Ex-situ experimental studies on serpentine flow field design for redox flow battery systems. J. Power Sources 2014, 248, 140–146. [Google Scholar] [CrossRef]
- Huang, Z.B.; Mu, A.L. Flow field design and performance analysis of vanadium redox flow battery. Ionics 2021, 27, 5207–5218. [Google Scholar] [CrossRef]
- Ke, X.; Prahl, J.M.; Alexander, J.I.D.; Savinell, R.F. Redox flow batteries with serpentine flow fields: Distributions of electrolyte Flow reactant penetration into the porous carbon electrodes and effects on performance. J. Power Sources 2018, 384, 295–302. [Google Scholar] [CrossRef]
- Ke, X.; Prahl, J.M.; Alexander, J.I.D.; Savinell, R.F. A Simple Analytical Model of Coupled Single Flow Channel over Porous Electrode in Vanadium Redox Flow Battery with Serpentine Flow Channel. J. Power Sources 2015, 288, 308–313. [Google Scholar] [CrossRef]
- Messaggi, M.; Canzi, P.; Mereu, R.; Baricci, A.; Inzoli, F.; Casalegno, A.; Zago, M. Analysis of flow field design on vanadium redox flow battery performance: Development of 3D computational fluid dynamic model and experimental validation. Appl. Energy 2018, 228, 1057–1070. [Google Scholar] [CrossRef]
- Gundlapalli, R.; Jayanti, S. Dataset on performance of large-scale vanadium redox flow batteries with serpentine flow fields. Data Brief 2021, 35, 106835. [Google Scholar] [CrossRef]
- Tsai, B.T.; Tseng, C.J.; Liu, Z.S.; Wang, C.H.; Lee, C.I.; Yang, C.C.; Lo, S.K. Effects of flow field design on the performance of a PEM fuel cell with metal foam as the flow distributor. Int. J. Hydrogen Energy 2012, 37, 13060–13066. [Google Scholar] [CrossRef]
- Kerkoub, Y.; Benzaoui, A.; Haddad, F.; Ziari, Y.K. Channel to rib width ratio influence with various flow field designs on performance of PEM fuel cell. Energy Convers. Manag. 2018, 174, 260–275. [Google Scholar] [CrossRef]
- Huang, C.M.; Shy, S.S.; Li, H.H.; Lee, C.H.T. The impact of flow distributors on the performance of planar solid oxide fuel cell. J. Power Sources 2010, 195, 6280–6286. [Google Scholar] [CrossRef]
- Zhao, C.; Yang, J.J.; Zhang, T.; Yan, D.; Pu, J.; Chi, B.; Li, J. Numerical modeling of manifold design and flow uniformity analysis of an external manifold solid oxide fuel cell stack. Int. J. Hydrogen Energy 2020, 45, 14440–14451. [Google Scholar] [CrossRef]
- Liu, H.C.; Yana, W.M.; Soong, C.Y.; Chen, F. Effects of baffle-blocked flow channel on reactant transport and cell performance of a proton exchange membrane fuel cell. J. Power Sources 2005, 142, 125–133. [Google Scholar] [CrossRef]
- Gu, H.W.; Wu, H.W. Effects of modified flow field on optimal parameters estimation and cell performance of a proton exchange membrane fuel cell with the Taguchi method. Int. J. Hydrogen Energy 2012, 37, 1613–1627. [Google Scholar]
- Perng, S.W.; Wu, H.W. A three-dimensional numerical investigation of trapezoid baffles effect on non-isothermal reactant transport and cell net power in a PEM fuel cells. Appl. Energy 2015, 143, 81–95. [Google Scholar] [CrossRef]
- Wu, H.W.; Ho, T.Y.; Ha, Y.J. Parametric optimization of wall-mounted cuboid rows installed in interdigitated flow channel of HT-PEM fuel cells. Energy 2021, 216, 119261. [Google Scholar] [CrossRef]
- Dickinson, E.J.F.; Wain, A.J. The Butler-Volmer equation in electrochemical theory: Origins, value, and practical application. J. Electroanal. Chem. 2020, 872, 114145. [Google Scholar] [CrossRef]
- Knehr, W.; Kumbur, E.C. Open circuit voltage of vanadium redox flow batteries: Discrepancy between models and experiments. Electrochem. Commun. 2011, 13, 342–345. [Google Scholar] [CrossRef]
- Available online: https://www.itri.org.tw/english/ (accessed on 7 November 2022).
- Sun, C.Y.; Negro, E.; Nale, A.; Pagot, G.; Vezzu, K.; Zawodzinski, T.A.; Meda, L.; Gambaro, C.; Di Noto, V. An efficient barrier toward vanadium crossover in redox flow batteries: The bilayer [Nafion/(WO3)(x)] hybrid inorganic-organic membrane. Electrochim. Acta 2021, 378, 138133. [Google Scholar] [CrossRef]
- Incropra, F.P.; Lavine, A.S.; Bergman, T.L.; DeWitt, D.P. Fundamentals of Heat and Mass Transfer; John Wiley and Sons Inc.: Hoboken, NJ, USA, 2011. [Google Scholar]
- Abernethy, R.B.; Benedict, R.P.; Dowdell, R.B. ASME Measurement Uncertainty. J. Fluids Eng. 1985, 107, 161–164. [Google Scholar] [CrossRef]


Disclaimer/Publisher’s Note: The statements, opinions and data contained in all publications are solely those of the individual author(s) and contributor(s) and not of MDPI and/or the editor(s). MDPI and/or the editor(s) disclaim responsibility for any injury to people or property resulting from any ideas, methods, instructions or products referred to in the content. |
© 2023 by the authors. Licensee MDPI, Basel, Switzerland. This article is an open access article distributed under the terms and conditions of the Creative Commons Attribution (CC BY) license (https://creativecommons.org/licenses/by/4.0/).