Article

Production of Biogas from Food Waste Using the Anaerobic Digestion Process with Biofilm-Based Pretreatment

by
Amina Mohamed Ali
1,2,
Md Zahangir Alam
2,
Fatouma Mohamed Abdoul-latif
1,*,
Mohammed Saedi Jami
2,
Ibrahim Gamiye Bouh
2,
Ibrahim Adebayo Bello
2 and
Tarik Ainane
3
1
Medicinal Research Institute, Centre d’Etudes et de Recherche de Djibouti, IRM-CERD, Route de l’Aéroport, Haramous B.P. 486, Djibouti City 77101, Djibouti
2
Bioenvironmental Engineering Research Centre, Department of Chemical Engineering and Sustainability, Faculty of Engineering, International Islamic University Malaysia, Kuala Lumpur 53100, Malaysia
3
Superior School of Technology of Khenifra, University of Sultan Moulay Slimane, BP 170, Khenifra 54000, Morocco
*
Author to whom correspondence should be addressed.
Processes 2023, 11(3), 655; https://doi.org/10.3390/pr11030655
Submission received: 2 January 2023 / Revised: 26 January 2023 / Accepted: 7 February 2023 / Published: 21 February 2023
(This article belongs to the Special Issue 10th Anniversary of Processes: Women's Special Issue Series)

Abstract

:
The production of biogas from food waste is a good approach to the minimization of food waste and increase in the production of renewable energy. However, the use of food waste as a feedstock for biogas production currently poses a difficulty due to an ineffective hydrolysis process, which is a pretreatment procedure and the initial step of the biogas conversion process. This restriction results from the food waste polymers’ solubilization and breakdown. This has an impact on the volume of biogas produced during the methanogenesis stage. It is essential to increase the biodegradation of organic compounds (OC) during the hydrolysis process to increase biogas generation. This study focuses on the enhancement of biogas production by the anaerobic digestion (AD) of food waste (FW). FW was hydrolyzed by the immobilized biofilm and digested anaerobically in a semi-continuous digester. Four different digesters including the control were prepared. The control digester composed of no hydrolyzed food waste had no immobilized biofilm while the other three digesters had immobilized biofilm-hydrolyzed food waste with inoculum concentrations of 10%, 30%, and 50%. The results showed that the 50% digester had the highest biogas yield of about 2000 mL/500 mL. The 10%, 30%, and control digesters had a biogas yield of 1523 mL, 753 mL, and 502 mL respectively. Thus, the analysis of total volatile solid (TVS) reduction in the digesters with 10%, 30%, and 50% inoculum and the control have increased to 43.4% for the digesters with 30% and 10%, 60% for the digester with 50% inoculum, and only 29% for the control. Total chemical demand (TCOD) removal increased to 29%, 33%, 43%, and 56% for the control, and 10%, 30%, and 50%, respectively for the inoculum-to-feed ratio. From these results, the 50% inoculum-to-feed ratio has shown the highest biogas production and highest degradation based on TVS reduction and TCOD reduction. Based on this study, the biofilm pretreatment method can be considered a promising method for the enhancement of biogas volume and biodegradation. Biogas production was high (2000 mL) for hydraulic retention time (HRT = 20) days but the HRT = 15 days was also able to produce a significant amount (1400 mL) of biogas and the 50% inoculum-to-feed ratio has shown the highest volume of biogas production.

1. Introduction

Food waste (FW) represents a significant portion of municipal solid waste (MSW). The treatment of domestic food waste has become a major problem that needs to be solved as its generation keeps increasing. At present, there are several treatment methods commonly used for food waste such as landfill, incineration, composting, and anaerobic digestion. The disposal of food waste on landfill has caused many issues such as leaching, air pollution, and the emission of greenhouse gasses due to the high content of moisture contained in food waste [1,2]. Therefore, researchers have found that the most attractive approach for domestic food waste treatment is anaerobic digestion, which is considered to be a source of energy, and this energy comes from biogas produced by anaerobic digestion (AD) technology [3,4]. The AD process is composed of four steps, which include hydrolysis, acidogenesis, acetogenesis, and finally methanogenesis.
Utilization of FW as feedstock for biogas production currently represents a challenge due to inefficient hydrolysis, a pretreatment process in which complex organic molecules are transformed into smaller and simpler molecules by the extracellular enzymes of microorganisms [5,6,7,8]. This limitation is due to the solubilization and degradation of the polymers contained in FW [9,10,11]. As a result, the production of biogas volume in the methanogenesis step is affected. There is a necessity to enhance biogas yield by increasing the biodegradation of organic compounds (OC) in the hydrolysis step. Several approaches have been explored to enhance biogas production from FW such as pretreatment methods, the co-digestion process, and variation in some operational parameters [12,13,14].
Kazimierowicz et al. [15] have studied the influence of the heating pretreatment method on the efficiency of biomethane production from expired food products, and they have determined how electromagnetic microwave radiation used as a thermal stimulant impacts the qualitative composition and yields of biogas. Thus, the daily average biogas production was 5.43 ± 0.21 dm3 ×·d−1, with the daily methane production at 3.92 ± 0.14 dm3 ×·d−1. The cumulative biogas produced after 80 days of bioreactor operation averaged 434.4 dm3. Parajuli et al. (2022) [16] have examined the start-up conditions of mesophilic AD of FW for effective biogas production to explore the effects of various strategies of system stabilization. During the operation of the system at an OLR of 0.50 gVS/L/d and HRT of 10 and 45 days, an average of 22.32 ± 4.16 NmL/gVS and 161.02 ± 17.72 NmL/gVS of gaseous yield was observed.
On the other hand, to improve the digestion of waste during the hydrolysis step, adding biofilm carriers to the biogas reactors was one feasible strategy to increase biogas production from palm oil effluent and sewage sludge [17,18,19]. Fazil et al. (2018) [18] and Alam et al. (2017) [19] have used biofilm to enhance biogas production from palm oil mill effluent (POME). Bouh et al. (2019) [20] have also used biofilm to enhance biogas production from sewage sludge. They noted a 15% increase in biogas production compared to the control digester operated without biofilm.
However, this research is based on the introduction of biofilm bacteria in the hydrolysis step for the enhancement of biogas produced from FW collected from the International Islamic University of Malaysia, IIUM Gombak Campus in Kuala Lumpur. From said research, two objectives were achieved. The first objective was the hydrolysis of FW with immobilized biofilm as a pretreatment method, and the second objective was the development of AD of FW hydrolyzed with immobilized biofilm. The second objective is detailed in this article. The development of AD of food waste hydrolyzed with biofilm and the controlling of AD parameters, hydraulic retention time (HRT), and the inoculum-to-feed ratio (I/F) as valuable parameters are also discussed in detail to understand the process efficiency. HRT and OLR have been known as crucial parameters of the AD process, which were optimized in [19,20,21,22].

2. Materials and Methods

2.1. Collection and Media Culture of Biofilm Producing Strain

The bacteria used in this study were collected from the environmental biotechnology lab of the International Islamic University of Malaysia (IIUM). Based on Fazil et al. (2018) [18], the four acquired mixtures of bacterial strains were coded as 11, 9C, 23C, and 30C. The bacteria that they identified were named as Bacillus cereus ATCC 14579, Bacillus substilis subsp, substilis strain 168, Bacillus cereus strain CCM 2010. The mixtures were isolated, screened, examined, and classified as possible germs that could generate biofilms by the previous study [18]. These strains were combined and utilized for further experiments after being grown initially in a liquid media using a conical flask. Fazil et al. (2018) [18] conducted the selection of potential biofilm-producing microbial strain for immobilization and tested their hydrolytic enzyme secretion. They have selected 4 strains among 120 strains collected from different substrates, 60 strains collected from palm oil mill effluent (POME), 30 strains collected from 30 palm kernel cakes (PKC), and 30 strains collected from food compost. The combination of the four POME strains and food waste that performed best in tests for biofilm development and hydrolysis enzyme assays were employed for subsequent research. These four strains were combined to pre-treat food waste because mixed cultures produce biofilms more effectively than a single culture.

2.2. Collection and Preparation of Food Waste

Food waste (FW) was taken from several canteens at the International Islamic University of Malaysia (IIUM), Gombak Campus, Kuala Lumpur, which served as the study’s primary source of raw materials. To prevent any degradation of the microbes, mixed FW (about 19.3 kg) was made up of 10 kg of cooked rice alone, 4 kg of leftovers, 3 kg of cooked meat, and 2.3 kg of peels and vegetables. It was stored in a container at 4 °C for 6 months to avoid any degradation of the microorganisms. The FW was prepared as reported by Abbas et al. (2020) [21] and Leung et al. (2016) [23] prior to use for experiments. Thus, to describe the food waste that was evaluated and demonstrate the benefits of employing food waste as a good substrate for anaerobic digestion, the produced sludge and original FW collected were analyzed. Analysis was conducted on total solids (TS), volatile solids (VS), total dissolved solids (TDS), moisture content (MC), soluble chemical demand sCOD, and pH.

2.3. Anaerobic Inoculum Collection and Preparation

Mesophilic anaerobic sludge was collected from the Malaysia sewage treatment plant of Indah Water Konsortium (IWK) located in Kuala Lumpur. Then, 250 mL of the sludge was mixed with 250 mL of food waste sludge to activate the methanogenic bacteria so that they could be adapted to the environment before using them in an anaerobic digester that contains hydrolyzed food waste with biofilm [24,25,26]. Therefore, several analyses were conducted on the collected sewage sludge including TCOD and SCOD measurements, pH, TS and VS. TS, VS and COD were analyzed according to standard methods [27,28].

2.4. Characteristic of Anaerobic Inoculum and Food Waste

Different inoculums were previously used for the AD of food waste and studies have evaluated the effect of different inoculum sources on anaerobic digestion (Table 1). It was noted that it is important to know the characteristics of the inoculum used for AD to find the effects of the inoculum on the end product [29]. As mentioned, sludge from WWTP was used as an inoculum in this study, and some analyses were conducted to characterize the inoculum used. The analyses were performed, as summarized in Table 2. The inoculum used has a total solid content of around 100 g/L and a total volatile solid of nearly 90 g/L. Inoculum sludge used has a TCOD of 53,800 mg/L and SCOD around 49,600 mg/L.

2.5. Immobilization of Biofilm on Granular Activated Carbon and Hydrolysis of Food Waste

The immobilization of mixed culture on the surface of the granular activated carbon (GAC) was done in batch mode by utilizing a 250 mL conical flask containing different masses of GAC (2 g, 5 g, and 8 g) and different volumes of biofilm inoculums (1 mL, 3 mL, and 5 mL) at 37 °C and 150 rpm. Based on Bouh et al. (2019) [20], the best time for immobilization was found by the one factor-at-time (OFAT) strategy and the immobilization best time on a GAC was at day two (48 h) of incubation. The optimization of biofilm inoculum volumes and masses of carriers was designed by face-centered central composite (FCCCD) choice beneath the reaction surface strategy (RSM) by utilizing the Design-Expert® program v. 10. Thus, the biofilm was immobilized on a GAC for two days of incubation and hydrolysis was initiated by introducing active GAC with immobilized biofilm into 100 mL of blended FW in a flask of 250 mL [20]. The amount of GAC mass and volume of inoculum added was based on the highest weight of biomass found as a best condition in the immobilization process. Hydrolysis efficiency was studied in terms of soluble chemical demand (sCOD) and total dissolved solids (TDS).

2.6. Development of Anaerobic Digestion of Domestic Food Waste

As a result of the hydrolysis pretreatment with immobilized biofilm, biogas is produced in the methanogenic part of anaerobic digestion where anaerobic inoculums are used. Some important parameters such as temperature and pH were monitored and some were optimized (inoculum-to-feed ratio and HRT) to see the effect on the biogas production and find the best condition that can enhance biogas volume. Therefore, the method used to measure daily gas production was the same method as Zhang et al. (2017) [30].

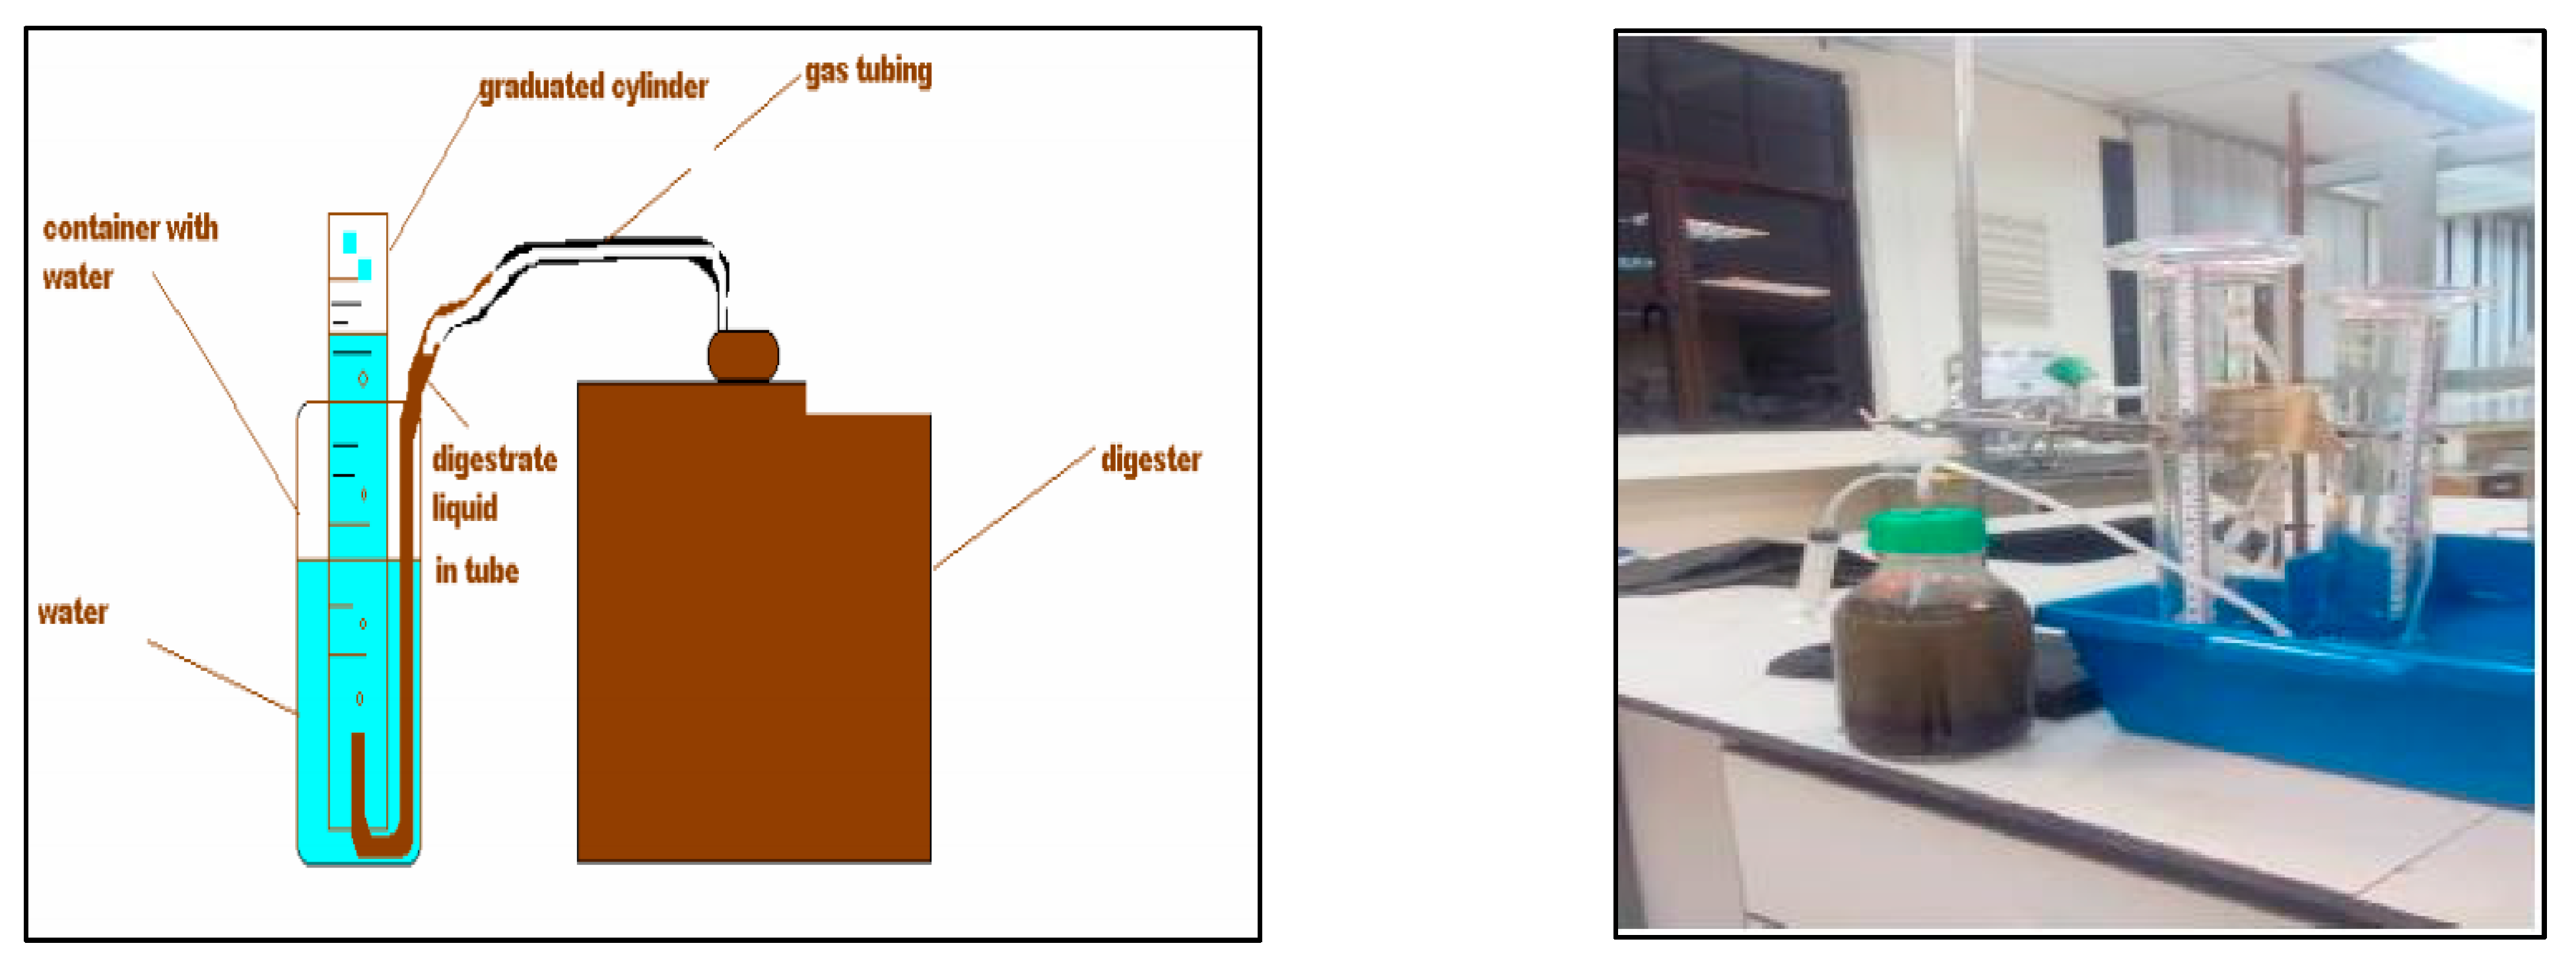
2.6.1. Semi-Continuous Experimental Design and Setup

The anaerobic digestion of collected IIUM (International Islamic University of Malaysia) restaurant food waste was conducted in 500 mL Duran laboratory glass bottles in a semi-continuous mode over a period of two weeks. Figure 1 shows the bottle used as a bioreactor where it was covered with the cover, which had two orifices to aid sampling and gas measurement. To measure the variation and effect of AD parameters on biogas production, the same amount of freshly prepared feed was added and removed once a day manually through a syringe at the top of the digester [31,32]. Acidic water was prepared to fill the cylinders and the basin where the cylinders are placed. The reason why acidic water is used is to avoid the loss of biogas by the dissolution of carbon dioxide CO2 in water, and it was prepared by using tap water with a small drop of hydrochloric acid (HCL) until the pH reached PH 3. As mentioned earlier, the variation in temperature can affect methanogenesis, which is very sensitive, and 36 ± 1.0 °C was considered in studies [33]. Hossain et al. (2022) [34] looked into how digestion temperature affected biogas output. They took into consideration various mesophilic temperature ranges at 25 °C, 30 °C, 37 °C, and 40 °C. It was determined that the biogas production rate was higher at 37 °C.
For this study, a water bath was used to set the temperature at 37 °C. Thus, the sampling was done every day by taking 25 mL of the digester feedstock and filling 25 mL of the fresh feedstock with the help of a syringe of 50 mL. The digester was well mixed before taking out or pouring out the sample. Some analysis (TVS and TCOD) was conducted on the amount taken every day from the digester, and the detail of the analysis is discussed [35,36]. Figure 1 shows the schematic diagram of the digester used in this study.
Hence, four different digesters were prepared in the first part to study the effect of the inoculum-to-feed ratio. One digester for the control composed of no hydrolyzed FW was with no immobilized biofilm, and three others of AD with food waste hydrolyzed with immobilized biofilm with 10%, 30%, and 50% of inoculum. For the second part, two digesters were used to study the effect of HRT on the AD of the considered FW. One digester with HRT =15 days and the second with HRT = 20 days. Based on the liquid displacement method, as shown in Figure 1, measurement and calculation of some essential parameters of AD of food waste were conducted [11,37].

2.6.2. Inoculum and Start-Up Time of Food Waste Anaerobic Digester

It is frequently necessary to seed anaerobic bacteria into a food waste digester to start up the AD process. Digested sludge was collected from a running anaerobic digestion sewage treatment plant of Indah Water Konsortium (IWK) of Kuala Lumpur. Additionally, it is possible to improve the methane content and gas yield, and reduce retention time in the biogas plant with the inoculum addition. Therefore, the inoculum was prepared by mixing the collected sludge with the FW sample to activate methanogenic bacteria and decrease the start-up time of the digestion [38]. Then, 250 mL of collected sludge was mixed with 250 mL of prepared FW sludge in a digester of 500 mL, and the solution was used for further AD experiments. Daily biogas produced in the digester was measured using water the displacement method with the cylinder in which gas is allowed to replace water at equal volume of water displaced [16,39,40].

2.7. Evaluation of Biogas Production

Optimization is required to determine how AD factors affect the production of biogas from the FW under consideration. Two important parameters of AD were optimized, which are the inoculum-to-feed ratio and hydraulic retention time (HRT), for which one-factor at-a-time (OFAT) analysis was conducted.

2.7.1. Optimization of AD Parameters by OFAT: Effect of Inoculum-to-Feed Ratio

The need for optimization is to find the most effective or highest achievable performance of biogas production by maximizing or minimizing certain factors and bringing maximum control over the bacterial communities (biofilm) living in the digesters. For that, several experiments were conducted by considering important factors of anaerobic digestion of food waste, such as inoculum-to-feed ratio and HRT [41,42]. Therefore, the one-factor-at-a-time (OFAT) method was used to evaluate the optimum level of inoculum-to-feed ratio and hydraulic retention time that contribute to high biogas production. For the inoculum-to-feed ratio, a range of 10%, 20%, and 50% v/v of initial inoculum was tested by considering the working volume to be 500 mL. Thus, for these three conditions, HRT was set at 25 days as in many studies 25 days is considered to be the optimum days that can produce a high volume of gas [43,44]. Total volatile solid (TVS) content in the effluent contained in the digester was recorded every day to determine the TVS reduction, and the TCOD concentration was also measured to observe TCOD removed in the digesters. The calculation used to calculate TVS and TCOD reduction are represented in the equations as suggested by Nweigwe et al. (2015) [45] and Spellman et al. (2008) [46].
% CODreduction = (COD(0) − COD(t))/COD(0)
where:
COD(0) is the initial COD or the COD at t = 0;
COD(t) = the COD at any time t.
% TVSreduction= (TVS (0) − TVS (t))/TVS (0)
where:
TVS (0) is the initial TVS or the TVS at t = 0; TVS (t) is the TVS at any time t.

2.7.2. Effect of HRT on Biogas Production

Researchers have noticed that, in general, mesophilic digestion can reach high production of biogas within 15–30 HRT, and HRT lower than 8–10 days was considered as short because it leads to instability of the methanogenic process and is not sufficient to ensure the stability of the digestion. According to Gaby et al. (2017) [47], 12 and 25 days of HRT were the recommended period to obtain high biogas and methane. Therefore, HRT of 15 and 20 days were studied in food waste considered in this study. Once the optimum inoculum-to-feed (I/F) ratio was found, it is also significant to find the best hydraulic retention time that can produce a high volume of biogas [33,42,47]. For that, the one-factor-at-a-time (OFAT) method was also used to evaluate the optimum HRT. Two different times of HRT were considered, 15 days HRT and 20 days HRT by considering the same working volume of 500 mL. Total volatile solid (TVS) content and TCOD concentration in the digester were recorded every day to determine the TVS reduction and TCOD reduction, respectively. Specifically, 16.66 mL of food waste for HRT = 15 days was taken out and sampled, and 12.33 mL was taken out from the digester every day for HRT = 20 days.

3. Results and Discussion

3.1. Study of the Anaerobic Digestion Process of Food Waste

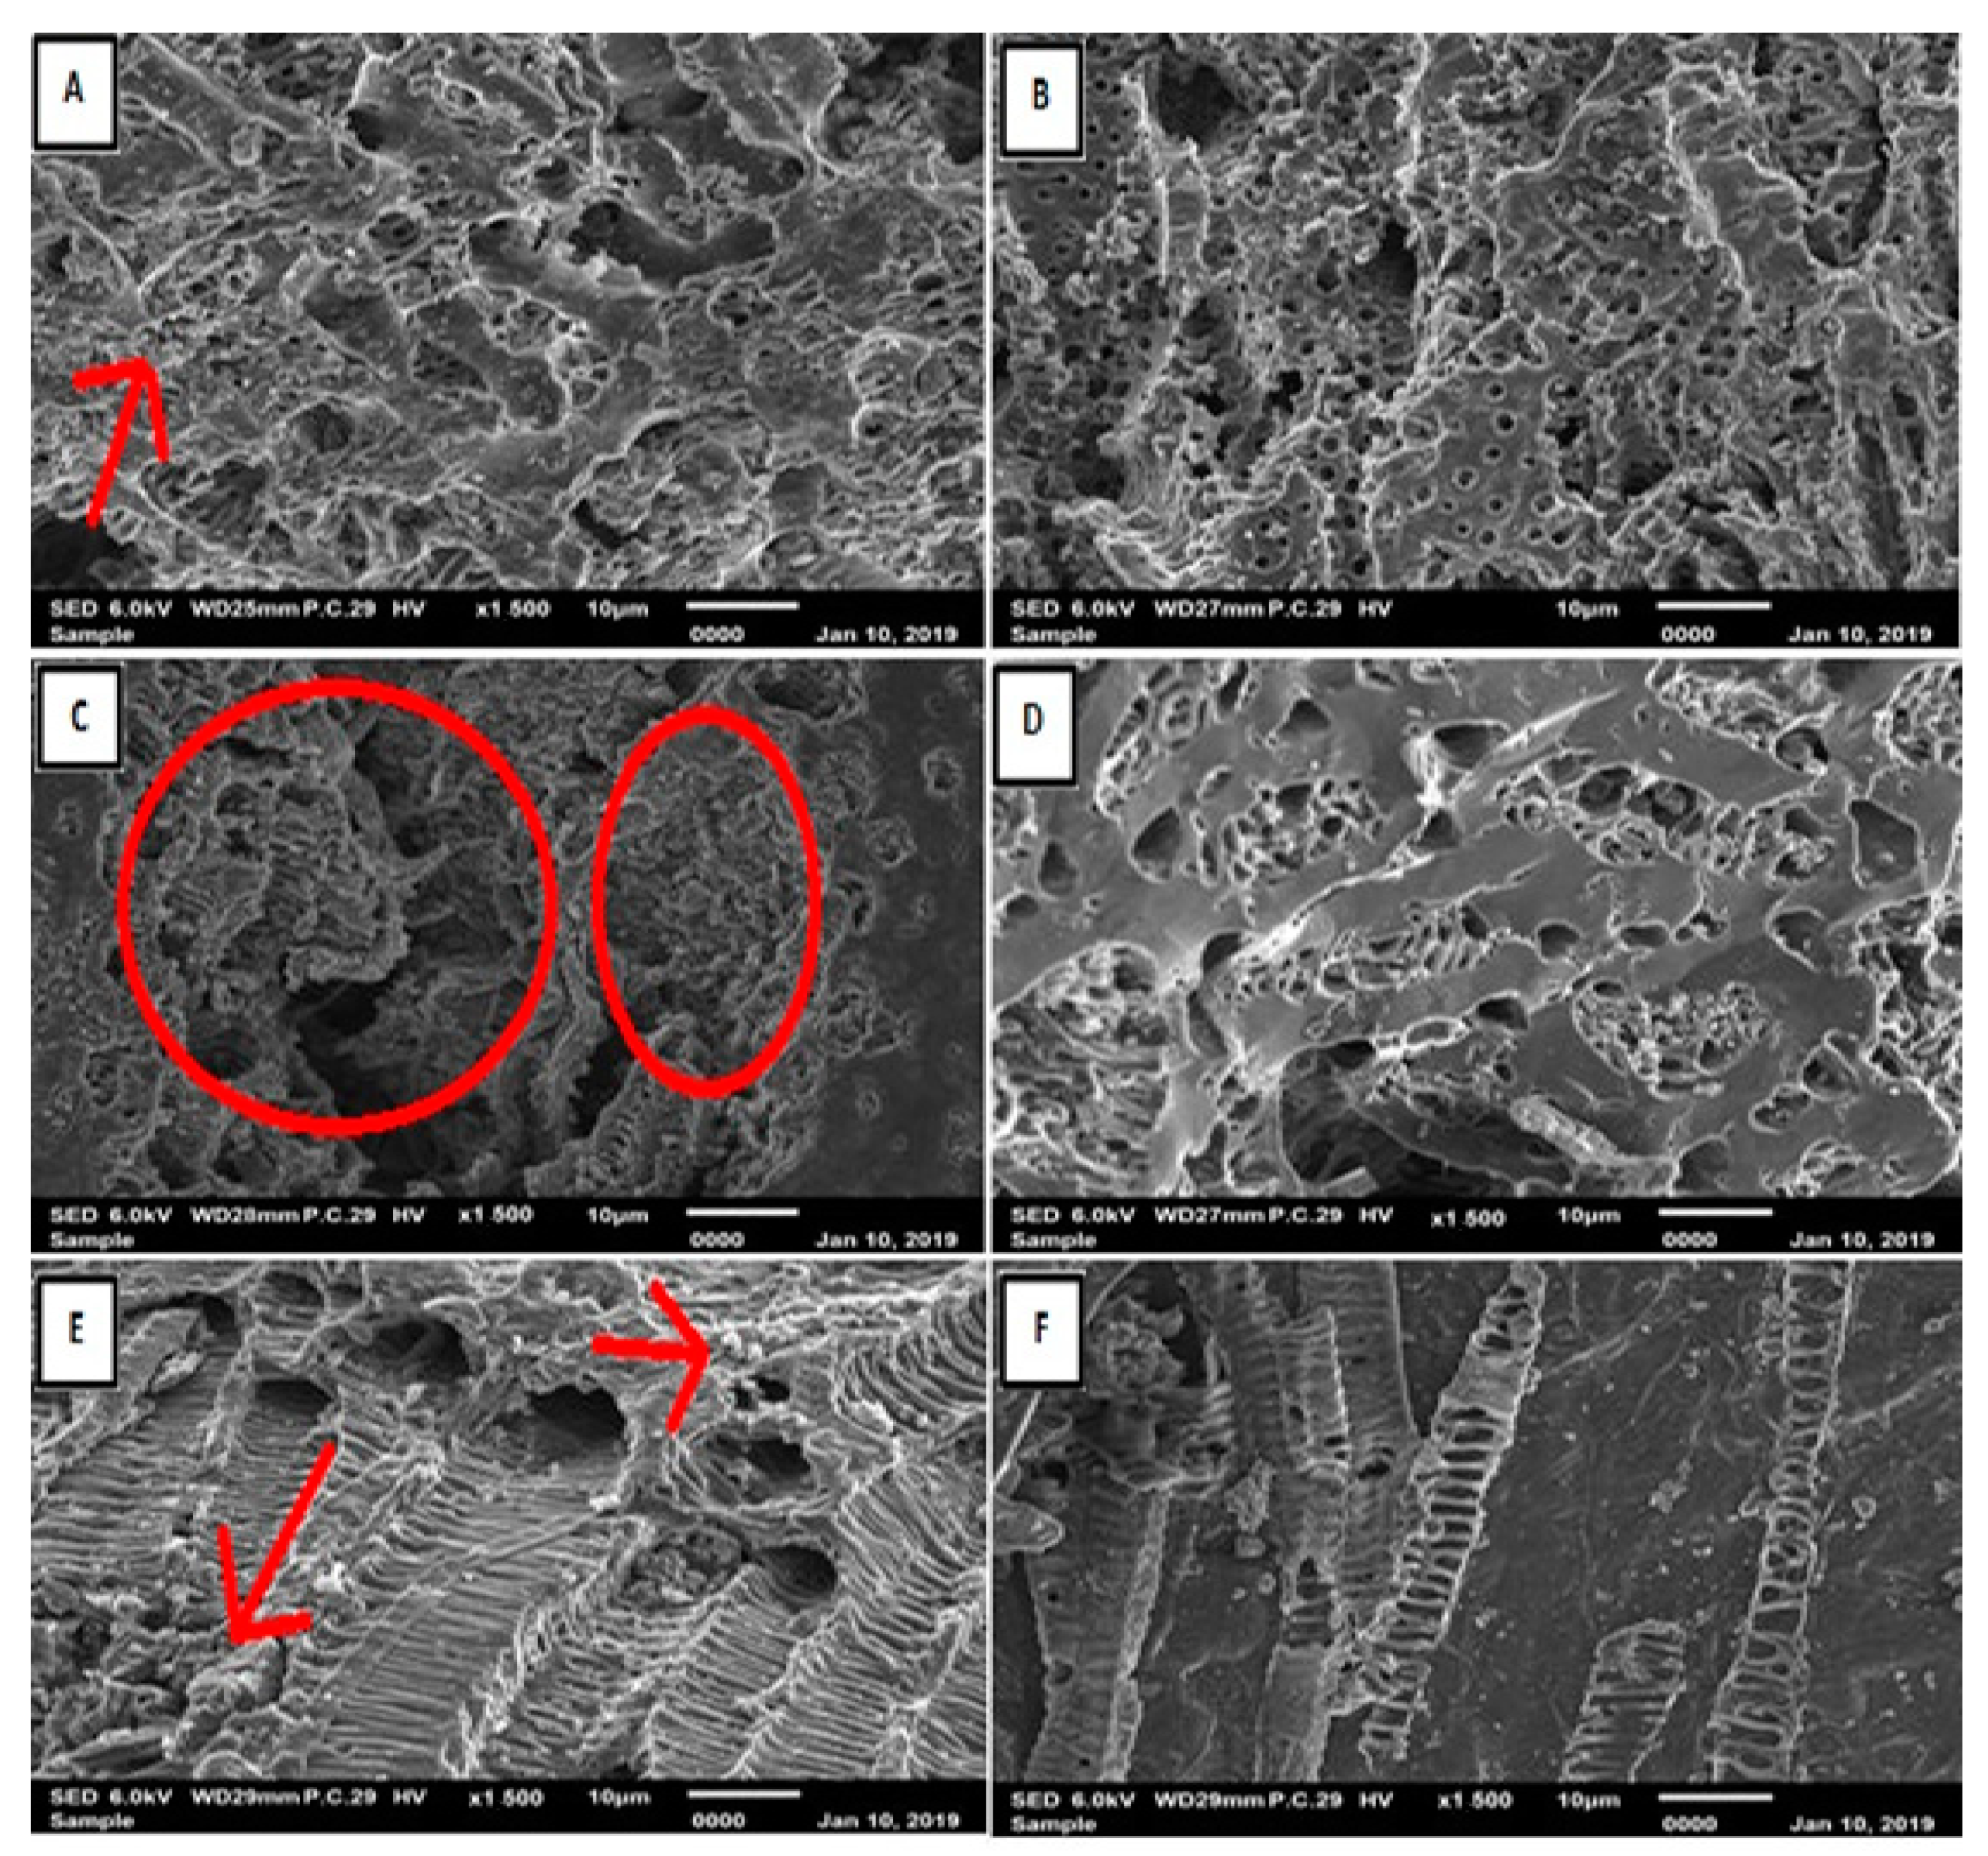
3.1.1. Biofilm Immobilization

Scanning electronic microscopy (SEM) is used to observe the characteristic of biofilm on GAC such as the morphology of biofilm immobilized on the GAC surface. Figure 2 shows the SEM images of the developed biofilm on GAC.
Although the photos were magnified differently (×1000 and ×1500), the magnification with 1500 was used to clearly observe the pore structures and surfaces of the activated carbon after the development of the biofilm. The occupied GAC porosity in Figure 2A,C,E demonstrates the establishment of growing biofilm microcolonies on GAC, but it was challenging to determine the morphologies of the bacteria since they were covered in an EPS layer. However, the activated carbon’s surfaces were exposed and the pores of the GAC controls (images B, D, and F) were not blocked. When compared to the control (D), which had large exposed pores, the occupation was higher on image C and the pores were virtually covered. The image with the highest biomass weight when the biomass weight was calculated was Image C (incubation at 48 h). As a result, the colonization of the biofilms on the GAC surface was extremely low for the first 24 h and moderate for the following 72 h. SEM has allowed to draw the conclusion that, in contrast to the first day of culture, microcolonies evidently developed on days two and three. As a result, the colonization of the biofilms on the GAC surface was extremely low for the first 24 h and moderate for the following 72 h. According to SEM, microcolonies developed significantly more on days two and three of the culture than they did on day one. The attached biomass (biofilm) was measured using the biomass dry weight method, and the added mass on the carrier’s original mass was caused by the attached biofilm. ANOVA was used to analyze the result and investigate the effect of the volume of inoculum and mass of GAC on the immobilization of the biofilm-producing bacteria; a 3D response plot and surface contour plot were plotted as depicted in Figure 3. Based on these graphs, the more the mass of GAC increases dry weight biomass increases; and this explained why the biofilm found more surface to attach to when the mass of GAC increased. This can be expressed with a positive correlation. The maximum biomass dry weight 82 mg/g GAC was achieved at 8 g of GAC. However, as the value of the biomass dry weight is very comparable whether the inoculum volume is 1 mL or 5 mL, the volume of the biofilm-producing bacteria inoculum does not have much of an impact on the biofilm.

3.1.2. Hydrolysis of Food Waste with Biofilm Immobilized on Granular Activated Carbon

To determine the viability of using biofilm in the hydrolysis process for the pretreatment of food waste and the ideal amount of biofilm and time of biodegradation in the hydrolysis process, the effect of the biofilm amounts and biodegradation time on the hydrolysis of FW was examined. By examining the changes in TDS and sCOD over a period of 5 days of hydrolysis, it was possible to determine the factors influencing the hydrolysis process activity, such as hydrolysis time and biofilm volume.

The Changes in Total Solids and Volatile Solids

Based on Figure 4a, TS was initially 114.1 g L−1 before digestion for each flask containing different amounts of biofilm; and after the digestion at day 5, it decreased to 100.5 g L−1, 80.7 g L−1, 80.0 g L−1, 84.0 g L−1, 75.2 g L−1 and 75.5 g L−1 for 328 mg, 492 mg, 656 mg, 820 mg and 984 mg of biofilm amount, respectively. From Figure 1, VS was 110 g L−1 before hydrolysis, and it decreased to 105.6 g L−1, 77.3 g L−1, 76.3 g L−1, 71.1 g L−1 and 71.0 g L−1 for 328 mg, 492 mg, 656 mg, 820 mg and 984 mg of biofilm, respectively, during the considered period. Therefore, [7] have studied the influence of the TS concentration of FW on biogas production in an anaerobic batch digester by considering different TS concentrations of FW. The characteristics of FW used were determined before and after digestion. For the substrate with a TS of 12.5% (125 g L−1) and VS of 119.5 g L−1 before digestion, TS and VS were found to have decreased to 94.2 g L−1 and 83.78 g L−1 respectively. FW with a TS concentration of 100 g L−1 and VS concentration of 95.4 g L−1 reduced to 68.13 g L−1 and 59.64 g L−1, respectively. As a result, biofilm has been used to try to increase the degradation of the organic compound based on TS and VS. Concerning the optimum amount of biofilm, it is observed that the biofilm amount had no effect on the organic compound as the different amounts of biofilm gave TS and VS values close to each other. This means that even small amounts of biofilm can help in the degradation of organic compound and improve hydrolysis of FW. On the other hand, a control with 0 mg of biofilm, which means FW with no attached biofilm, was also studied to see the effect of biofilm on FW hydrolysis. From the values of TS and VS of the control, it is obvious that there was no decrease and there was no degradation of OC in hydrolysis. Additionally, previous works of Yavini et al. (2014) [48] and Orhorhoro et al. (2017) [49] have figured out that the increase in TS value brings about a drop in water volume, which consequently reduces the level of microbial activity, thus decreasing the biogas yield. Orhorhoro et al. (2017) [49] have concluded that biogas production was reduced due to the increase in the percentage of the TS above.

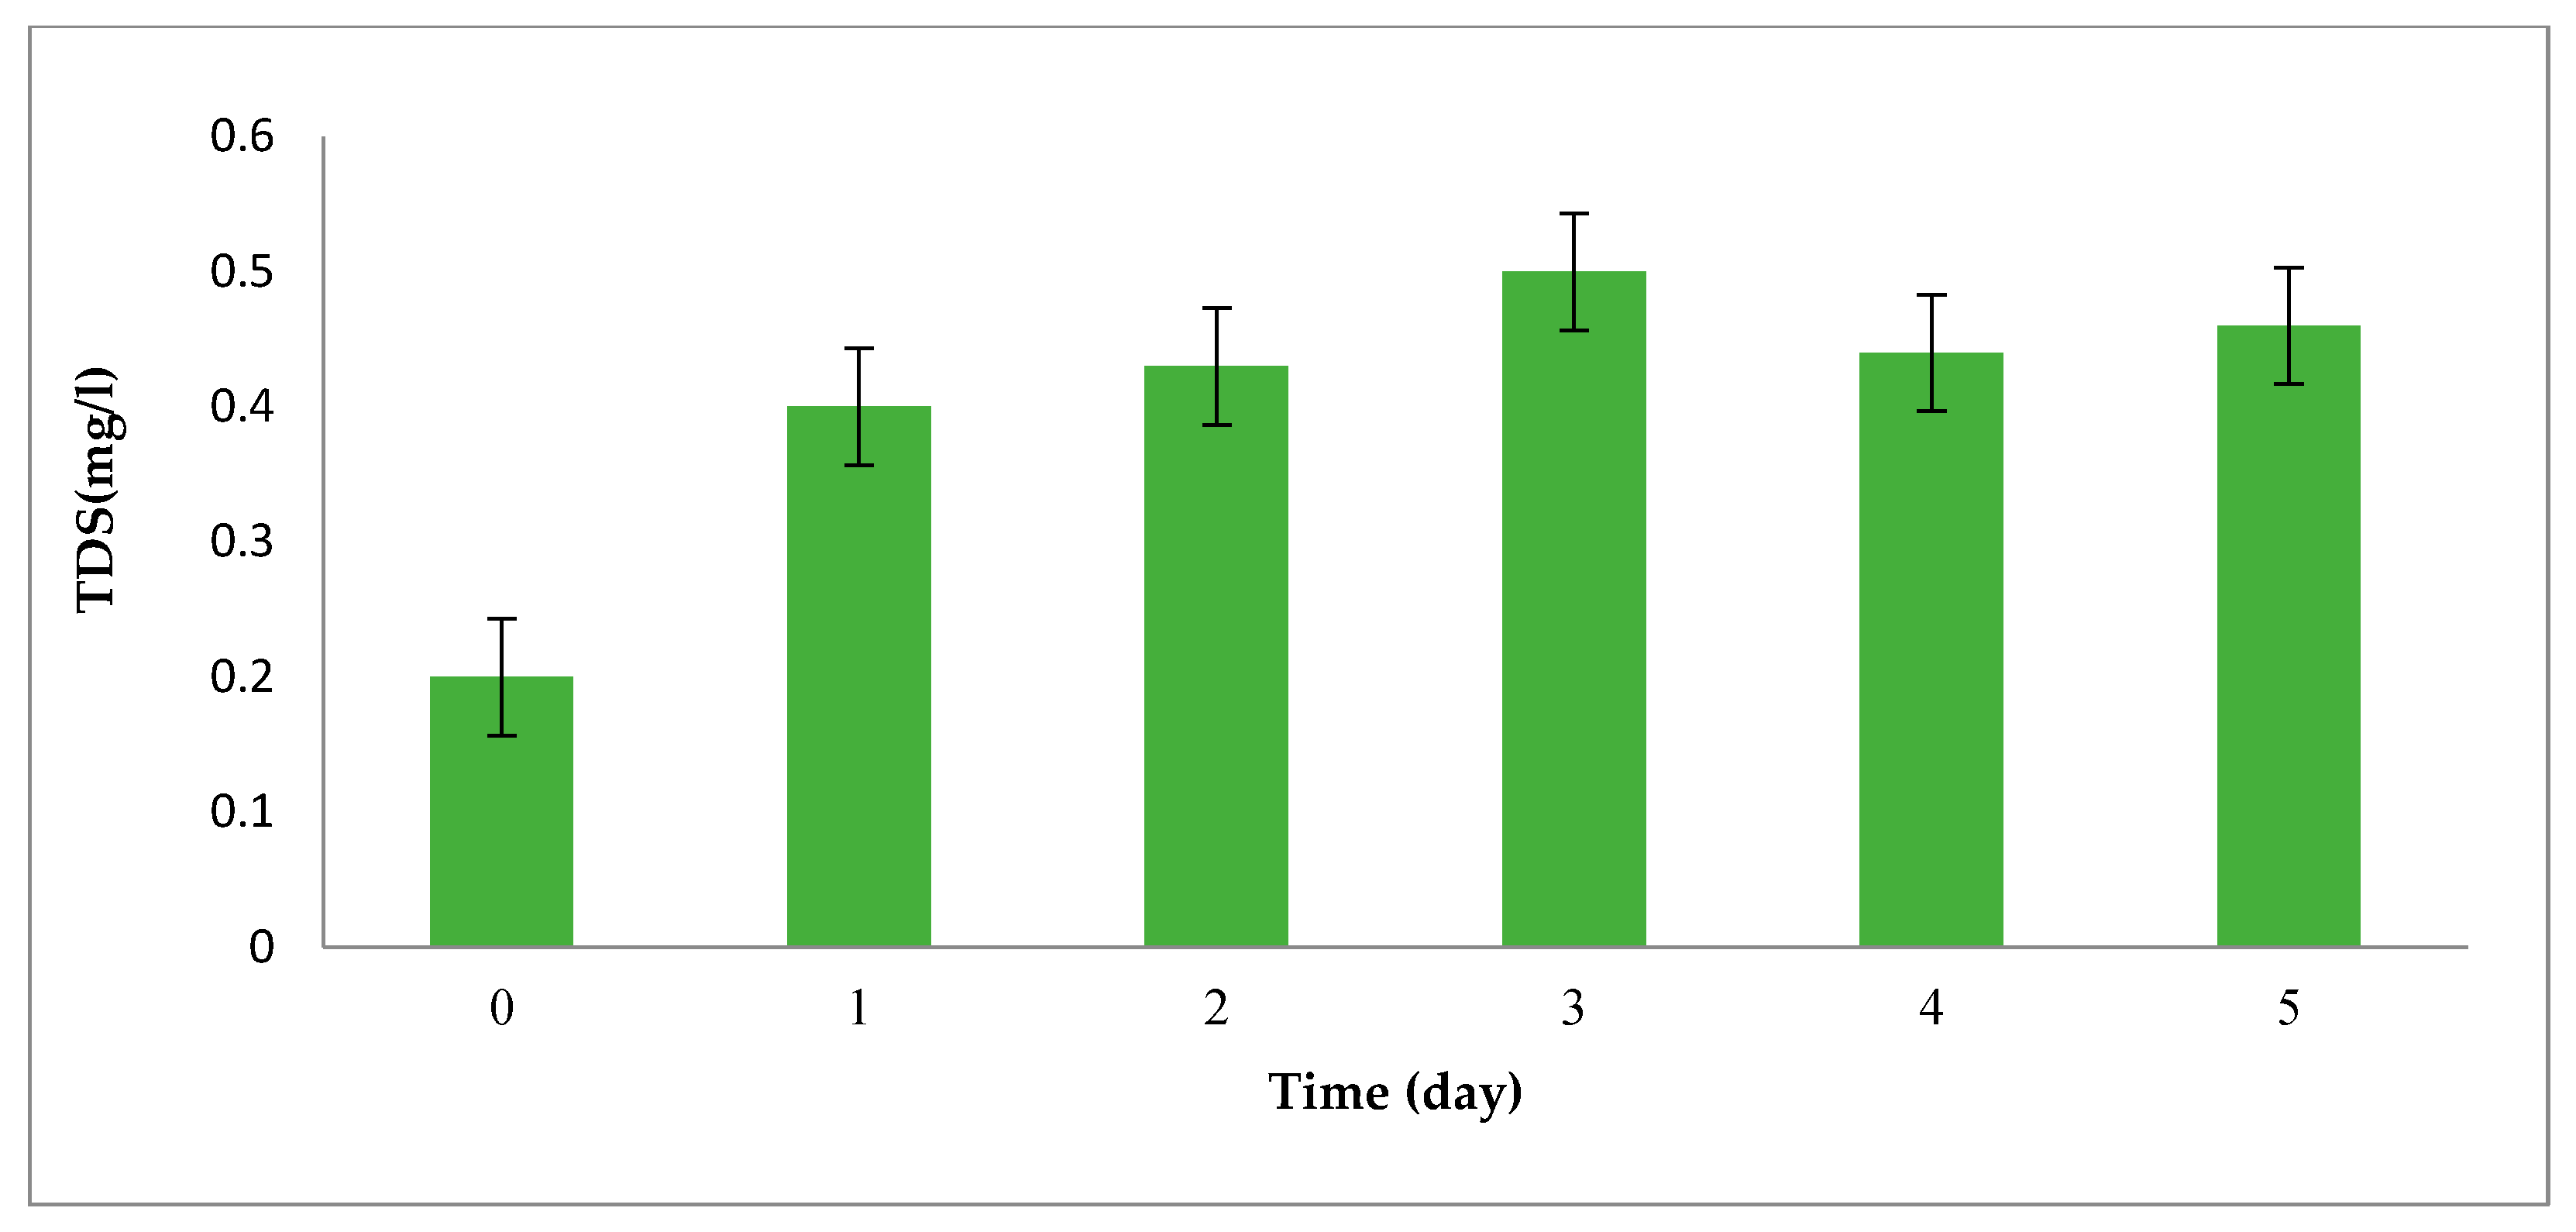
The Changes in Total Dissolved Solid (TDS) of One-Factor-at-Time

TDS are a measure of the dissolved organic and inorganic solid in the suspended form present in a liquid. The experiment was run on the total dissolved solid of hydrolyzed FW to investigate the effect of biofilm and time on the performance of food waste hydrolysis. This is because of TDS concentration levels that increase with respect to the organic matter digestion in anaerobic digestion. Figure 5 gives the TDS concentration obtained in hydrolysis of FW with a mixed mass of GAC and varied digestion times. This experiment has also helped to determine the optimum time for the hydrolysis of FW with immobilized biofilm. From the result, a high TDS content was found in day 3 to day 5, indicating that the dissolved oxygen decreased linearly due to the consumption of oxygen by hydrolysis bacteria.

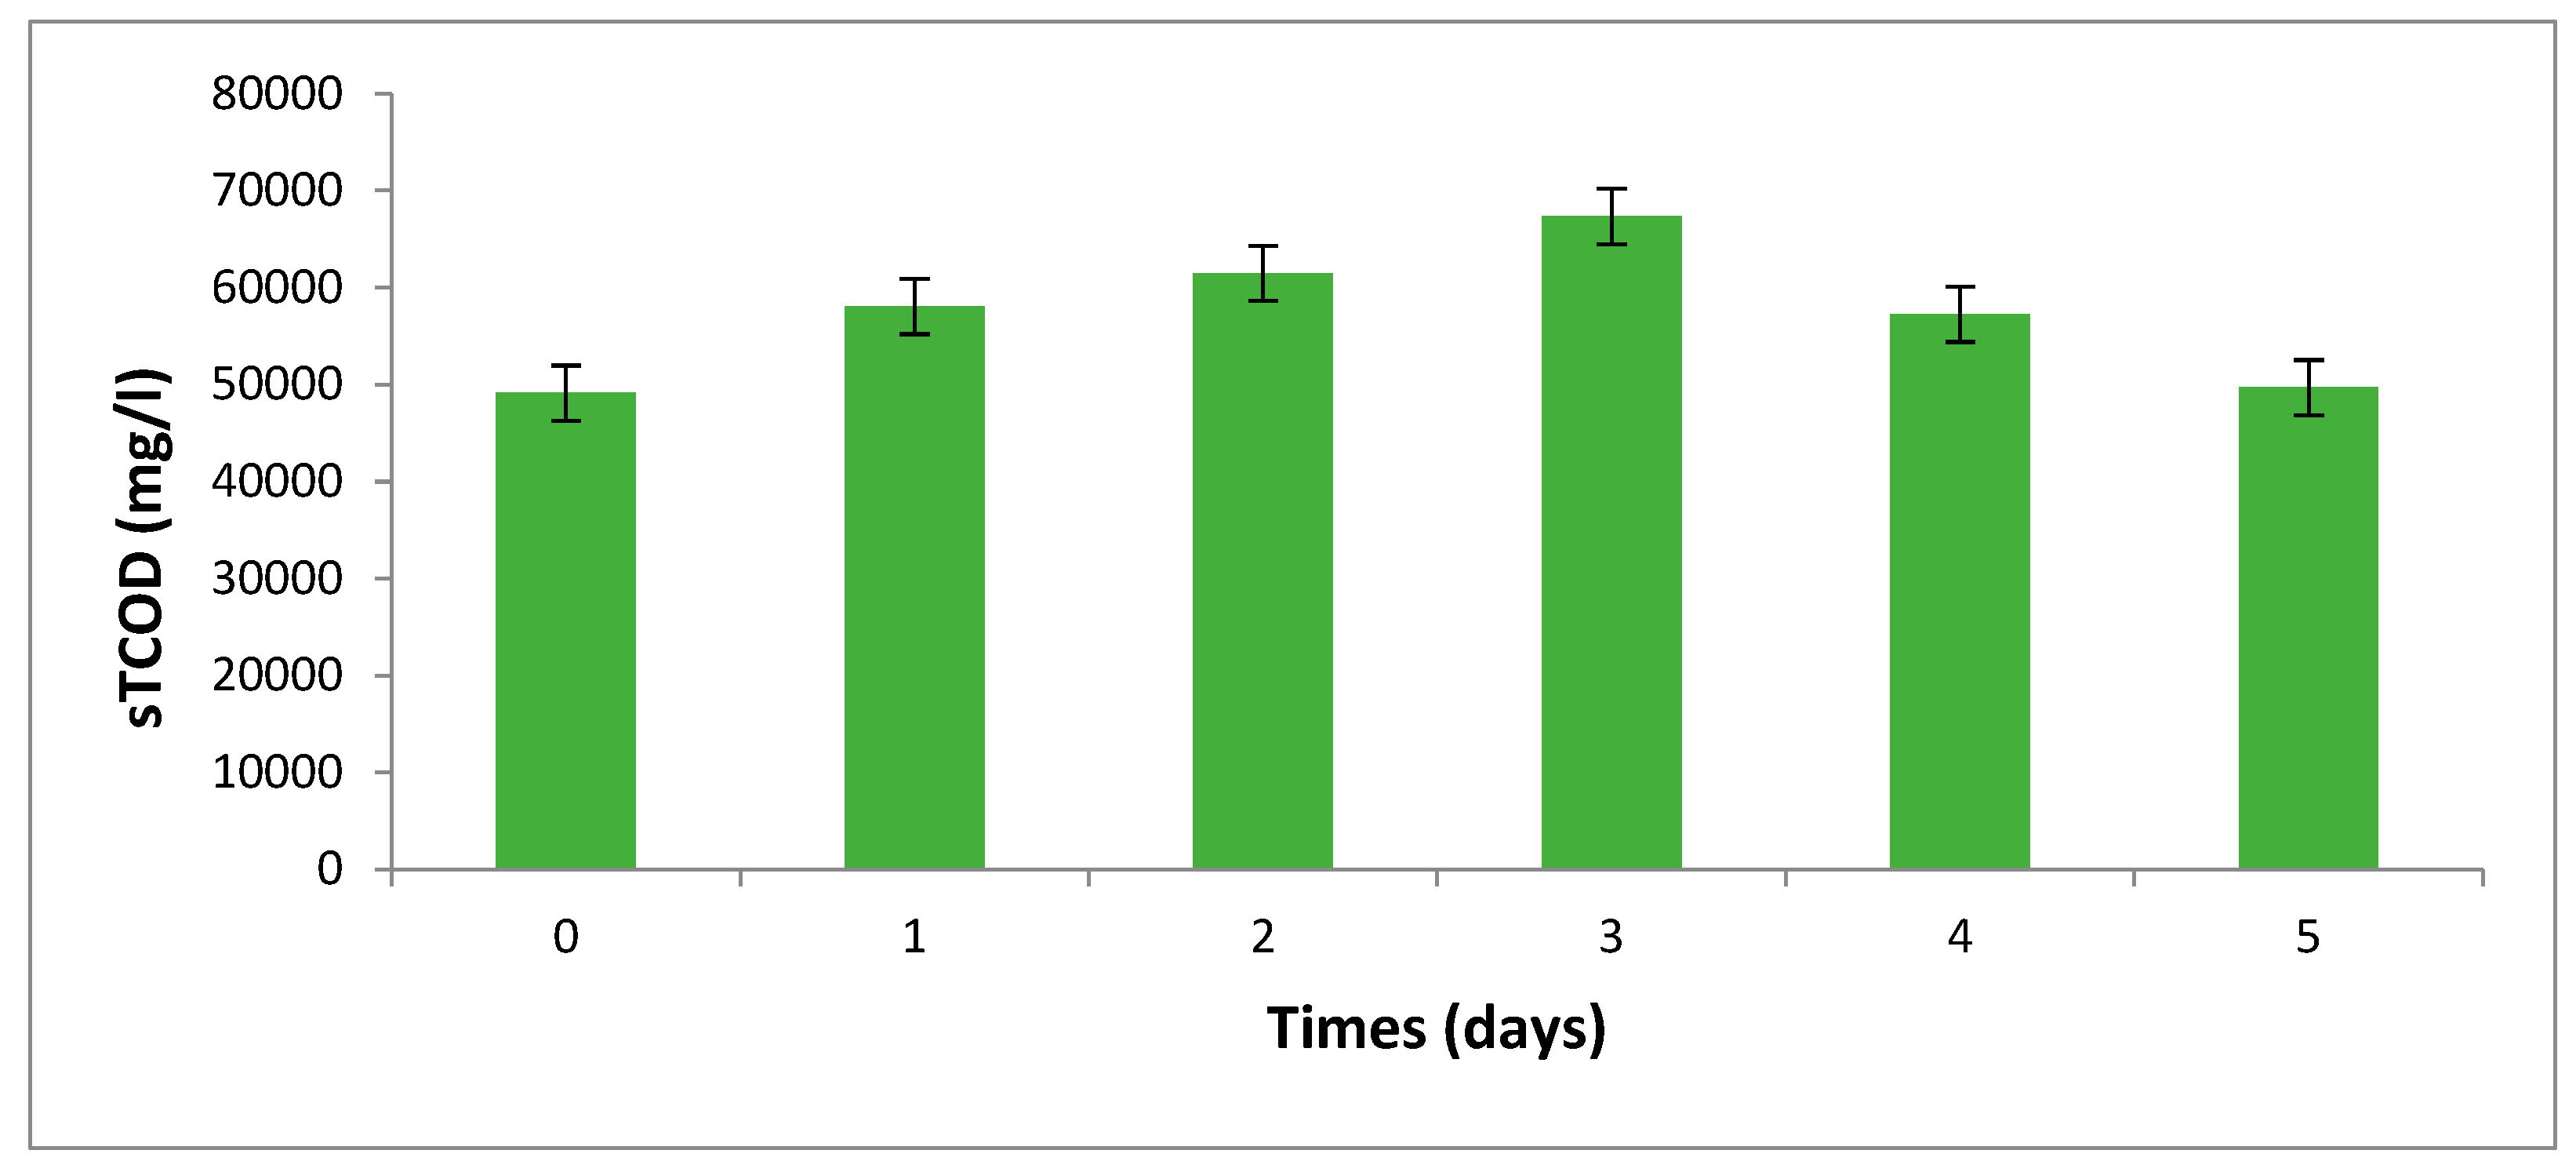
The Changes in Soluble COD of One Factor-at-Time

For a more detailed explanation of the digestion of organic compounds in a biological pretreatment, it has also become essential to evaluate soluble COD. Thus, soluble COD was tested, and Figure 6 shows the changes. From day 0 to day 3, soluble COD increased, and from day 4 to day 5, it significantly reduced. The SCOD changes graph makes it obvious that day three is the best day to hydrolyze food waste, and that the prolonged hydrolysis time may have been caused by the high polymer and organic matter content of the collected food waste. It is important to note that the rate of organic compound decomposition increases as COD becomes more soluble.

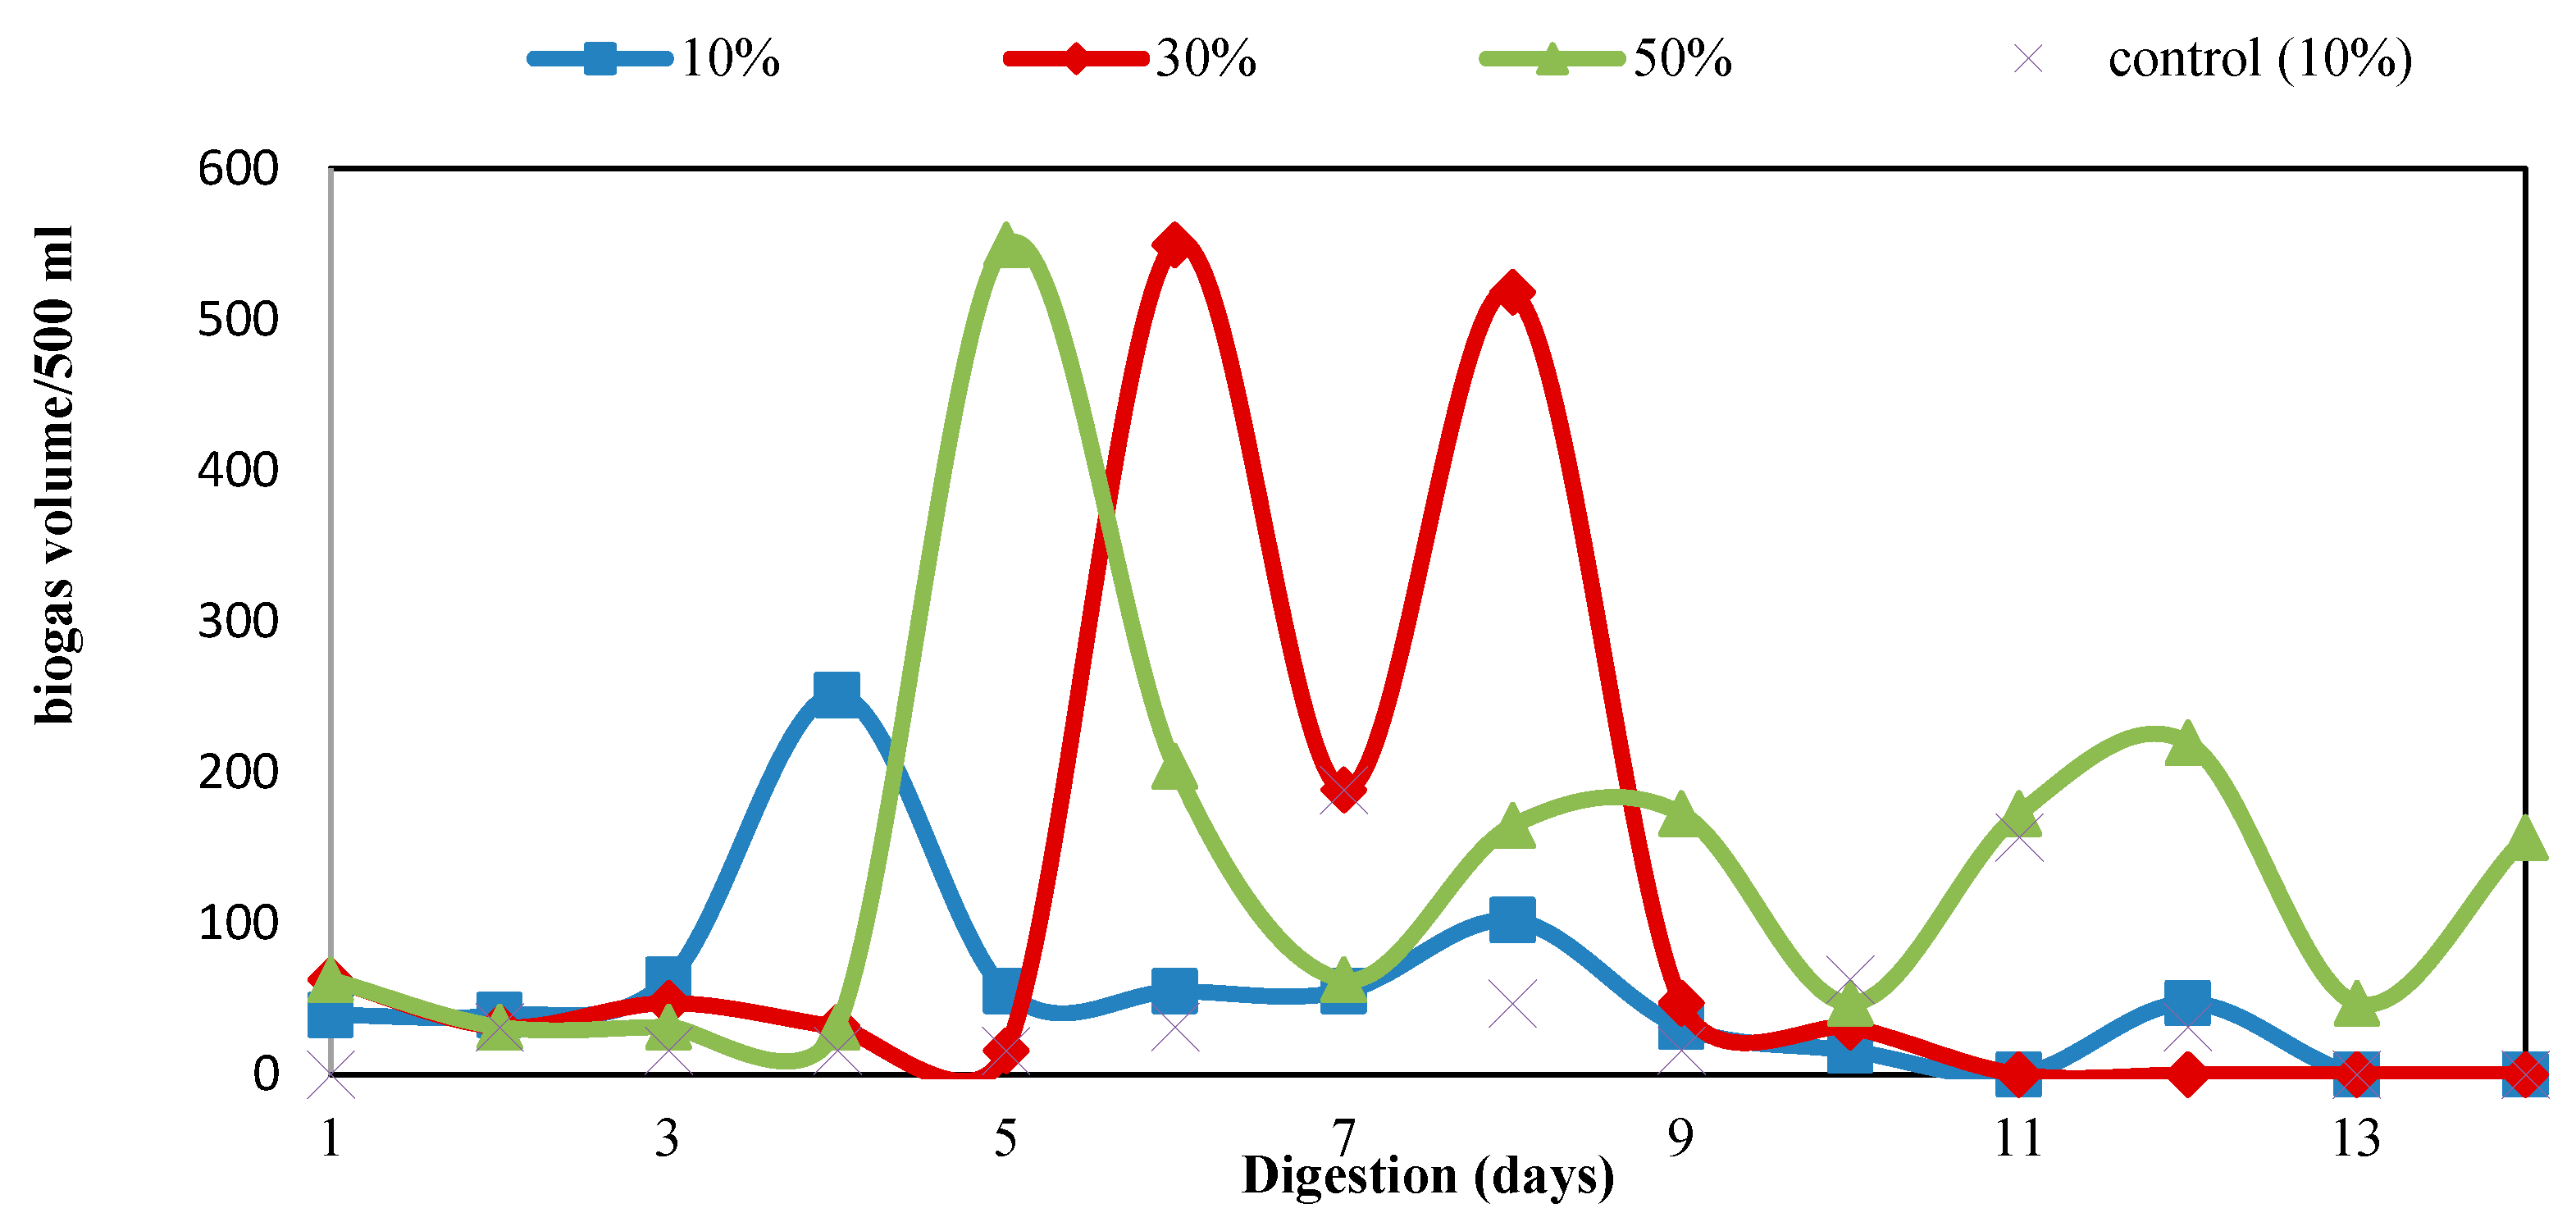
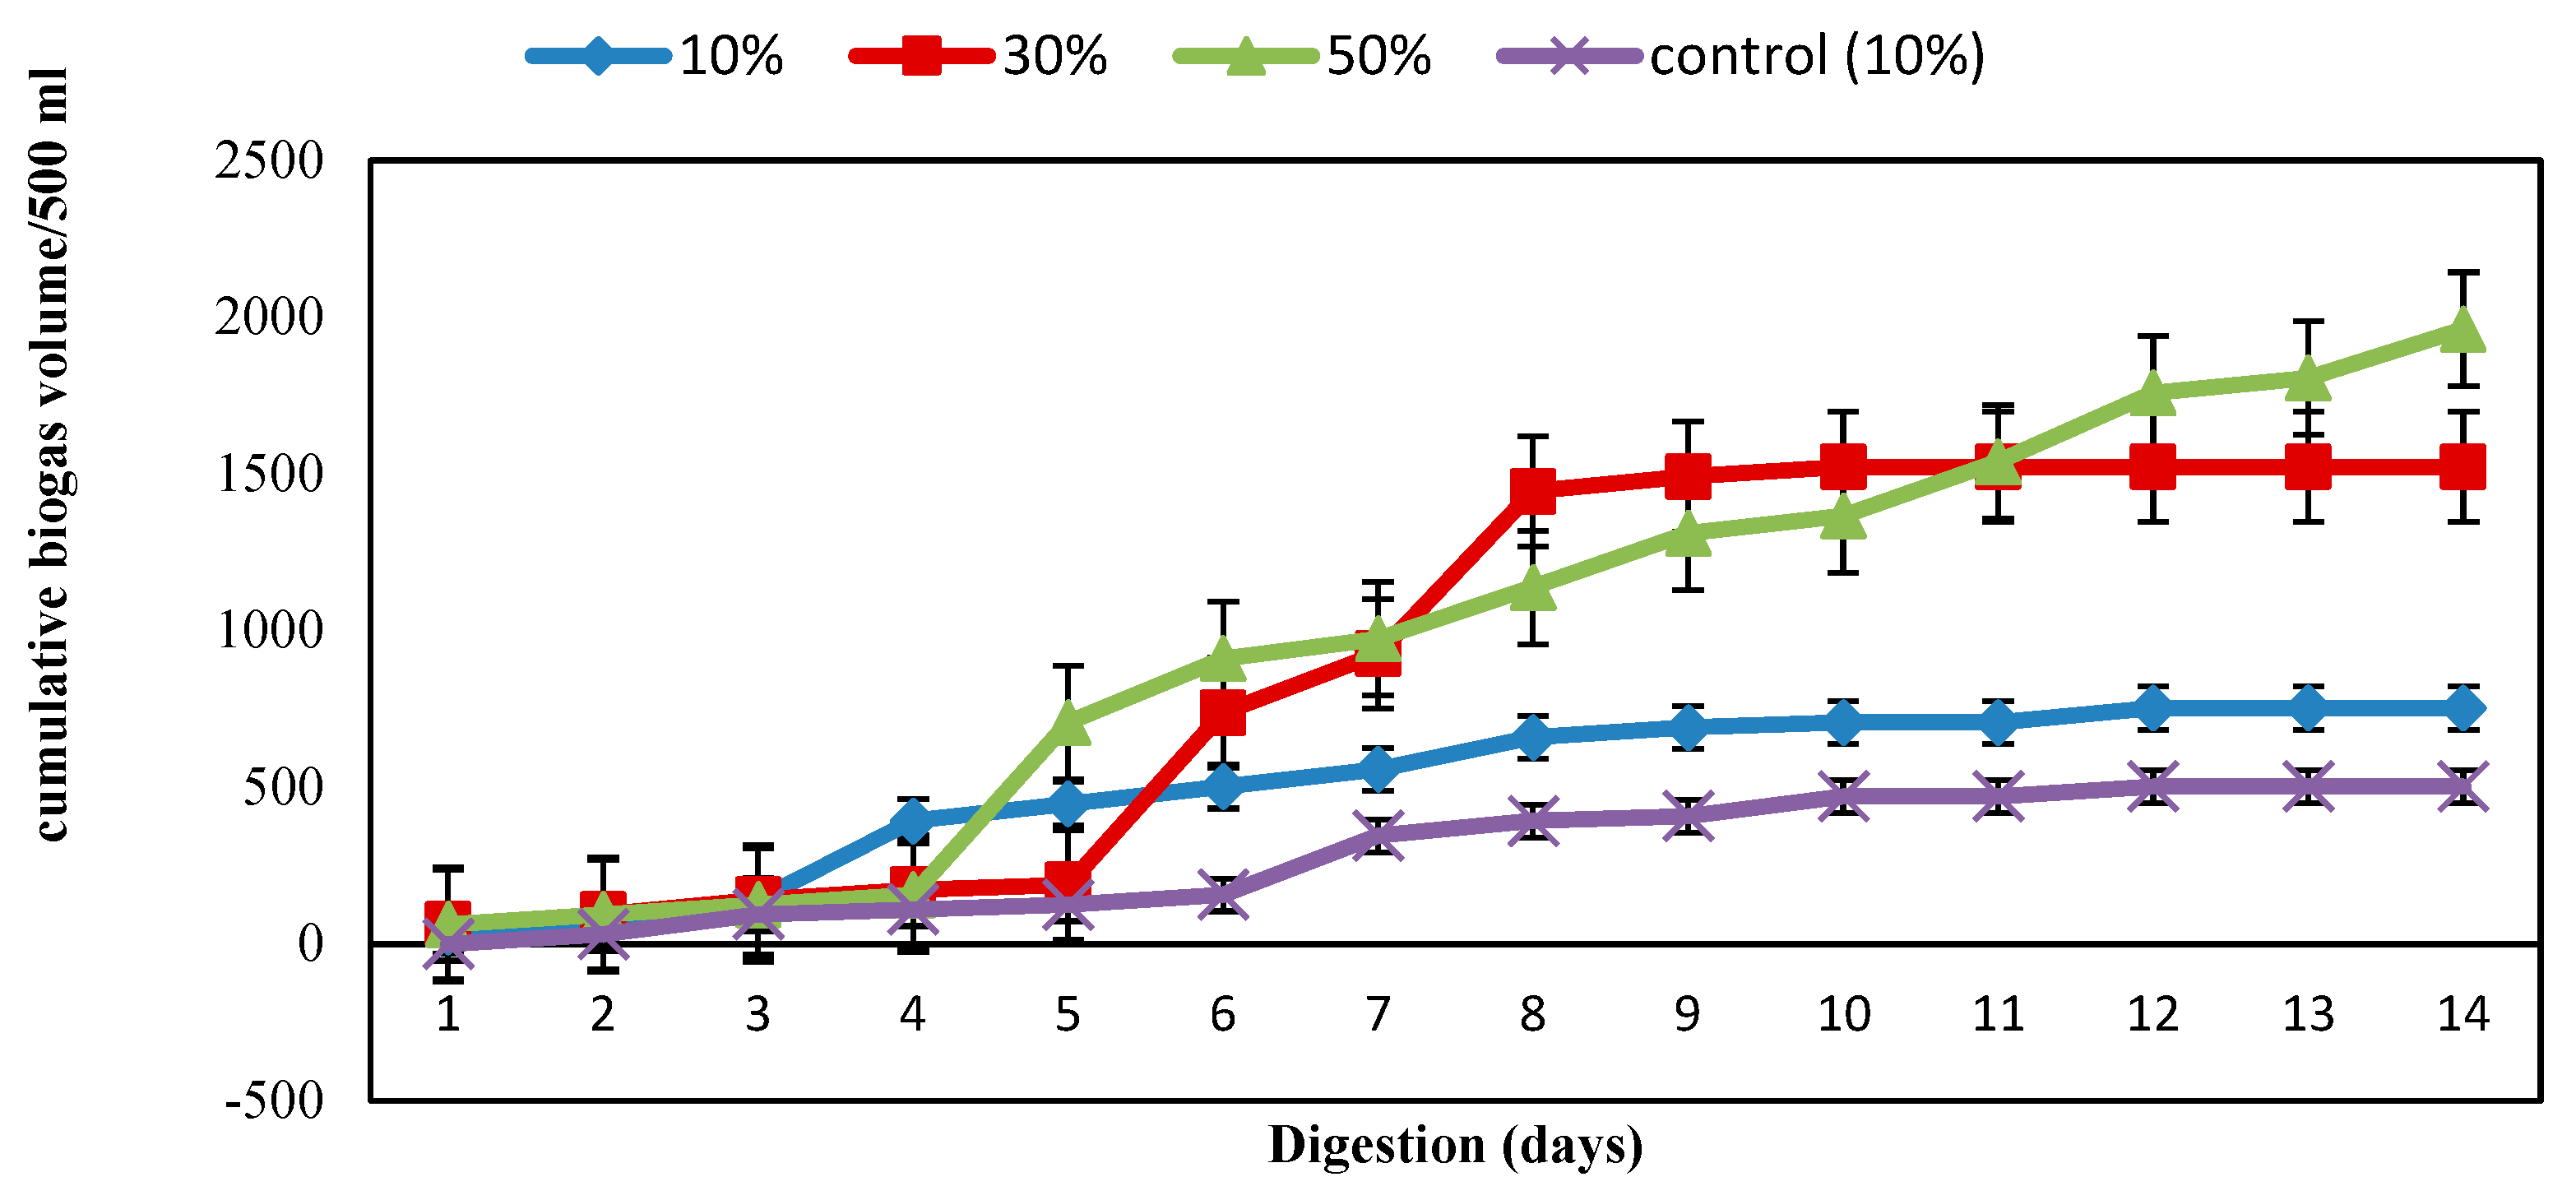
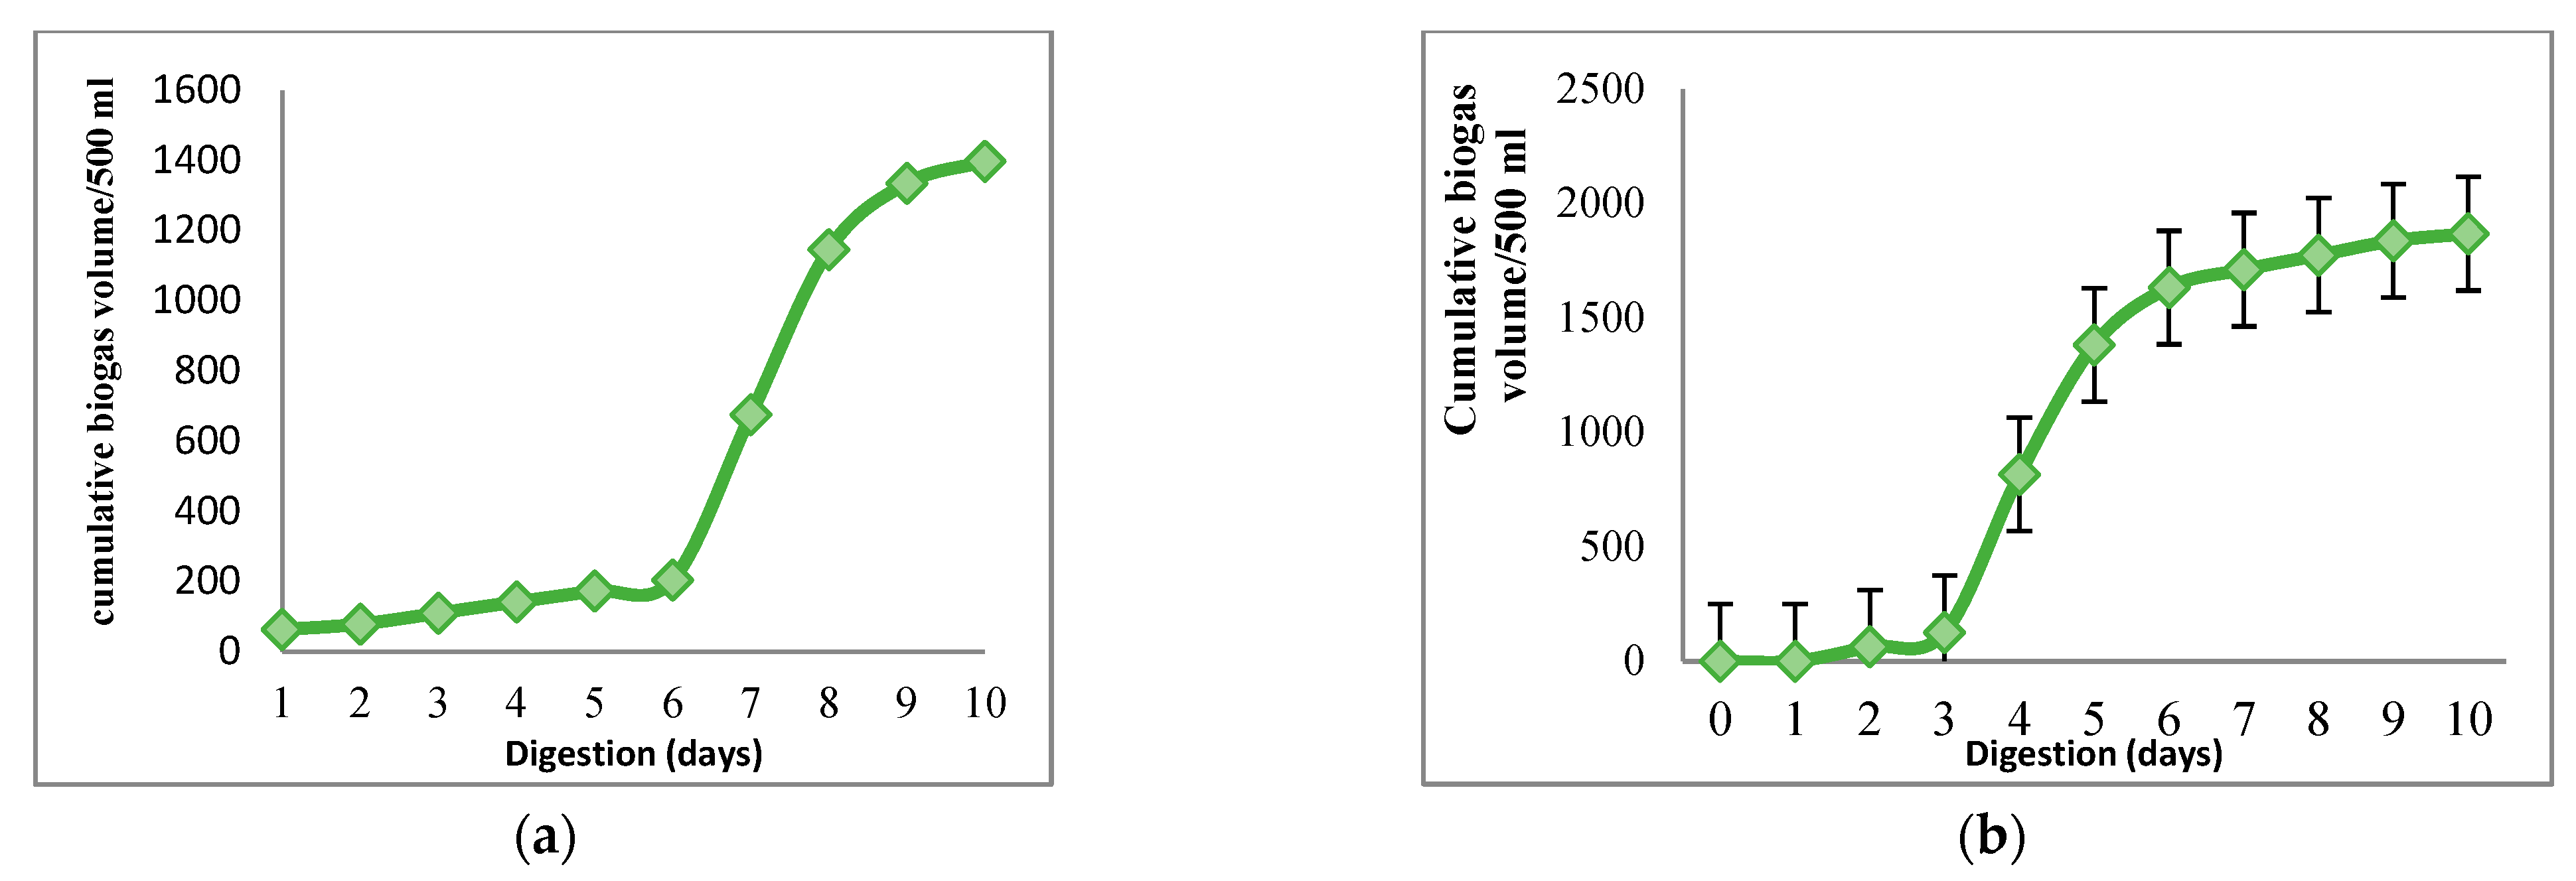
3.2. Biogas Production

The effect of inoculum-to-feed ratio on biogas production by OFAT and the evolution of the biogas produced from hydrolyzed FW with immobilized biofilm was evaluated. Daily production of biogas from the considered digesters with different inoculum and cumulative biogas produced are shown in Figure 7 and Figure 8, respectively. Firstly, daily biogas production was measured each day for 2 weeks and the changes are shown in Figure 7 by fixing HRT at 25 days. Based on the results, biogas production for the three digesters started on the first day and continued increasing slowly until day 3 because the FW used as a feedstock was a solid substrate that contained high carbohydrates which can slow down the start-up of the anaerobic digestion. The production fluctuated but for the digester with 10% and 30% of inoculum, the production of biogas slowed down and for 30%, it stopped after day 10 of operation. For the digester of 50% inoculum, the production fluctuated without ending. Concerning the volume, the variation in the daily biogas production of the three digesters 10%, 30%, and 50% were at their peak from day 4 to day 8 on the considered digestion day. Concerning the volume of the biogas, 30% and 50% reached a high volume that showed a peak of 500 to 600 mL on day 5 for 30% and on day 6 and 8 for 50%. The digester with 10% inoculum had a small peak at day 4 with 250 mL of biogas volume. On the other hand, the control with 10% of inoculum operated without biofilm also produced biogas but the evolution was much more noticeable compared with the others. The first observation is that the start-up was very slow and production started after day 6 with a peak of 230 mL of biogas volume at day 7 and second peak of 220 mL at day 11 until the production was stable from day 12 to the last day, which is day 14. As a result, the biofilm effect was observed at this point whereas the control with no biofilm did not show a high production of biogas. Therefore, the digesters with 30% and 50% inoculum produced a significant amount of biogas per day compared with the digester with 10% of inoculum and the digester of the control.
To observe the variance between the different digesters operated with diverse inoculum, the cumulative biogas production curve was plotted by the OFAT process, as shown above in Figure 8. From the result of the cumulative biogas depicted in Figure 8, the volume of the biogas produced from the three different inoculum ratios had significant trends and the comparisons have facilitated the comprehension of the effect of the hydrolysis, inoculum ratios, and biofilm utilized. First, the control curve (blue) representing 10% of inoculum with no biofilm has the lowest biogas volume and the slowest start-up time. Thus, the curve that characterizes the digester with 10% of inoculum and hydrolyzed FW with immobilized biofilm produced the lowest volume after the control compared to the other ratios. The digester with 30% of inoculum and containing FW hydrolyzed with immobilized biofilm has produced a high volume of gas compared with the digester with 10% of inoculum and the control. Lastly, the digester with a high ratio of inoculum (50%) has the largest volume of biogas produced as shown by the green curve. From the differences in the biogas produced from the control, it can be well-argued that hydrolysis has a huge effect on the anaerobic digestion of food waste by optimizing the feedstock in the substantial production of biogas. However, the differences in the volume of biogas produced from the digesters with the three inoculum ratios indicated the effect of the inoculum ratio on the biogas production. In other words, the volume of biogas produced has increased with the inoculum ratios. The effect in terms of the biofilm was observed by the fact that the three digesters with biofilm produced more biogas compared with the control, which was operated without biofilm [50]. Therefore, the influence of the inoculum ratio in the considered digester performances was well-observed in the Figures (Figure 7 and Figure 8), and the importance of biofilm used in the anaerobic digester was well-documented. In terms of the inoculum ratio, Lopes et al. (2004) [51] studied the influence of the rumen fluid inoculum in the anaerobic digestion of organic waste and found that the better performance in solid waste depends on the number of indigenous anaerobic microorganisms in the rumen. Additionally, Neves et al. (2004) [52], who have worked with kitchen waste, found that using granular sludge as inoculum improved the performance in terms of methane yields, and they also found that there is an optimal inoculum-to-feed ratio that maximizes methane production.
Khadka et al. (2022) [35] have examined the efficiency effect of the substrate-to-inoculum ratios on the kinetics of biogas production during the mesophilic anaerobic digestion of food waste VS removal efficiency and found it is greater in higher S:I ratios, with a maximum of 78.80% at the S:I ratio of 6, supported by the longer incubation time. Additionally, the representation of cumulative biogas as mL of cumulated biogas volume/g of VS loaded is shown in Figure 9.
Figure 10 sums up the total volume produced from each digester, and it is clearly perceived that 50% of inoculum has produced the highest biogas volume, which was about 2000 mL. A digester with a 30% inoculum ratio produced 1600 mL, which showed the second-highest volume of biogas. Thus, the digester with 10% inoculum produced 1000 mL of biogas, revealing the lowest volume compared with the digesters with 30% and 50%. Biogas produced from the control was around 500 mL, which was the lowest volume obtained compared wirh the other three digesters. Consequently, the three digesters fed with hydrolyzed food waste presented an increased volume of biogas compared with Pavi et al. (2017) [53] who found 493.8 mL/g VS of cumulated biogas in the case of fruit and vegetable waste. Additionally, Yang et al. (2015) [54] found only 171 mL/g TS of cumulative biogas produced from food wastes collected from a canteen in Jiangnan University, which consisted of rice, meats, vegetables, bones, etc.

3.3. Performance Parameters of the Digestion Process
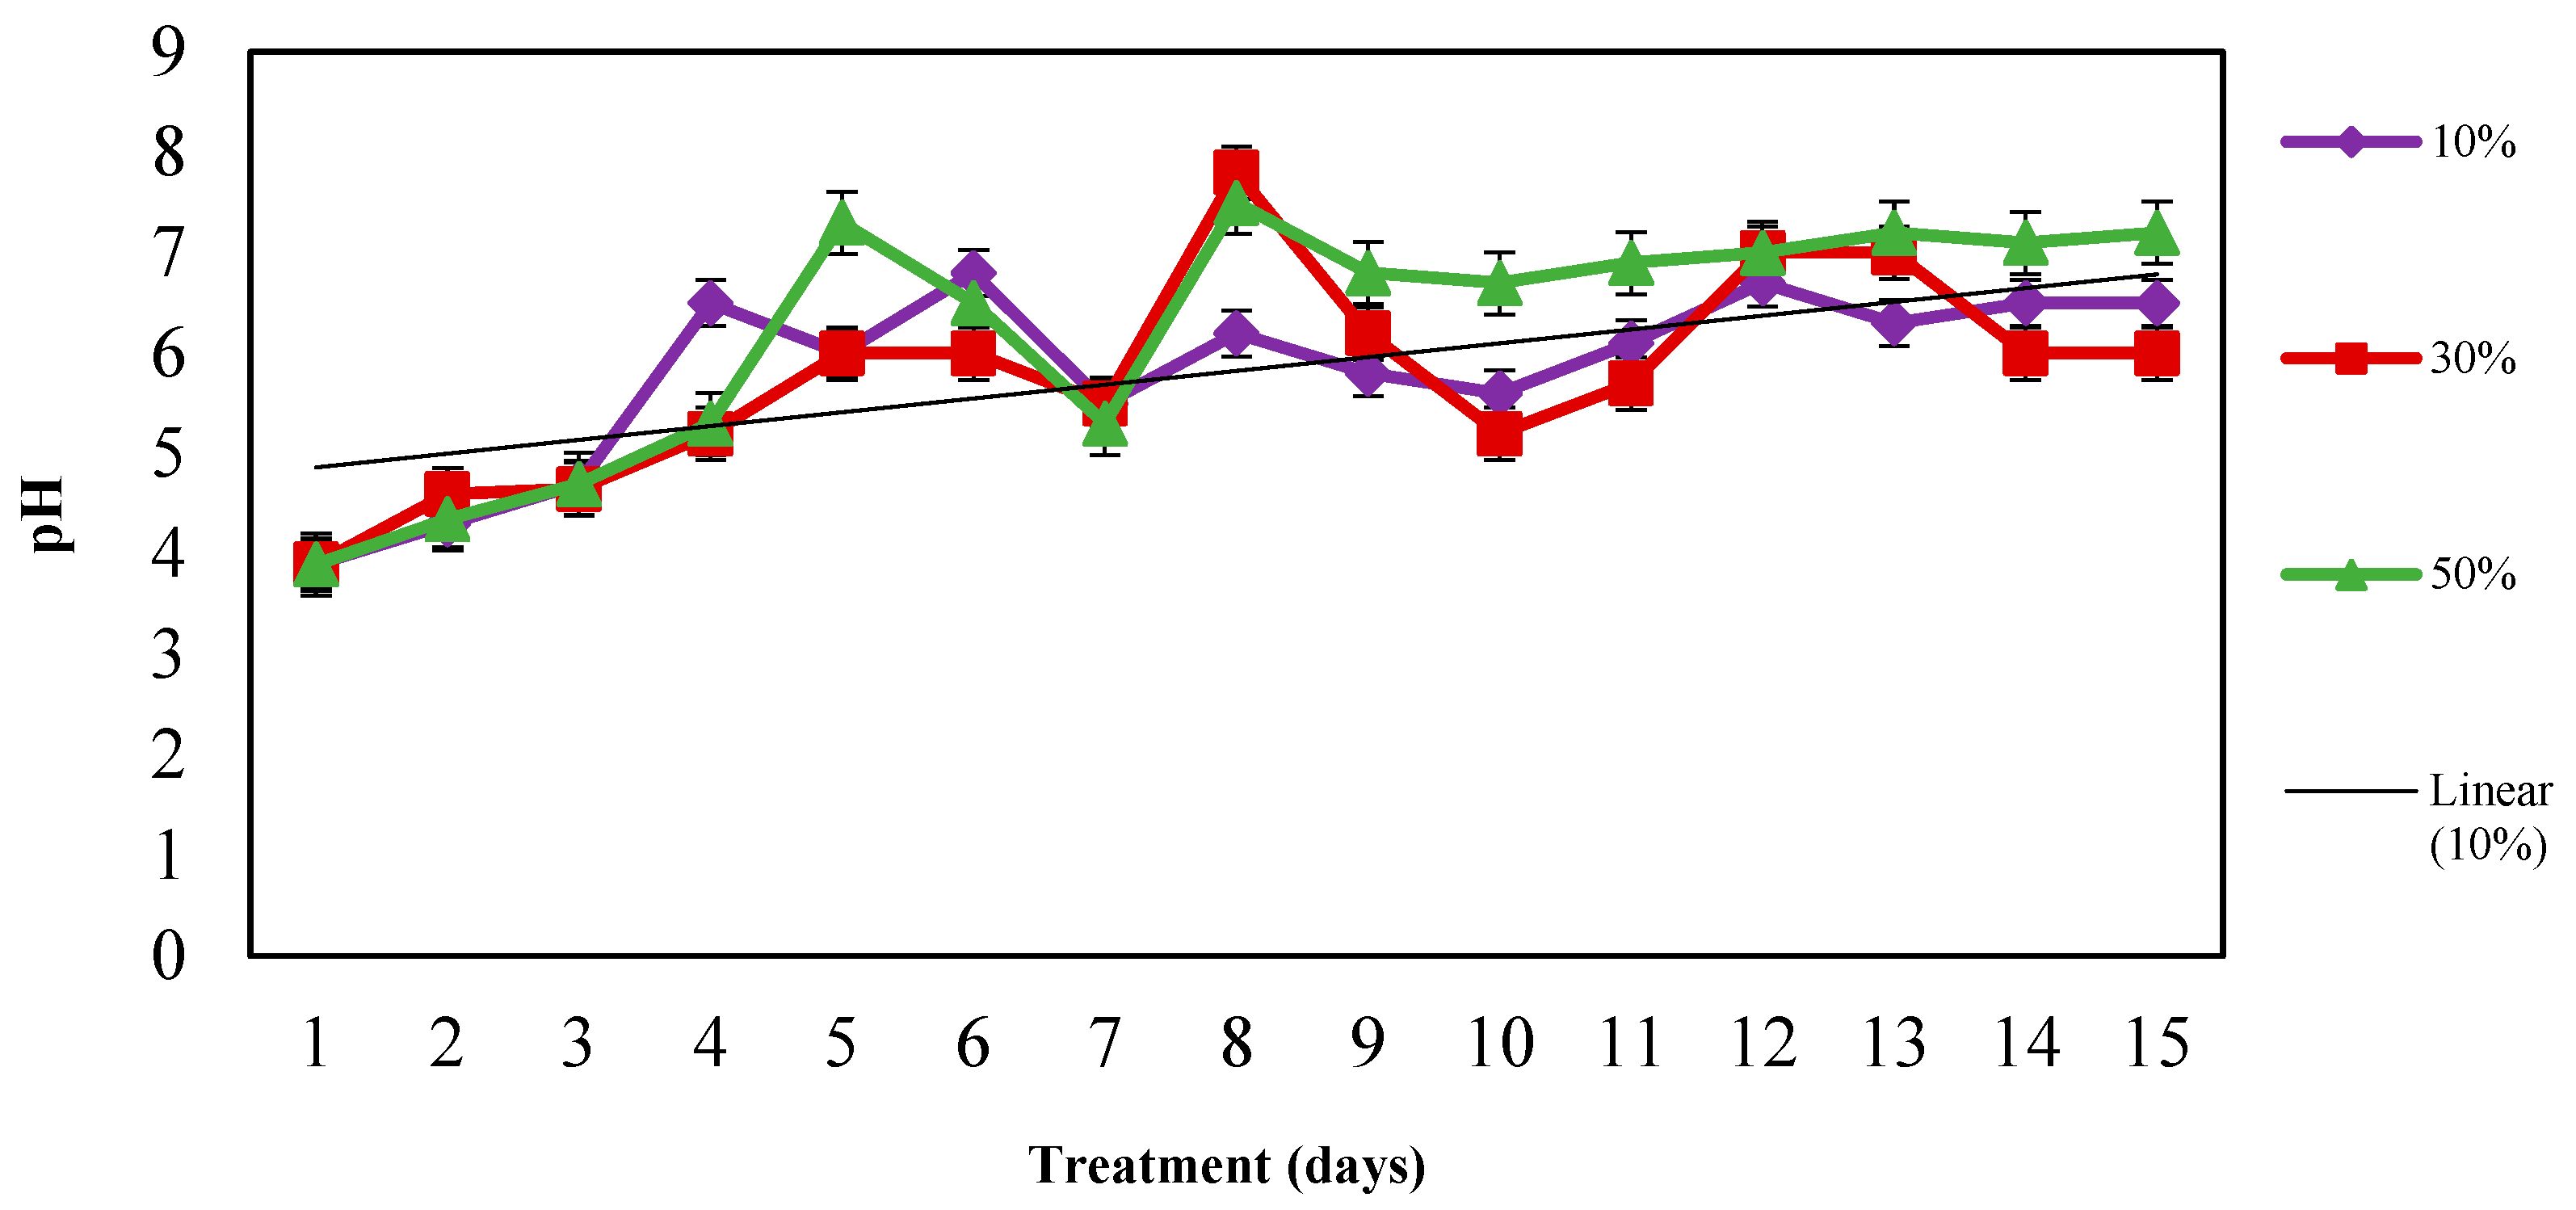
3.3.1. pH

pH is a very significant parameter that has an effect on the anaerobic digestion process. The microbial populations in the anaerobic digesters are very complex, and it is essential to control pH in anaerobic digestion by a strong base such as sodium hydroxide. The aim of controlling pH was to evaluate the delay in hydrolysis, which has low pH values and avoids the accumulation of VFA that can affect the microbial population. The pH in anaerobic digestion is in the range of 6 to 8 in general but the optimum range is pH = 7, according to many researchers [8,54,55]. In this study, pH was fixed at 7 each day after sampling and the changes are shown in Figure 10. From the results, pH was varied even though the pH was adjusted every day, and this shows the presence of biofilms in the digesters and the effect of these biofilms on the variation of pH inside the anaerobic digesters. Initially, the pH was acid (pH = 4) and increased slowly till day 3. From day 3 to day 4, the pH was augmented to 7.3 in the digester with 10% of inoculum, 5.3 for the digesters with 30% and 50% of inoculum. In general, the variation of pH was observable between day 4 and day 12. This period produced a high production of biogas when compared to Figure 7 and Figure 8, which represent the volume of biogas produced from each digester. The results illustrate that biogas volume and degradation efficiency were substantially higher for pH ranging between 6 to 8.
According to Leung et al. (2016) [23] and Pramanik et al. (2019) [56], the ideal pH ranges for hydrolysis are 6, 6–7 for acetogenesis, and for methanogenesis it is almost 6.5–7.5. For methanogenic bacteria, the optimum performance in a pH range of 7.5–8.3 has been shown by the experiment of Ajayi-Banji et al. (2022) [57]. In this study, the pH shows the maximum biogas production from the 6.5 to 7.5 range, which is favorable to the gas production in the AD system. The acidic fermentation occurred at pH 4.5–6 for day 3 to day 6 (Figure 11). As stated by Li et al. (2017) [58], the pH values of the considered digesters fell between the 4.0–8.5 range for fermentative bacteria and 6.5–7.2 for methanogens, which is the optimal range for AD [8], and the alkaline microenvironment displayed no VFA buildup throughout digestion.

3.3.2. Total Volatile Solid Content (TVS) and TVS Reduction

The variations in TVS content in the digesters are presented in Figure 12. Therefore, it is required to understand the role of the total solids and volatile content on the behavior of the microbial communities involved in the anaerobic digestion of organic matter, which leads to the performance of the process. TVS content has decreased over the period for all four digesters, which has shown the efficiency of the anaerobic digester used in this study. For more detailed analysis, the TVS content of the digester with 50% innoclum, which showed high biogas production, has the lowest TVS content compared with the TVS content of the other digesters. The TVS content of the digester with 10% and 30% show a similar trend. For the digester used as a control, TVS content variation was highest compared with other TVS changes. These differences have illustrated that biofilm bacteria help methanogenesis to digest organic matter by reducing the TVS content of the organic compound in the digesters. TVS reduction was intended for further analysis as characterized in Figure 13.
Volatile solids reduction measurement in anaerobic digestion is an indirect measurement of organic compounds utilized in the anaerobic digester. Therefore, in this study, the TVS reduction was calculated to measure organic matter transformed into biogas. From the graphic analysis, TVS has increased over the period starting from day 0 with 0% removal for each digester and ended at day 14 with TVS reduction of around 60% for the digester with 50% inoculum, 43.4% for the digesters with 30% and 10%, and only 29% for the control. Overall, TVS reduction in the digesters by 10%, 30%, and 50% increased similarly and the difference between the TVS reduction of each digester was not significant. TVS reductions in the three digesters of the hydrolyzed food waste with biofilm were higher than the TVS reduction in the digester without hydrolysis and biofilm. Obviously, biofilm is capable of reducing the high amount of TVS and producing a significant volume of biogas based on the comparison between the biogas volume produced and TVS reduction represented in the figures. Thus, several studies have reported that TVS reduction for food waste anaerobic was mostly varied between 40 to 60%, as shown in this study [44,59]. For additional information, the total TCOD of the digesters at the initial and final mwere measured and TCOD reduction was calculated as represented in the following section.

3.3.3. TCOD and TCOD Reduction

Figure 14a,b represent total TCOD initially and TCOD on the last day in each digester and TCOD removal found from each digester, respectively. The total COD of the last day in the four considered digesters has decreased compared with the initial total COD of each digester. Therefore, the reduction of total COD content means an increase in biodegradability of the anaerobic digester as reported by Hamawand & Baillie (2015) [58]. This was also established in this experiment where the total COD effluents of each digester were lower than the total COD of the influents. For additional analysis, TCOD removal was calculated from total TCOD content and it was noticed that the percentage of TCOD removal has increased with the inoculum ratio. The digester with a 50% inoculum ratio had the highest TCOD removal of 56%, and TCOD removal of 30% and 10% were 43% and 33%, respectively. Thus, the control digester removed only 29% of TCOD, which was close to the TCOD removal of 10%. In terms of TCOD removal, the differences were not clear but TCOD removal of the control was identified as the lowest TCOD removed. The percentage of the TCOD removal of vegetables and fruit was found to be 38.9%, especially banana waste [60,61]. The COD removal range was 54–85% for mesophilic and 61–86% for thermophilic conditions of food waste collected from a cafeteria located on the campus of Daegu University as stated by Kumar et al. (2015) [62].
In co-digestion studies, Ounsaneha et al. (2021) [63] have discovered the average values of the COD removal efficiency at 30, 20, and 10 days of HRT were 49.69 ± 6.86, 54.15 ± 4.36, and 65.91 ± 8.46%, respectively. Earlier, Nayono et al. (2010) [64] have presented a COD removal efficiency ranging from 54% to 62% with anaerobic co-digestion of bio-waste and food waste because the decreased HRT operation directly affected the COD removal efficiency of the reactor. This study’s findings indicate a higher COD removal efficiency that ranked from 29% (control) to 56% (digester with 50% of inoculum) showing a higher COD removal efficiency.

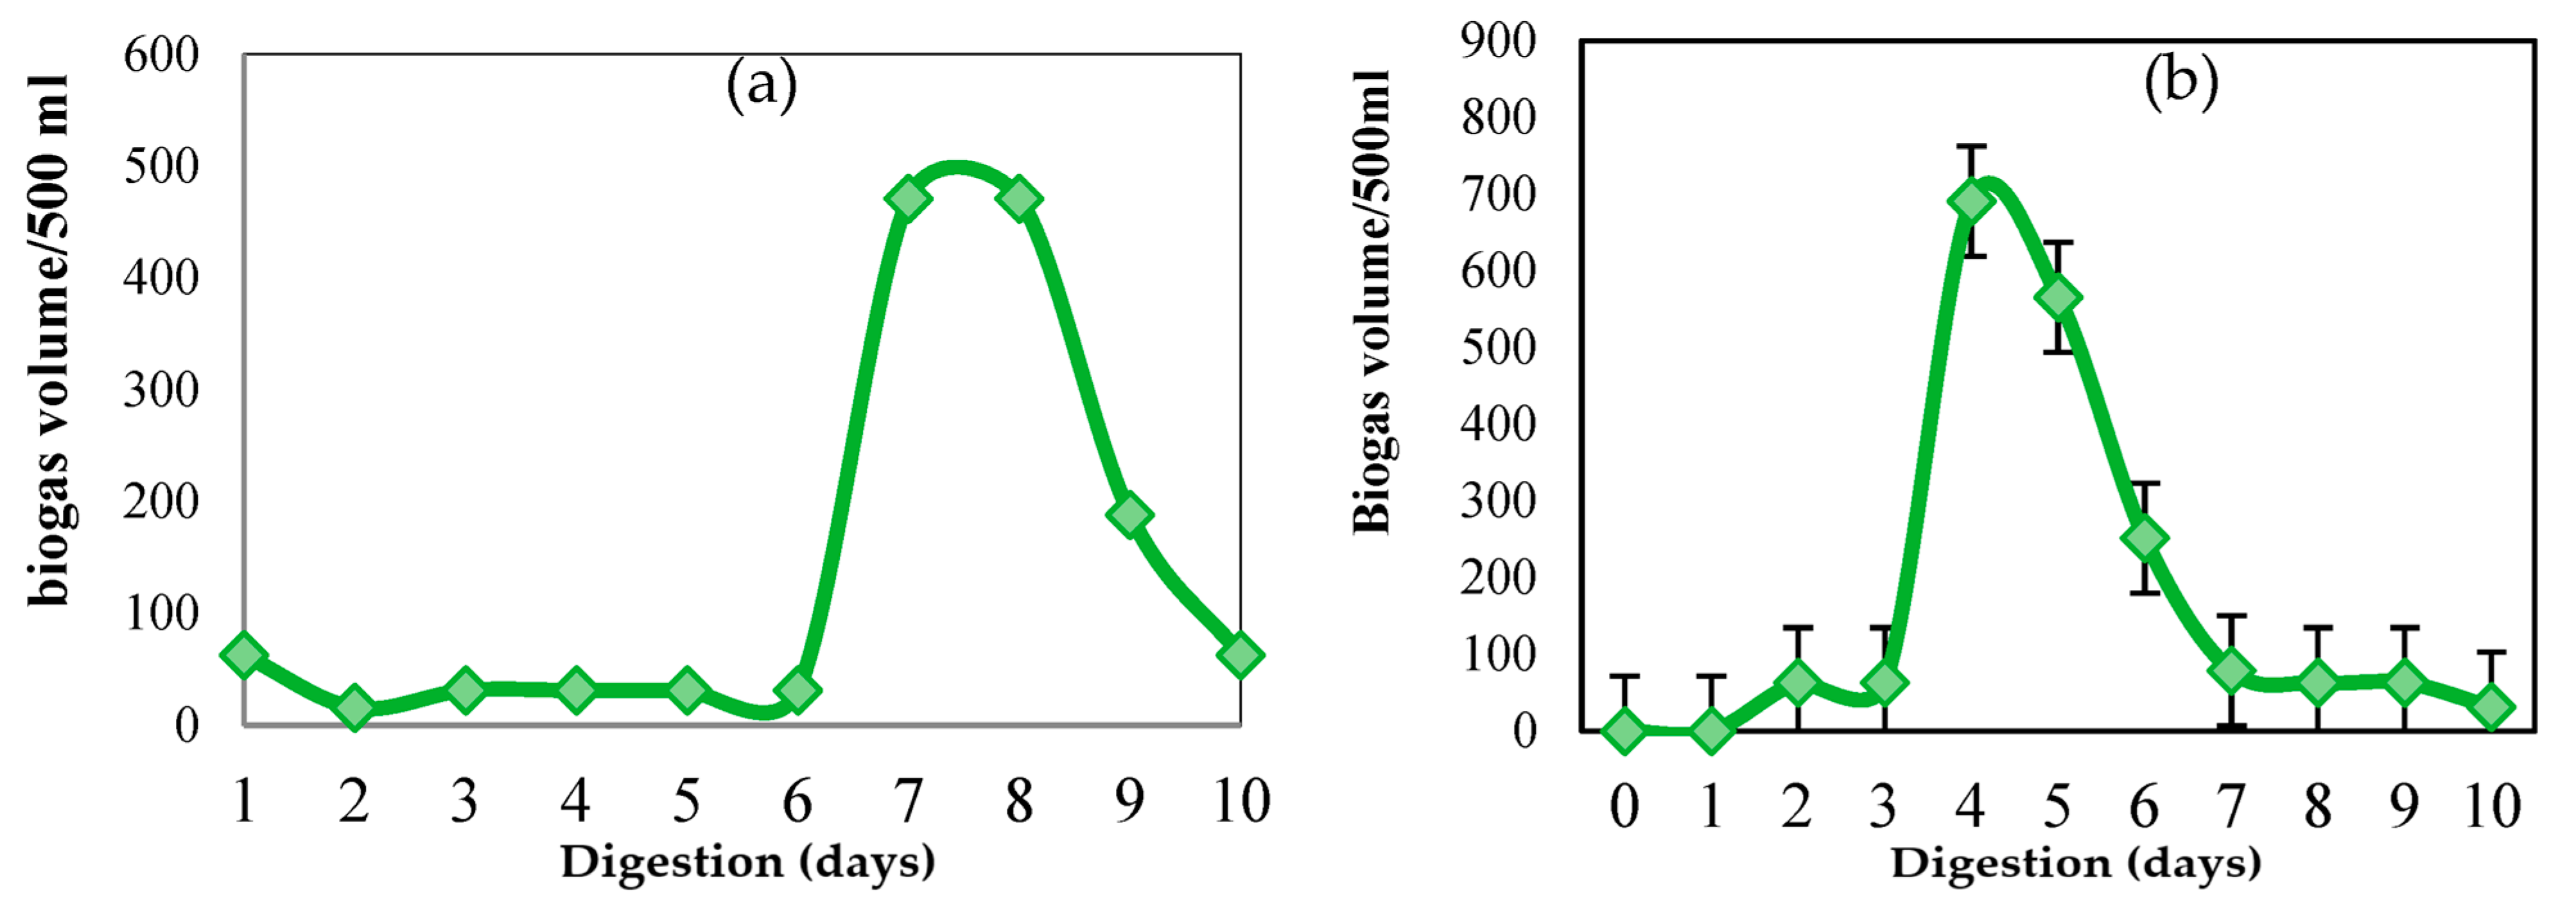
3.4. Optimum HRT for Anaerobic Digestion by OFAT

The objective of this experiment was to adopt a better hydraulic retention time (HRT) for the AD of the considered food waste collected from IIUM, and also to exploit these results when using high-capacity digesters (pilot scale) to recover the maximum of energy from this waste. For that, two digesters with different HRT were operated (HRT = 15 and HRT = 20). The biogas volume produced was checked every day for 10 days and the evolutions of daily biogas and cumulative biogas for each HRT are represented in Figure 15 and Figure 16. Thus, daily biogas produced from the digester with HRT = 15 and HRT = 20 is illustrated in Figure 15a,b while cumulative biogas is represented in Figure 16a,b. Based on the figure representing the daily biogas for HRT 15 (15a), the production was slow from the beginning until day 6, and it picked up from day 7 to day 8, and slowed down until day 10, which was the last day of the considered digestion time. The highest biogas volume was 471 mL on day 7 and 8. From the daily biogas of HRT = 20 (15b), it is obvious that the production of the biogas started on day 2 and the production was high between day 3 and day 7. It slows down after day 7 until day 10.
Therefore, based on Figure 16a showing cumulative biogas volume of the digester operated at HRT = 15 days, the production has increased slightly from day 1 to day 6. From day 6 to day 10, the cumulative biogas production increased sharply until it reached 1400 mL. From Figure 16b, cumulative biogas produced reached almost 2000 mL, which showed a similar value to cumulative biogas volume produced in the inoculum-to-feed ratio experiment, which was fixed at HRT = 25. Based on the comparison between the two, the HRT considered (15, 20) days. Biogas production was high for HRT = 20 days but the HRT = 15 days was also able to produce a significant amount of biogas. These results have confirmed good processing of the methanization process and the importance of biofilm on biogas volume.
As noticed by the researchers, in general, mesophilic digestion can reach high production of biogas within 15–30 HRT. Haryanto et al. (2018) [30] have operated anaerobic digestion with different hydraulic retention times (HRTs), namely 7, 14, 21, 28 and 35 days, with substrate concentration of 16 g/L of total solids (TS), and at the mesophilic temperature of 37 °C. They have noticed that the biogas volume of HRT 14 was quite similar to biogas volume of HRT 21, 28 and 35 days. Additionally, APHA (2012) [28] and Ounsaneha et al. (2021) [63] found that the optimum conditions for anaerobic digestion of FW were achieved in a reactor with an HRT of 12 days, which was similar to the optimum HRT found in this study. The methane content in biogas for biofilm hydrolyzed food waste was analyzed and it was 62–67% of methane. VFA was not analyzed. Within the pH range, we note VFA production but not quantitatively.
The experiment was conducted in the semi-continuous mode in which the total volume of the substrate (500 L) in the AD system was divided by the input volume as the flow rate of 25 mL/day as the HRT calculation of 20 days. A similar study as the semi-continuous mode was conducted by Shi et al. (2017) [65], which is discussed in the text, and [65] have observed the effect of hydraulic retention time on anaerobic digestion of wheat straw in the semi-continuous mode, and they have investigated the effect of hydraulic retention time (20, 40 and 60). The reactor with HRT = 20 days was run for 20 days, and so on (Section 3.3). Therefore, it depends on the stability by observing the process data whether the AD system is in a steady state, which is explained in our earlier responses. Additionally, Jin et al. (2021) [66] have considered the effect of different hydraulic retention times (4, 5, 7, 10, 15, 20, and 25 days) on anaerobic co-digestion of cattle manure and food waste. They have noticed that the maximum methane yields (236–257 mL/g-VS) were attained at HRT ≥ 15 days and methane yield was decreasing at the HRT of 5–10 days and complete process failure was observed at HRT 4 days, due to volatile fatty acids accumulated and microorganisms washed out.
Liu et al. (2018) [67] have evaluated the effect of HRT on biogas production from food waste and they have summarized that HRT had a great influence on anaerobic digestion performance. The differences in anaerobic digestion performance gradually exhibited that shorter HRT leads to lower microorganism activity and lower biogas yield. However, excess HRT might bring VFA and ammonic nitrogen accumulation and inhibition to anaerobic digestion. Therefore, proper organic loading with not only enough microorganisms activity, but also no VFA accumulation need to be chosen for optimum conditions. According to that research, HRT of 30 days with the highest biogas and methane production performance provide optimum conditions.

4. Conclusions

Based on the AD process of hydrolyzed food waste, two important parameters were assessed, which are the inoculum-to-feed ratio (10%, 30% and 50%) and HRT (15, 20 days) by OFAT. The 50% inoculum-to-feed ratio showed the highest biogas volume around 2 L with the highest TVS and TCOD reduction, 54.7% and 56%, respectively. The inoculum-to-feed ratio of 30% and 10% has produced biogas of 1523 mL and 753 mL respectively; and the control digester (without biofilm and 10% of inoculum) produced 502 mL of biogas. TVS reduction has increased to 30%, 43.4%, and 45% for the control, 10%, and 30% inoculum-to-feed ratio, respectively. TCOD removal has increased to 29%, 33% and 43% for the control, 10%, and 30%, respectively, for the inoculum-to-feed ratio. For the study of the different HRT considered (15 and 20 days), biogas volume produced was quite similar even though HRT with 20 days having produced higher biogas volume around 2000 mL. The investigated results mentioned above lead to the conclusion that biogas production increases with the inoculum-to-feed ratio. For HRT, a digester with 20 HRT has shown high production of biogas compared with a digester operated at HRT 15, which has produced 1400 mL of biogas but the difference was not very significant. Considering all key findings, it is emphasized that the biofilm has enhanced biogas production from FW.
Recommendation:
i.
Although this biofilm study on food waste anaerobic digestion for biogas production has been successfully developed, a pilot and full-scale study could be conducted based on this study.
ii.
Biofilm studies on the stability and monitoring parameters of the EPS matrix of biofilm should be studied.
iii.
Determining biogas composition and monitoring VFA are important to consider further for evaluating product efficiency.

Author Contributions

Conceptualization, A.M.A., M.Z.A. and F.M.A.-l.; methodology, A.M.A., M.Z.A., M.S.J., I.G.B. and I.A.B.; software, A.M.A., I.G.B. and I.A.B.; validation, M.Z.A., F.M.A.-l. and T.A.; formal analysis, A.M.A., M.Z.A. and M.S.J.; investigation, A.M.A.; resources, F.M.A.-l.; data curation, A.M.A., I.G.B. and I.A.B.; writing—original draft preparation, A.M.A. and M.Z.A.; writing—review and editing, M.S.J., F.M.A.-l. and T.A.; visualization, M.Z.A., F.M.A.-l. and T.A.; supervision, A.M.A., M.Z.A., M.S.J. and F.M.A.-l.; project administration, M.Z.A. and F.M.A.-l.; funding acquisition, F.M.A.-l. All authors have read and agreed to the published version of the manuscript.

Funding

This research received no external funding.

Institutional Review Board Statement

Not applicable.

Informed Consent Statement

Not applicable.

Data Availability Statement

All the data from this research are mentioned in this paper.

Acknowledgments

The authors would want to express their deepest gratitude for financial support to the Department of Chemical Engineering and Sustainability, International Islamic University of Malaysia for supporting this research project. Additionally, the authors gratefully acknowledge the financial support for evaluating this work from the Center of Study and Research of Djibouti (CERD).

Conflicts of Interest

The authors declare no conflict of interest.

References

  1. Bunditsakulchai, P.; Liu, C. Integrated strategies for household food waste reduction in Bangkok. Sustainability 2021, 13, 7651. [Google Scholar] [CrossRef]
  2. Shaba Mohammed, I.; Na, R.; Shimizu, N. Modeling Anaerobic Co-Digestion of Corn Stover Hydrochar and Food Waste for Sustainable Biogas Production. Fermentation 2022, 8, 110. [Google Scholar] [CrossRef]
  3. Khan, I. Waste to biogas through anaerobic digestion: Hydrogen production potential in the developing world-a case of Bangladesh. Int. J. Hydrog. Energy 2020, 45, 15951–15962. [Google Scholar] [CrossRef]
  4. Wang, P.; Wang, H.; Qiu, Y.; Ren, L.; Jiang, B. Microbial characteristics in anaerobic digestion process of food waste for methane production–A review. Biores. Tech. 2018, 248, 29–36. [Google Scholar] [CrossRef]
  5. Mehdaoui, I.; Majbar, Z.; Atemni, I.; Elhaji, M.; Abbou, M.B.; Jennan, S.; Rais, Z. Agronomic valorization of the composts with olive waste. Moroc. J. Chem. 2022, 10, 606–621. [Google Scholar]
  6. Ghosh, P.; Shah, G.; Sahota, S.; Singh, L.; Vijay, V.K. Biogas production from waste: Technical overview, progress, and challenges. Bioreactors 2020, 89–104. [Google Scholar] [CrossRef]
  7. Deepanraj, B.; Sivasubramanian, V.; Jayaraj, S. Effect of substrate pretreatment on biogas production through anaerobic digestion of food waste. Int. J. Hydrog. Energy 2017, 42, 26522–26528. [Google Scholar] [CrossRef]
  8. Zhang, C.; Su, H.; Baeyens, J.; Tan, T. Reviewing the anaerobic digestion of food waste for biogas production. Renew. Sustain. Energy Rev. 2014, 38, 383–392. [Google Scholar] [CrossRef]
  9. Thompson, T.M.; Young, B.R.; Baroutian, S. Enhancing biogas production from caribbean pelagic Sargassum utilising hydrothermal pretreatment and anaerobic co-digestion with food waste. Chemosphere 2021, 275, 130035. [Google Scholar] [CrossRef]
  10. Caruso, M.C.; Braghieri, A.; Capece, A.; Napolitano, F.; Romano, P.; Galgano, F.; Genovese, F. Recent updates on the use of agro-food waste for biogas production. Appl. Sci. 2019, 9, 1217. [Google Scholar] [CrossRef] [Green Version]
  11. Lee, B.; Park, J.G.; Shin, W.B.; Kim, B.S.; Byun, B.S.; Jun, H.B. Maximizing biogas production by pretreatment and by optimizing the mixture ratio of co-digestion with organic wastes. Environ. Eng. Res. 2019, 24, 662–669. [Google Scholar] [CrossRef] [Green Version]
  12. Bedoić, R.; Špehar, A.; Puljko, J.; Čuček, L.; Ćosić, B.; Pukšec, T.; Duić, N. Opportunities and challenges: Experimental and kinetic analysis of anaerobic co-digestion of food waste and rendering industry streams for biogas production. Renew. Sust. Energy Rev. 2020, 130, 109951. [Google Scholar] [CrossRef]
  13. Jain, S.; Jain, S.; Wolf, I.T.; Lee, J.; Tong, Y.W. A comprehensive review on operating parameters and different pretreatment methodologies for anaerobic digestion of municipal solid waste. Renew. Sust. Energy Rev. 2015, 52, 142–154. [Google Scholar] [CrossRef]
  14. Liu, C.; Li, H.; Zhang, Y.; Liu, C. Improve biogas production from low- organic-content sludge through high-solids anaerobic co-digestion with food waste. Biores. Tech. 2016, 219, 252–260. [Google Scholar] [CrossRef] [PubMed]
  15. Kazimierowicz, J.; Zieliński, M.; Dębowski, M. Influence of the heating method on the efficiency of biomethane production from expired food products. Fermentation 2021, 7, 12. [Google Scholar] [CrossRef]
  16. Parajuli, A.; Khadka, A.; Sapkota, L.; Ghimire, A. Effect of Hydraulic Retention Time and Organic-Loading Rate on Two-Staged, Semi-Continuous Mesophilic Anaerobic Digestion of Food Waste during Start-Up. Fermentation 2022, 8, 620. [Google Scholar] [CrossRef]
  17. Cayetano, R.D.A.; Kim, G.B.; Park, J.; Yang, Y.H.; Jeon, B.H.; Jang, M.; Kim, S.H. Biofilm formation as a method of improved treatment during anaerobic digestion of organic matter for biogas recovery. Biores. Tech. 2022, 344, 126309. [Google Scholar] [CrossRef]
  18. Fazil, N.A.; Alam, M.Z.; Azmi, A.S.; Mansor, M.F. Isolation and screening of bacteria with biofilm formation ability and characterization with hydrolytic enzyme production for enhanced biogas production. Malays. J. Microbiol. 2018, 14, 96–101. [Google Scholar]
  19. Alam, M.Z.; Hanid, N.A. Development of Indigenous biofilm for enhanced biogas production from palm oil mill effluent. J. Adv. Res. Fluid Mech. Therm. Sci. 2017, 39, 1–8. [Google Scholar]
  20. Bouh, I.G.; Alam, M.Z.; Kabbashi, N.A.; Mohamed, A. Enhancement of Biogas Production from Sewage Sludge by Biofilm Pretreatment Method. J. Adv. Res. Fluid Mech. Therm. Sci. 2019, 57, 141–147. [Google Scholar]
  21. Abbas, Y.; Jamil, F.; Rafiq, S.; Ghauri, M.; Khurram, M.S.; Aslam, M.; Mubeen, M. Valorization of solid waste biomass by inoculation for the enhanced yield of biogas. Clean Technol. Environ. Policy 2020, 22, 513–522. [Google Scholar] [CrossRef]
  22. Malinowsky, C.; Nadaleti, W.; Debiasi, L.R.; Moreira, A.J.G.; Bayard, R.; de Castilhos Junior, A.B. Start-up phase optimization of two-phase anaerobic digestion of food waste: Effects of organic loading rate and hydraulic retention time. J. Environ. Manag. 2021, 296, 113064. [Google Scholar] [CrossRef] [PubMed]
  23. Leung, D.Y.; Wang, J. An overview on biogas generation from anaerobic digestion of food waste. Int. J. Green Energy 2016, 13, 119–131. [Google Scholar] [CrossRef]
  24. Ambrose, H.W.; Philip, L.; Suraishkumar, G.K.; Karthikaichamy, A.; Sen, T.K. Anaerobic co-digestion of activated sludge and fruit and vegetable waste: Evaluation of mixing ratio and impact of hybrid (microwave and hydrogen peroxide) sludge pre-treatment on two-stage digester stability and biogas yield. J. Water Process Eng. 2020, 37, 101498. [Google Scholar] [CrossRef]
  25. Schermuly, J.; Walk, S.; Oyedele, V.; Arroyo Cuara, A.E.; Körner, I.; Deegener, S. Report on Results for Household Food Waste Collection and Decentralised Shredding in the “Lübeck-Case”: Decisive Deliverable D3. 6: A Decentralised Management Scheme for Innovative Valorisation of Urban Biowaste; Hamburg University of Technology: Hamburg, Germany, 2018. [Google Scholar]
  26. Morales-Polo, C.; Cledera-Castro, M.D.M.; Moratilla Soria, B.Y. Reviewing the anaerobic digestion of food waste: From waste generation and anaerobic process to its perspectives. Appl. Sci. 2018, 8, 1804. [Google Scholar] [CrossRef] [Green Version]
  27. Ahmadi, M.; Teymouri, P.; Ghalebi, M.; Jaafarzadeh, N.; Alavi, N.; Askari, A.; Foladivanda, M. Sludge characterization of an industrial water treatment plant, Iran. Des. Water Treat. 2014, 52, 5306–5316. [Google Scholar] [CrossRef]
  28. APHA/AWWA/WEF. Standard Methods for the Examination of Water and Wastewater. Std. Methods, 22nd ed.; American Public Health Association: Washington, DC, USA, 2012; p. 541. [Google Scholar]
  29. Bi, S.; Hong, X.; Yang, H.; Yu, X.; Fang, S.; Bai, Y.; Wang, Y. Effect of hydraulic retention time on anaerobic co-digestion of cattle manure and food waste. Renew. Energy. 2020, 150, 213–220. [Google Scholar] [CrossRef]
  30. Zhang, J.; Loh, K.C.; Li, W.; Lim, J.W.; Dai, Y.; Tong, Y.W. Three-stage anaerobic digester for food waste. Appl. Energy 2017, 194, 287–295. [Google Scholar] [CrossRef]
  31. Haryanto, A.; Triyono, S.; Wicaksono, N.H. Effect of Hydraulic Retention Time on Biogas Production from Cow Dung in A Semi Continuous Anaerobic Digester. Inter. J. Ren. Energy Dev. 2018, 7, 93–100. [Google Scholar] [CrossRef]
  32. Manser, N.D.; Mihelcic, J.R.; Ergas, S.J. Semi-continuous mesophilic anaerobic digester performance under variations in solids retention time and feeding frequency. Biores. Tech. 2015, 190, 359–366. [Google Scholar] [CrossRef] [Green Version]
  33. Li, L.; He, Q.; Ma, Y.; Wang, X.; Peng, X. A mesophilic anaerobic digester for treating food waste: Process stability and microbial community analysis using pyrosequencing. Microb. Cell Factories 2016, 15, 1–11. [Google Scholar] [CrossRef] [PubMed] [Green Version]
  34. Hossain, M.S.; Onik, M.H.; Kumar, D.; Rahman, M.A.; Yousuf, A.; Uddin, M.R. Impact of temperature, inoculum flow pattern, inoculum type, and their ratio on dry anaerobic digestion for biogas production. Sci. Rep. 2022, 12, 6162. [Google Scholar] [CrossRef]
  35. Khadka, A.; Parajuli, A.; Dangol, S.; Thapa, B.; Sapkota, L.; Carmona-Martínez, A.A.; Ghimire, A. Effect of the substrate to inoculum ratios on the kinetics of biogas production during the mesophilic anaerobic digestion of food waste. Energies 2022, 15, 834. [Google Scholar] [CrossRef]
  36. Baird, R.; Bridgewater, L. Standard Methods for the Examination of Water and Wastewater, 23rd ed.; American Public Health Association Water Works Association (APHA); American Water Works Association (AWWA); Environment Federation (WEF): Washington, DC, USA, 2017. [Google Scholar]
  37. Tasnim, A.; Al Mamun, M.R.; Hossen, M.A.; Rahman, M.T.; Soeb, M.J.A. Comparison Effect on Biogas Production from Vegetable and Fruit Waste with Rumen Digesta Through Co-Digestion Process. Eur. J. Energy Res. 2022, 2, 1–7. [Google Scholar] [CrossRef]
  38. Elsayed, M.; Diab, A.; Soliman, M. Methane production from anaerobic co-digestion of sludge with fruit and vegetable wastes: Effect of mixing ratio and inoculum type. Biomass Convers. Biorefinery 2021, 11, 989–998. [Google Scholar] [CrossRef]
  39. Alcántara-Hernández, R.J.; Taş, N.; Carlos-Pinedo, S.; Durán-Moreno, A.; Falcón, L.I. Microbial dynamics in anaerobic digestion reactors for treating organic urban residues during the start-up process. Lett. Appl. Microbiol. 2017, 64, 438–445. [Google Scholar] [CrossRef] [Green Version]
  40. Lim, J.W.; Wong, S.W.K.; Dai, Y.; Tong, Y.W. Effect of seed sludge source and start-up strategy on the performance and microbial communities of thermophilic anaerobic digestion of food waste. Energy 2020, 203, 117922. [Google Scholar] [CrossRef]
  41. Chen, C.; Guo, W.; Ngo, H.H.; Lee, D.J.; Tung, K.L.; Jin, P.; Wu, Y. Challenges in biogas production from anaerobic membrane bioreactors. Renew. Energy 2016, 98, 120–134. [Google Scholar] [CrossRef]
  42. Poh, P.E.; Gouwanda, D.; Mohan, Y.; Gopalai, A.A.; Tan, H.M. Optimization of wastewater anaerobic digestion using mechanistic and meta-heuristic methods: Current limitations and future opportunities. Water Conserv. Sci. Eng. 2016, 1, 1–20. [Google Scholar] [CrossRef] [Green Version]
  43. Onthong, U.; Juntarachat, N. Evaluation of biogas production potential from raw and processed agricultural wastes. Energy Procedia 2017, 138, 205–210. [Google Scholar] [CrossRef]
  44. Admasu, A.; Bogale, W.; Mekonnen, Y.S. Experimental and simulation analysis of biogas production from beverage wastewater sludge for electricity generation. Sci. Rep. 2022, 12, 9107. [Google Scholar] [CrossRef] [PubMed]
  45. Nwaigwe, K.N.; Enweremadu, C.C. Analysis of Chemical Oxygen Demand (COD) removal rate using Upflow Bioreactor with Central Substrate Dispenser (UBCSD). In Proceedings of the 4th Int’l Conference on Advances in Engineering Sciences & Applied Mathematics (ICAESAM’2015), Kuala Lumpur, Malaysia, 8–9 December 2015; pp. 61–64. [Google Scholar]
  46. Spellman, F.R. Handbook of Water and Wastewater Treatment Plant Operations; CRC Press: Boca Raton, FL, USA, 2008. [Google Scholar]
  47. Gaby, J.C.; Zamanzadeh, M.; Horn, S.J. The effect of temperature and retention time on methane production and microbial community composition in staged anaerobic digesters fed with food waste. Biotechnol. Biofuels 2017, 10, 302. [Google Scholar] [CrossRef] [PubMed] [Green Version]
  48. Yavini, T.D.; Chia, A.I.; John, A. Evaluation of the effect of total solids concentration on biogas yields of agricultural wastes. Int. Res. J. Environ. Sci. 2014, 3, 70–75. [Google Scholar]
  49. Orhorhoro, E.K.; Ebunilo, P.O.; Sadjere, G.E. Experimental determination of effect of total solid (TS) and volatile solid (VS) on biogas yield. Am. J. Mod. Energy 2017, 3, 131–135. [Google Scholar] [CrossRef] [Green Version]
  50. Mehdaoui, I.; Majbar, Z.; Atemni, I.; Jennan, S.; Ainane, T.; Gaga, Y.; Chetouani, A. What effects does an organic amendment to olive waste have on the soil and crop yield? Moroc. J. Chem. 2021, 9, 4–9. [Google Scholar]
  51. Lopes, W.S.; Leite, V.D.; Prasad, S. Influence of inoculum on performance of anaerobic reactors for treating municipal solid waste. Biores. Tech. 2004, 94, 261–266. [Google Scholar] [CrossRef]
  52. Neves, L.; Oliveira, R.; Alves, M.M. Influence of inoculum activity on the bio-methanization of a kitchen waste under different waste/inoculum ratios. Proc. Biochem. 2004, 39, 2019–2024. [Google Scholar] [CrossRef] [Green Version]
  53. Pavi, S.; Kramer, L.E.; Gomes, L.P.; Miranda, L.A.S. Biogas production from co-digestion of organic fraction of municipal solid waste and fruit and vegetable waste. Bioresour. Technol. 2017, 228, 362–367. [Google Scholar] [CrossRef]
  54. Yang, L.; Huang, Y.; Zhao, M.; Huang, Z.; Miao, H.; Xu, Z.; Ruan, W. Enhancing biogas generation performance from food wastes by high-solids thermophilic anaerobic digestion: Effect of pH adjustment. Int. Biodeterior. Biodegrad. 2015, 105, 153–159. [Google Scholar] [CrossRef]
  55. Atemni, I.; Mehdaoui, I.; Majbar, Z.; Ainane, T.; Haji, M.E.; Abbou, M.B.; Rais, Z. Monitoring composting process of olive by-products and assessment of compost maturity. Environ. Eng. Man. J. (EEMJ) 2022, 21, 44–51. [Google Scholar] [CrossRef]
  56. Pramanik, S.K.; Suja, F.B.; Zain, S.M.; Pramanik, B.K. The anaerobic digestion process of biogas production from food waste: Prospects and constraints. Biores. Tech. Rep. 2019, 8, 100310. [Google Scholar] [CrossRef]
  57. Ajayi-Banji, A.; Rahman, S. A review of process parameters influence in solid-state anaerobic digestion: Focus on performance stability thresholds. Renew. Sustain. Energy Rev. 2022, 167, 112756. [Google Scholar] [CrossRef]
  58. Li, Y.; Jin, Y.; Borrion, A.; Li, H.; Li, J. Effects of organic composition on mesophilic anaerobic digestion of food waste. Biores. Tech. 2017, 244, 213–224. [Google Scholar] [CrossRef] [PubMed]
  59. Awasthi, S.K.; Joshi, R.; Dhar, H.; Verma, S.; Awasthi, M.K.; Varjani, S.; Kumar, S. Improving methane yield and quality via co-digestion of cow dung mixed with food waste. Biores. Tech. 2018, 251, 259–263. [Google Scholar] [CrossRef]
  60. Khammour, F.; Abdoul-Latif, F.M.; Ainane, A.; Mohamed, J.; Ainane, T. Eco-friendly adsorbent from waste of mint: Application for the removal of hexavalent chromium. J. Chem. 2021, 2021, 8848964. [Google Scholar] [CrossRef]
  61. Uma, S.; Thalla, A.K.; Jayanthi, S. Performance Evaluation on anaerobic digestion of banana waste along with domestic wastewater. In Proceedings of the National Conference on Technological Innovations for Sustainable Infrastructure, Calicut, India, 13–14 March 2015; Volume 13, p. 14. [Google Scholar]
  62. Kumar, G.; Sivagurunathan, P.; Park, J.H.; Kim, S.H. Anaerobic digestion of food waste to methane at various organic loading rates (OLRs) and hydraulic retention times (HRTs): Thermophilic vs. mesophilic regimes. Environ. Eng. Res. 2015, 21, 69–73. [Google Scholar] [CrossRef] [Green Version]
  63. Ounsaneha, W.; Rattanapan, C.; Suksaroj, T.T.; Kantachote, D.; Klawech, W.; Rakkamon, T. Biogas production by co-digestion of municipal wastewater and food waste: Performance in semi-continuous and continuous operation. Water Environ. Res. 2021, 93, 306–315. [Google Scholar] [CrossRef]
  64. Nayono, S.E.; Gallertb, C.; Winter, J. Co-digestion of press water and food waste in a biowaste digester for improvement of biogas production. Biores. Tech. 2010, 101, 6987–6993. [Google Scholar] [CrossRef]
  65. Shi, X.S.; Dong, J.J.; Yu, J.H.; Yin, H.; Hu, S.M.; Huang, S.X.; Yuan, X.Z. Effect of hydraulic retention time on anaerobic digestion of wheat straw in the semi-continuous continuous stirred-tank reactors. Biomed. Res. Int. 2017, 2017, 2457805. [Google Scholar] [CrossRef] [Green Version]
  66. Jin, C.; Sun, S.; Yang, D.; Sheng, W.; Ma, Y.; He, W.; Li, G. Anaerobic digestion: An alternative resource treatment option for food waste in China. Sci. Total Environ. 2021, 779, 146397. [Google Scholar] [CrossRef]
  67. Liu, X.; Khalid, H.; Amin, F.R.; Ma, X.; Li, X.; Chen, C.; Liu, G. Effects of hydraulic retention time on anaerobic digestion performance of food waste to produce methane as a biofuel. Environ. Technol. Innov. 2018, 11, 348–357. [Google Scholar] [CrossRef]
Figure 1. Schematic diagrams of gas measurement direct from a reactor using a cylinder meter digester.
Processes 11 00655 g001
Figure 2. SEM images of an immobilizing biofilm on GAC, (A) biofilm for 24 h and (B) without biofilm at 24 h; (C) biofilm for 48 h and (D) without biofilm at 48 h; (E) biofilm for 72 h and (F) without biofilm at 72 h with T = 37 °C.
Processes 11 00655 g002
Figure 3. 3D and 2D counter plot graph for optimization of biofilm immobilization.
Processes 11 00655 g003
Figure 4. Changes in (a) TS and (b) VS of food waste hydrolysis with different amounts of biofilm and time of digestion at T = 35 ± 2 °C.
Processes 11 00655 g004
Figure 5. Changes in total dissolved solid (TDS) of food waste hydrolysis by OFAT.
Processes 11 00655 g005
Figure 6. Changes in total soluble chemical demand (sTCOD) of food waste hydrolysis by OFAT.
Processes 11 00655 g006
Figure 7. Biogas volume produced daily in each digester at HRT= 25 days, T = 37 °C. Digester volume of 500 mL and digestion time of 14 days.
Processes 11 00655 g007
Figure 8. Cumulative biogas produced in each digester at HRT = 25 days, T = 37 °C. Digester volume of 500 mL and digestion time of 14 days.
Processes 11 00655 g008
Figure 9. The cumulative biogas production as mL of cumulated biogas volume/g of VS loaded.
Processes 11 00655 g009
Figure 10. Total TCOD removable found from each digester after 14 days of digestion with HRT = 20, T = 37 °C.
Processes 11 00655 g010
Figure 11. Daily pH value in each digester (10%, 30%, 50% and control with 10% of inoculum and no biofilm) at T = 37 °C.
Processes 11 00655 g011
Figure 12. TVS content in the digesters with different inoculum-to-feed ratios with digestion time of 14 days.
Processes 11 00655 g012
Figure 13. Percentage of TVS reduction (%) in the digesters with different inoculum-to-feed ratios with digestion time of 14 days.
Processes 11 00655 g013
Figure 14. Total COD concentration in the digesters on the initial and last day (a) and percentage of TCOD removal of the considered digester (b).
Processes 11 00655 g014
Figure 15. Daily biogas production for digester with HRT = 15 (a) and HRT = 20 (b) at T= 37 °C, pH = 7 with digestion of 10 days and digester volume of 500 mL.
Processes 11 00655 g015
Figure 16. Cumulative biogas produced for digester at HRT= 15 (a) and HRT = 20 (b) at. T = 37 °C, pH = 7 with digestion time of 10 days and digester volume of 500 mL.
Processes 11 00655 g016
Table 1. Characterization of inoculum.
ParametersValues
TS (g/L)100.10 ± 1.35
VS (g/L)87.45 ± 1.21
TCOD (mg/L)53,800 ± 100
SCOD (mg/L)49,600 ± 100
pH5.0 ± 0.4
Table 2. Characterization of food waste.
Food WasteTS (%)VS (%)VS/TS RatioMC (%)SCOD (mg/L)pH
Collected food waste36.79.70.4972.5--
Prepared sludge109.90.9690.268904
Disclaimer/Publisher’s Note: The statements, opinions and data contained in all publications are solely those of the individual author(s) and contributor(s) and not of MDPI and/or the editor(s). MDPI and/or the editor(s) disclaim responsibility for any injury to people or property resulting from any ideas, methods, instructions or products referred to in the content.

