Article

Exergoeconomic Analysis of an Integrated Solar Combined Cycle in the Al-Qayara Power Plant in Iraq

by
Wadah Talal
and
Abdulrazzak Akroot
*,†
Department of Mechanical Engineering, Faculty of Engineering, Karabuk University, 78050 Karabuk, Turkey
*
Author to whom correspondence should be addressed.
These authors contributed equally to this work.
Processes 2023, 11(3), 656; https://doi.org/10.3390/pr11030656
Submission received: 9 January 2023 / Revised: 12 February 2023 / Accepted: 16 February 2023 / Published: 21 February 2023
(This article belongs to the Special Issue Application of Heat Recovery Systems in Energy)

Abstract

:
Enhancing the sustainability and diversification of Iraq’s electricity system is a strategic objective. Achieving this goal depends critically on increasing the use of renewable energy sources (RESs). The significance of developing solar-powered technologies becomes essential at this point. Iraq, similar to other places with high average direct normal irradiation, is a good location for concentrated solar thermal power (CSP) technology. This study aims to recover the waste heat from the gas turbine cycle (GTC) in the Al-Qayara power plant in Iraq and integrate it with a solar power tower. A thermoeconomic analysis has been done to support the installation of an integrated solar combined cycle (ISCC), which uses concentrated solar tower technology. The results indicate that the examined power plant has a total capacity of 561.5 MW, of which 130.4 MW is due to the waste heat recovery of G.T.s, and 68 MW. is from CSP. Due to the waste heat recovery of GTC, the thermal and exergy efficiencies increase by 10.99 and 10.61%, respectively, and the overall unit cost of production is 11.43 USD/MWh. For ISCC, the thermal and exergy efficiencies increase by 17.96 and 17.34%, respectively, and the overall unit cost of production is 12.39 USD/MWh. The integrated solar combined cycle’s lowest monthly capacity was about 539 MW in September, while its highest monthly capacity was approximately 574.6 MW in April.

1. Introduction

Increased energy consumption and a growing global population are the primary factors of increasing energy demand and pricing in emerging nations. Energy is essential for a flourishing economy and thriving society. Increases in economic activity and general quality of life may be attributed to the doubling of global energy use in the recent year [1,2]. As the world’s energy needs continue to rise at an alarming rate, it is crucial that we find ways to save energy and diversify our electrical energy sources to ensure long-term growth [3]. Between 2016 and 2030, it is expected that worldwide demand for primary energy will rise by almost 50% [4]. Fossil fuels are the world’s principal source of primary energy. About 80% of the world’s energy comes from these sources [5,6]. Natural gas combined cycles (NGCCs) are more efficient and provide a lower cost burden due to the incorporation of post-combustion carbon capture compared to direct-fired power systems [3]. Furthermore, concentrated solar power (CSP) utilizes the sun’s thermal energy to generate electricity with little or no greenhouse gas emissions. These concentrated solar power facilities may work in tandem with more traditional power plants to provide backup power from combustible fuels [7,8,9]. Integrating a gas turbine cycle with a solar thermal power plant is one solution to increase the energy produced and reduce carbon emissions [10,11]. There have been many studies on ISCCs, both theoretical and practical, intending to improve performance [12,13,14,15].
Li et al. [16] studied two-stage ISCCs with direct steam generation technology, and the net solar-to-electricity efficiency increased by 1.2% compared to the one-stage ISCCS. Jenkins & Ramamoorthy [17] integrated a combined solar thermal power with a natural gas combined cycle to reduce the total cost of the power plant. The results showed that the use of fossil fuels is reduced while an ISCC power station is in operation, resulting in lower emissions of greenhouse gases. Zhang et al. [18] proposed a general performance assessment approach for the ISCC system and examined the system’s fuel-saving and efficiency promotion factors. Hosseini et al. [19] suggested the optimal design plan for Iran’s first solar power plant. The plant has a 67 M.W. e capacity. They investigated the impact of the essential characteristics on the technical and economic evaluation of solar power plants, including the capacity factor, thermal efficiency, investment cost, and environmental issues. Ameri and Mohammadzadeh [20] proposed a novel integrated solar combined cycle system (ISCCS) to identify the components responsible for exergy destruction and to evaluate the investment cost and stream of each system part. Adibhatla and Kaushik [21] performed a 3E analysis on an ISCC. Parabolic trough collectors and direct steam production were used for solar integration at medium temperatures. When the solar field was functioning at its optimal design, the data indicated that the plant’s output increased by 7.84%. Horn et al. [22] presented an ISCCS that was technically and economically examined for deployment in Egypt with funding from the global environment facility. The authors concluded that the project offers Egypt a viable and ecologically friendly alternative for generating renewable electricity. Table 1 provides examples of studies proposing and analyzing ISCC power stations in a range of potential countries. The capacity share column indicates the proportion of CSP relative to the overall capacity. Behar et al. [23] offered more comprehension about integrated solar combined cycle systems (ISCCS) with a parabolic trough technology.
Taking into account both the technical and economic elements of this research is crucial for the future of renewable energy in Iraq, especially in light of the enormous potential of CSP technologies in the country and the fact that the technology is still in its infancy. Iraq has excellent potential for implementing solar energy due to its high annual sunshine and a large quantity of solar Direct Normal Irradiance (DNI). Consequently, in the current study, Mosul city was chosen because the exhaust gases from the Al-Qayara gas power plant have been used in heat recovery steam generation, and the site of the station is located in a suitable part of Iraq, which benefits from the significant solar energy. The ISCC was simulated using the EES program and confirmed for all months, and the system’s outputs were compared to those of the existing power plant.

2. Models Description

The configuration of the NGCC system is shown in a simplified form in Figure 1 as it is integrated into a gas turbine cycle. The Al-Qayara gas power plant contains six 125 MW gas turbines, but in this study, only three units are used in the simulation. The gas turbine’s exhaust gases were piped into a heat recovery steam generator (HRSG) unit, where they generated high-pressure (100 bar) and low-pressure (20 bar) steam lines. A steam turbine was used to create extra work from steam. Figure 2 shows the natural gas combined cycle power plant connected to the concentrating solar power (CSP). The solar field collects heat in this configuration, and the power block uses an HRSG to convert that heat into steam. The HRSG unit is also used to create low- and high-pressure steam lines with varying heat loads (31 and 121 bar, respectively). The input parameters for thermodynamic analysis are listed in Table 2 and Table 3, showing the atmospheric conditions at the inlet of the air compressor.

2.1. Thermodynamics Analysis

The first law of thermodynamics was applied to each piece of equipment [33,34]:
Q ˙ i n + W ˙ i n + i n m ˙ h i n = Q ˙ o u t + W ˙ o u t + o u t m ˙ h o u t
Air compressor:
W ˙ G . T . = m ˙ air h 2 h 1
Combustion chamber:
m ˙ air h 2 + m ˙ fuel LHV CH 4 = m ˙ fuel + m ˙ air h 4
Gas turbine:
W ˙ G . T . = m ˙ 4 h 4 h 5
HRSG:
Q ˙ HRSG = m ˙ 4 h 5 h 6 + m ˙ 16 h 16 h 17 = m ˙ 8 h 9 h 8 + m ˙ 10 h 11 h 10
HPST:
W ˙ HPST = m ˙ 9 h 9 h 10
LPST:
W ˙ LPST = m ˙ 11 h 11 h 13 + m ˙ 12 h 13 h 12
condenser:
Q ˙ Con = m ˙ 14 h 12 h 14
Pump 1:
W ˙ P 1 = m ˙ 7 h 8 h 7
Pump 2:
W ˙ P 2 = m ˙ 14 h 15 h 14
OFWH:
Q ˙ OFWH = m ˙ 14 h 14 h 15 = m ˙ 13 h 15 h 13
The exergy destruction of each part was calculated using the exergy balance equation as follows [35]:
E ˙ Q E ˙ W = E ˙ out E ˙ in E ˙ D
The following relationship was used to obtain the stream exergy rate:
E ˙ Q = 1 T 0 T i Q ˙ i
which is rewritten as follows for the solar cycle:
E ˙ Q , s o l a r = 1 T 0 T s u n Q ˙ s o l a r
E ˙ W = W ˙
The exergy destruction for each part was calculated as follows:
Air compressor:
E ˙ D , A . C . = W ˙ A . C . + E ˙ 1 E ˙ 2
Combustion chamber:
E ˙ D , CC = E ˙ 2 + E ˙ 3 E ˙ 4
Gas turbine:
E ˙ D , G . T . = E ˙ 4 E ˙ 5 W ˙ G . T .
HRSG:
E ˙ D , HRSG = E ˙ 8 E ˙ 9 + E ˙ 10 + E ˙ 11 + E ˙ 20 + E ˙ 21
HPST:
E ˙ D , HPST = E ˙ 9 E ˙ 10 W ˙ HPST
LPST:
E ˙ D , L PST = E ˙ 11 E ˙ 12 E ˙ 13 W ˙ LPST
Condenser:
E ˙ D , Con = E ˙ 12 E ˙ 14 Q ˙ Con T b
Pump1:
E ˙ D , P 1 = W ˙ P 1 + E ˙ 7 E ˙ 8
Pump2:
E ˙ D , P 2 = W ˙ P 2 + E ˙ 14 E ˙ 15
OFWH:
E ˙ D , OFWH = E ˙ 13 + E ˙ 14 E ˙ 15
The combined cycle power and overall performance were calculated using the following equations [32,36]:
η B C = W G T W A . C . Q in ,   BC  
η I S C C = W G T W A C + W H P S T + W L P S T W pumps Q i n
Ψ I S C C W G T W A C + W H P S T + W L P S T W pumps E i n
Solar PTC field
The thermal energy input to the collectors’ absorber tubes was derived as follows [32]:
Q ˙ s o l a r = η PTC A a p D N I
where η PTC is the efficiency of the parabolic trough collector, A a p is the area of the solar field, and D N I is the direct normal irradiance at Mosul (35.35° N 43.16° E) for the month of interest. The parabolic trough collector transmits a portion of the sun’s rays to the central receiver as solar isolation, which is calculated as follows [32]:
Q ˙ s o l a r = m T h _ V P C p T h _ V P T T h _ V P , o u t T T h _ V P , i n

2.2. Economic Analysis

Exergoeconomic analysis requires the cost balance for each system component. The fundamental thermoeconomic equation for the cost balancing of each system component is as follows [37]:
e C ˙ e , k + C ˙ w , k = i C ˙ i , k + Z ˙ k
The primary constant parameters used in the purchased equipment cost calculation are shown in Table 4. For exergoeconomic evaluation of the system, appropriate parameters were obtained from reference [38]. The investment cost rate and cost recovery factor were determined as follows [39]:
CRF = i ( 1 + i ) n ( 1 + i ) n 1
Z ˙ k = Z k C R F φ / N × 3600
The overall cost of the investment was calculated as follows [43]:
C ˙ system = k = 1 N   Z k + k = 1 N C ˙ D , k
Then, the total electricity cost per unit of energy, USD/MJ, was determined as follows [38]:
C ˙ electricity , tot = k = 1 N   C ˙ system / W ˙ net

3. Results

Table 5 compares the output of the Brayton cycle model used in this investigation with the design parameters of the gas turbine units in the Al-Qayara gas power plant. The comparison demonstrated their compatibility. Furthermore, the regenerative R.C. model was compared to the equivalent described cycle in [32]. Validation was performed in terms of power and efficiency. Table 6 shows the operating conditions used in the validation model and the numerical results. The obtained findings illustrate the efficacy of the provided model compared to the published results.
The performance of the ISCC cycle was evaluated by using the first and second laws of thermodynamics for each part and determining the main properties for each state, as shown in Table 7. These properties aid in the analysis of energy, exergy, and economics for the ISCC cycle.
Table 8 presents the differences in the performance of the ISCC and NGCC systems. The table reveals that the net value of the NGCC was 493.5 MW, the ηenergy was 44.84%, and the Ψexergy was 43.35%. When the solar collector was added to the system, 561.5 MW of power was generated by ISCC. Therefore, the first law of efficiency of the ISCC increased to 51%, and the second law efficiency increased to 49.26%. Table 5 also illustrates that the cost of the power produced by NGCC was 5508 USD/h, whereas the cost of the energy produced by ISCC was 6876 USD/h. The results showed that each M.W. produced from the NGCC cost 11.16 USD, whereas each M.W. produced from the ISCC cost 12.23 USD. Thus, the findings show how integrating the NGCC and ISCC cycles is highly acceptable from an economic and thermodynamic standpoint.
The main exergy analysis results for different components of the ISCC are shown in Table 9. As shown in this table, detailed data of fuel, product, and destruction exergies can be found for each component. This table also presents the details of E ˙ d and Ψ percentages. Among the proposed ISCC’s components, combustion chambers with a 55.1% destruction ratio had the highest exergy destruction ratio (around 395.2 MW) followed by the condenser with a 9.91% and the solar collector with a 9.29% exergy destruction ratio. Table 6 also shows that the turbines with the highest rate of exergy efficiency in the ISCC cycle, or instance, G.T., HPST, and LPST, had 95.26%, 91.51%, and 87.74% efficiencies, respectively. Eventually, the proposed ISCC cycle achieved an exergy efficiency of 49.26%.
Figure 3 depicts the impact of the pressure ratio (Pr) on the overall performance and cost of both systems. As shown in Figure 3a the Pr had a negative effect on the Ẇnet of each system. At a high-pressure ratio, the power consumed by the compressors increased, causing a reduction in the power output from each cycle. The findings indicate that the ISCC’s Ẇnet dropped from 610.5 MW to 511.5 MW when Pr increased from 6 to 18 bar. The Ẇnet decreased from 537.6 MW to 445.7 MW for the NGCC. The findings also show that the ISCC’s performance was higher than that of the NGCC’s because of the solar collector’s heat input to the HRSG.
The influence of Pr on the efficiencies of the various systems is evident from Figure 3b,c. The graph clearly demonstrates that the efficiency of all systems improved as Pr increased, reached a maximum, and then decreased as Pr continued to increase. According to the findings, when Pr increased from 6 to 18 bar, the ηenergy ranged between 47.07% and 51.75% for the ISCC system, and it ranged between 41.45% and 45.1% for the NGCC system.
Figure 3d also shows that as the Pr increased from 6 bar to 18 bar, the overall unit cost of production ( C ˙ electricity) increased from 10.91 USD/MWh to 14.48 USD/MWh for the ISCC cycle while it increased from 9.9 USD/MWh to 13.55 USD/MWh for NGCC cycle. The increase in the C ˙ electricity for the ISCC cycle is attributable to the solar collectors’ cost.
Figure 4 shows the effect of gas turbine intake temperature (GTIT) on the performance and cost of the ISCC and NGCC systems. The GTIT affected the performance and cost of both cycles, as seen by these findings. GTIT increased the thermal energy at the inlet of G.T.s and increased the temperature of the exhaust gases, which improved the performance of B.C. and R.C. cycles. The results indicate that when GTIT increased from 1250 to 1550 K, Ẇnet for the ISCC cycle increased from 452. to 761.5 MW, while Ẇnet for the NGCC cycle increased from 387.4 to 688.8 MW.
Figure 4b,c demonstrates that when GTIT increased, so did the total net efficiency of both systems. It is also clear that the ISCC systems’ efficiencies were substantially greater than those of the NGCC systems due to the incorporation of the solar collector. As shown in these figures, the ISCC cycle’s thermal efficiency improved from 49.71 to 52.62% as GTIT increased from 1250 to 1550 K, and its Ψexergy increased from 48.0 to 50.81% under the same conditions. Further, the ηenergy increased from 42.57 to 47.59%, and the Ψexergy increased from 41.1 to 45.96% for the NGCC cycle.
The overall unit cost of production ( C ˙ electricity) across all cycles decreased as GTIT increased, reached a minimum, and then increased again as GTIT continued to increase, as seen in Figure 4d. At high GTIT, the costs of the CC and G.T. increased dramatically and caused an increase in the C ˙ electricity of all cycles. The figure also demonstrated that 1483 K was the optimal GTIT temperature. The C ˙ electricity of the ISCC cycle was 11.1 USD/MWh at 1483 K compared to 10.2 USD/MWh for the NGCC cycle.
Figure 5 shows how the two systems’ performance, cost, and efficiencies vary as a function of the pressure at the inlet of the high-pressure steam turbine (PHPST, in). Figure 5a demonstrates that the Ẇnet of the ISCC and NGCC systems increased when PHPST, in increased due to the increasing steam enthalpy at the HPST’s inlet. The rise in enthalpy at the HPST inlet increased the work produced by the HPST and LPST. Accordingly, the Ẇnet of the ISCC system increased from 558.24 MW to 564.2 MW when PHPST, in increased from 80 to 125 bar. The Ẇnet of the NGCC system increased from 491.4 MW to 495.3 MW, as the findings also showed.
Figure 5b,c shows the effect of the PHPST, in on the efficiencies of the ISCC and NGCC systems. The data demonstrate that the efficiencies of both systems increased slightly with an increase in PHPST, in since the Ẇnet made minimal progress at the high PHPST, in. The figure shows that during the ISCC cycle, increasing PHPST, in increased ηenergy from 50.71 to 51.25 percent and Ψexergy from 48.96 to 49.5 percent. The ηenergy increased from 44.64 to 45% and Ψexergy from 43.1 to 43.45% when PHPST, in increased in the NGCC cycle.
The curves in Figure 5d illustrate that the overall unit cost of production ( C ˙ electricity) for each cycle changed very little with the rise in the PHPST, in. This is due to the proportional increase in the Ẇnet and C ˙ k of each component. According to the graph, the cost of power for the ISCC system is around 12.2 USD/MWh compared to 11.15 USD/MWh for the NGCC system.
The performance, cost, and efficiencies of the ISCC and NGCC systems are shown in Figure 6, over a range of 25 °C to 70 °C in the condenser temperature (T cond). As can be seen, both systems were negatively impacted by an increase in T cond, which in turn decreased the power produced by the LPST. It is important to note that the decrease in the Ẇnet for both cycles was responsible for the increase in the C ˙ electricity at high T cond. According to the findings, when the T cond increased from 25 °C to 70 °C, the Ẇnet dropped from 570.1 MW to 532.2 MW for the ISCC system and from 500.1 MW to 471.3 MW for the NGCC system.
Figure 6b,c illustrates the effect of T cond on the efficiencies of the NGCC and ISCC systems. The graphs demonstrate a drop in ηenergy and Ψexergy due to the lowering of Ẇnet at a high T cond. The findings show that if T cond rises from 25 °C to 70 °C, ηenergy decreases from 51.79 to 48.34%, and Ψexergy decreases from 50.0 to 46.7% for the ISCC cycle. For the NGCC cycle, the ηenergy decreases from 45.43 to 42.81%, while the ηexergy decreases from 43.87 to 41.34.
Figure 6d illustrates that the overall unit cost of production ( C ˙ electricity) increased from 12.03 USD/MWh to 12.92 USD /MWh when the temperature ranged from 25 °C to 70 °C for the ISCC system, whereas it increased from 11.0 USD/MWh to 11.71 USD/MWh for the NGCC system.
Figure 7 displays the percentage of monthly power produced in each cycle. It is clear from the results that the B.C. power output improved in the winter due to the decrease in the ambient temperature, which helped to improve the compressor work conditions. The maximum power production in NGCC was 519.5 MW in January, while the lowest output was 462.7 MW in September. In addition, the finding also showed that the ISCC system produced the maximum power in April (574.7 MW) because the compressor work conditions were suitable and the DNI was very high (around 5.52 kWh/m2day kWh/m2.day), whereas the minimum power was produced in September (around 539 MW).
Figure 8 depicts the monthly fluctuations in the overall unit cost of production under optimal operating conditions for B.C., NGCC, and ISCC. It is clear from the figure that the variations in the climate conditions had little effect on the thermo-economic performance of both systems. The findings show that the overall unit cost of production for the ISCC system changed between 12.2 USD/MWh and 12.66 USD/MWh, whereas it varied between 9.98 USD/MWh and 11.41 USD/MWh for the NGCC system.

4. Conclusions

The abundance of locations in Iraq that receive abundant direct normal irradiance (DNI) throughout the year gives concentrated solar power plants (CSPs) great potential for energy production in the country. Many nations, like Iraq, want to diversify their national power grids and aid in sustainability initiatives by incorporating CSP technology into their energy generation infrastructure. CSP’s main benefit is its ability to be combined with more traditional forms of energy production. This research thus performed a techno-economic evaluation of the proposed integrated solar combined cycle (ISCC). The overall efficiency of natural gas combined cycle (NGCC) generating plants may be improved by integrating solar thermal fields. This research recommends the development of an ISCC power plant in Mosul, Iraq, under the framework of integrating a natural gas power plant with solar collectors to verify the production of additional electricity and reduce emissions from the G.T. power plant. This study sought to fill the void by analyzing the technical and economic performance of ISCC technology. Weather information was used to accurately simulate and estimate the performance of the planned power plant. The main findings of the study are as follows:
  • Integrating the NGCC and ISCC cycles is both economically and thermodynamically feasible.
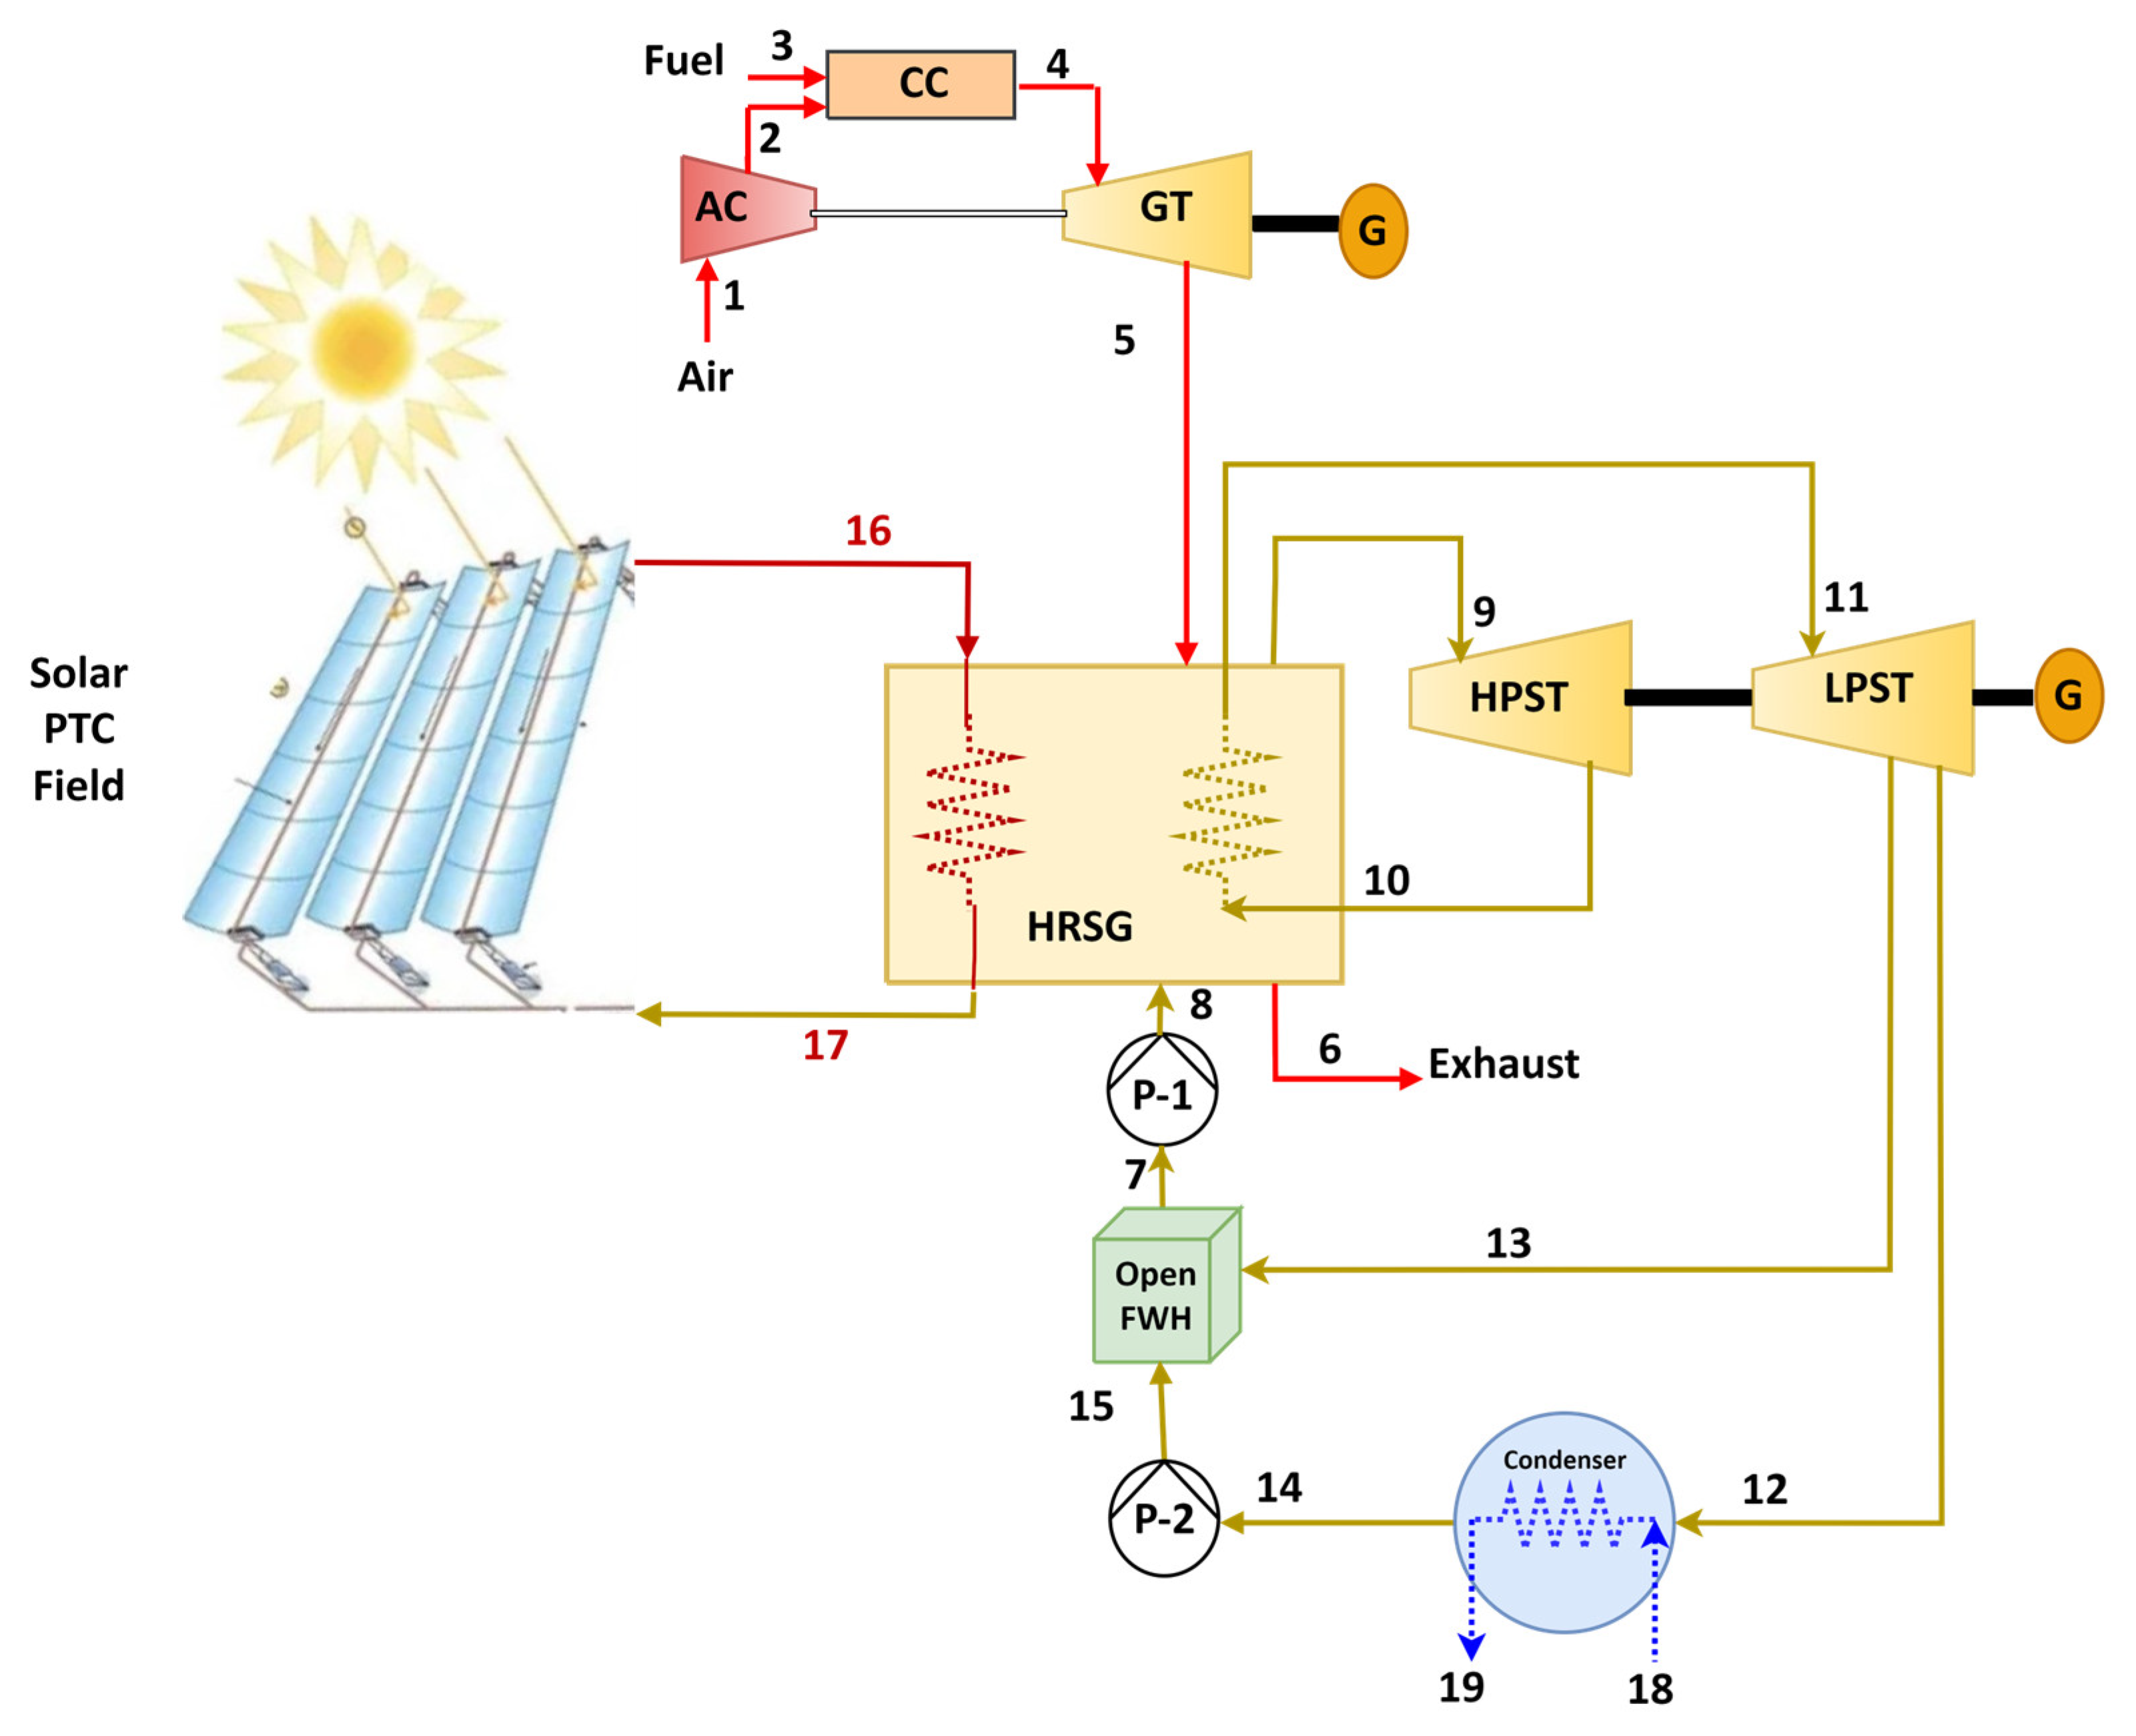
  • Adding the solar collector to the NGCC system improves the system’s power and total efficiency.
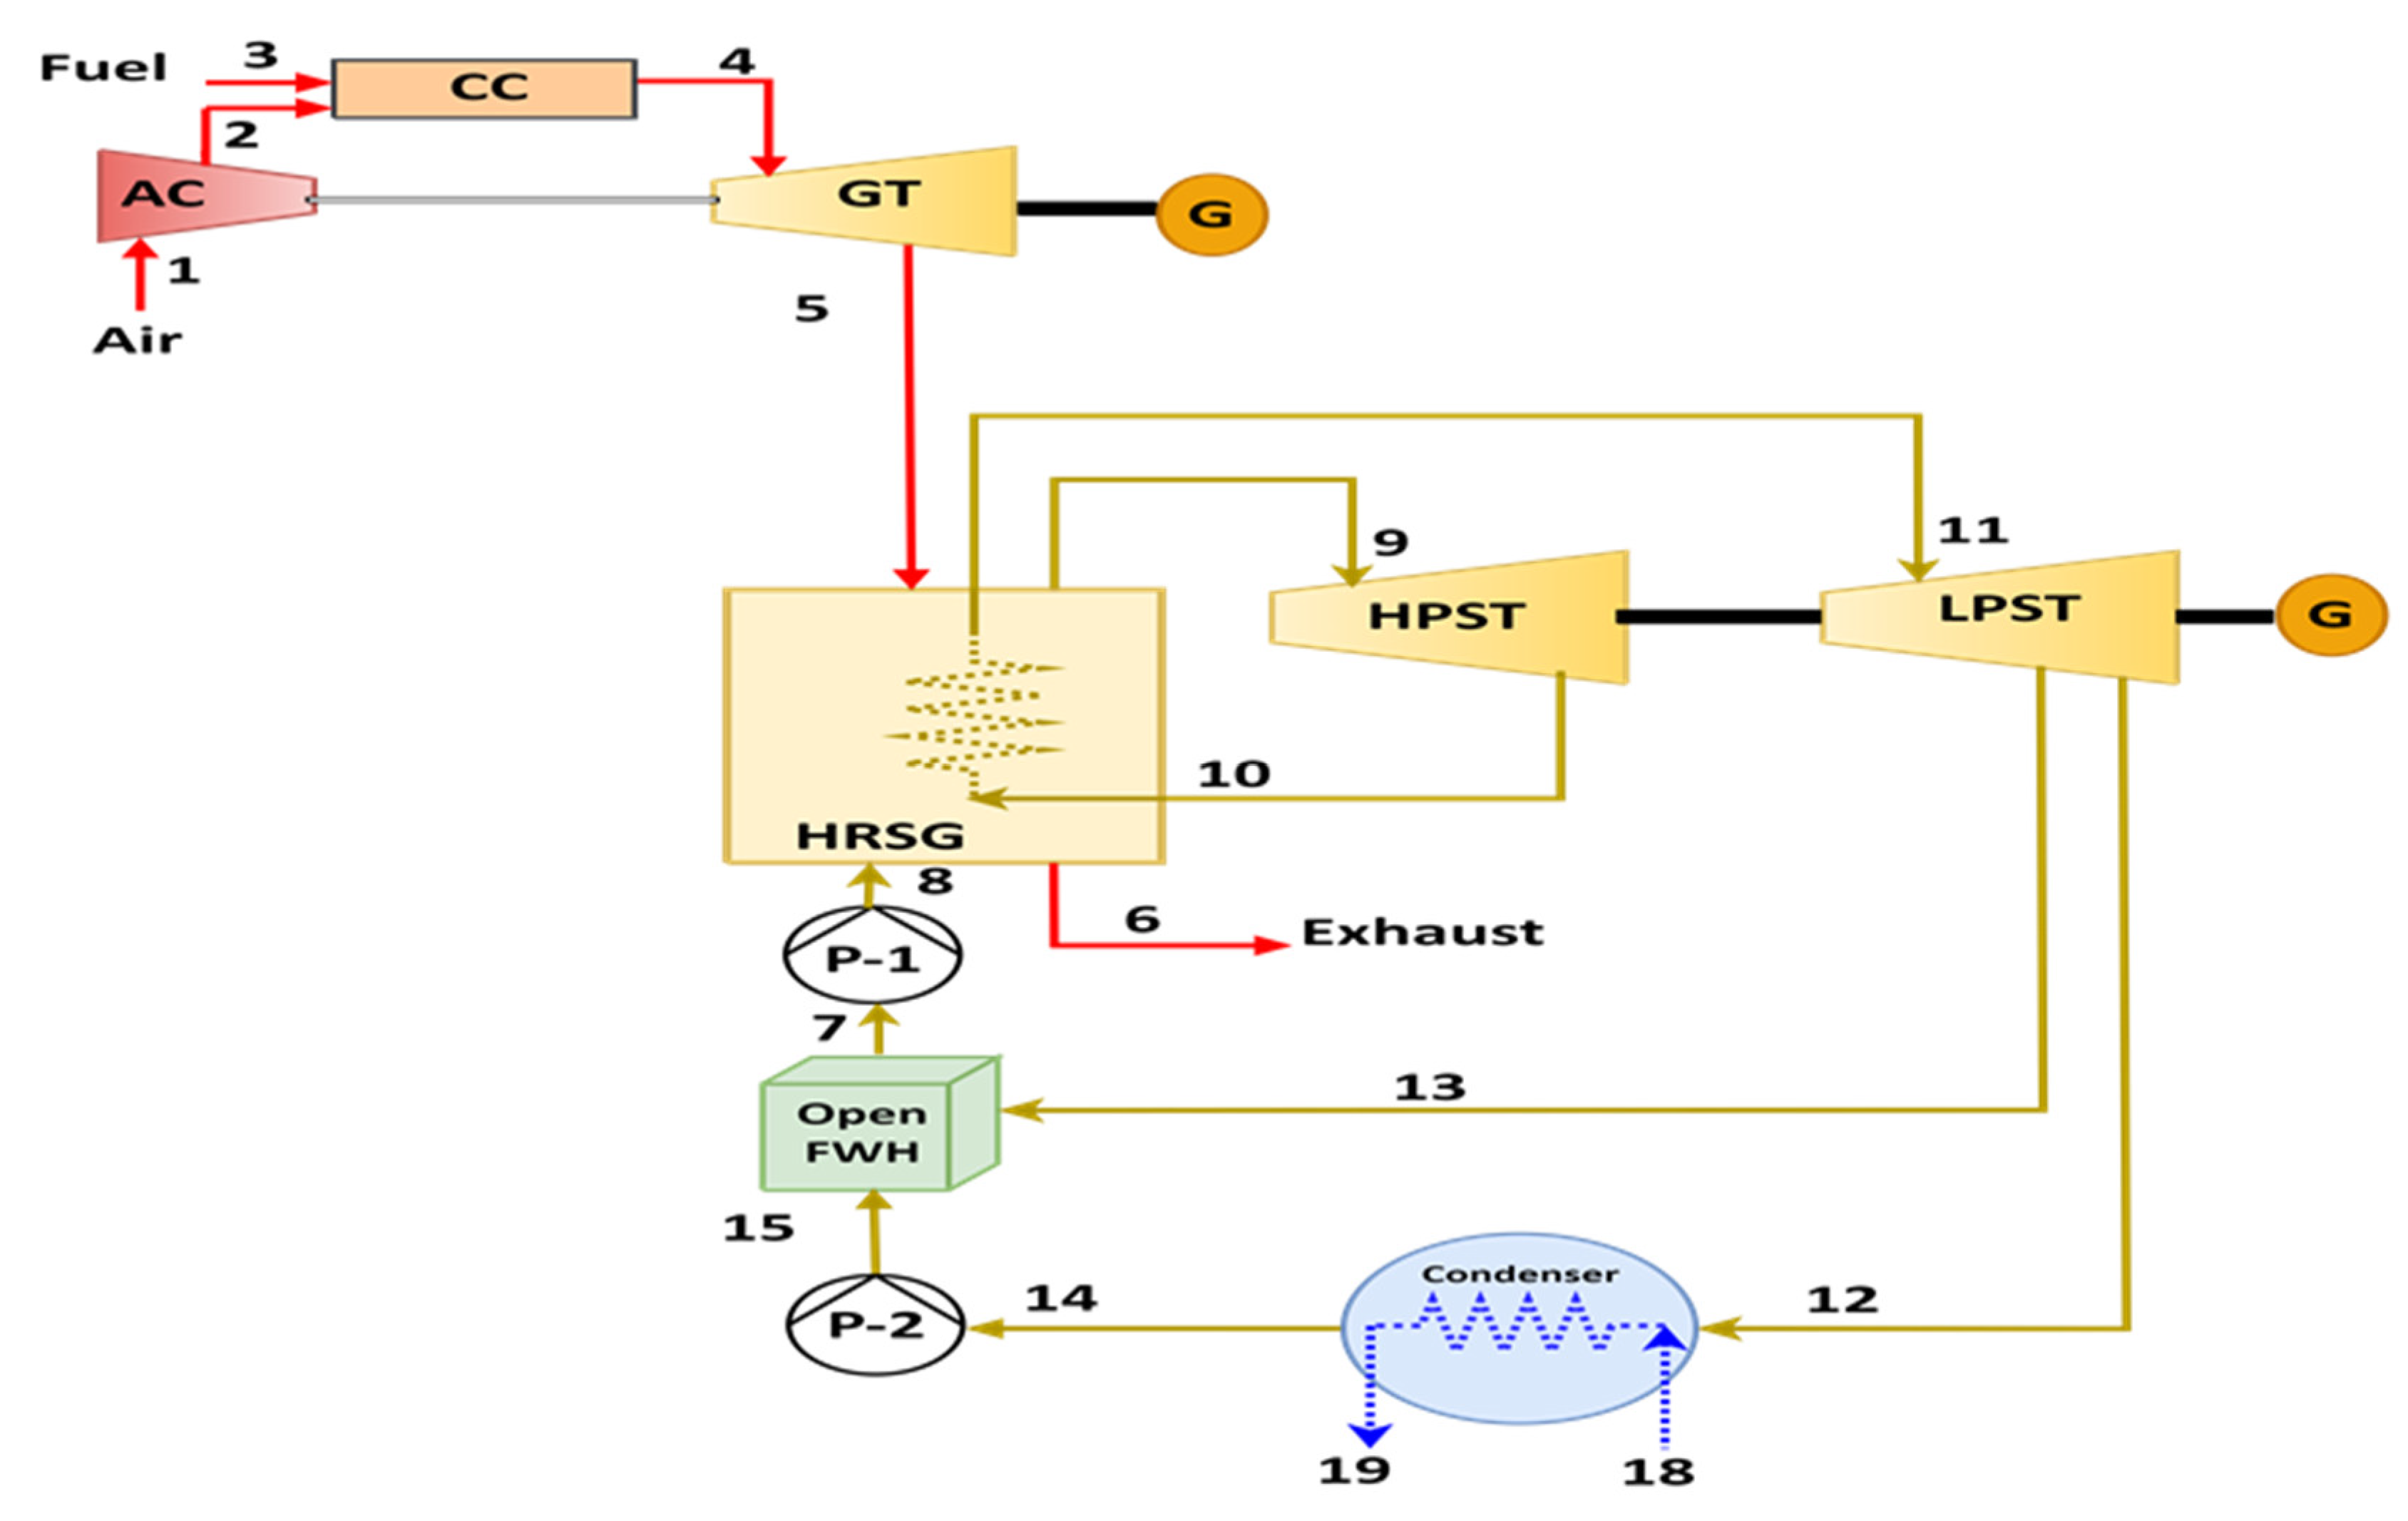
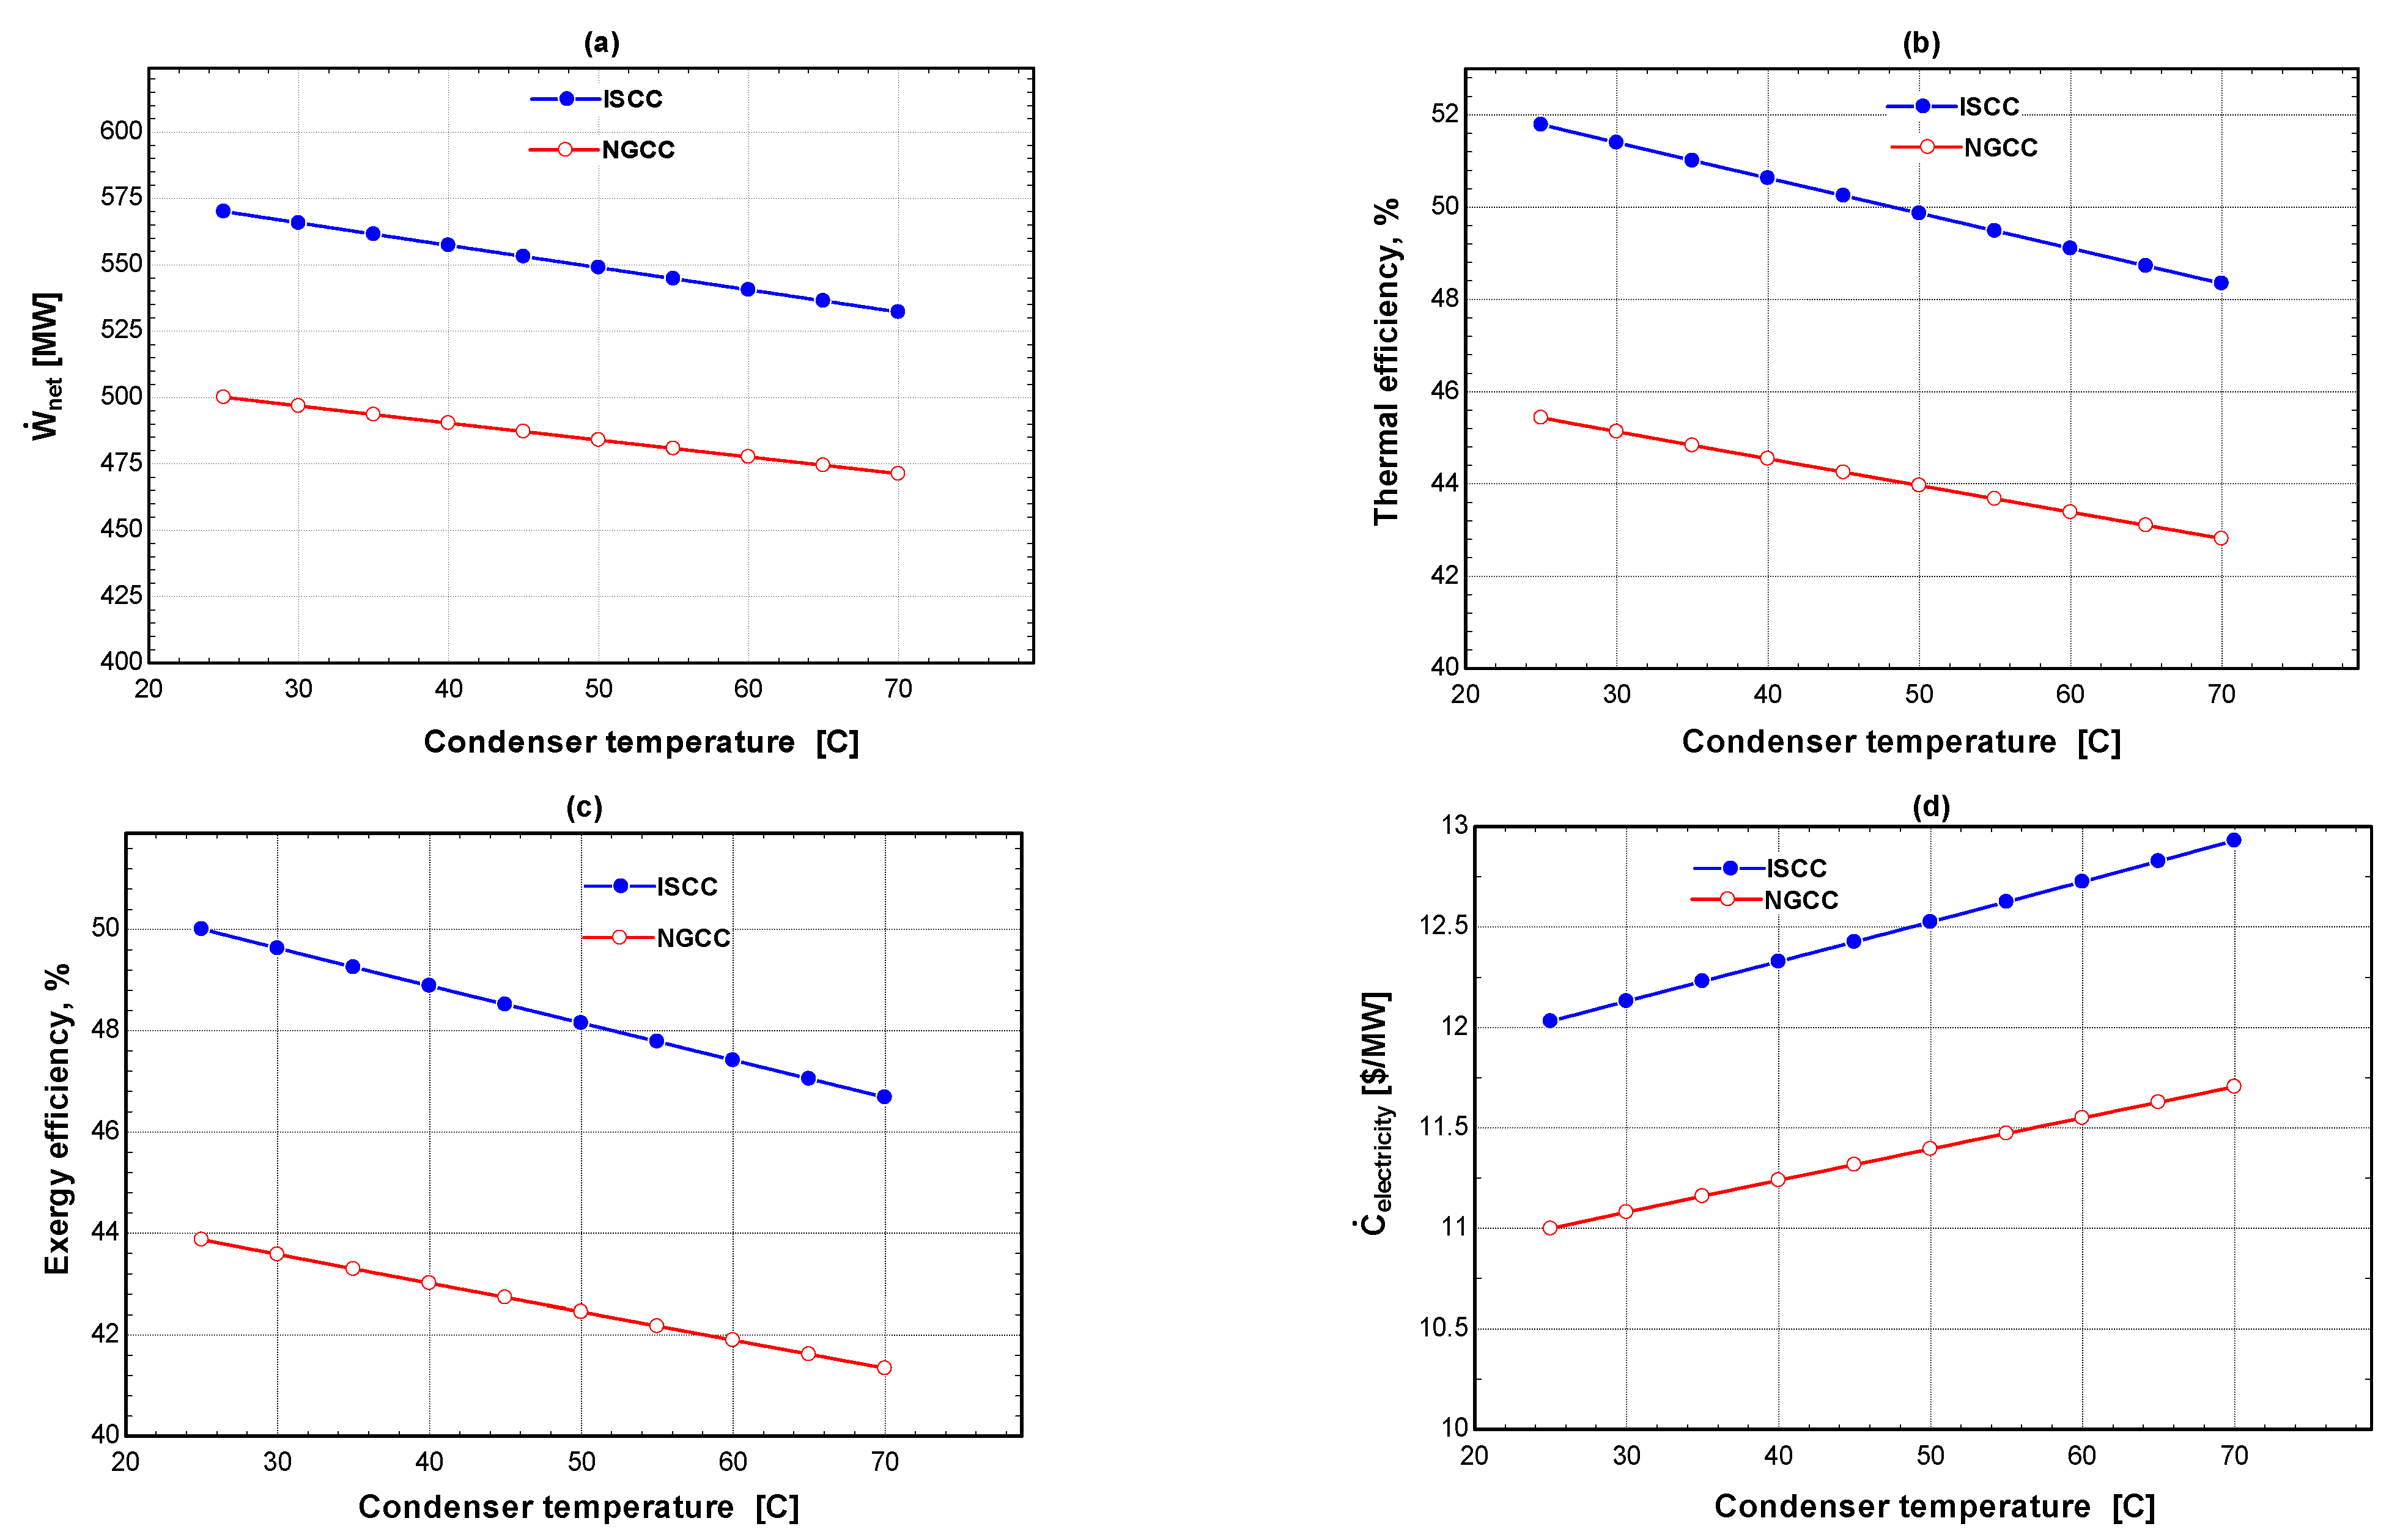
  • The NGCC’s net generating capacity is 493.5 MW, its ηenergy is 44.84 percent, and its Ψexergy is 43.35 percent. The ISCC cycle generates 561.5 MW of Ẇnet when the solar collectors are added to the NGCC. As a result, the ηenergy rises to 51 percent, while the Ψexergy rises to 49.26 percent for the ISCC.
  • The ISCC performs better than the NGCC because the solar collector supplies more heat to the HRSG.
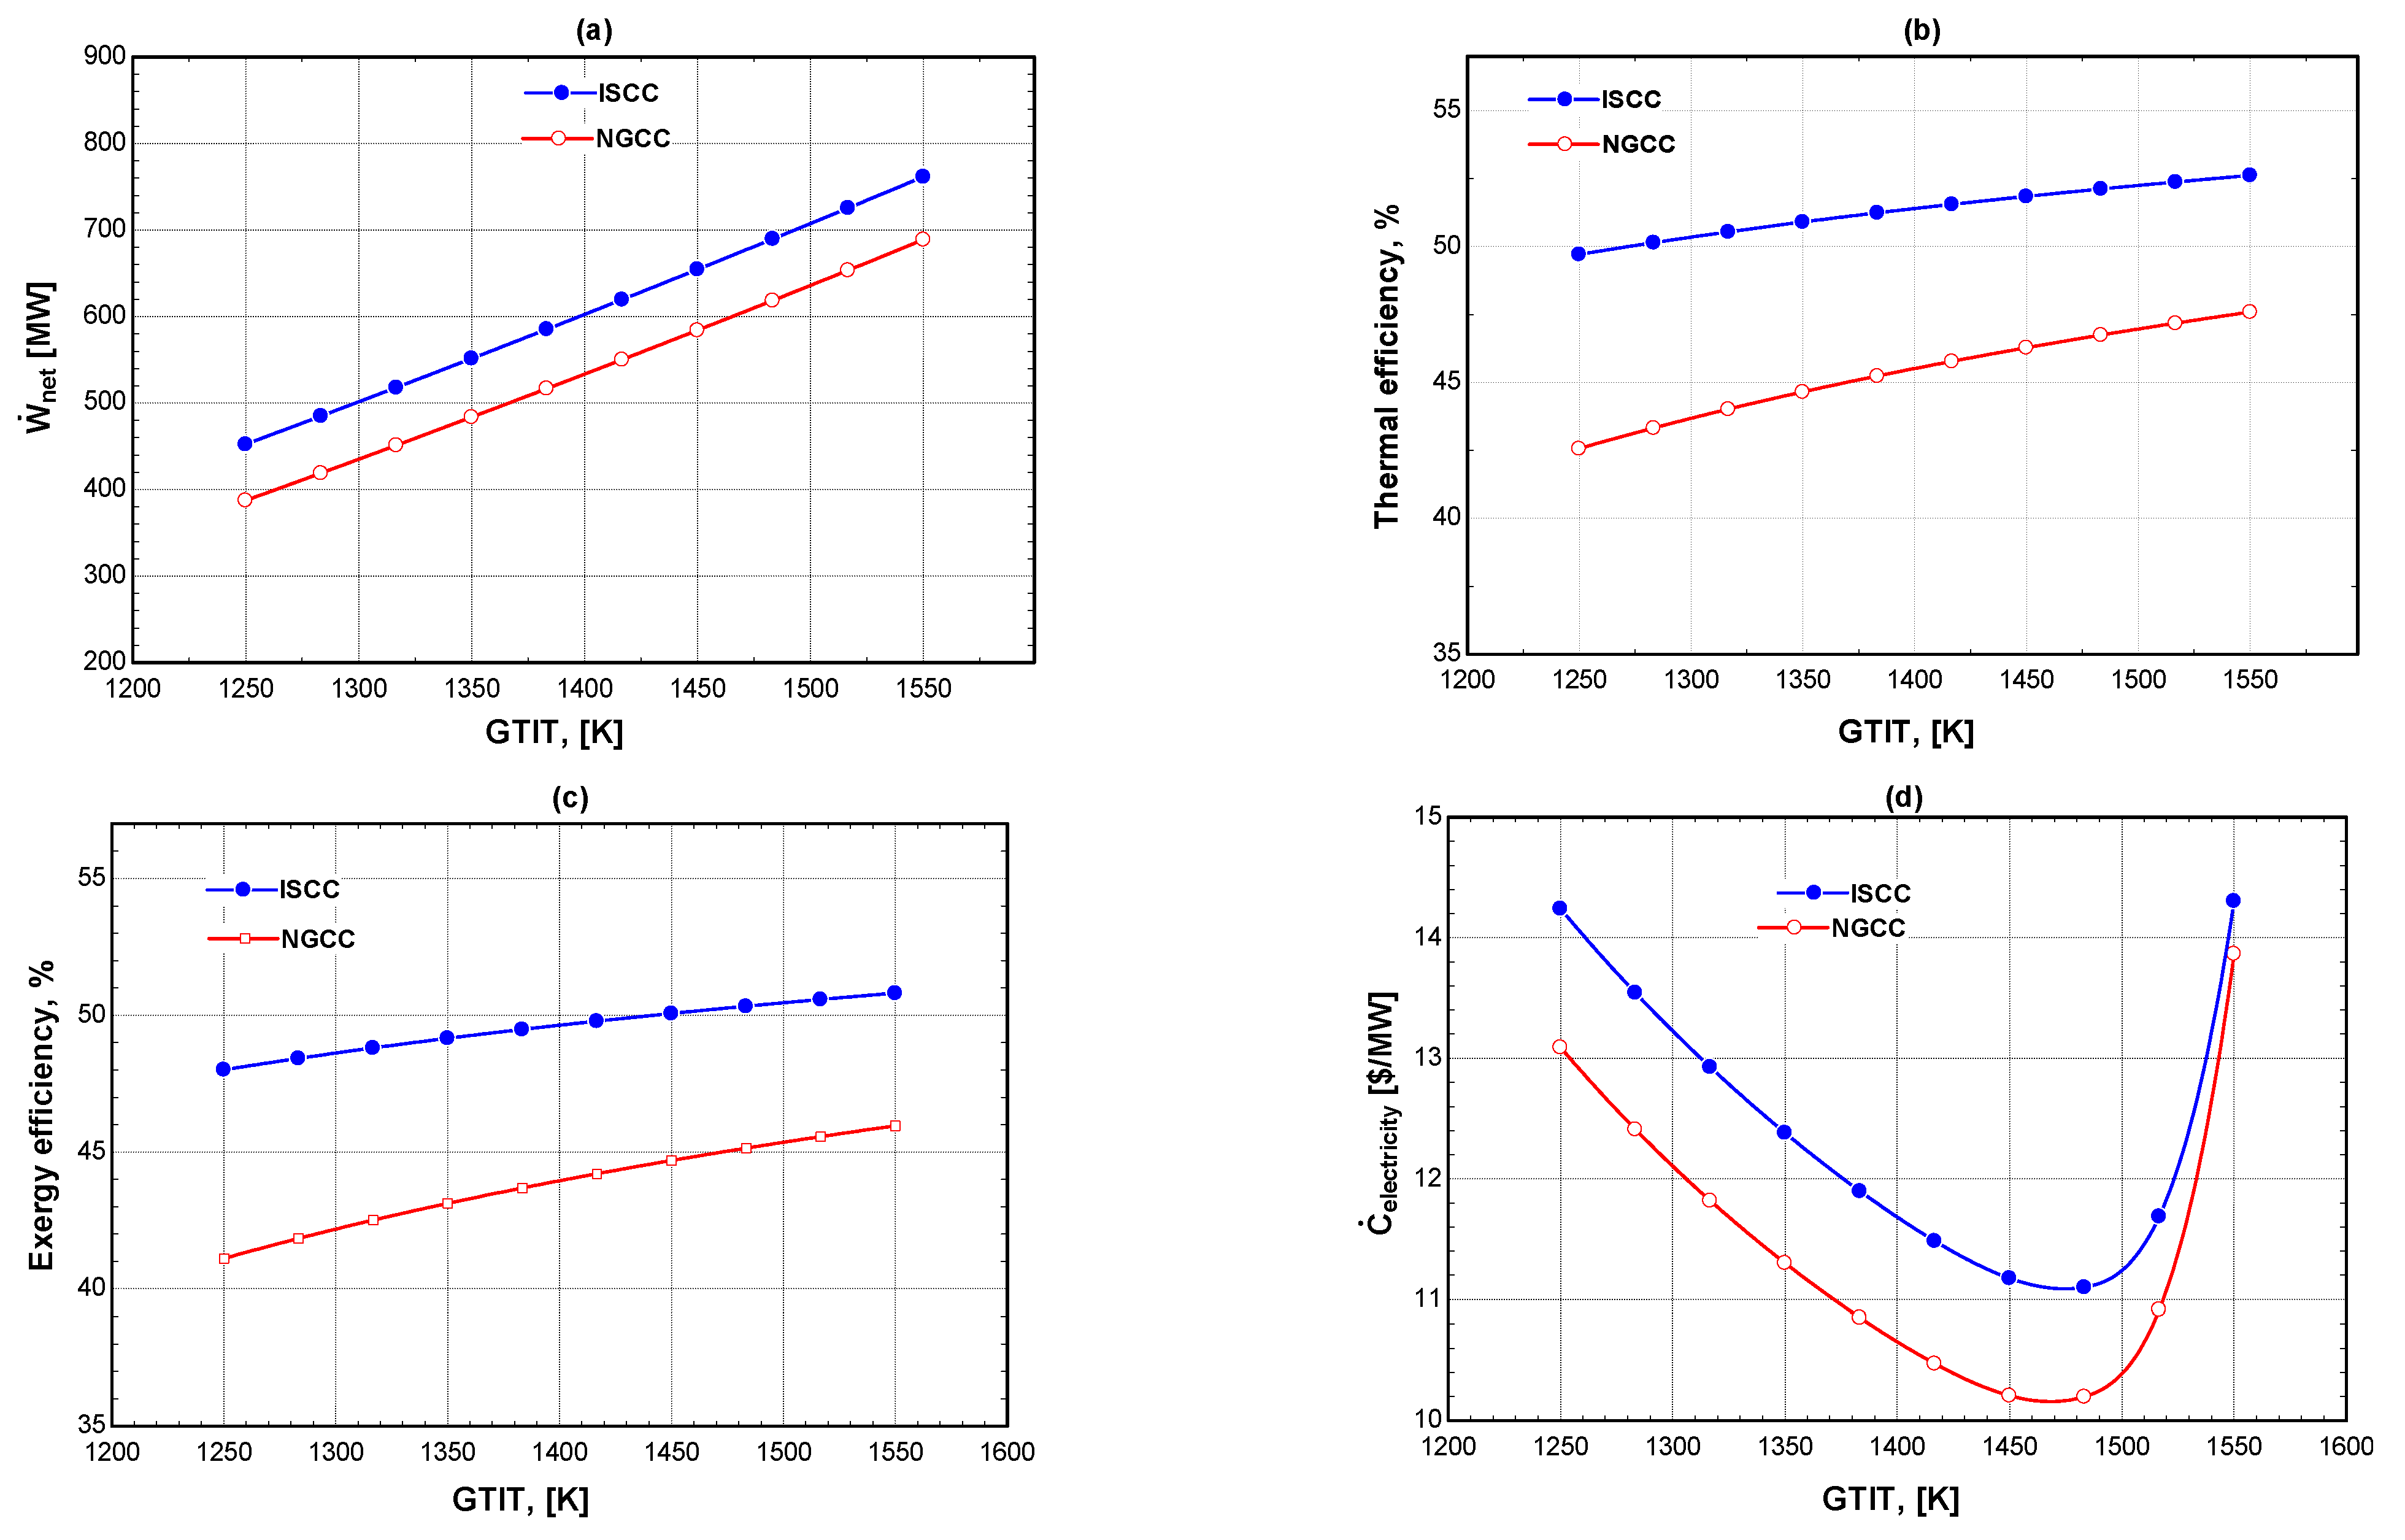
  • The C ˙ electricity of all cycles decreases with an increase in the GTIT until it reaches a minimum and then increases as the GTIT further increases. At high GTIT, the costs of the CC and G.T. rise dramatically and cause an increase in the C ˙ electricity of all cycles.
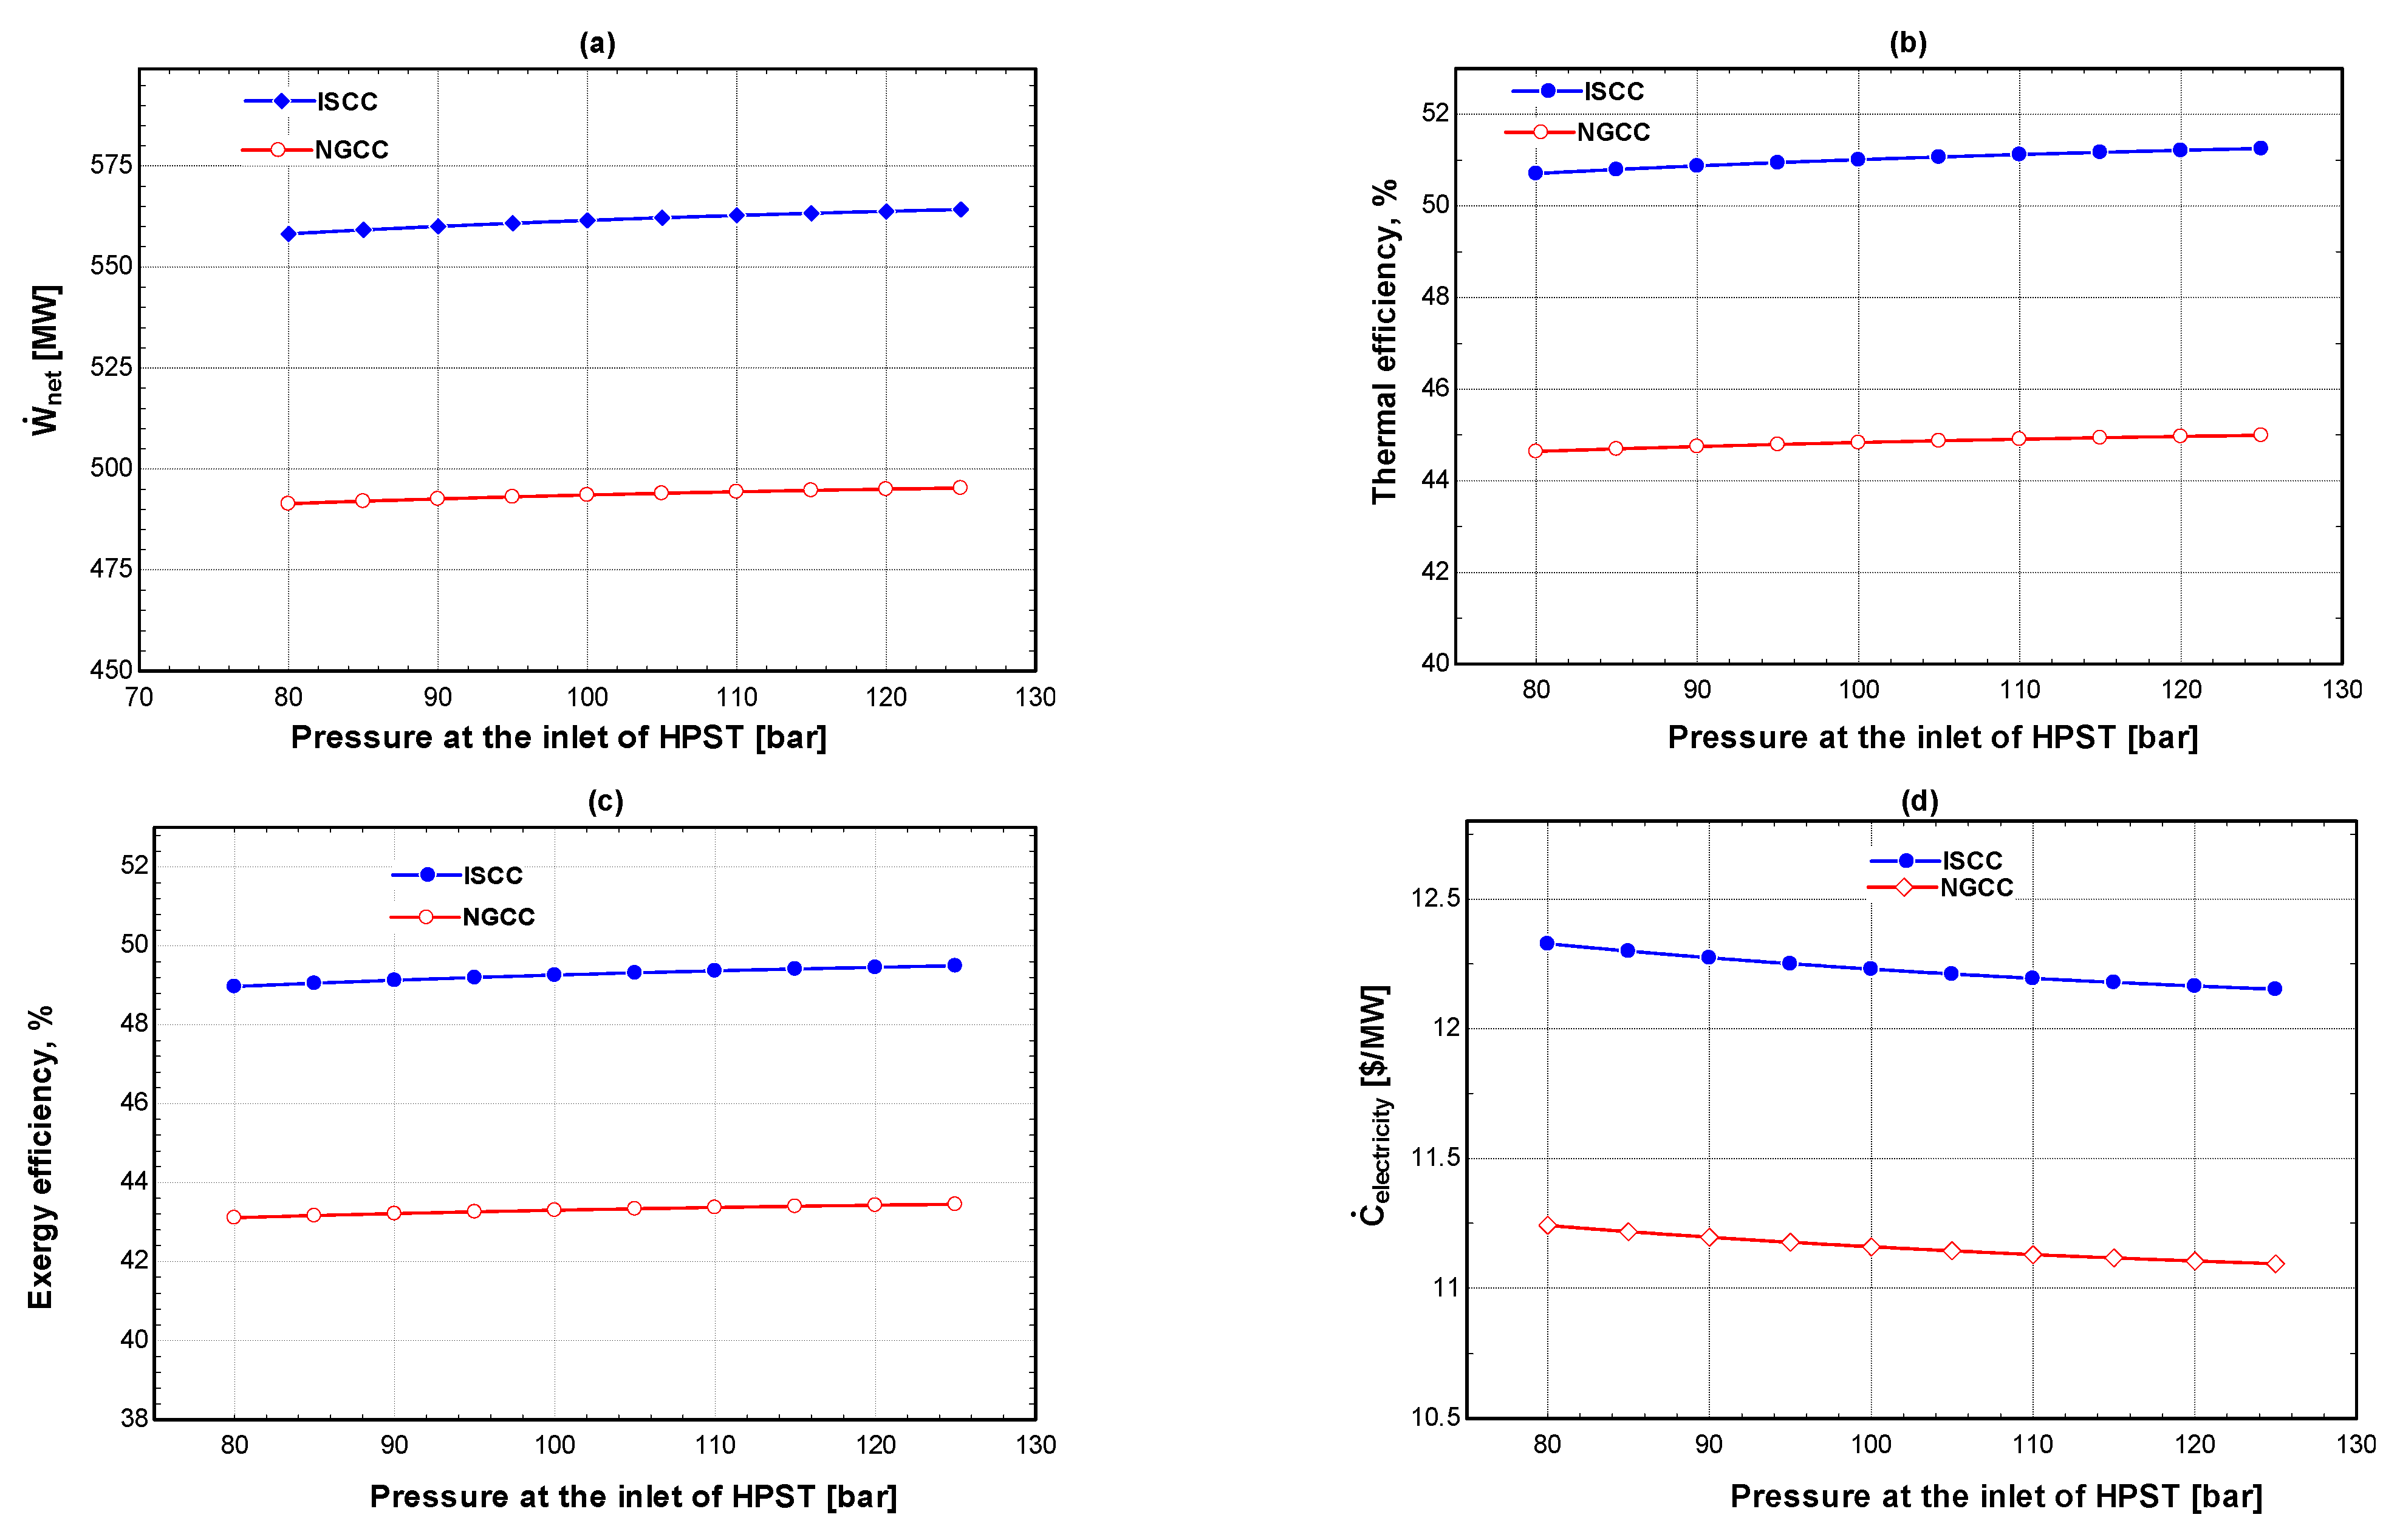
  • The Ẇnet of the ISCC and NGCC systems rises when the PHPST, in increases due to the increasing steam enthalpy at the HPST’s exit, whereas the C ˙ electricity for each cycle stays nearly fixed with the rise.
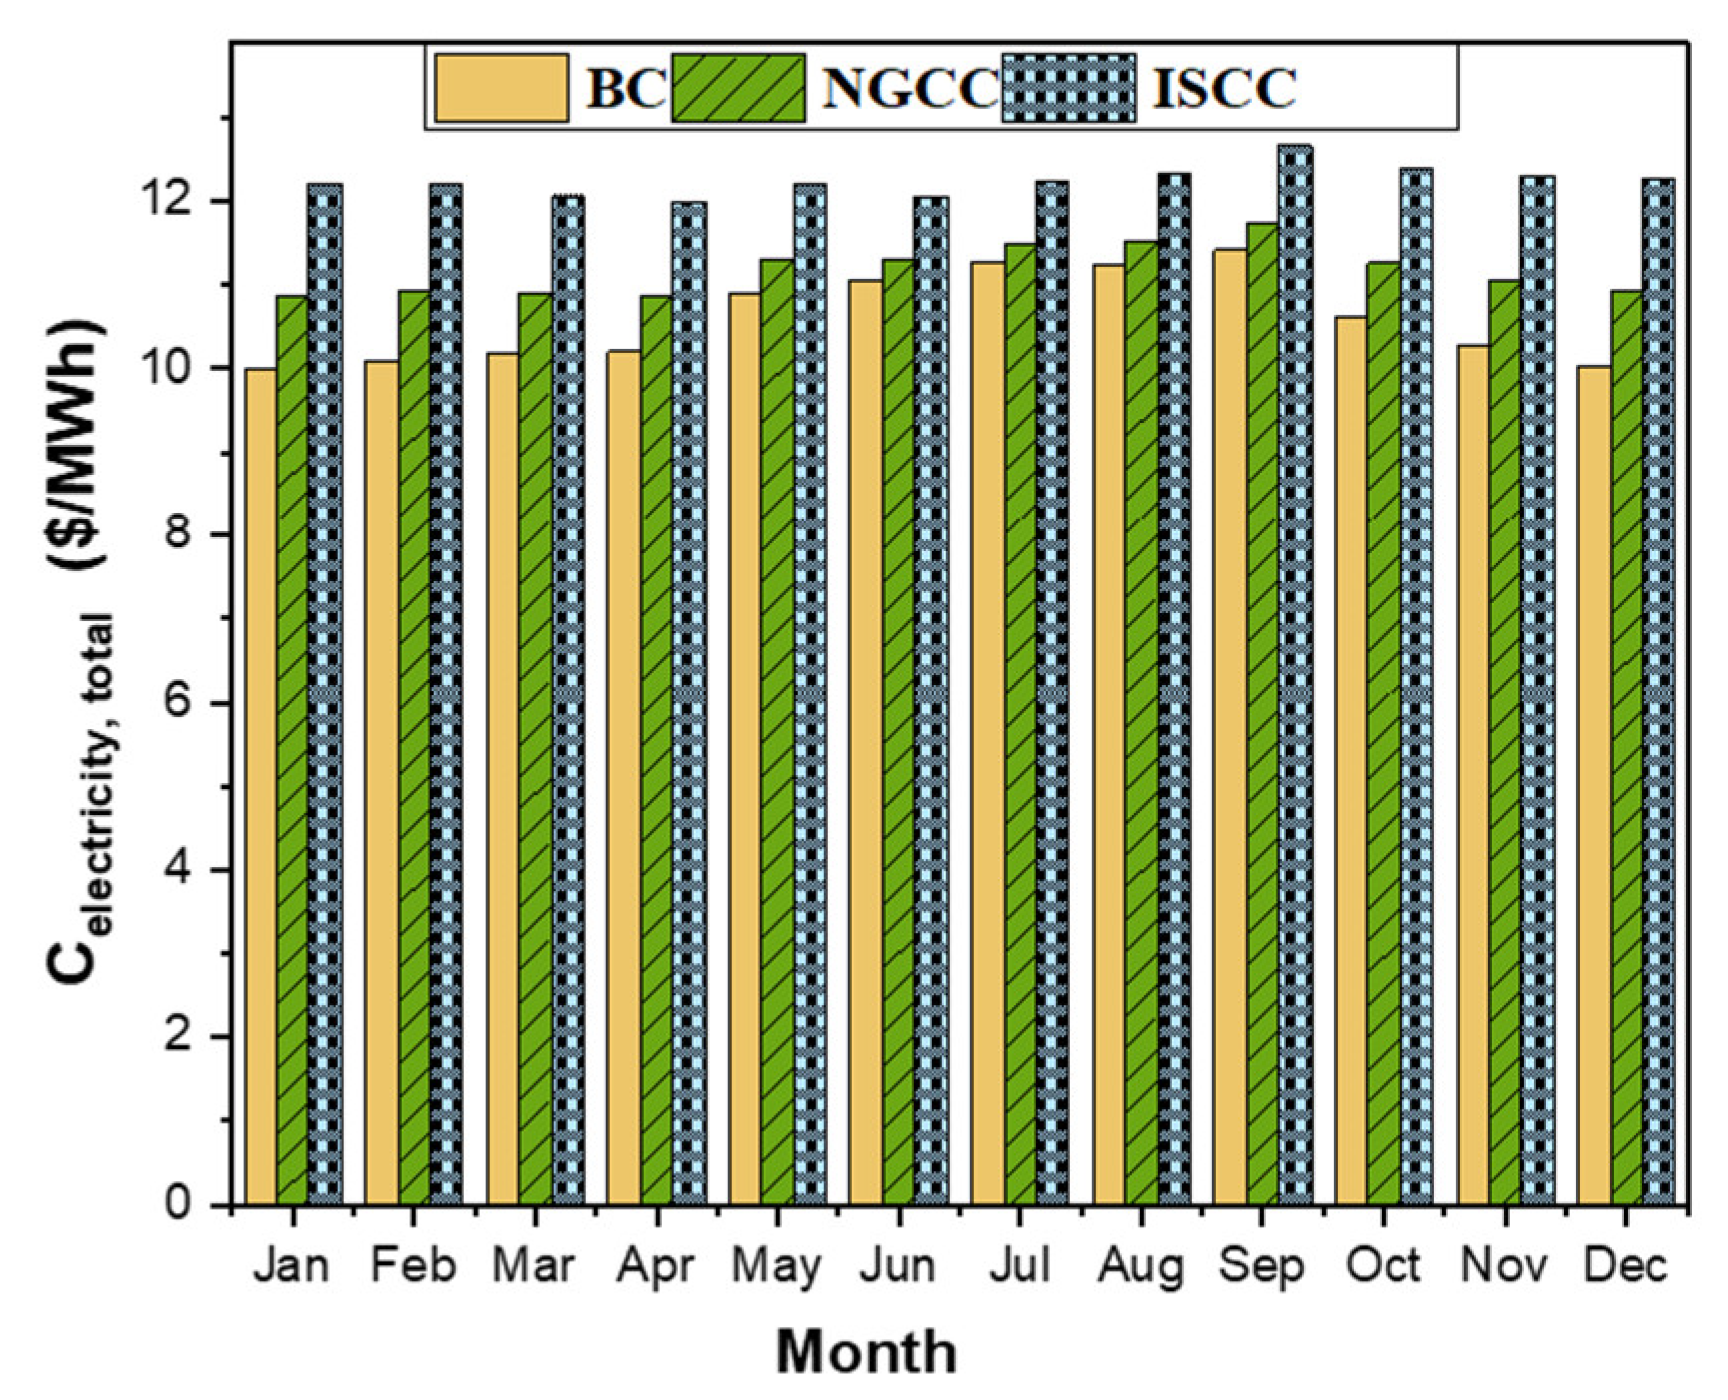
  • The ISCC system’s overall unit cost of production expenses range between 12.2 USD/MWh and 12.66 USD/MWh, while NGCC system’s overall unit cost of production ranges between 9.98 USD/MWh and 11.41 USD/MWh during the year.
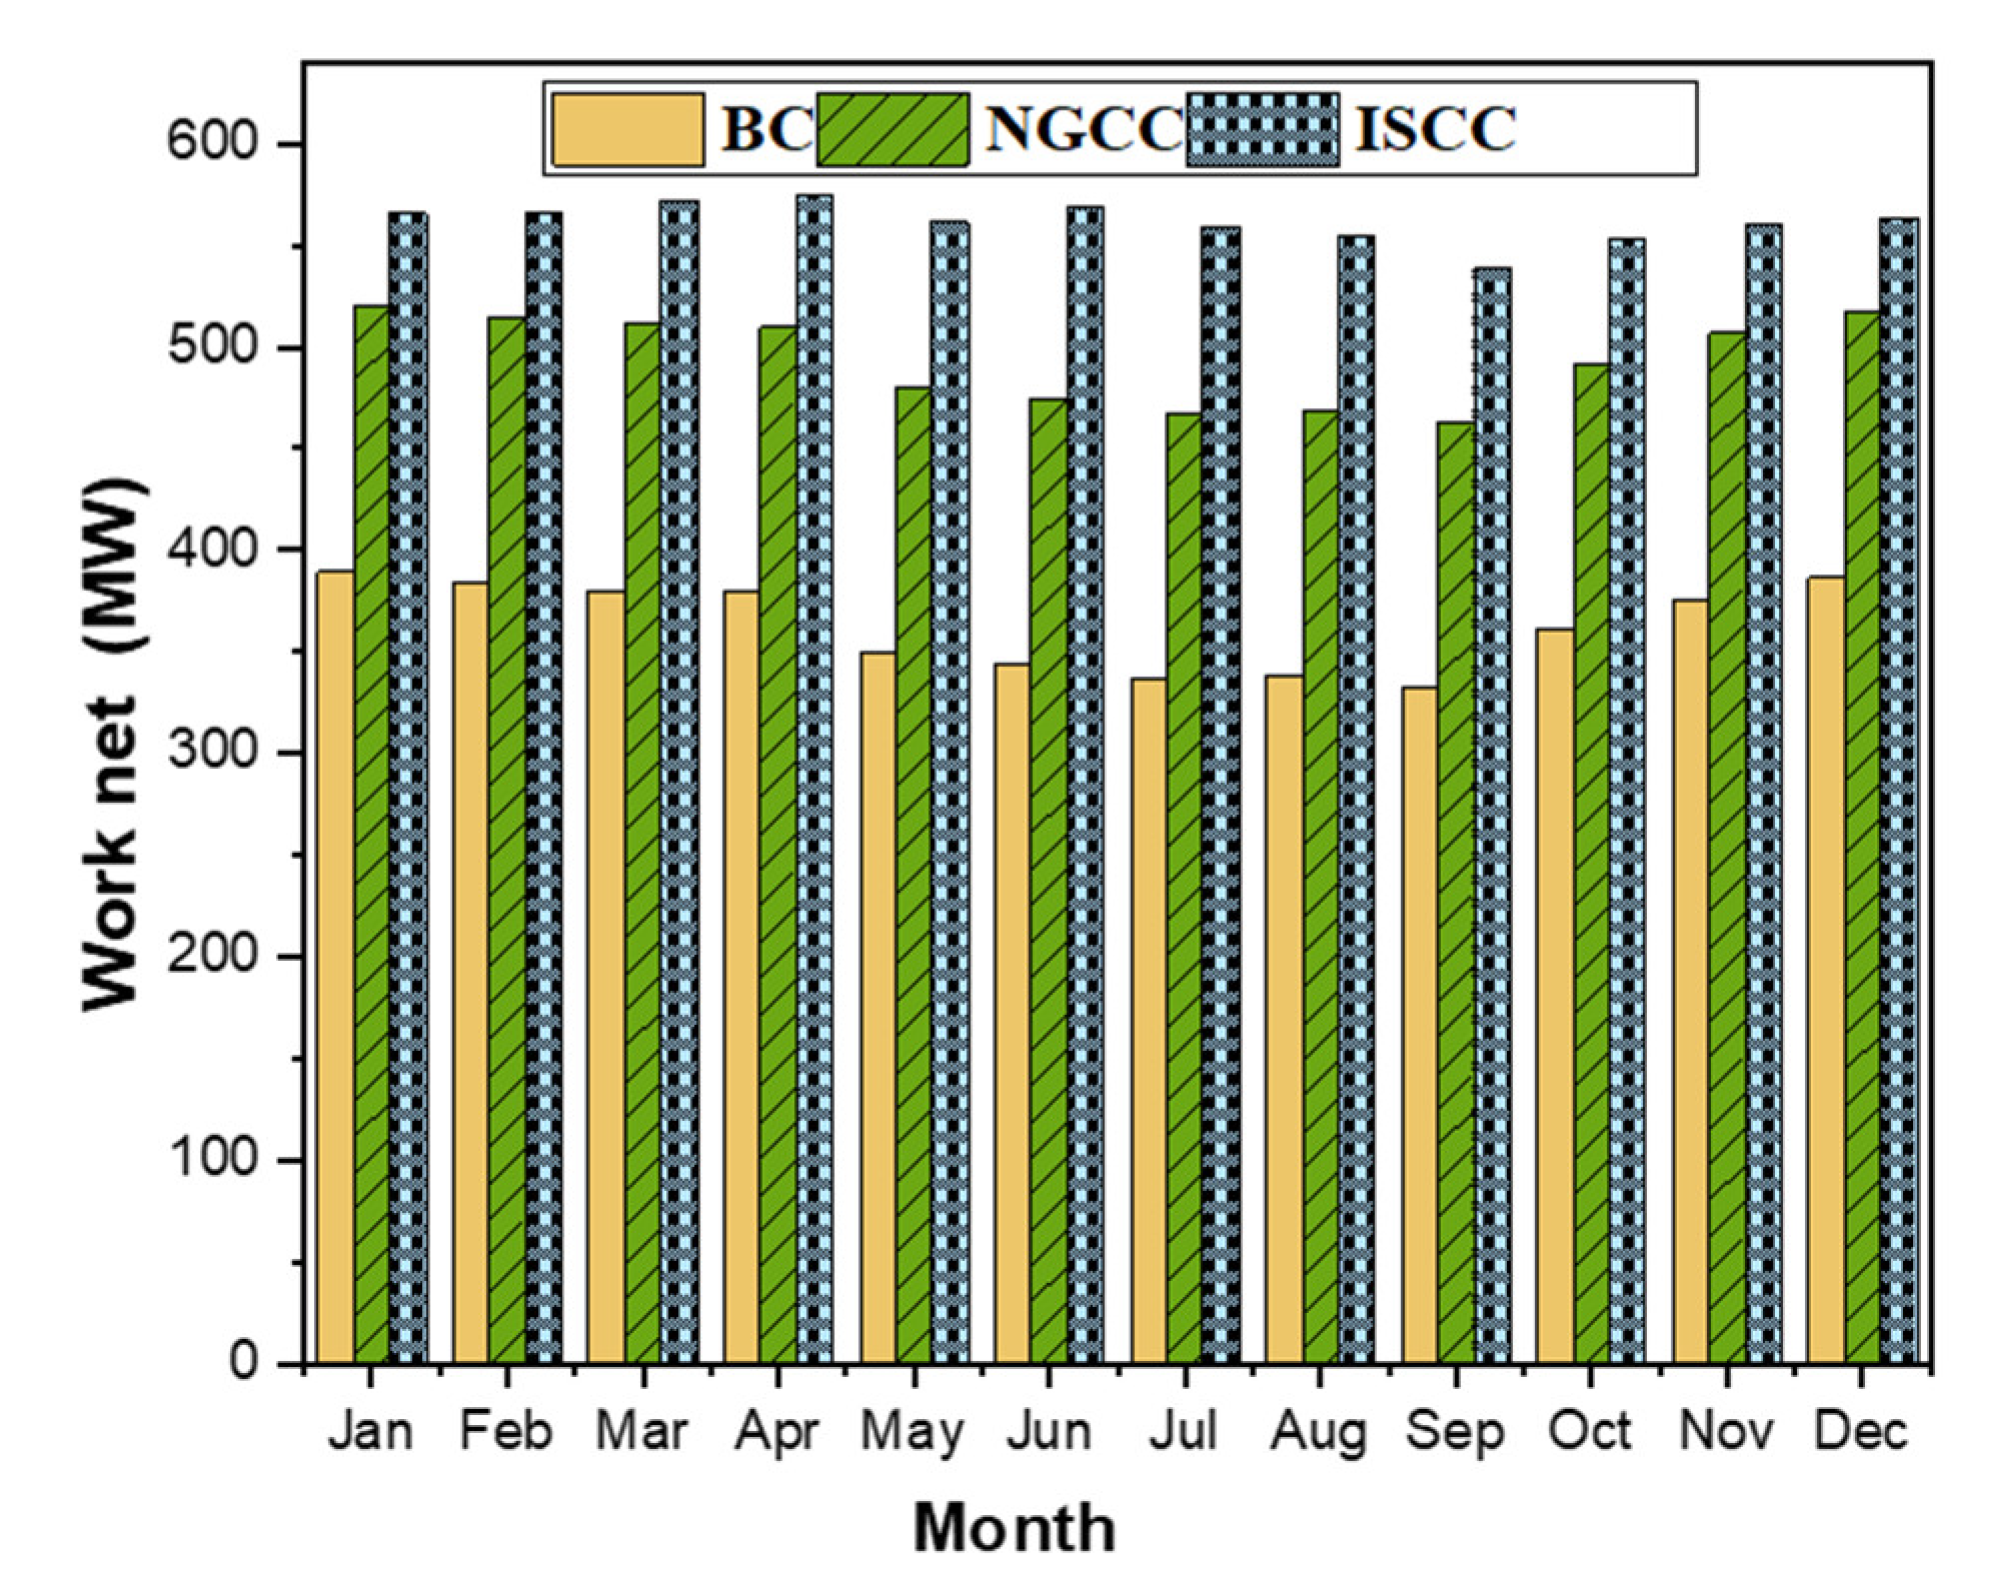
  • The maximum power production of NGCC is 519.5 MW in January, while the lowest output is 462.7 MW in September.
  • The ISCC system produces maximum power in April (574.7 MW) whereas the minimum power is produced in September (around 539 MW).

Author Contributions

W.T. and A.A. contributed equally to this work. All authors have read and agreed to the published version of the manuscript.

Funding

This research received no external funding.

Conflicts of Interest

The authors declare no conflict of interest.

Nomenclature

A a p area of the solar field (m2)
C ˙ cost rate (USD/h)
DNIdirect normal irradiance of the sun
E ˙ exergy rate (kJ)
m ˙ mass flow rate (kg/s)
hspecific enthalpy (kJ kg−1)
CRFpurchase cost (USD)
N number of operating hours
LHV fuel’s lower heating value
Q ˙ heat transfer rate (kW)
TTemperature
T s u n sun temperature
W ˙ power (kW)
Greek Symbols
η energy efficiency
φ maintenance factor
i interest rate
Ψ exergy efficiency
Subscripts
DDestruction
eExit
iInlet
fFuel
pProduct
qrelated to heat
wrelated to work
totTotal
T h _ V P Therminol VP-1
Abbreviations
A.C.air compressor
BC Brayton cycle
CC combustion chamber
ConCondenser
𝐶𝑅𝐹capital recovery factor
G.T.gas turbine
GTITgas turbine inlet temperature
HRSG heat recovery steam generation
HPST high-pressure steam turbine
ISCCintegrated solar combined cycle
LPST low-pressure steam turbine
PTCparabolic trough collector

References

  1. Finn, P.; Fitzpatrick, C. Demand Side Management of Industrial Electricity Consumption: Promoting the Use of Renewable Energy through Real-Time Pricing. Appl. Energy 2014, 113, 11–21. [Google Scholar] [CrossRef]
  2. Wu, X.F.; Chen, G.Q. Global Primary Energy Use Associated with Production, Consumption and International Trade. Energy Policy 2017, 111, 85–94. [Google Scholar] [CrossRef]
  3. AlKassem, A. A Performance Evaluation of an Integrated Solar Combined Cycle Power Plant with Solar Tower in Saudi Arabia. Renew. Energy Focus 2021, 39, 123–138. [Google Scholar] [CrossRef]
  4. Siddiqui, O.; Dincer, I. Analysis and Performance Assessment of a New Solar-Based Multigeneration System Integrated with Ammonia Fuel Cell and Solid Oxide Fuel Cell-Gas Turbine Combined Cycle. J. Power Sources 2017, 370, 138–154. [Google Scholar] [CrossRef]
  5. Martins, F.; Felgueiras, C.; Smitkova, M.; Caetano, N. Analysis of Fossil Fuel Energy Consumption and Environmental Impacts in European Countries. Energies 2019, 12, 964. [Google Scholar] [CrossRef] [Green Version]
  6. Golneshan, A.A.; Nemati, H. Comparison of Six Gas Turbine Power Cycle, a Key to Improve Power Plants. Mech. Ind. 2021, 22. [Google Scholar] [CrossRef]
  7. Hamouda, M.A.; Shaaban, M.F.; Sharaf Eldean, M.A.; Fath, H.E.S.; Al Bardan, M. Technoeconomic Assessment of a Concentrated Solar Tower-Gas Turbine Co-Generation System. Appl. Therm. Eng. 2022, 212, 118593. [Google Scholar] [CrossRef]
  8. Ni, M.; Yang, T.; Xiao, G.; Ni, D.; Zhou, X.; Liu, H.; Sultan, U.; Chen, J.; Luo, Z.; Cen, K. Thermodynamic Analysis of a Gas Turbine Cycle Combined with Fuel Reforming for Solar Thermal Power Generation. Energy 2017, 137, 20–30. [Google Scholar] [CrossRef]
  9. Al-Kouz, W.; Almuhtady, A.; Nayfeh, J.; Abu-Libdeh, N.; Boretti, A. A 140 MW Solar Thermal Plant with Storage in Ma’an, Jordan. E3S Web Conf. 2020, 181. [Google Scholar] [CrossRef]
  10. Bonforte, G.; Buchgeister, J.; Manfrida, G.; Petela, K. Exergoeconomic and Exergoenvironmental Analysis of an Integrated Solar Gas Turbine/Combined Cycle Power Plant. Energy 2018, 156, 352–359. [Google Scholar] [CrossRef]
  11. Manente, G.; Rech, S.; Lazzaretto, A. Optimum Choice and Placement of Concentrating Solar Power Technologies in Integrated Solar Combined Cycle Systems. Renew. Energy 2016, 96, 172–189. [Google Scholar] [CrossRef]
  12. Wang, S.; Fu, Z.; Sajid, S.; Zhang, T.; Zhang, G. Thermodynamic and Economic Analysis of an Integrated Solar Combined Cycle System. Entropy 2018, 20, 313. [Google Scholar] [CrossRef] [PubMed] [Green Version]
  13. Kannaiyan, S.; Bokde, N.D.; Geem, Z.W. Solar Collectors Modeling and Controller Design for Solar Thermal Power Plant. IEEE Access 2020, 8, 81425–81446. [Google Scholar] [CrossRef]
  14. Adnan, M.; Zaman, M.; Ullah, A.; Gungor, A.; Rizwan, M.; Raza Naqvi, S. Thermo-Economic Analysis of Integrated Gasification Combined Cycle Co-Generation System Hybridized with Concentrated Solar Power Tower. Renew. Energy 2022, 198, 654–666. [Google Scholar] [CrossRef]
  15. Delgado, B.O.; Palenzuela, P.; Alarcón-Padilla, D. Integrated Seawater Multi-Effect Distillation and Parabolic Trough Concentrating Solar Thermal Power Plants. Processes 2022, 10, 573. [Google Scholar] [CrossRef]
  16. Li, Y.; Yang, Y. Thermodynamic Analysis of a Novel Integrated Solar Combined Cycle. Appl. Energy 2014, 122, 133–142. [Google Scholar] [CrossRef]
  17. Jenkins, B.; Mullinger, P. Industrial and Process Furnaces: Principles, Design and Operation; Elsevier: Amsterdam, The Netherlands, 2011; ISBN 0080558062. [Google Scholar]
  18. Zhang, Z.; Duan, L.; Wang, Z.; Ren, Y. General Performance Evaluation Method of Integrated Solar Combined Cycle (ISCC) System. Energy 2022, 240, 122472. [Google Scholar] [CrossRef]
  19. Hosseini, R.; Soltani, M.; Valizadeh, G. Technical and Economic Assessment of the Integrated Solar Combined Cycle Power Plants in Iran. Renew. Energy 2005, 30, 1541–1555. [Google Scholar] [CrossRef]
  20. Ameri, M.; Mohammadzadeh, M. Thermodynamic, Thermoeconomic and Life Cycle Assessment of a Novel Integrated Solar Combined Cycle (ISCC) Power Plant. Sustain. Energy Technol. Assess. 2018, 27, 192–205. [Google Scholar] [CrossRef]
  21. Adibhatla, S.; Kaushik, S.C. Energy, Exergy and Economic (3E) Analysis of Integrated Solar Direct Steam Generation Combined Cycle Power Plant. Sustain. Energy Technol. Assessments 2017, 20, 88–97. [Google Scholar] [CrossRef]
  22. Horn, M.; Führing, H.; Rheinländer, J. Economic Analysis of Integrated Solar Combined Cycle Power Plants A Sample Case: The Economic Feasibility of an ISCCS Power Plant in Egypt. Energy 2004, 29, 935–945. [Google Scholar] [CrossRef]
  23. Behar, O.; Khellaf, A.; Mohammedi, K.; Ait-Kaci, S. A Review of Integrated Solar Combined Cycle System (ISCCS) with a Parabolic Trough Technology. Renew. Sustain. Energy Rev. 2014, 39, 223–250. [Google Scholar] [CrossRef]
  24. Li, Y.; Yuan, J.; Yang, Y. Performance Analysis of a Novel Cascade Integrated Solar Combined Cycle System. Energy Procedia 2015, 75, 540–546. [Google Scholar] [CrossRef] [Green Version]
  25. Abdelhafidi, N.; Bachari, N.E.I.; Abdelhafidi, Z.; Cheknane, A.; Mokhnache, A.; Castro, L. Modeling of Integrated Solar Combined Cycle Power Plant (ISCC) of Hassi R’mel, Algeria. Int. J. Energy Sect. Manag. 2020, 14, 505–526. [Google Scholar] [CrossRef]
  26. Nezammahalleh, H.; Farhadi, F.; Tanhaemami, M. Conceptual Design and Techno-Economic Assessment of Integrated Solar Combined Cycle System with DSG Technology. Sol. Energy 2010, 84, 1696–1705. [Google Scholar] [CrossRef]
  27. Al Zahrani, A.; Bindayel, A.; Al Rished, A.; Perdichizzi, A.; Franchini, G.; Ravelli, S. Comparative Analysis of Different CSP Plant Configurations in Saudi Arabia. In Proceedings of the Saudi Arabia Smart Grid Conference, Jeddah, Saudi Arabia, 6–8 December 2016; pp. 1–7. [Google Scholar] [CrossRef] [Green Version]
  28. Alqahtani, B.J.; Patiño-Echeverri, D. Integrated Solar Combined Cycle Power Plants: Paving the Way for Thermal Solar. Appl. Energy 2016, 169, 927–936. [Google Scholar] [CrossRef] [Green Version]
  29. Franchini, G.; Perdichizzi, A.; Ravelli, S.; Barigozzi, G. A Comparative Study between Parabolic Trough and Solar Tower Technologies in Solar Rankine Cycle and Integrated Solar Combined Cycle Plants. Sol. Energy 2013, 98, 302–314. [Google Scholar] [CrossRef]
  30. Rovira, A.; Abbas, R.; Sánchez, C.; Muñoz, M. Proposal and Analysis of an Integrated Solar Combined Cycle with Partial Recuperation. Energy 2020, 198. [Google Scholar] [CrossRef]
  31. Belgasim, B.; Aldali, Y.; Abdunnabi, M.J.R.; Hashem, G.; Hossin, K. The Potential of Concentrating Solar Power ( CSP ) for Electricity Generation in Libya. Renew. Sustain. Energy Rev. 2018, 90, 1–15. [Google Scholar] [CrossRef]
  32. Sachdeva, J.; Singh, O. Thermodynamic Analysis of Solar Powered Triple Combined Brayton, Rankine and Organic Rankine Cycle for Carbon Free Power. Renew. Energy 2019. [CrossRef]
  33. Cengel, Y.A.; Boles, M.A. Thermodynamics: An Engineering Approach, 8th ed.; McGraw-Hill: New York, NY, USA, 2015; ISBN 9788578110796. [Google Scholar]
  34. Akroot, A.; Namli, L. Performance Assessment of an Electrolyte-Supported and Anode-Supported Planar Solid Oxide Fuel Cells Hybrid System. J. Ther. Eng. 2021, 7, 1921–1935. [Google Scholar] [CrossRef]
  35. Moran, M.J.; Shapiro, H.N.; Boettner, D.D.; Bailey, M.B. Fundamentals of Engineering Thermodynamics; John Wiley and Sons: Hoboken, NJ, USA, 2020; ISBN 9781118412930. [Google Scholar]
  36. Ge, Y.; Wei, Y.; Zhao, Q.; Pei, Y. Energy and Exergy Analysis on a Waste Heat Recovery Module for Helicopters. IEEE Access 2021, 9, 122618–122625. [Google Scholar] [CrossRef]
  37. Wang, S.; Zhang, L.; Liu, C.; Liu, Z.; Lan, S.; Li, Q.; Wang, X. Techno-Economic-Environmental Evaluation of a Combined Cooling Heating and Power System for Gas Turbine Waste Heat Recovery. Energy 2021, 231, 120956. [Google Scholar] [CrossRef]
  38. Nourpour, M.; Khoshgoftar Manesh, M.H. Evaluation of Novel Integrated Combined Cycle Based on Gas Turbine-SOFC-Geothermal-Steam and Organic Rankine Cycles for Gas Turbo Compressor Station. Energy Convers. Manag. 2022, 252, 115050. [Google Scholar] [CrossRef]
  39. Nami, H.; Mahmoudi, S.M.S.; Nemati, A. Exergy, Economic and Environmental Impact Assessment and Optimization of a Novel Cogeneration System Including a Gas Turbine, a Supercritical CO2 and an Organic Rankine Cycle (GT-HRSG/SCO2). Appl. Therm. Eng. 2017, 110, 1315–1330. [Google Scholar] [CrossRef]
  40. Bakhshmand, S.K.; Saray, R.K.; Bahlouli, K.; Eftekhari, H.; Ebrahimi, A. Exergoeconomic Analysis and Optimization of a Triple-Pressure Combined Cycle Plant Using Evolutionary Algorithm. Energy 2015, 93, 555–567. [Google Scholar] [CrossRef]
  41. Köse, Ö.; Koç, Y.; Yağlı, H. Energy, Exergy, Economy and Environmental (4E) Analysis and Optimization of Single, Dual and Triple Configurations of the Power Systems: Rankine Cycle/Kalina Cycle, Driven by a Gas Turbine. Energy Convers. Manag. 2021, 227, 113604. [Google Scholar] [CrossRef]
  42. Cavalcanti, E.J.C. Exergoeconomic and Exergoenvironmental Analyses of an Integrated Solar Combined Cycle System. Renew. Sustain. Energy Rev. 2017, 67, 507–519. [Google Scholar] [CrossRef]
  43. Musharavati, F.; Khanmohammadi, S.; Pakseresht, A. A Novel Multi-Generation Energy System Based on Geothermal Energy Source: Thermo-Economic Evaluation and Optimization. Energy Convers. Manag. 2021, 230, 113829. [Google Scholar] [CrossRef]
  44. Lugand, P.; Parietti, C. Combined Cycle Plants with Frame 9F Gas Turbines. Proc. ASME Turbo Expo 1990, 4, 1–8. [Google Scholar] [CrossRef] [Green Version]
Figure 1. Schematic diagram of the natural gas combined cycle (NGCC).
Processes 11 00656 g001
Figure 2. Schematic diagram of the Integrated Solar Combined Cycle (ISCC).
Processes 11 00656 g002
Figure 3. The effect of the pressure ratio on the overall performance and cost of both systems: (a) the total produced power, (b) thermal efficiency, (c) exergy efficiency, and (d) total rate of production costs.
Processes 11 00656 g003
Figure 4. The effect of GTIT on the overall performance and cost of both systems: (a) the total produced power, (b) thermal efficiency, (c) exergy efficiency, and (d) total rate of production costs.
Processes 11 00656 g004
Figure 5. The effect of pressure at the inlet of HPST (PHPST, in) on the overall performance and cost of both systems: (a) the total produced power, (b) thermal efficiency, (c) exergy efficiency, and (d) total rate of production costs.
Processes 11 00656 g005
Figure 6. The effect of the condenser temperature on the overall performance and cost of both systems: (a) the total produced power, (b) thermal efficiency, (c) exergy efficiency, and (d) total rate of production costs.
Processes 11 00656 g006
Figure 7. The power produced for B.C., NGCC, and ISCC per month.
Processes 11 00656 g007
Figure 8. The overall unit cost of production for B.C., NGCC, and ISCC per month.
Processes 11 00656 g008
Table 1. Specifications for ISCC plants in previous studies.
Author(s)LocationCSP TypeCapacity of Total Plant (MWe)Capacity of Solar Field (MWe)Capacity Share (%)
Li et al. [24]ChinaPT594--
Abdelhafidi et al. [25]AlgeriaPT 1602213.75
Nezammahalleh et al. [26]Iran PT 4516714.85
Al Zahrani et al. [27]Saudi Arabia PT & ST932021.5
Alqahtani and Echeverri [28]U.S.PT 550 509
Franchini et al. [29]Spain PT & ST 89 21 23.6
Horn et al. [22]EgyptPT124118.8
Rovira et al. [30]Spain PT 130 53.85
Table 2. Operation conditions used for the ISCC system [31,32].
Parameter Value
No. of gas turbines3
G.T. cycleCompression ratio12.3
Air mass flow rate, kg/s418 × 3
GTIT, °C1087
Ambient temperature, KDepends on the month
LHV of fuel, (kJ/kg)50,056
ηAC, %86
ηGT, %89
ηCC, %99.7
RC cycleHPST inlet pressure, bar100
LPST inlet pressure, bar20
Condenser Temperature, °C35
ηST, %85
ηPump, %80
Effectiveness of HRSG, %70
Solar PTC fieldLatitude location (deg.) 35.35° N
Longitude location (deg.) 43.16° E
LocationMosul/ Iraq
Solar field area (m2) 510,120
HTF outlet temperature (°C) 393
HTF inlet temperature (°C) 293
Working fluidTherminol VP-1
Table 3. Atmospheric properties at the inlet of the air compressor.
MonthDNI
W/m2
Average Temperature °CAverage Relative Humidity %
January3.937.4256.38
February4.329.7556.44
March5.1712.5355.75
April5.6221.8534
May6.8628.8720.5
June 7.9532.2315.25
July7.7636.3917.19
August7.2735.6417.44
September6.4829.2920.38
October5.2922.8327.38
November4.5515.0854.06
December3.868.854.06
Table 4. Purchased equipment cost [40,41,42].
EquipmentCost Function
A.C. 71.1 × m ˙ air × P r / 0.90 η comp × ln Pr
CC 25.6 × m ˙ air / 0.995 P 4 / P 2 × 1 + exp 0.018 × T 4 26.4
GT 266.3 × m ˙ gas / 0.92 η turb × ln Pr × 1 + exp 0.036 × T 4 54.4
HRSG 6570   Q ˙ H R S G / Δ T L M T D 0.8 + 21,276 m ˙ w a t e r   + 1184.4 m ˙ g 1.2
HPST 6000 W ˙ HPST 0.7
LPST 6000 W ˙ LPST 0.7
Pump1 3540 W ˙ P 1 0.71
Pump2 3540 W ˙ P 2 0.71
OFWH 5200 m ˙ water
PTC 126 A ap
Table 5. Validation of the Brayton cycle model.
ParameterG.T. Frame 9 [44] Present Model
Ambient temperature, °C1919
Gas turbine inlet temperature, °C11041104
Ambient pressure, bar1.0131.013
Air mass flow, kg/s408.6408.6
Pressure ratio12.112.1
Power output, MW116.9118.6
Exhaust temperature, °C529537
Thermal efficiency, %33.133.13
Table 6. Validation of regenerative Rankine cycle model.
ParameterPresent ModelRef. [32]
H.P. steam pressure, kPa50005000
LP steam pressure, kPa20002000
L.P. steam reheat temperature, °C873873
Isentropic efficiency of S.T., %8080
Condenser Pressure of SRC, kPa55
Mass flow rate of water, kg/s0.6450.645
Fraction of steam, %2020
Effectiveness of HRSG, %9090
Power (kW)5568055240
Thermal Efficiency (%)30.0429.06
Table 7. The properties for each state for the ISCC at the optimum condition.
Statem
(kg/s)
P
(kPa)
T
(K)
h
(kJ/kg)
s
(K.J./kg. K)
E
(M.W.)
1418101.3295246.45.7350
24181277659623.45.832145.5
37.33101.3288−467211.53380
4425.312131360240.68.041405.8
5425.3104.5822.8−414.58.151113.3
6425.3101.3402.9−880.47.37213.93
7144.9121.6372.64171.30112.12
8144.910133373.9430.11.30813.71
9144.99829794.834336.68285.9
10144.92007581.830446.801224.4
11144.91946774.834737.452258.4
12130.45.58330824377.94278.42
1314.49121.6463.328557.70215.8
14130.45.5833081460.50316.603
15130.4121.6308146.20.50326.618
16427.71000665780.61.675120.3
17427.71000566539.31.28367.11
18661710129591.660.32280
196617101307141.80.48956.592
Table 8. Performance and cost of the NGCC and ISCC cycles.
ISCCNGCC
Work net from BC363.1 MW363.1 MW
Work net from RC198.4 MW130.5 MW
Net output power561.5 MW493.5 MW
Overall exergy efficiency49.26%43.35%
Overall thermal efficiency51%44.84%
Electricity cost of the cycle6876 USD/h5508 USD/h
Cost for each MW11.16 USD12.23 USD
Table 9. Exergy analysis of the ISCC cycle.
ComponentNo E ˙ f
( M . W . )
E ˙ p
( M . W . )
E ˙ d
( M . W . )
E ˙ d
( % )
Ψ
( % )
A.C.3472.3436.636.225.5592.34
CC315771217359.255.177.21
GT3877.5835.941.636.3895.26
HRSG1351.3306.245.066.8487.17
HPST161.5656.335.230.7991,51
LPST1164.114420.133.0687.74
Cond171.825.665.239.9110.33
Pump 111.901.590.3010.04684.1
Pump 210.020.0150.0040.000680.64
OFWH122.4212.1210.31.5754.04
Collector1114.453.2361.179.2946.53
Disclaimer/Publisher’s Note: The statements, opinions and data contained in all publications are solely those of the individual author(s) and contributor(s) and not of MDPI and/or the editor(s). MDPI and/or the editor(s) disclaim responsibility for any injury to people or property resulting from any ideas, methods, instructions or products referred to in the content.

