
Numerical Analysis of CFST Column with PBL Stiffeners under Axial Compression

Abstract
:1. Introduction
2. Description of the Previous Test
3. Finite Element Models
3.1. Material Models
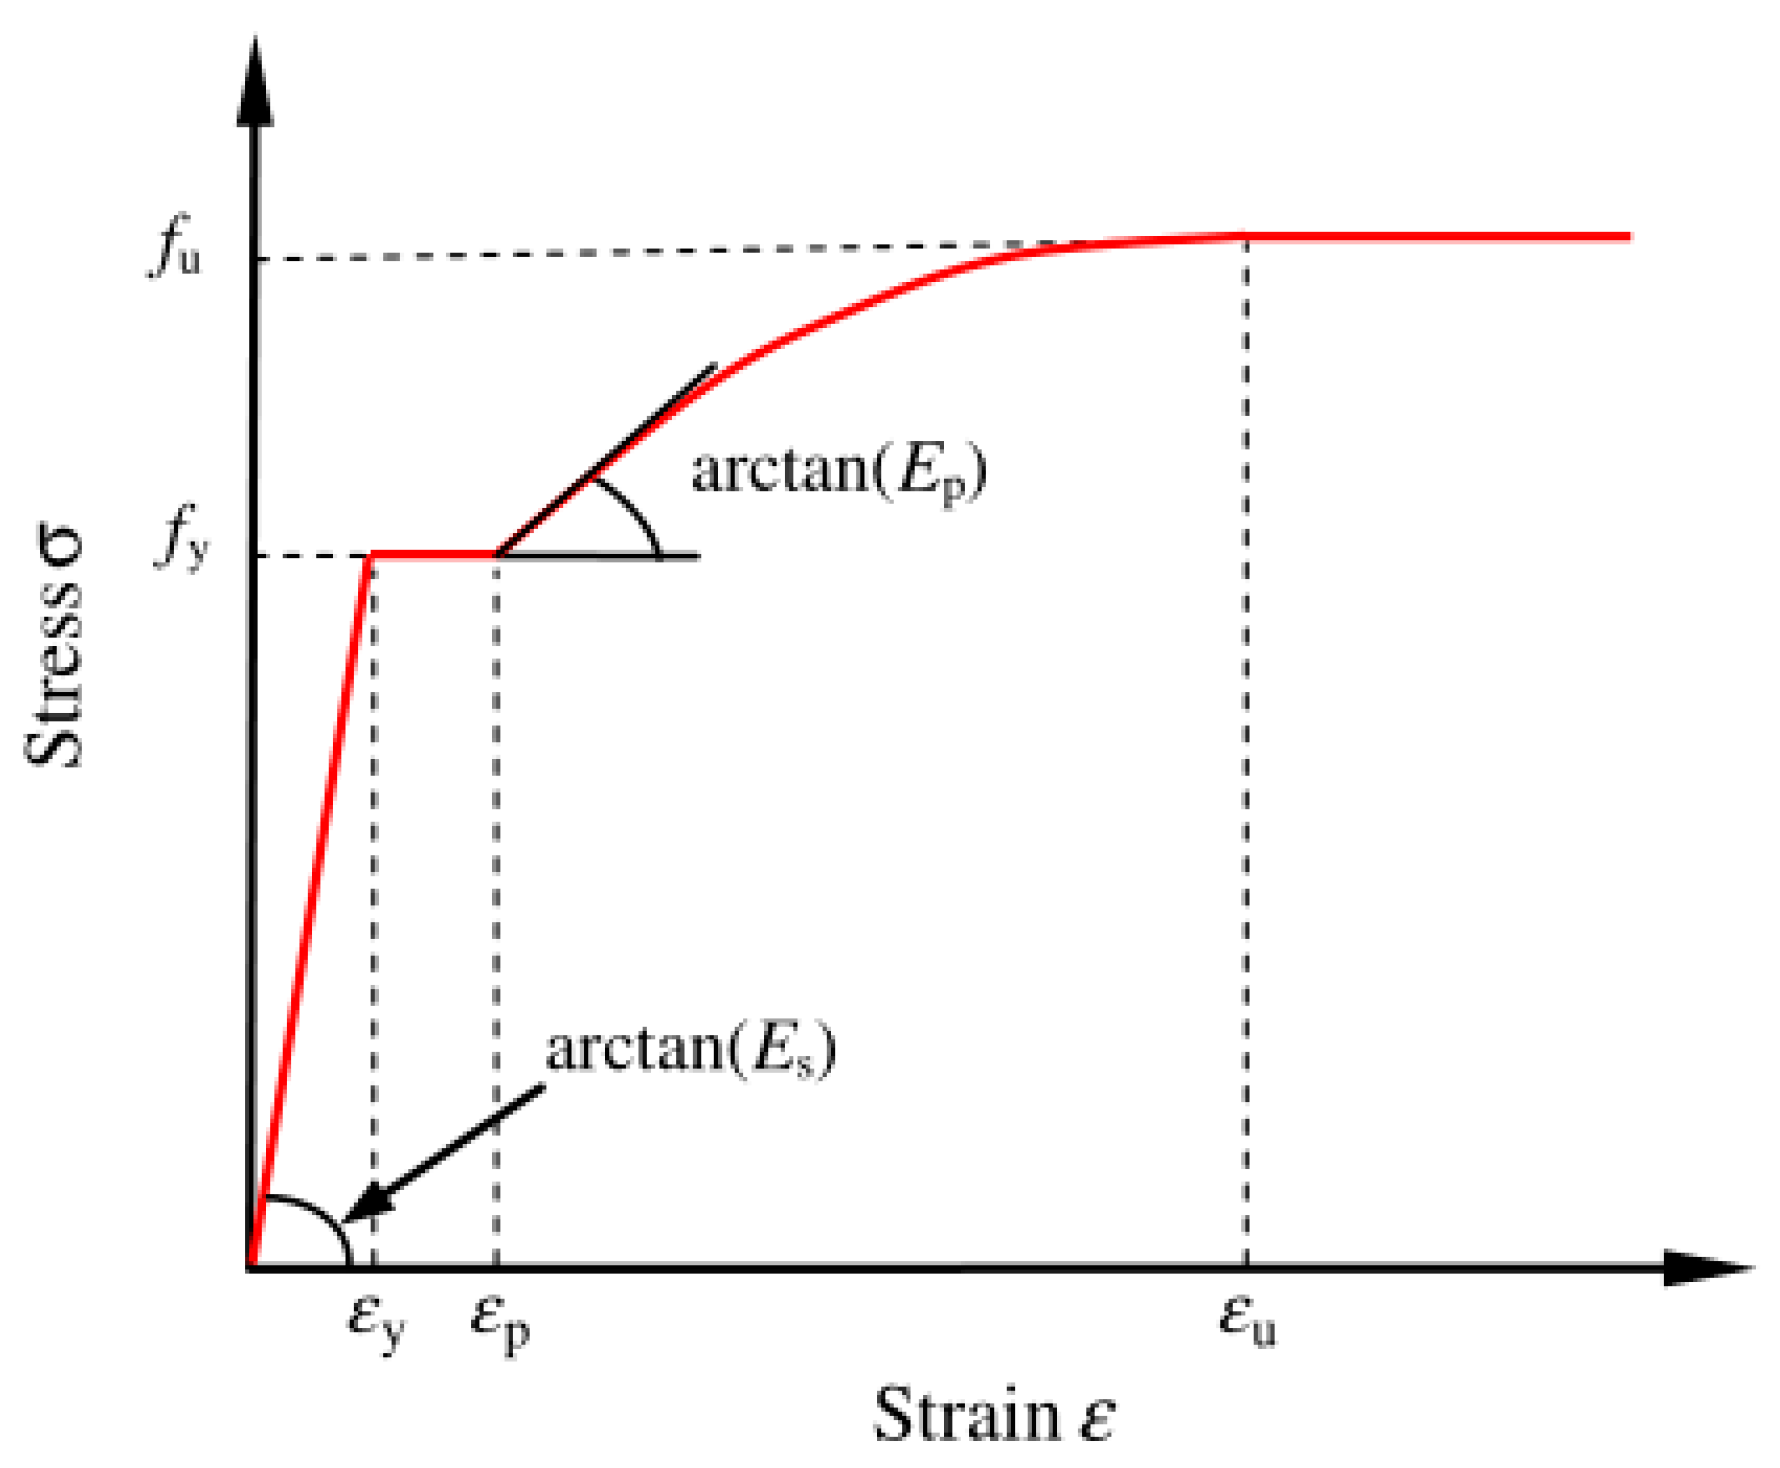
3.1.1. Steel
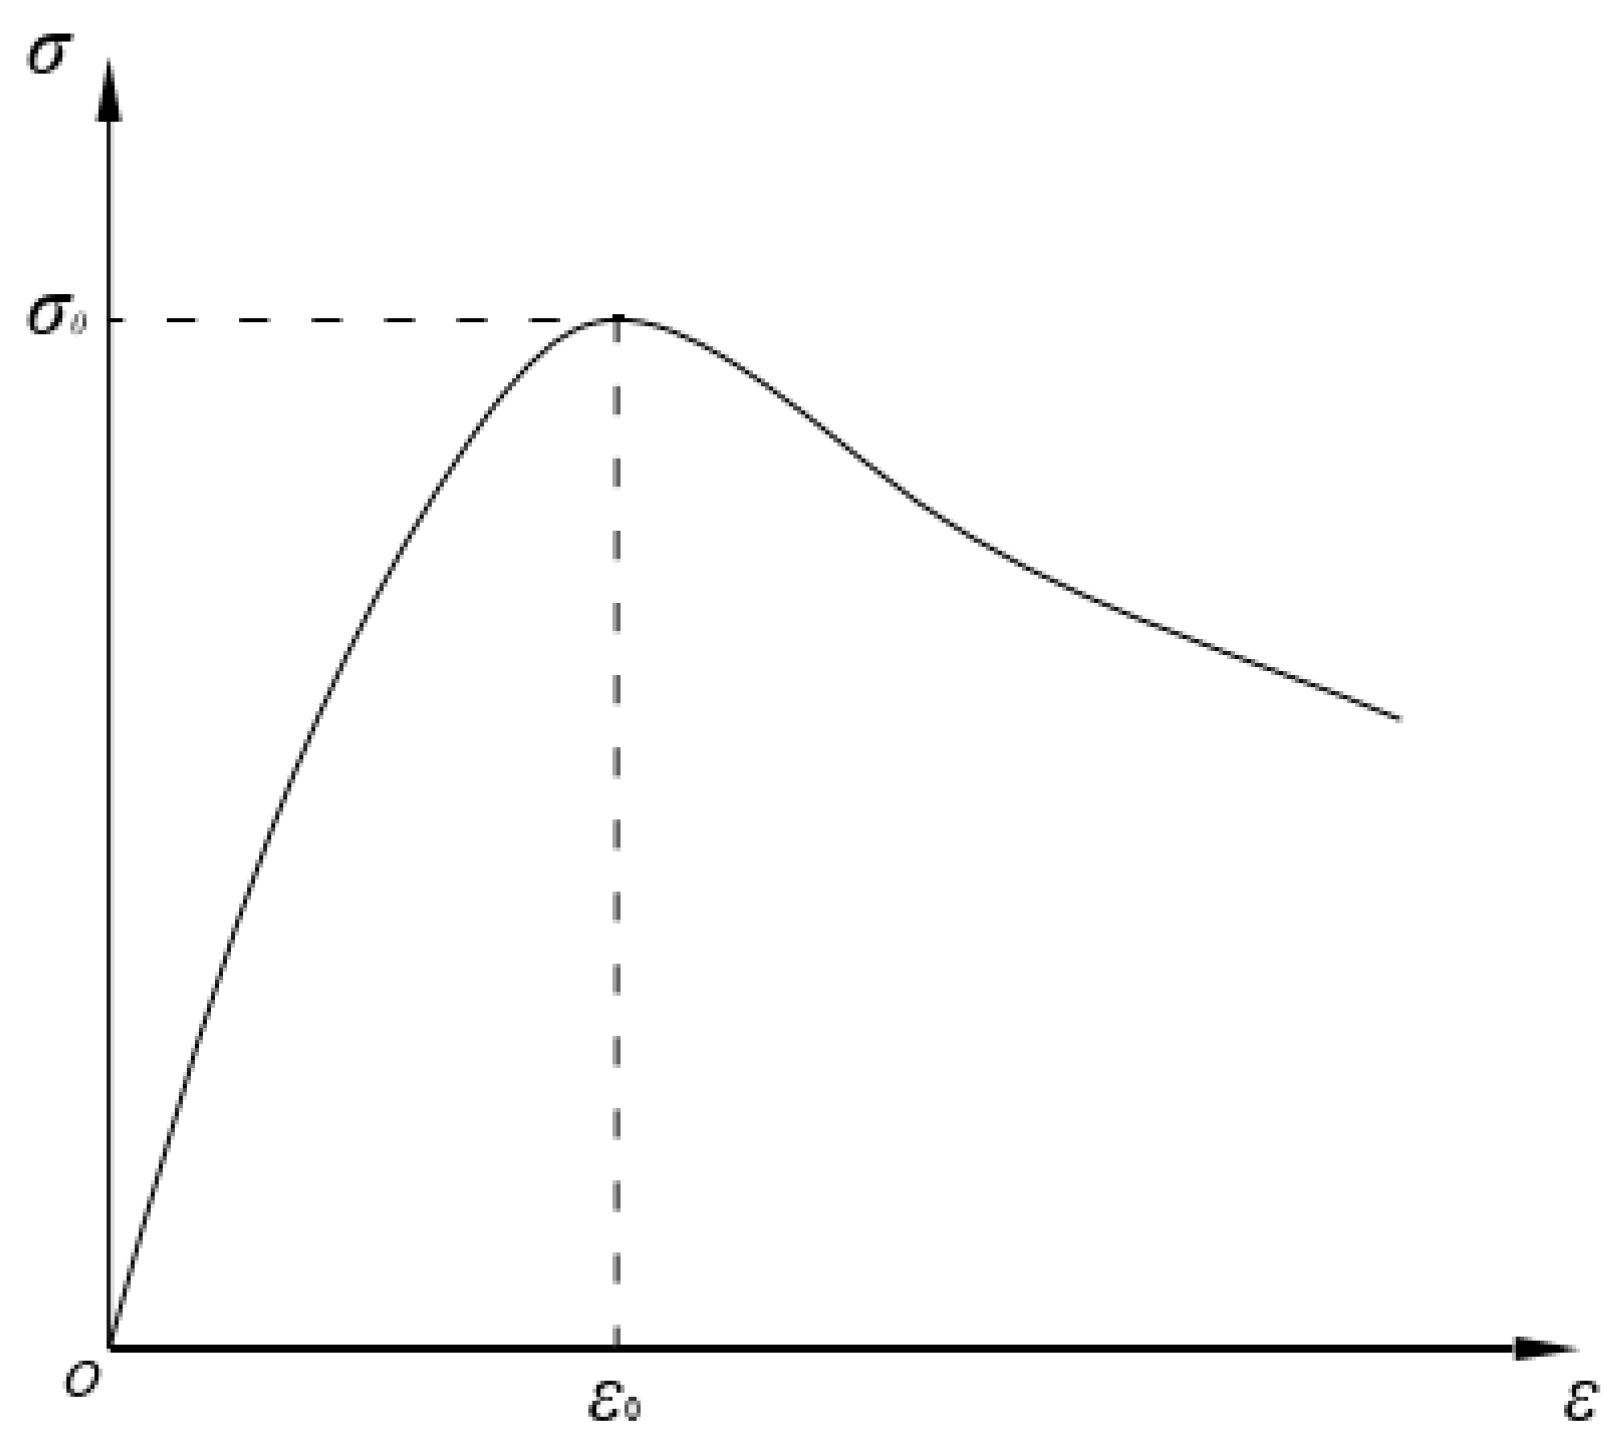
3.1.2. Concrete
3.2. Finite Element Model
3.2.1. Finite Element Type
- (1)
- It involves only displacement nodal DOFs and features an eight-node brick connectively. Thus, the transition problem between solid and shell elements can be eliminated.
- (2)
- Performs well in simulating steel tubes with a wide range of thicknesses.
- (3)
- Performs well for both flat-plate and curved shells.
3.2.2. Interface
3.2.3. Boundary Conditions and Load Application
3.2.4. Mesh
4. Model Verification
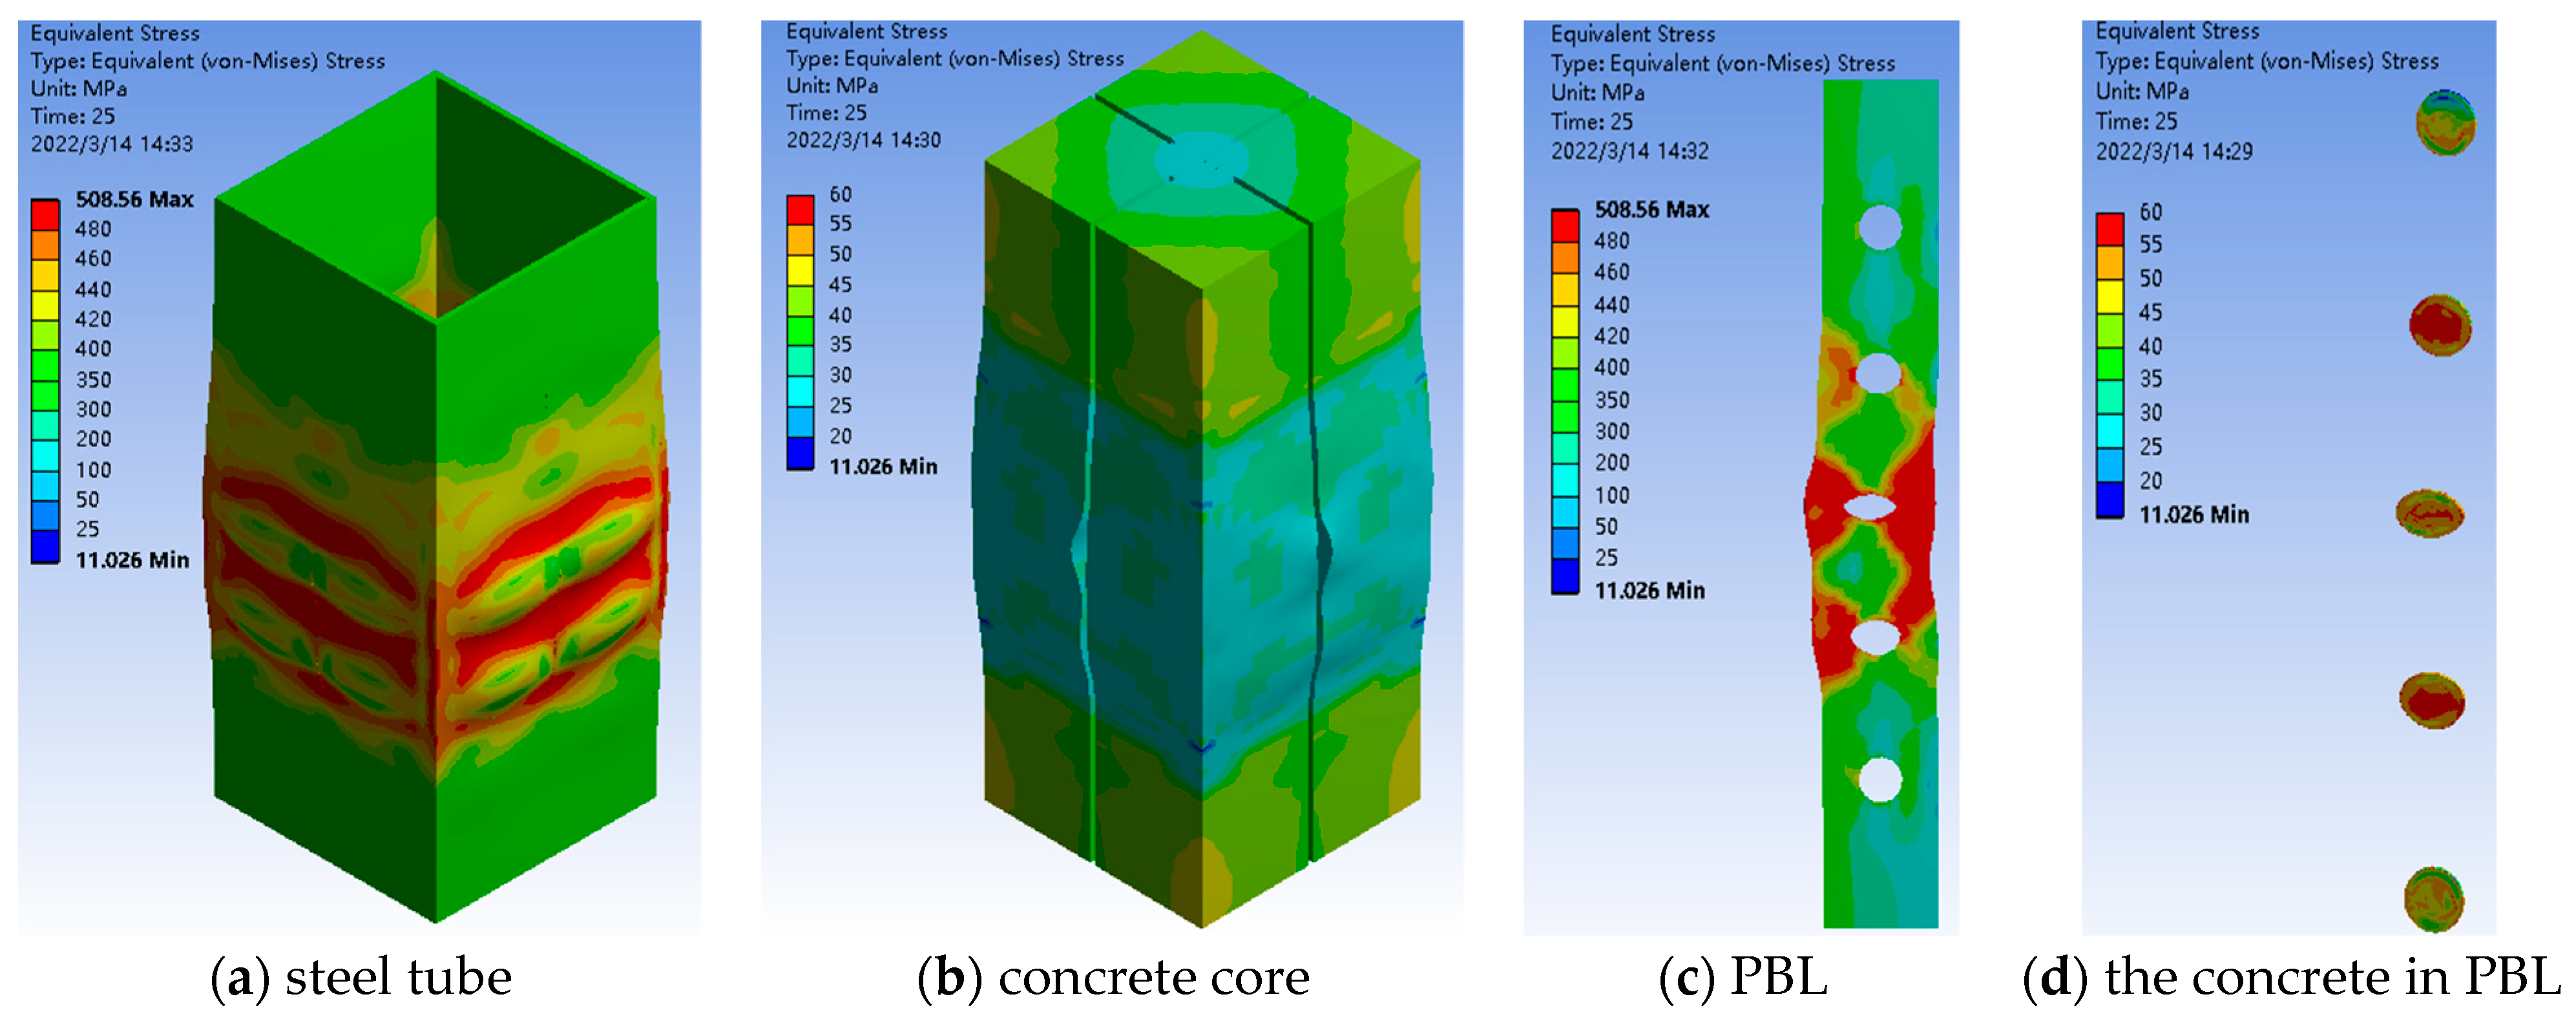
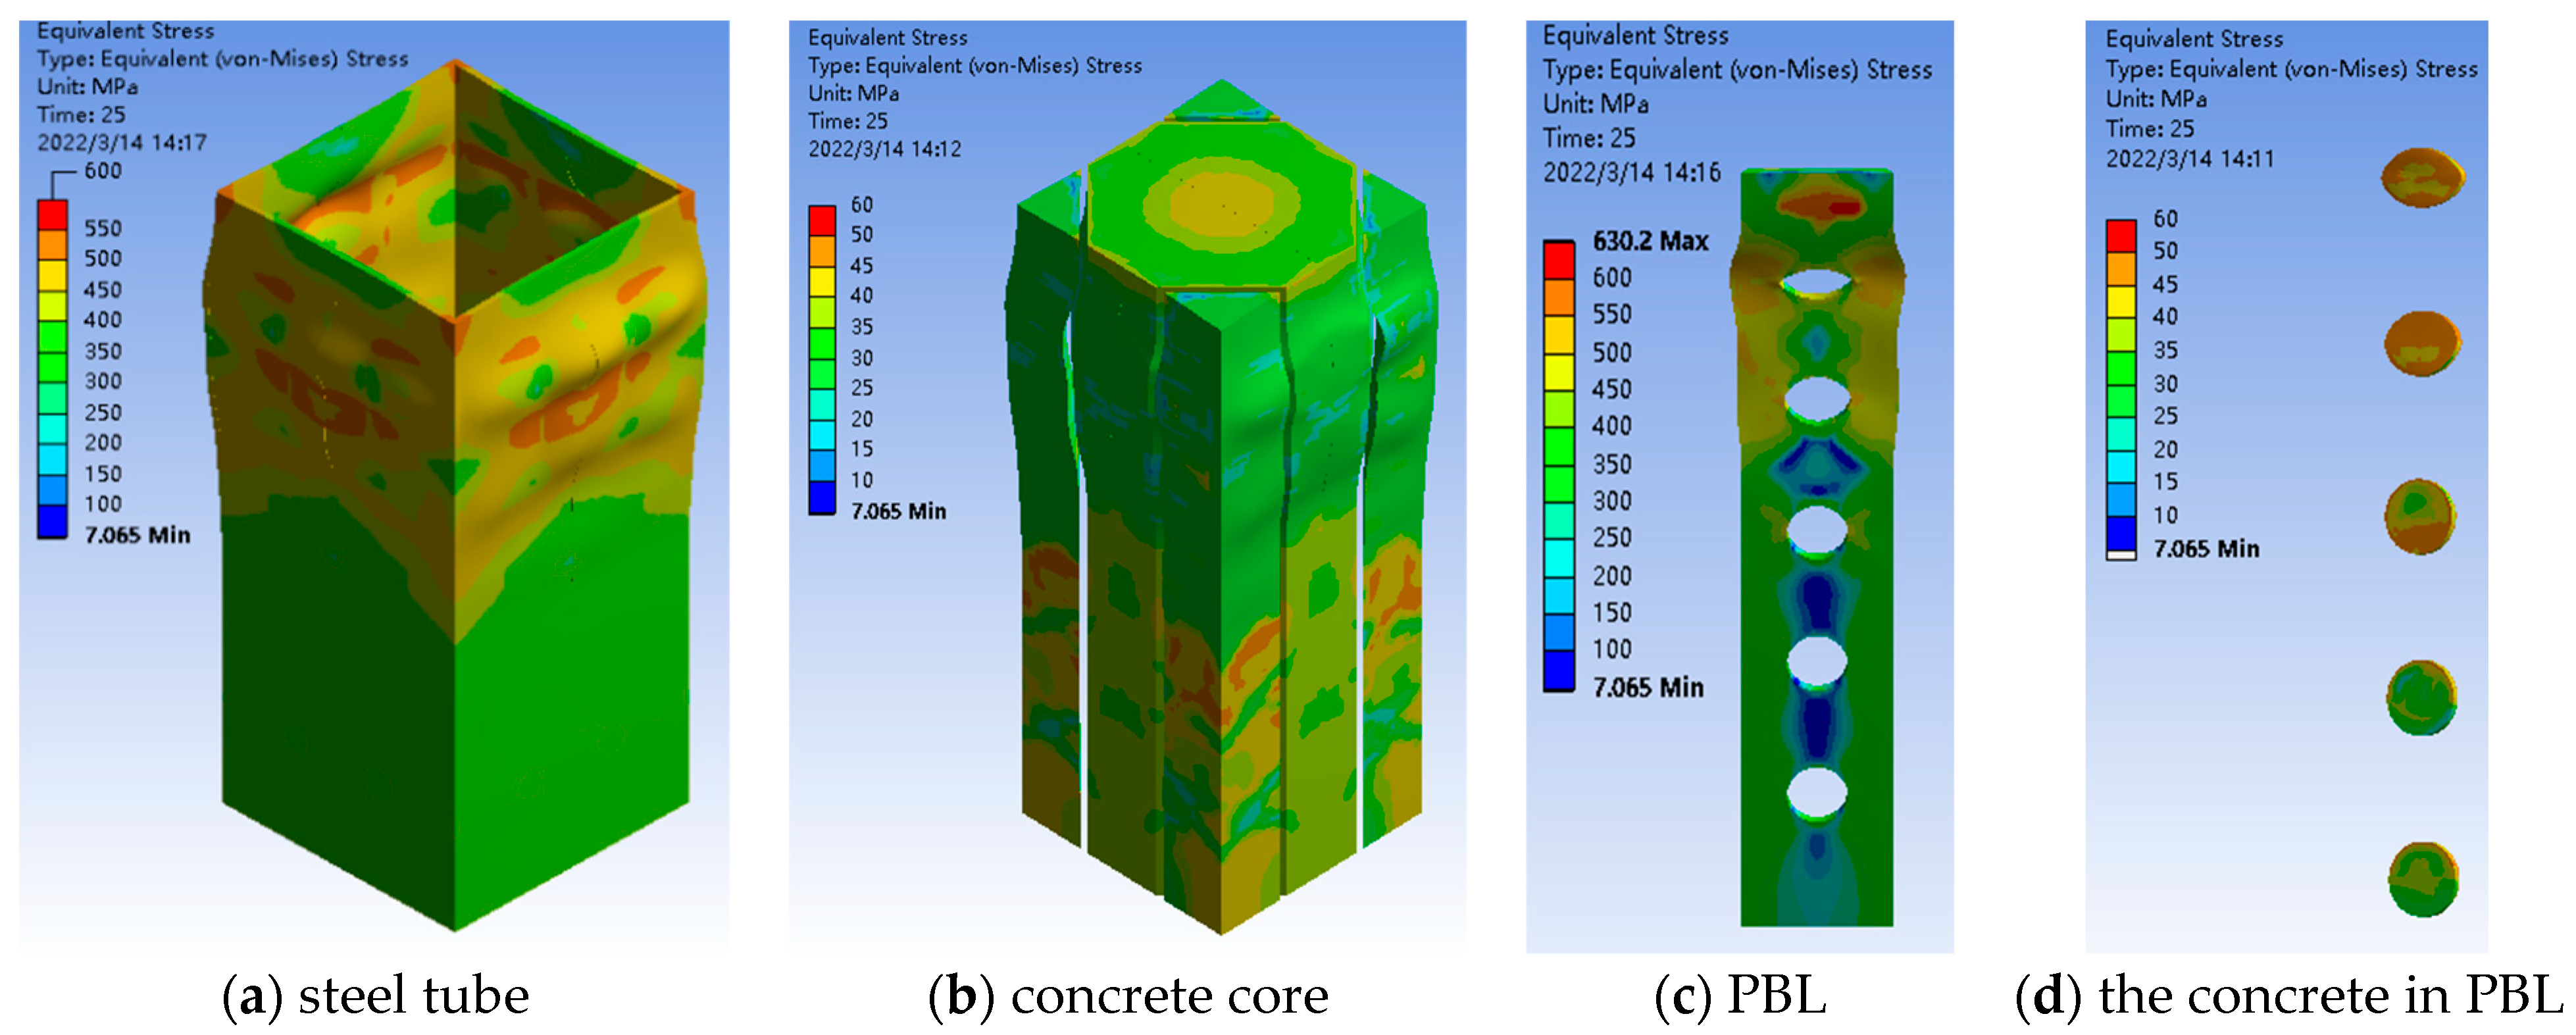
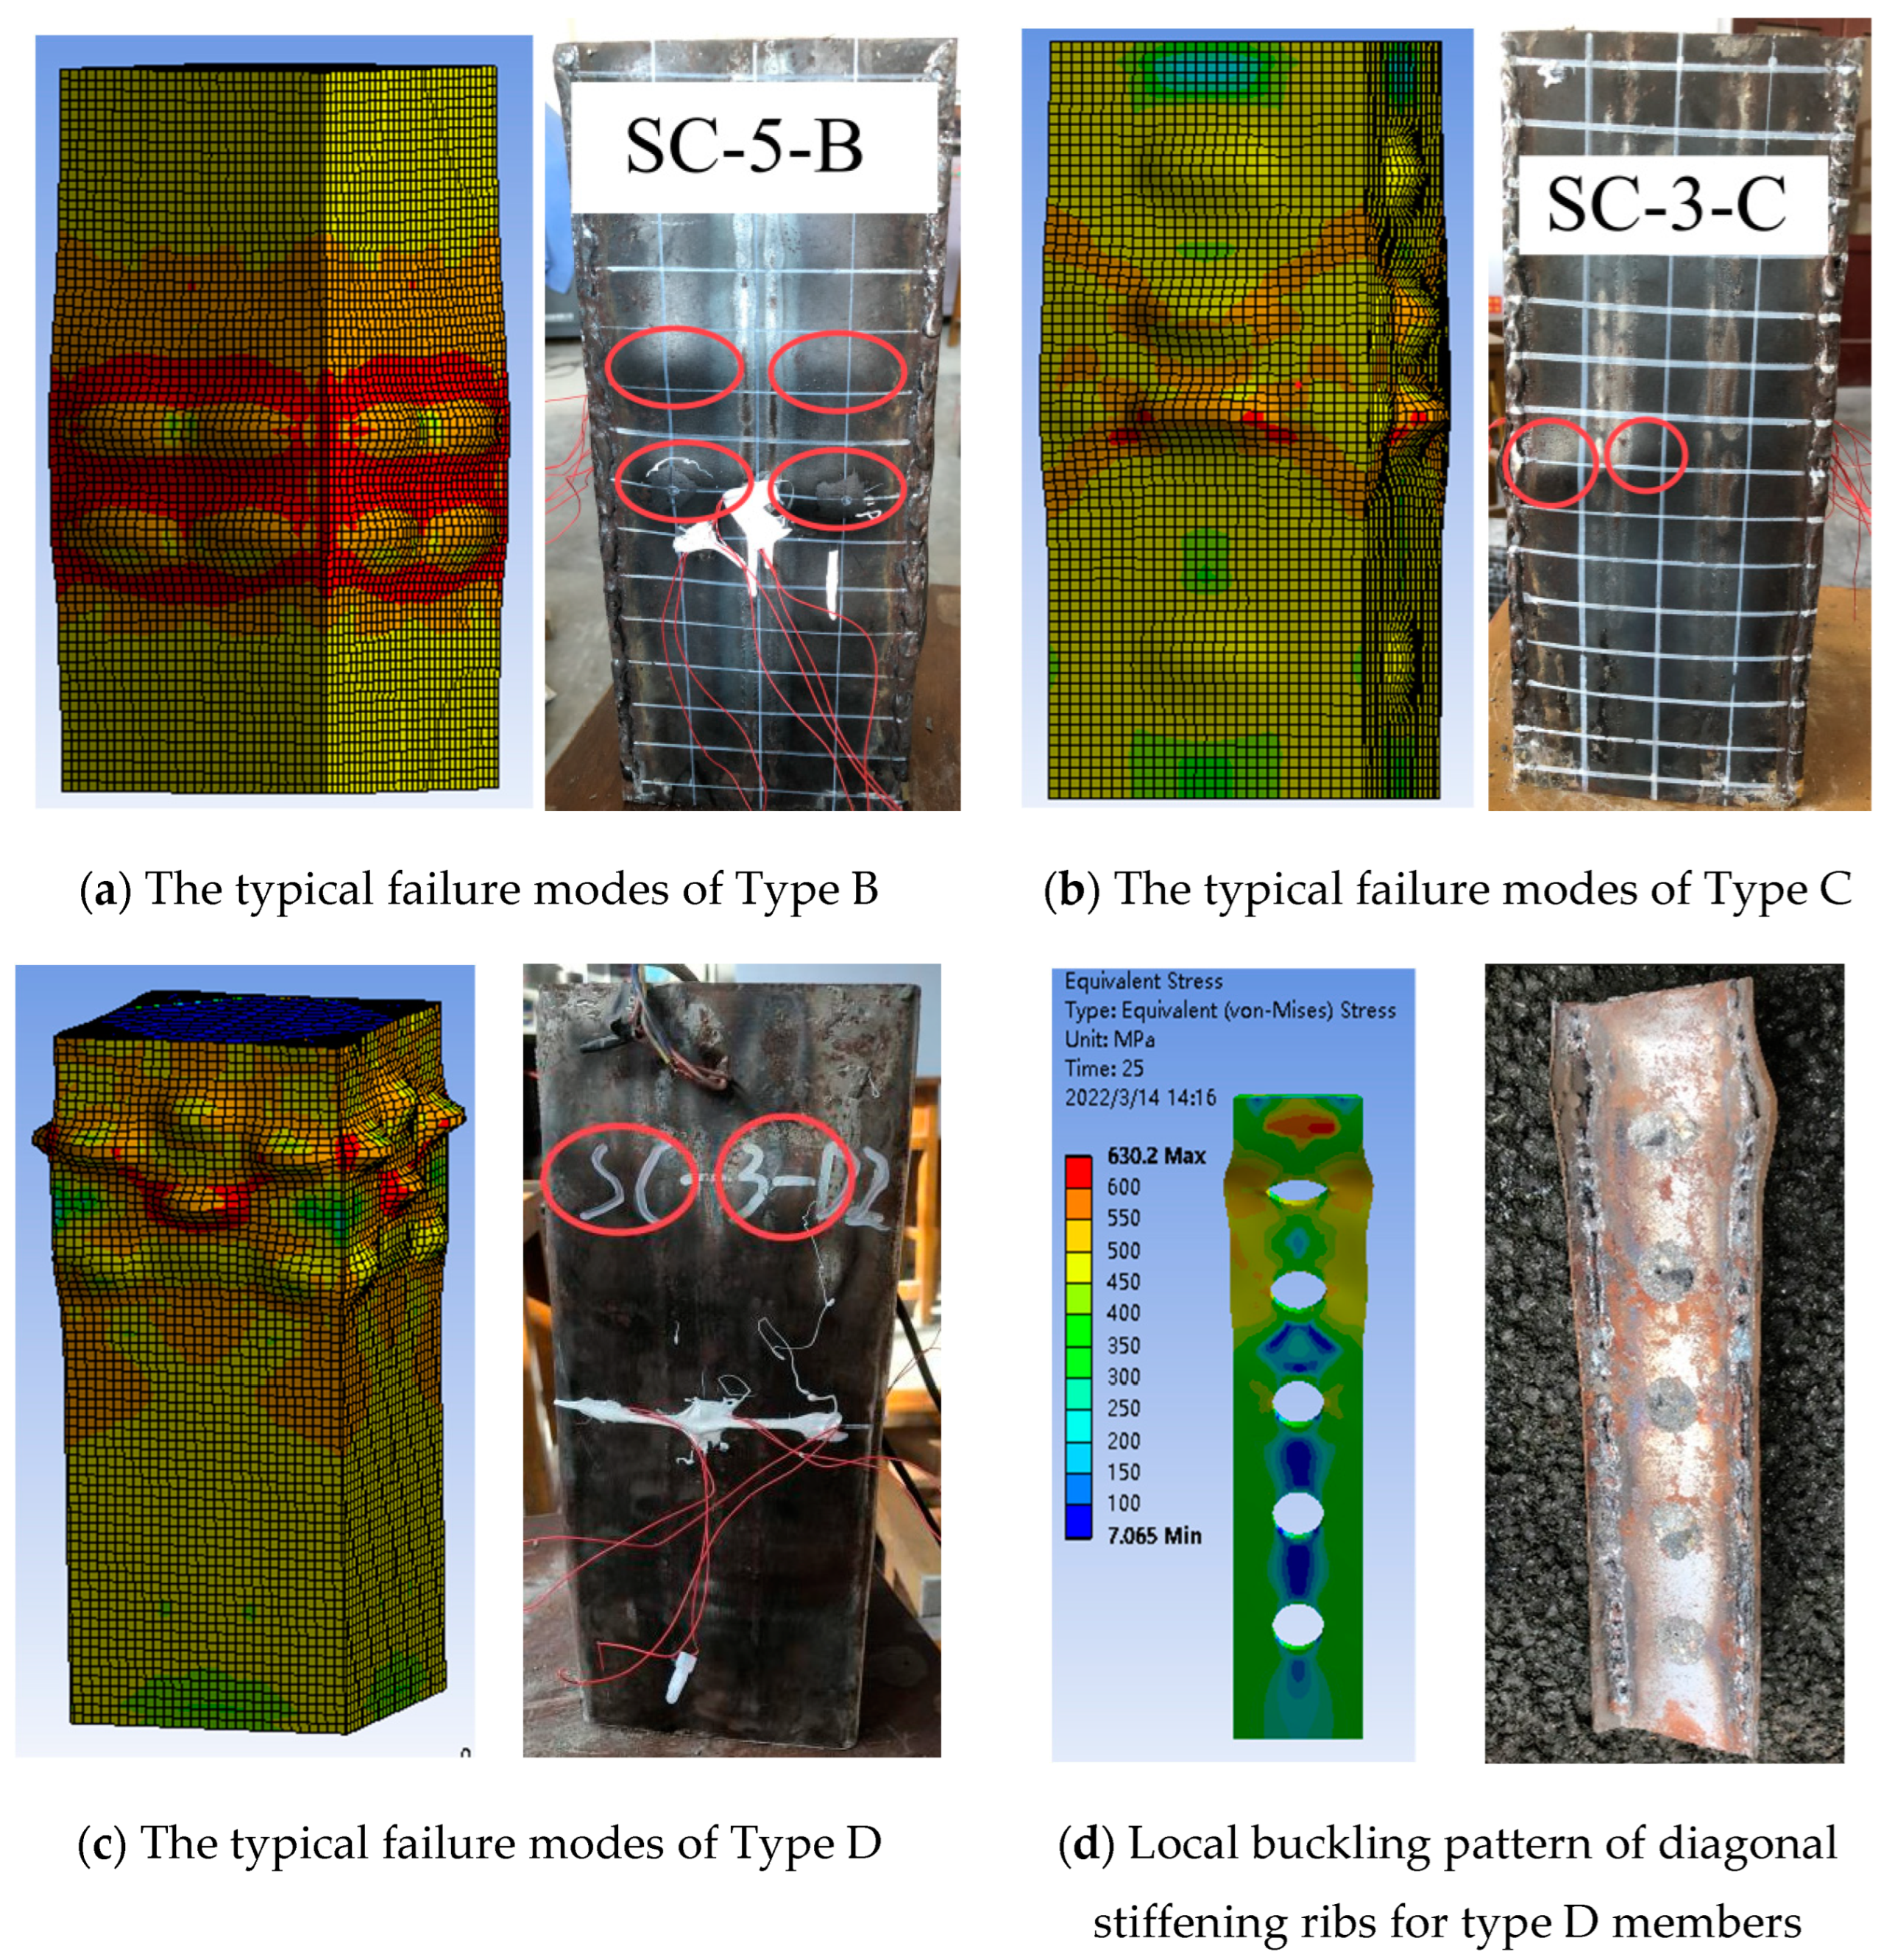
4.1. Typical Failure Modes
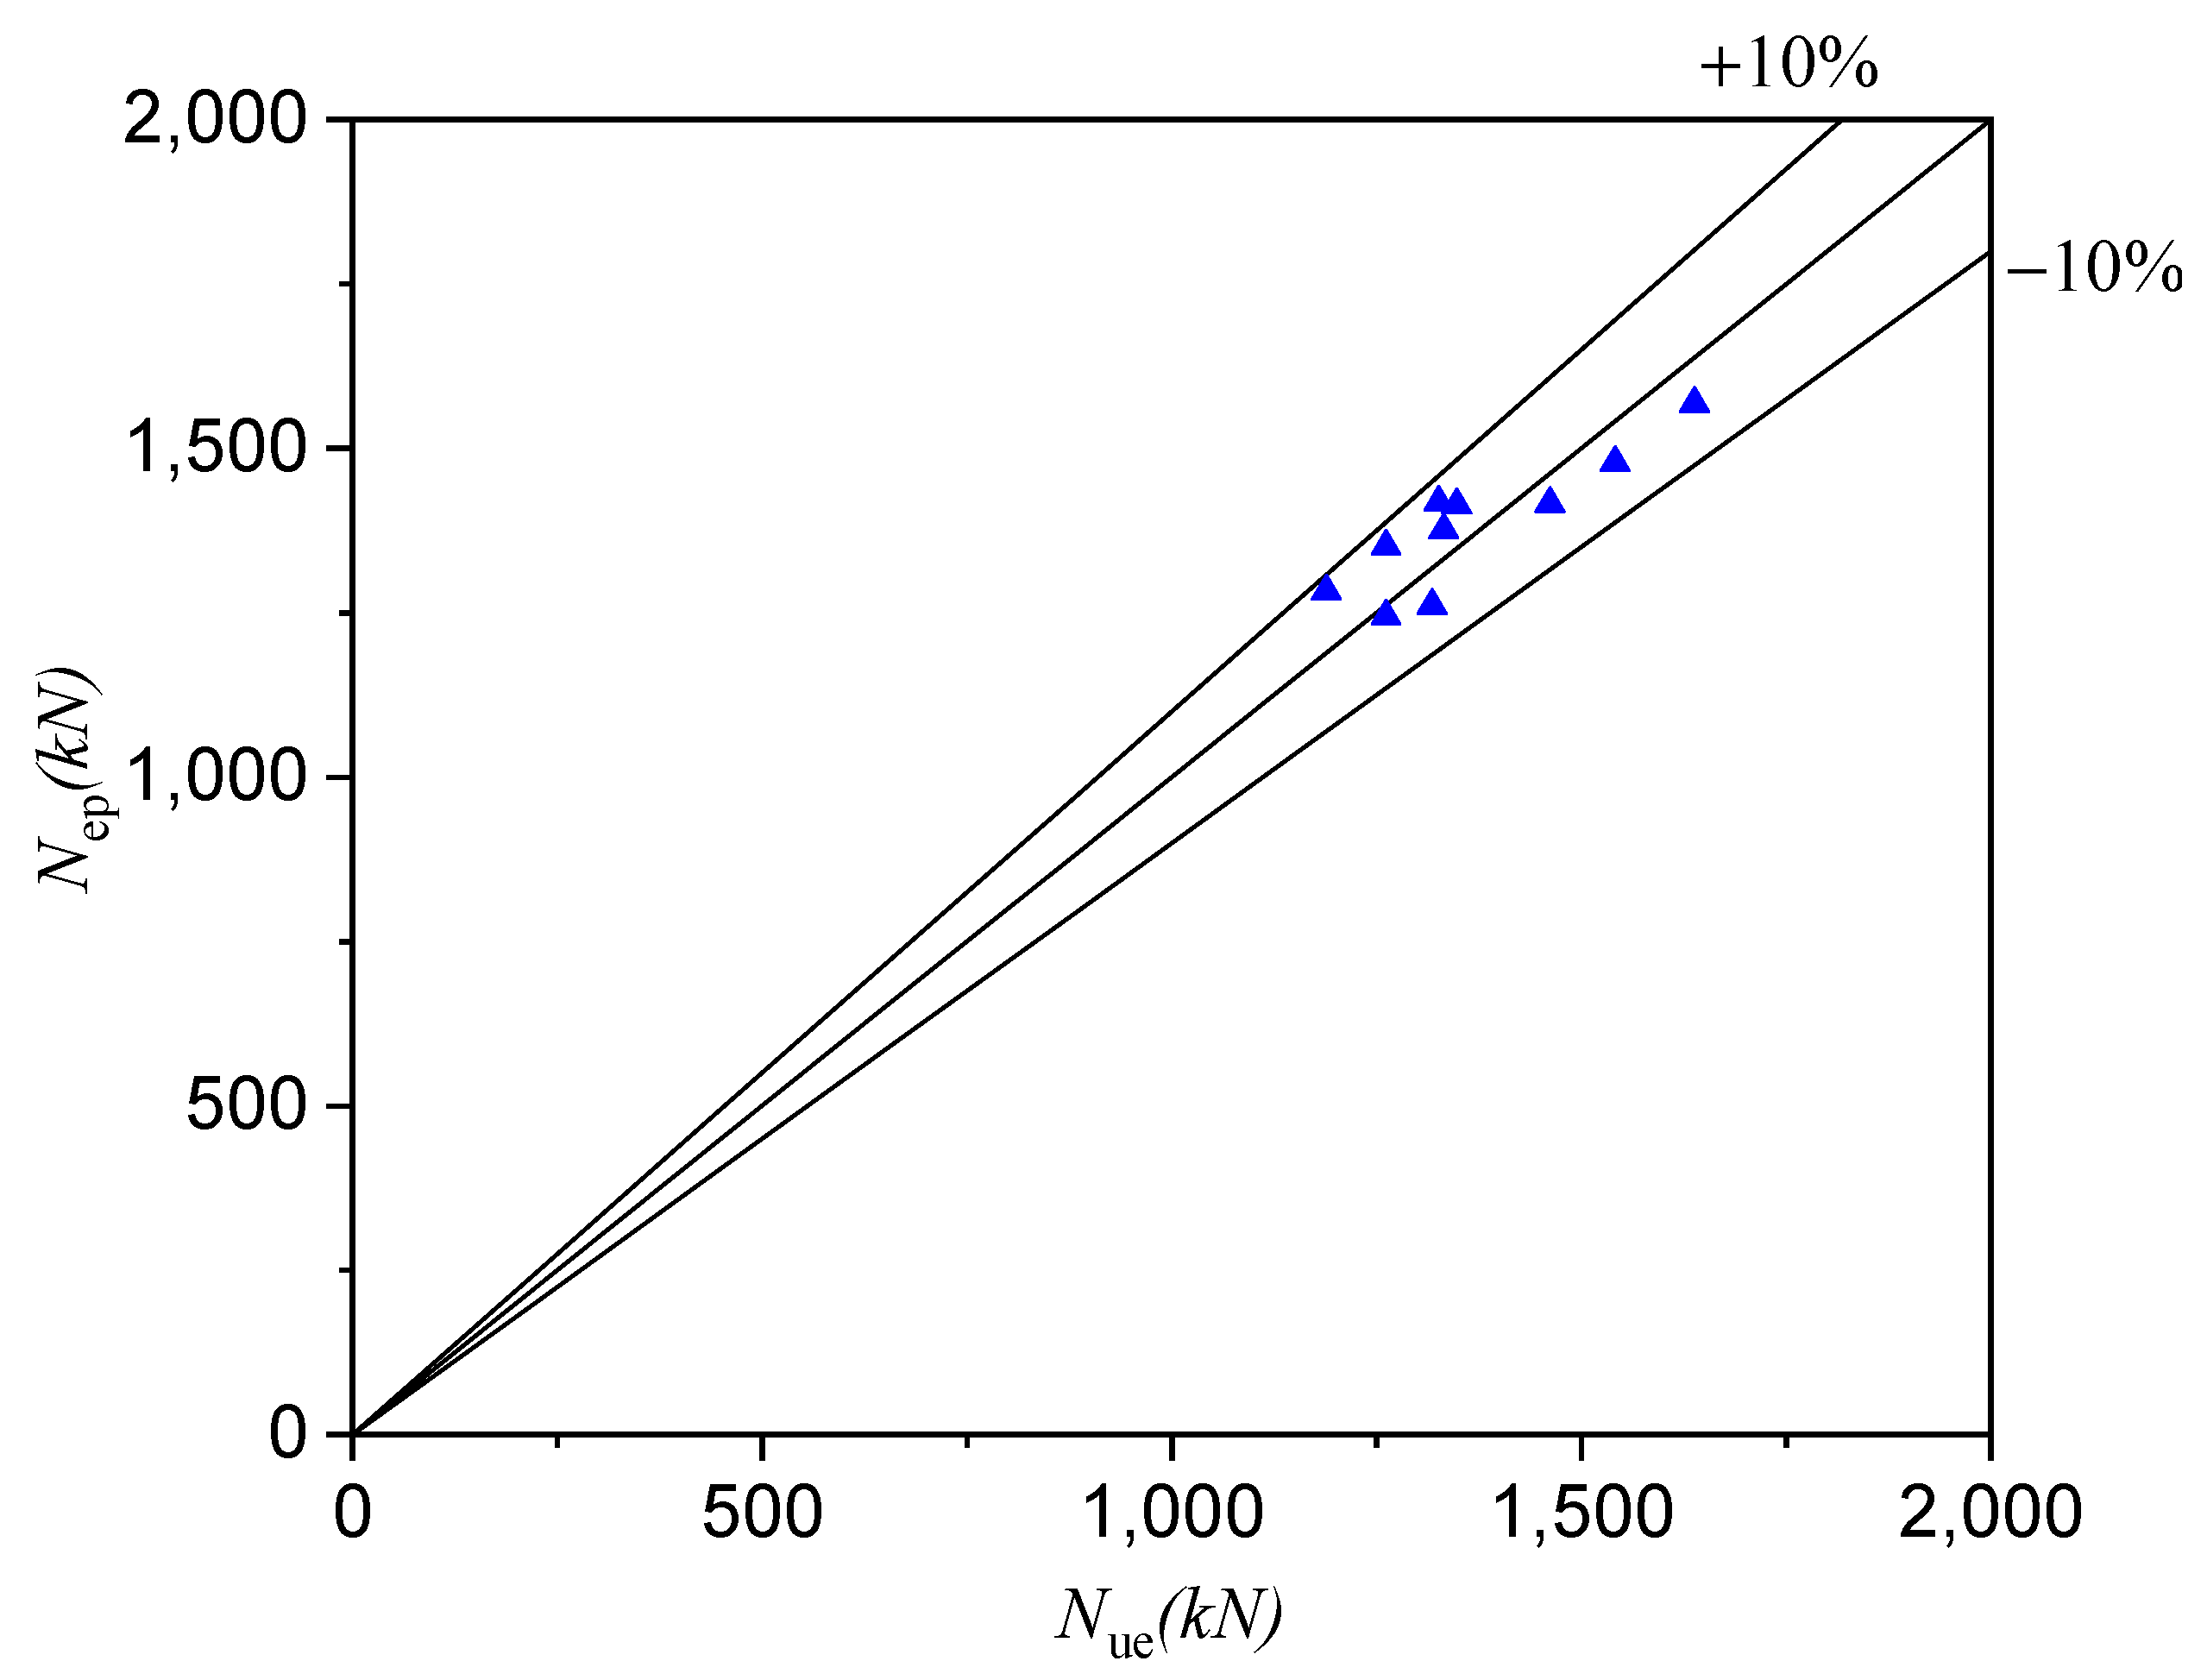
4.2. The Comparison of Test and FEA
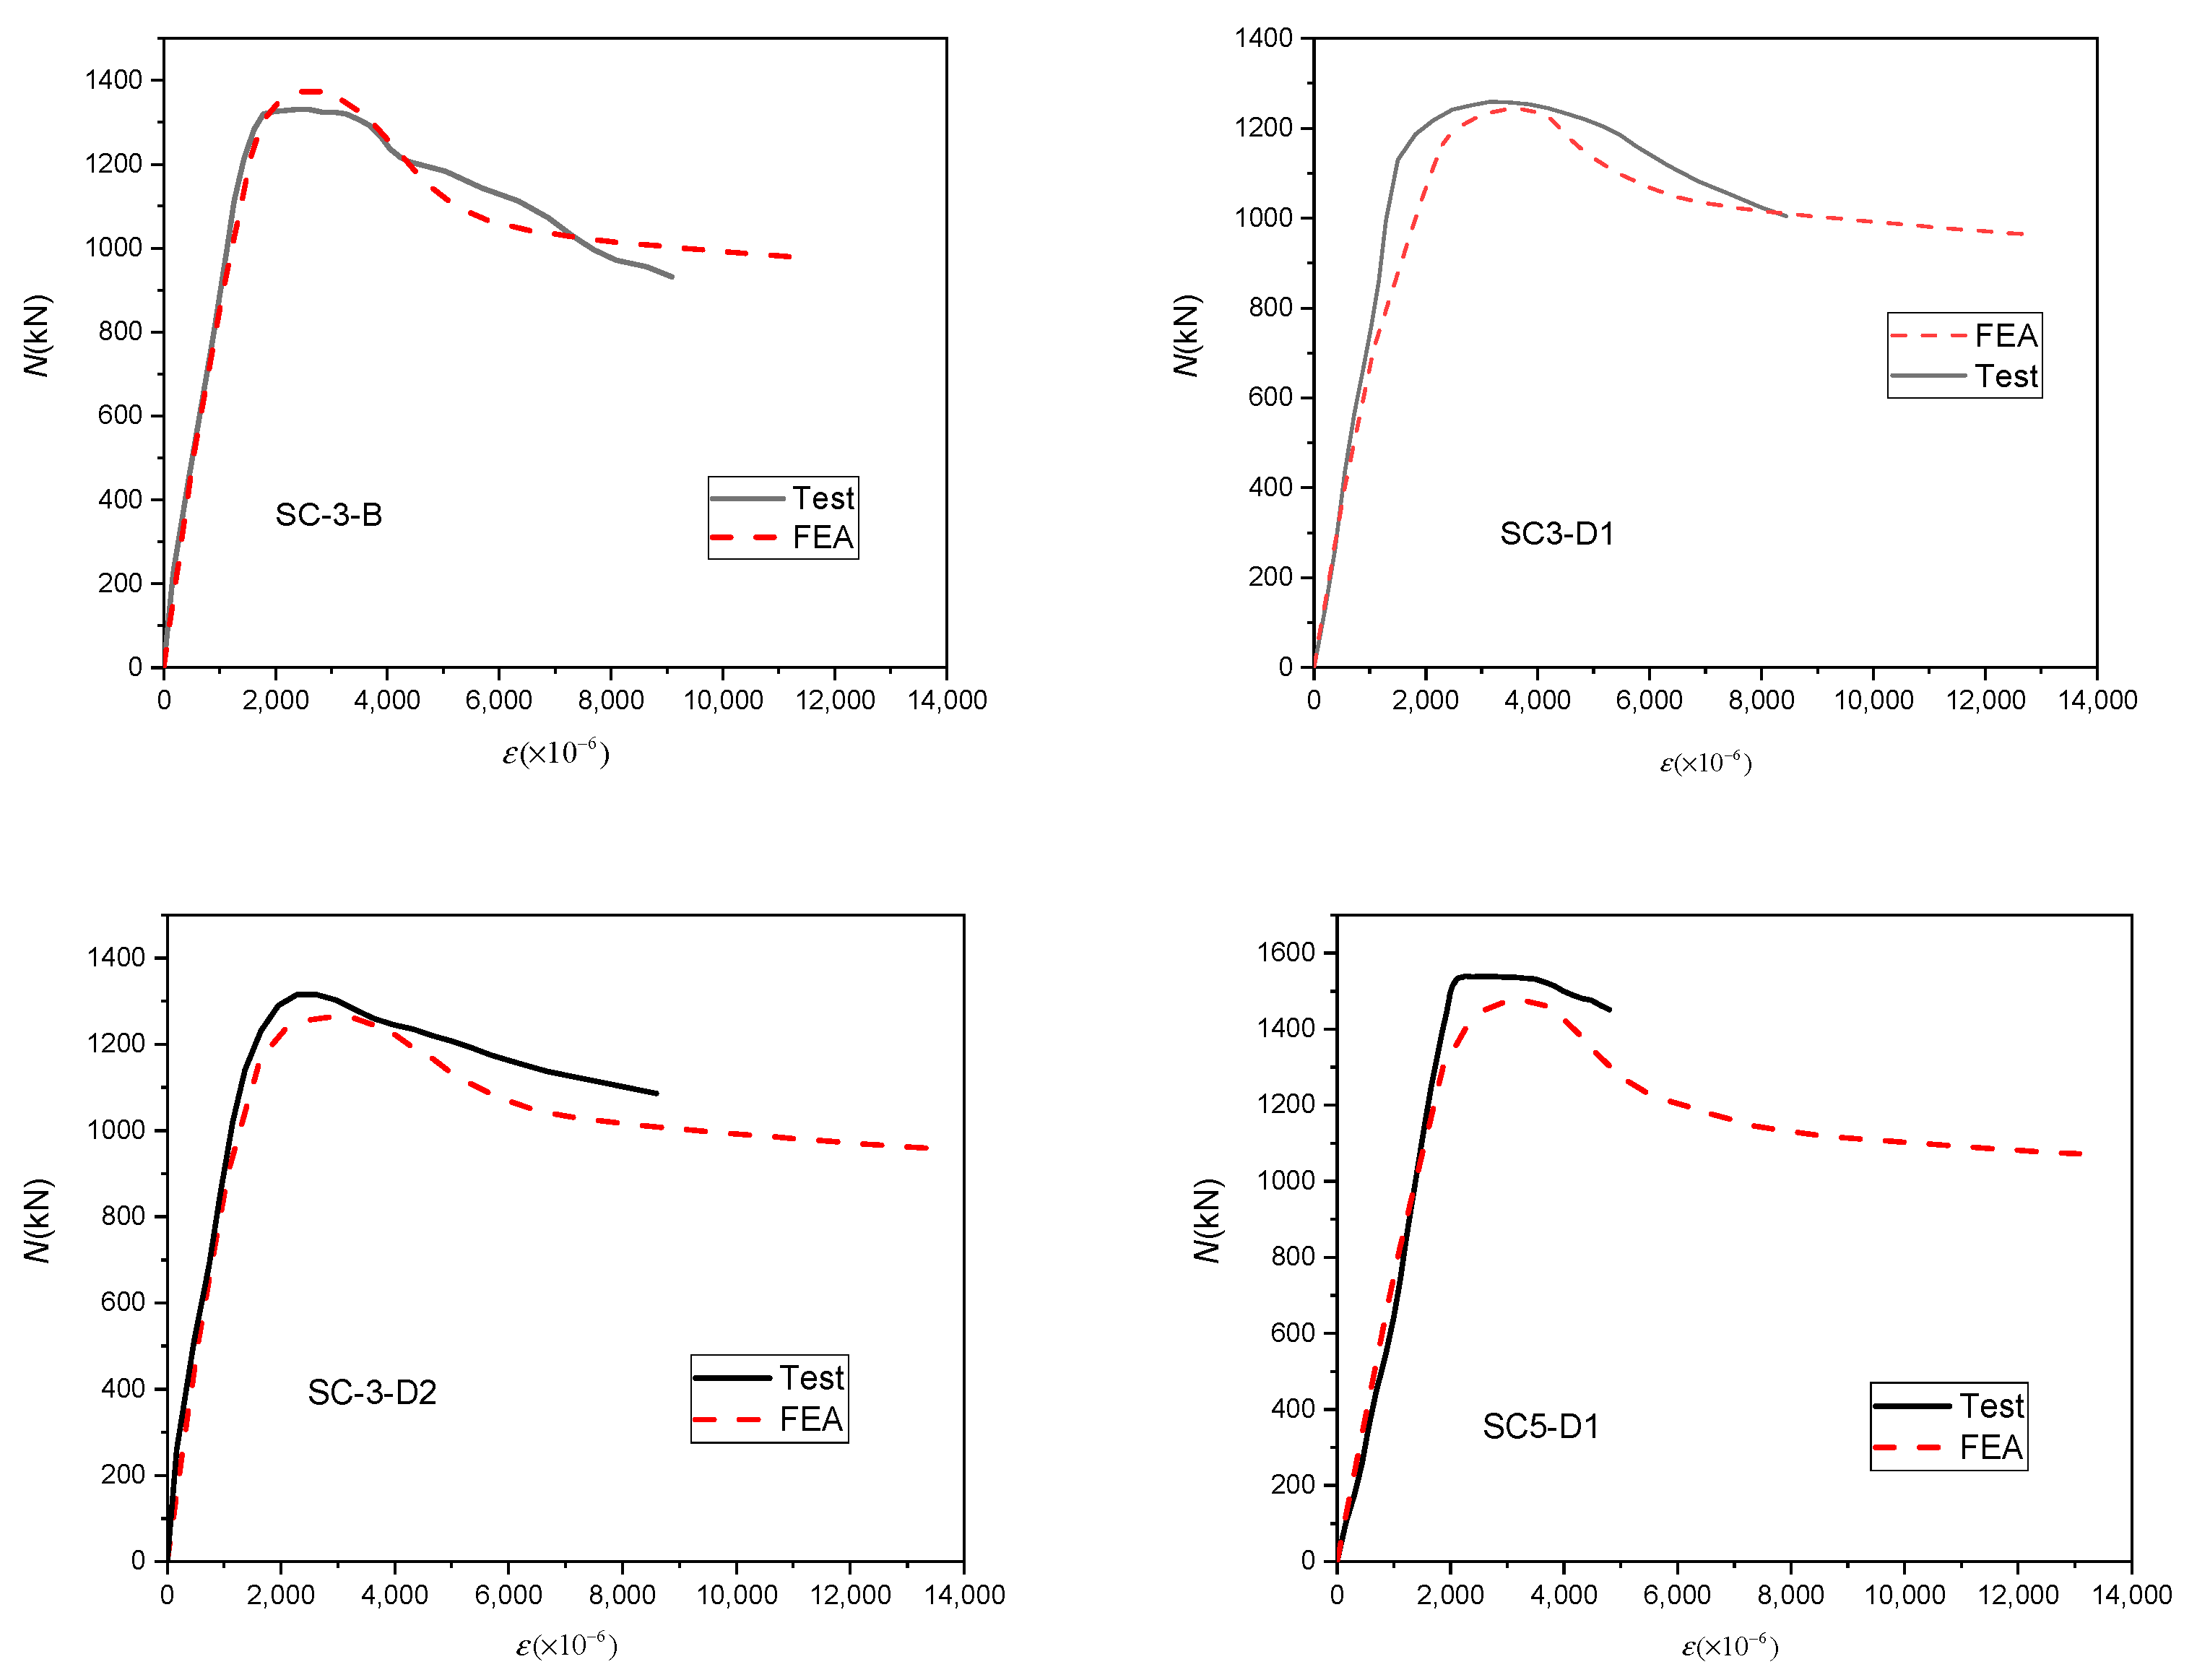
4.3. Axial Load–Strain Curves
5. Parametric Studies
5.1. Concrete Strength
5.2. Thickness and
5.3. Opening Diameter
5.4. Opening Spacing
6. Prediction of Bearing Capacity
6.1. Existing Design Codes
6.2. Zhang J G [8]
6.3. Zhou Z [11] and Gan D [12]
6.4. Guo J H, Diao Y [15]
6.5. This Paper
6.6. Comparison and Recommendation
7. Conclusions
- The FEA model could predict the tested specimens’ failure modes, ultimate strength, and strain development with satisfactory accuracy. The mean ratio of was 1.013, and the standard deviation was 0.049.
- The ultimate strength of specimens in Type A, B, C, D1, and D2 increased linearly as increased. The values of ultimate strength of Type A, B, and C were generally more significant than that of Type D1 and Type D2 as stiffener thickness was small ( = 2.75 mm), but the ultimate strengths of Type D1 and D2 were bigger than Type A, B, and C as the stiffener thickness increased ( = 4.75 mm).
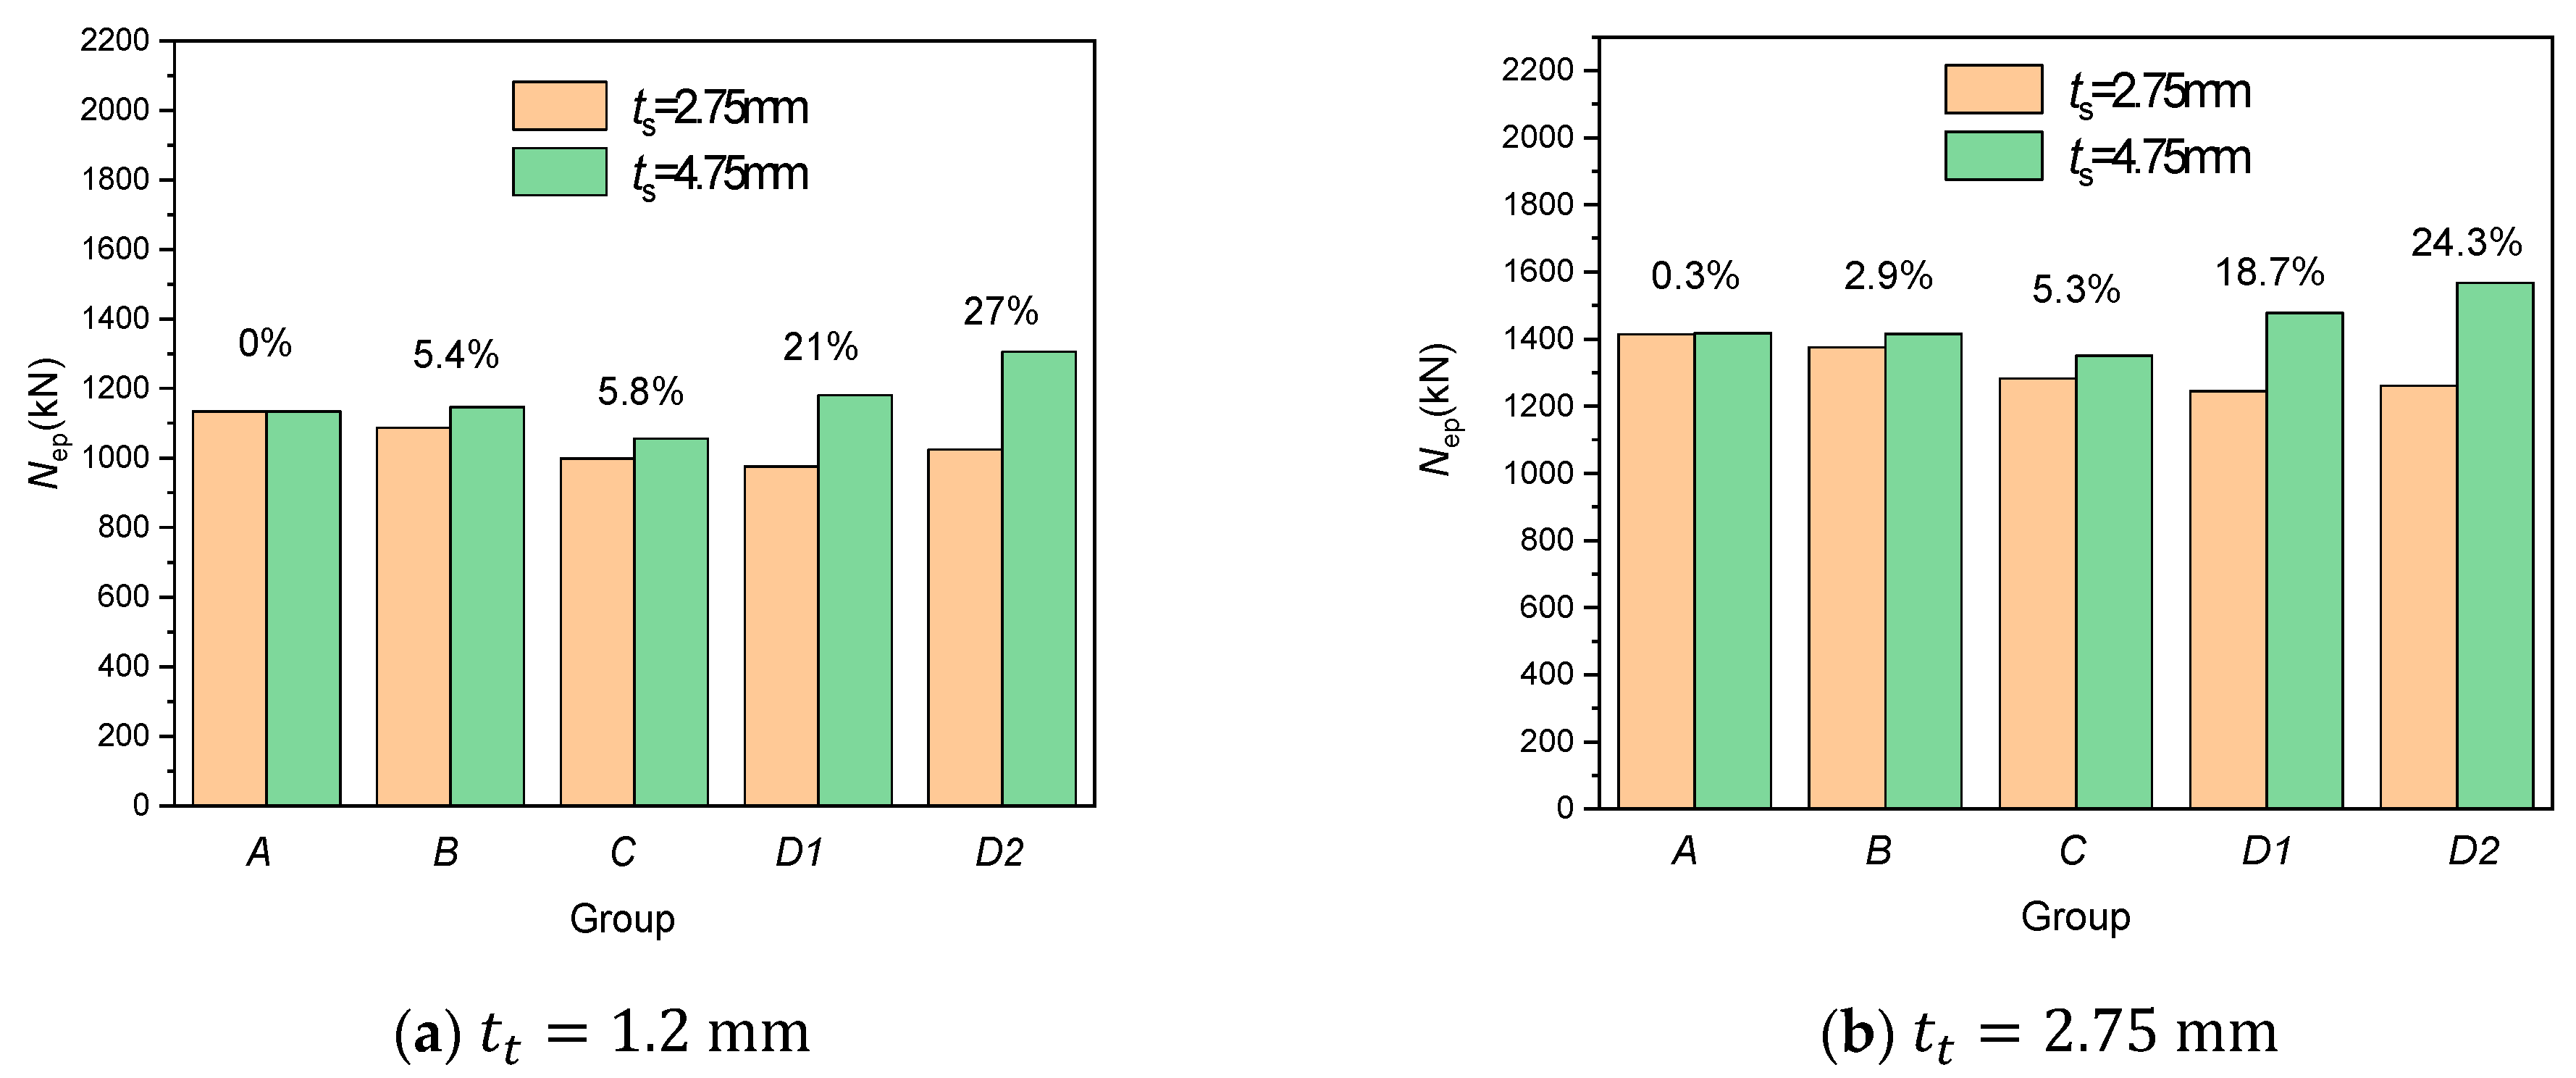
- The effects of the thickness of steel tube on the ultimate strength of CFST with different stiffeners were all significant. As increased and remained unchanged, the ultimate strength of CFST columns with longitudinal and diagonal stiffeners increased significantly. The effects of the thickness of stiffener on the ultimate strength of CFST with diagonal stiffeners were significant but insignificant for CFST with longitudinal stiffeners.
- The ultimate strength of CFST columns decreased as the opening diameter d increased. The ultimate strength differences in the specimens with d smaller than 0.4 bs were 5.0%. So, it was proposed that the opening diameter d was within the ranges of 0.2–0.4 times the width of stiffeners (i.e., d = 0.2–0.4 bs) for both longitudinal and diagonal stiffeners.
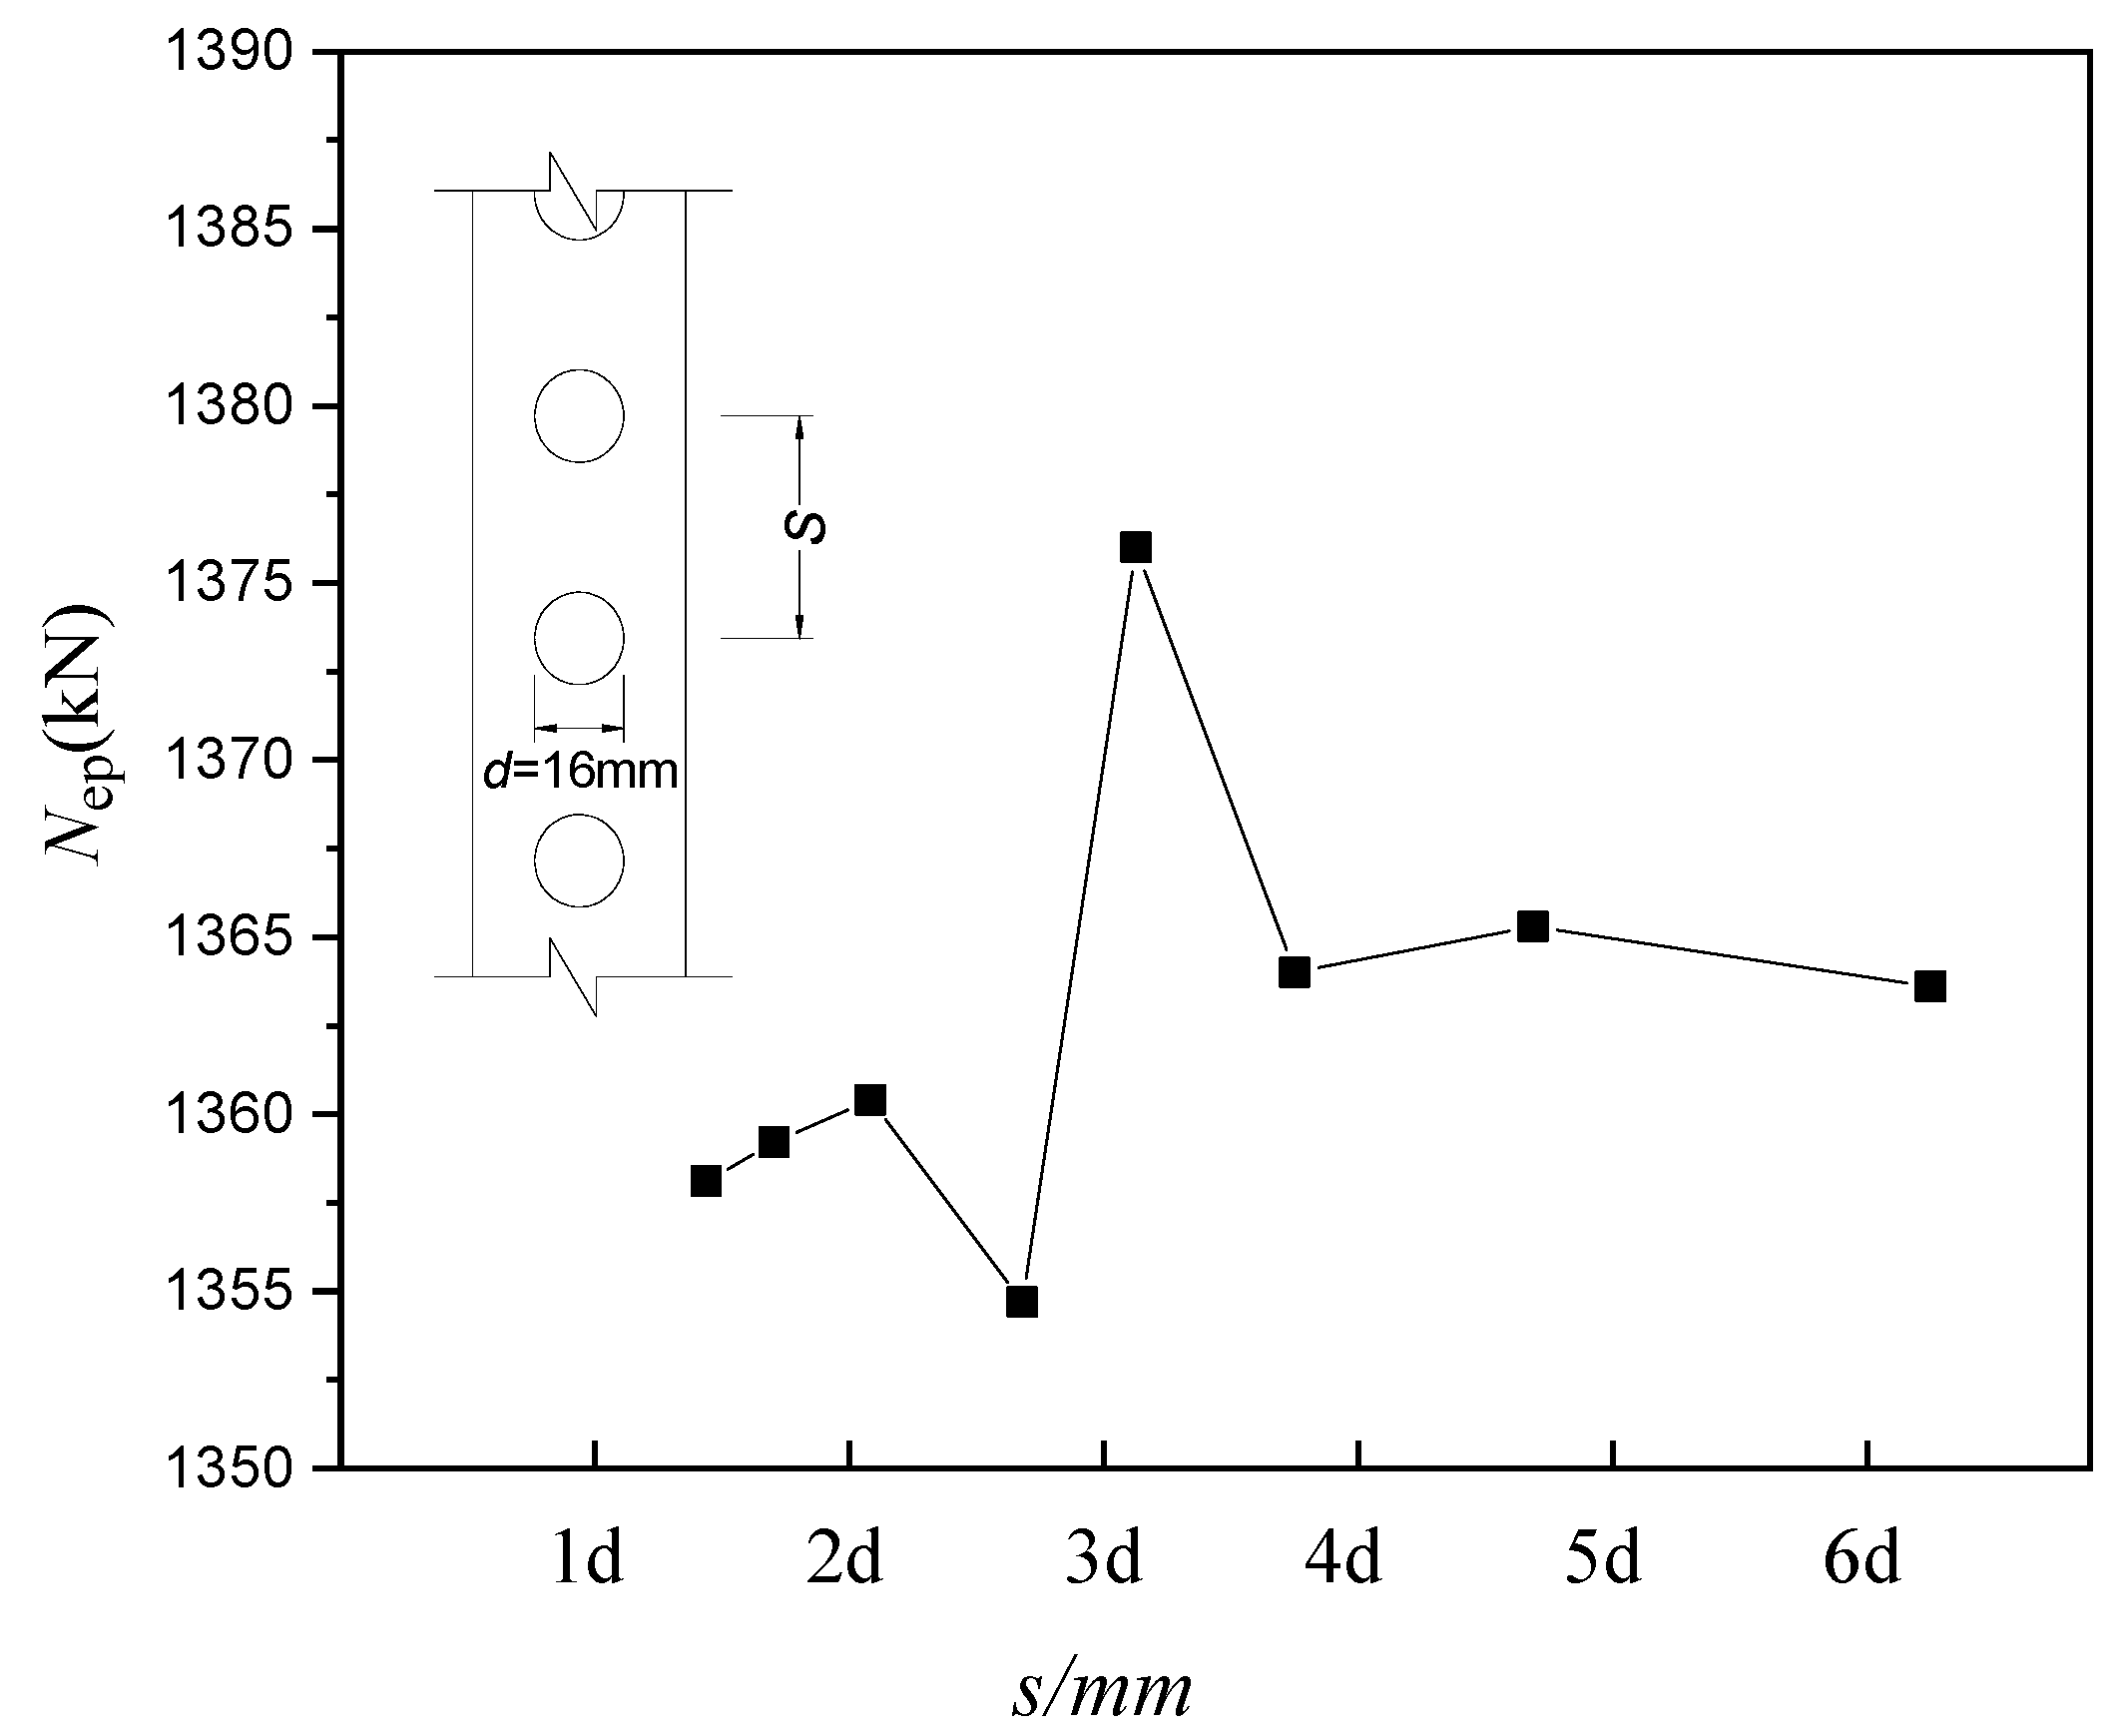
- The effect of opening spacing on ultimate strength is not significant. The stress fields from the concrete dowels would overlap as the opening spacing reduces, resulting in highly stressed regions and a decrease in strength. It is proposed that the opening spacing of PBL diagonal ribs should be at least 2.25 times the opening diameter (i.e., ), and the opening spacing of PBL longitudinal ribs should be at least three times the opening diameter.
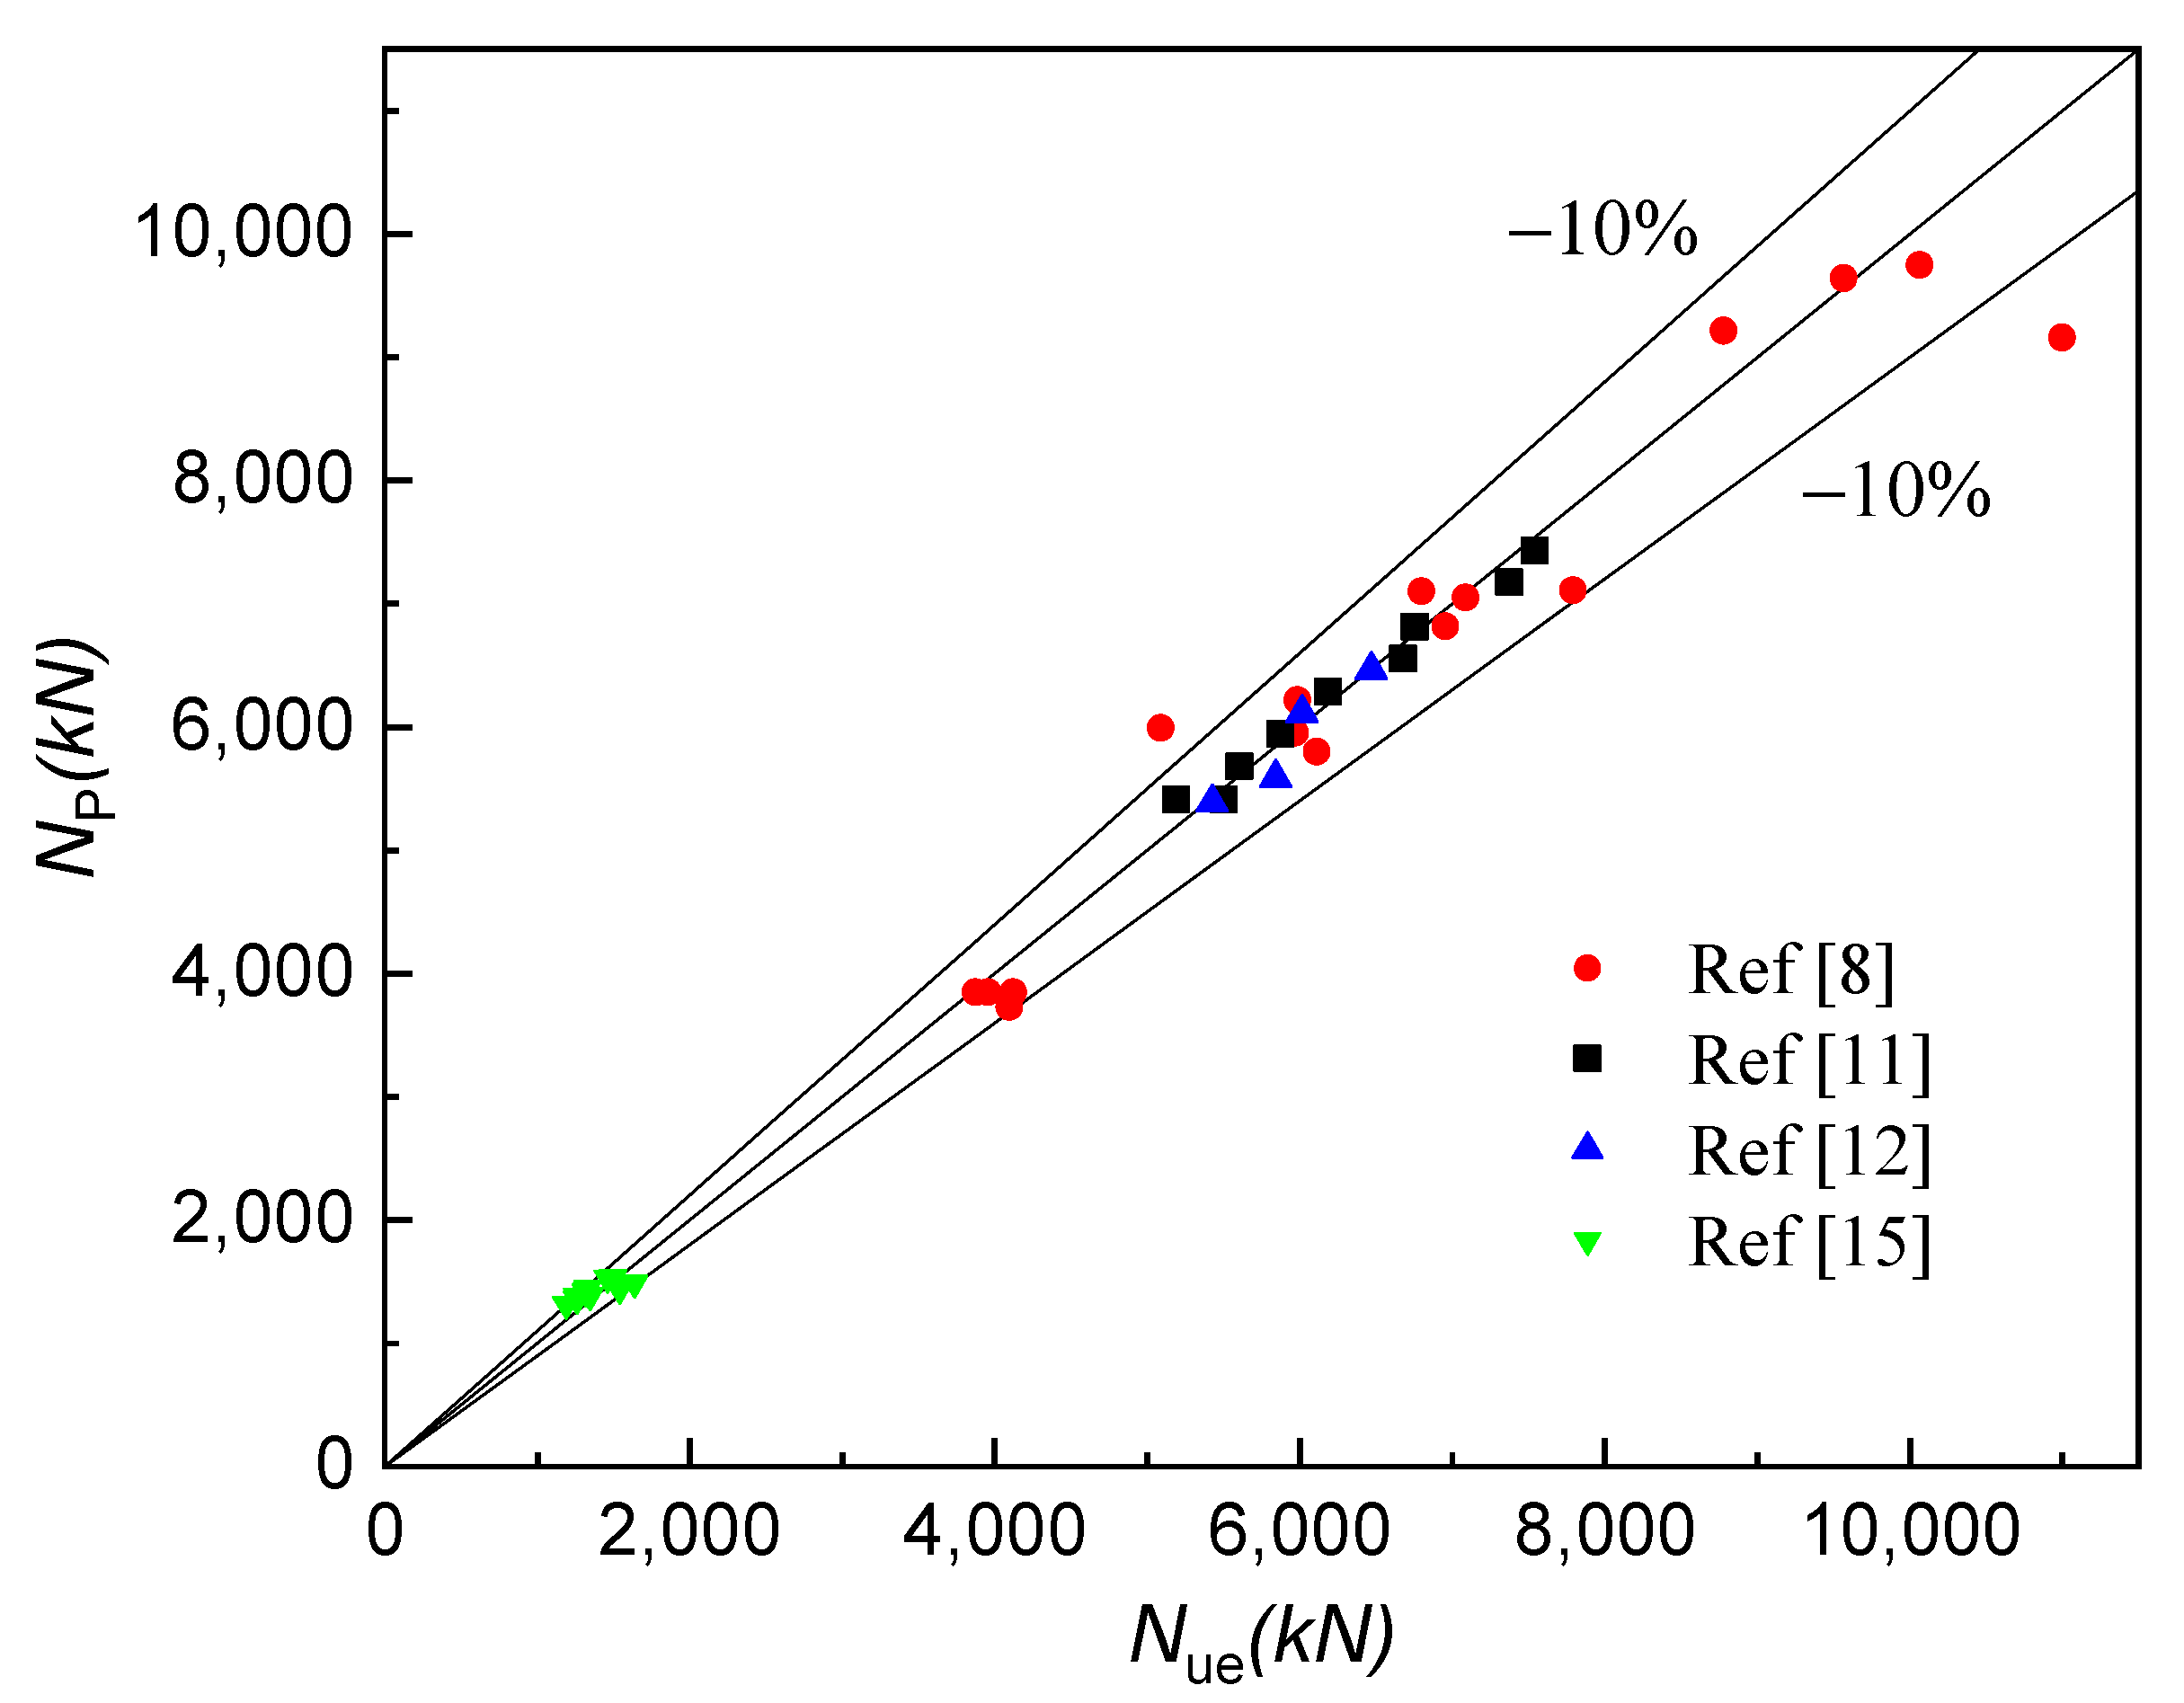
- The ultimate bearing capacity prediction method proposed in this paper can reasonably predict the bearing capacity of square CFST columns with PBL stiffeners, while the methods in ACI, BS 5400, EC4, AIJ, and DBJ are more conservative. The Equation is suitable for different types of PBL stiffeners, and the Equation of the formula is relatively simple compared to [12,15].
Author Contributions
Funding
Data Availability Statement
Acknowledgments
Conflicts of Interest
Nomenclature
| cross-section area of concrete | ultimate strength obtained from code ACI | ||
| cross-section area of steel stiffener | ultimate strength obtained from code DBJ | ||
| cross-section area of the steel tube | ultimate strength obtained from code EC4 | ||
| width of the steel tube | ultimate strength obtained from code BS5400 | ||
| length of column | ultimate strength obtained from code AIJ | ||
| width of steel stiffeners | the superposed strength | ||
| opening diameter on steel stiffener | ultimate load of test | ||
| opening spacing on steel stiffener | ultimate strength predicted by FE models | ||
| wall thickness of steel tube | ultimate strength predicted by formula in this paper | ||
| thickness of stiffener | vertical stress of stiffener | ||
| steel modulus of elasticity | compressive strength of confined concrete | ||
| initial elastic modulus corresponding to | vertical stress of steel tube | ||
| characteristic cube strength of concrete | yield strain of steel tube | ||
| characteristic compressive concrete strength ( | strain corresponding to the beginning of strain hardening | ||
| characteristic compressive strength of confined concrete | ultimate strain corresponding to the ultimate tensile strength | ||
| yield strength of stiffener | ultimate strain of core concrete | ||
| yield strength of the steel tube | ultimate stress of core concrete | ||
| ultimate tensile strength of steel tube | constraint effect coefficient |
References
- Han, L.H.; Tao, Z. Design codes and methods on concrete-filled steel tubular structures in China. In Proceedings of the International Symposium on Worldwide Trend and Development in Codified Design of Steel Structures, Singapore, 2–6 October 2006; pp. 46–74. [Google Scholar]
- Uy, B. Novel composite steel-concrete systems incorporating high-performance steels: Applications, behavior and design. In Proceedings of the Ninth International Symposium on Structural Engineering for Young Experts, Fuzhou/Xiamen, China, 18–21 August 2006; pp. 11–20. [Google Scholar]
- Denavit, M.D.; Hajjar, J.F.; Perea, T.; Leon, R.T. Stability analysis and design of composite structures. J. Struct. Eng. 2016, 142, 4015157. [Google Scholar] [CrossRef]
- Fu, G.; Yu, C.; Li, S.; Wang, F.; Yang, J. Behaviour of rectangular concrete-filled steel tubular slender column with unequal wall thickness. Eng. Struct. 2021, 236, 112100. [Google Scholar] [CrossRef]
- Nassiraei, H.; Rezadoost, P. Static capacity of tubular X-joints reinforced with fiber reinforced polymer subjected to compressive load. Eng. Struct. 2021, 236, 112041. [Google Scholar] [CrossRef]
- Nassiraei, H.; Zhu, L.; Gu, C. Static capacity of collar plate reinforced tubular X-connections subjected to compressive loading: Study of geometrical effects and parametric formulation. Ships Offshore Struct. 2021, 16, 54–69. [Google Scholar] [CrossRef]
- Liu, Y.J.; Zhang, N.; Zhang, J.G. Mechanical Behavior of Concrete-filled Square Steel Tube Stiffened with PBL. J. Archit. Civ. Eng. 2012, 29, 13–17. [Google Scholar]
- Zhang, J.G. Research on the Mechanical Performance of Concrete-Filled Square Steel Tube Stiffened with PBL under Axial Compression Load. Ph.D. Thesis, Chang’an University, Xi’an, China, 2012. [Google Scholar]
- Liu, Y.J.; Li, H.; Zhang, N. Interface Bond-slip Performance of Rectangular Concrete-filled Steel Tube Stiffened by PBL. J. Archit. Civ. Eng. 2015, 32, 7. [Google Scholar]
- Zhu, W.Q.; Wu, H.H.; Liu, Y.J. Experimental study on shear behavior of perfobond leiste connectors confined by steel tube passively. J. Build. Struct. 2019, S01, 9. [Google Scholar]
- Zhou, Z.; Gan, D.; Zhou, X.H. Improved composite effect of square concrete filled steel tubes with diagonal binding ribs. J. Struct. Eng. ASCE. 2019, 145, 4019112. [Google Scholar] [CrossRef]
- Gan, D.; Zhou, Z.; Zhou, X.H. Axially loaded thin-walled square concrete-filled steel tubes stiffened with diagonal binding ribs. ACI Struct. J. 2019, 116, 265–280. [Google Scholar] [CrossRef]
- Zhou, H.; Zhou, Z.; Gan, D. Analysis and design of axially loaded square CFST columns with diagonal ribs. J. Constr. Steel Res. 2019, 167, 105848. [Google Scholar] [CrossRef]
- Liu, J.P.; Yang, J.; Chen, B.C.; Zhou, Z.Y. Mechanical performance of concrete-filled square steel tube stiffened with PBL subjected to eccentric compressive loads: Experimental study and numerical simulation. Thin-Walled Struct. 2020, 149, 106617. [Google Scholar] [CrossRef]
- Guo, J.H.; Diao, Y. Experimental behaviors of square concrete filled steel tubular columns with PBL stiffeners. Structures 2022, 38, 1556–1569. [Google Scholar] [CrossRef]
- Tao, Z.; Wang, Z.B.; Yu, Q. Finite element modelling of concrete-filled steel stub columns under axial compression. J. Constr. Steel Res. 2013, 89, 121–131. [Google Scholar] [CrossRef]
- Lam, D.; Dai, X.H.; Han, L.H.; Ren, Q.X.; Li, W. Behaviour of inclined, tapered and STS square CFST stub columns subjected to axial load. Thin-Walled Struct. 2012, 54, 94–105. [Google Scholar] [CrossRef]
- Zhang, Y.C.; Chen, Y. Experimental study and finite element analysis of square stub columns with straight ribs of concrete filled thin walled steel tube. J. Build. Struct. 2006, 5, 16–22. [Google Scholar]
- Huang, H.; Zhang, A.G.; Li, Y. Experimental research and finite element analysis on mechanical performance of concrete-filled stiffened square steel tubular stub columns subjected to axial compression. J. Build. Struct. 2011, 32, 75. [Google Scholar]
- Oguejiofor, E.C.; Hosain, M.U. A parametric study of perfobond rib shear connectors. Can. J. Civ. Eng. 1994, 21, 614–625. [Google Scholar] [CrossRef]
- Architectural Institute of Japan. Recommendations for Design and Construction of Concrete Filled Steel Tubular Structures: AIJ–CFT) [S]; Architectural Institute of Japan: Tokyo, Japan, 2008. [Google Scholar]
- British Standards Institutions BS5400. Steel, Concrete and Composite Bridges, Part5: Code of Practice for Design of Composite Bridges [S]; British Standards Institutions: London, UK, 2005. [Google Scholar]
- ACI Committee 318. Building Code Requirements for Structural Concrete (ACI 318-14) and Commentary (ACI 318-14); American Concrete Institute: Farmington Hills, MI, USA, 2014; p. 519. [Google Scholar]
- DBJ/T13-51-2010; Technical Specification for Concrete-Filled Steel Tubular Structures. The Construction Department of Fujian Province: Fuzhou, China, 2010.
- General Rules and Rules for Building. In Eurocode 4, Design of Composite Steel and Concrete Structures. Part 1.1; European Committee for Standardization: Brussels, Belgium, 2004.
- Mander, J.B.; Priestley, M.J.N.; Park, R. Theoretical stress-strain model for confined concrete. J. Struct. Eng. 1988, 114, 1804–1826. [Google Scholar] [CrossRef] [Green Version]


| Specimens | (kN) | (kN) | |
|---|---|---|---|
| SC-3-A | 1348 | 1414 | 1.049 |
| SC-5-A | 1326 | 1418 | 1.069 |
| SC-3-B | 1332 | 1376 | 1.033 |
| SC-5-B | 1462 | 1416 | 0.969 |
| SC-3-C | 1189 | 1283 | 1.079 |
| SC-5-C | 1262 | 1351 | 1.071 |
| SC-3-D1 | 1262 | 1245 | 0.987 |
| SC-3-D2 | 1318 | 1261 | 0.957 |
| SC-5-D1 | 1541 | 1478 | 0.959 |
| SC-5-D2 | 1638 | 1568 | 0.957 |
| Average | 1.013 | ||
| Standard Deviation | 0.049 | ||
| (a) | |||||||
| Specimens (Type A) | |||||||
| SC-3-A-1 | 40 | 2.75 | 0 | 42 | 2.75 | 0 | 1179 |
| SC-3-A-2 | 50 | 2.75 | 0 | 42 | 2.75 | 0 | 1297 |
| SC-3-A-3 | 60 | 2.75 | 0 | 42 | 2.75 | 0 | 1414 |
| SC-3-A-4 | 70 | 2.75 | 0 | 42 | 2.75 | 0 | 1531 |
| SC-3-A-5 | 40 | 1.2 | 0 | 42 | 2.75 | 0 | 899 |
| SC-3-A-6 | 50 | 1.2 | 0 | 42 | 2.75 | 0 | 1017 |
| SC-3-A-7 | 60 | 1.2 | 0 | 42 | 2.75 | 0 | 1134 |
| SC-3-A-8 | 70 | 1.2 | 0 | 42 | 2.75 | 0 | 1249 |
| SC-5-A-1 | 40 | 2.75 | 0 | 42 | 4.75 | 0 | 1188 |
| SC-5-A-2 | 50 | 2.75 | 0 | 42 | 4.75 | 0 | 1303 |
| SC-5-A-3 | 60 | 2.75 | 0 | 42 | 4.75 | 0 | 1418 |
| SC-5-A-4 | 70 | 2.75 | 0 | 42 | 4.75 | 0 | 1533 |
| SC-5-A-5 | 40 | 1.2 | 0 | 42 | 4.75 | 0 | 909 |
| SC-5-A-6 | 50 | 1.2 | 0 | 42 | 4.75 | 0 | 1019 |
| SC-5-A-7 | 60 | 1.2 | 0 | 42 | 4.75 | 0 | 1135 |
| SC-5-A-8 | 70 | 1.2 | 0 | 42 | 4.75 | 0 | 1247 |
| (b) | |||||||
| Specimens (Type B) | |||||||
| SC-3-B-1 | 40 | 2.75 | 16 | 42 | 2.75 | 50 | 1127 |
| SC-3-B-2 | 50 | 2.75 | 16 | 42 | 2.75 | 50 | 1248 |
| SC-3-B-3 | 60 | 2.75 | 16 | 42 | 2.75 | 50 | 1376 |
| SC-3-B-4 | 70 | 2.75 | 16 | 42 | 2.75 | 50 | 1486 |
| SC-3-B-5 | 40 | 1.2 | 16 | 42 | 2.75 | 50 | 843 |
| SC-3-B-6 | 50 | 1.2 | 16 | 42 | 2.75 | 50 | 965 |
| SC-3-B-7 | 60 | 1.2 | 16 | 42 | 2.75 | 50 | 1087 |
| SC-3-B-8 | 70 | 1.2 | 16 | 42 | 2.75 | 50 | 1211 |
| SC-5-B-1 | 40 | 2.75 | 16 | 42 | 4.75 | 50 | 1182 |
| SC-5-B-2 | 50 | 2.75 | 16 | 42 | 4.75 | 50 | 1297 |
| SC-5-B-3 | 60 | 2.75 | 16 | 42 | 4.75 | 50 | 1416 |
| SC-5-B-4 | 70 | 2.75 | 16 | 42 | 4.75 | 50 | 1533 |
| SC-5-B-5 | 40 | 1.2 | 16 | 42 | 4.75 | 50 | 905 |
| SC-5-B-6 | 50 | 1.2 | 16 | 42 | 4.75 | 50 | 1024 |
| SC-5-B-7 | 60 | 1.2 | 16 | 42 | 4.75 | 50 | 1146 |
| SC-5-B-8 | 70 | 1.2 | 16 | 42 | 4.75 | 50 | 1267 |
| SC-3-B-d1 | 60 | 2.75 | 0 | 42 | 2.75 | 50 | 1414 |
| SC-3-B-d2 | 60 | 2.75 | 42 | 2.75 | 50 | 1397 | |
| SC-3-B-d3 | 60 | 2.75 | 42 | 2.75 | 50 | 1376 | |
| SC-3-B-d4 | 60 | 2.75 | 42 | 2.75 | 50 | 1334 | |
| SC-3-B-d5 | 60 | 2.75 | 42 | 2.75 | 50 | 1301 | |
| SC-5-B-d1 | 60 | 2.75 | 0 | 42 | 4.75 | 50 | 1418 |
| SC-5-B-d2 | 60 | 2.75 | 42 | 4.75 | 50 | 1451 | |
| SC-5-B-d3 | 60 | 2.75 | 42 | 4.75 | 50 | 1416 | |
| SC-5-B-d4 | 60 | 2.75 | 42 | 4.75 | 50 | 1361 | |
| SC-5-B-d5 | 60 | 2.75 | 42 | 4.75 | 50 | 1316 | |
| SC-3-B-s1 | 60 | 2.75 | 42 | 2.75 | 23 | 1358 | |
| SC-3-B-s2 | 60 | 2.75 | 42 | 2.75 | 27.3 | 1359 | |
| SC-3-B-s3 | 60 | 2.75 | 42 | 2.75 | 33.3 | 1360 | |
| SC-3-B-s4 | 60 | 2.75 | 42 | 2.75 | 42.86 | 1355 | |
| SC-3-B-s5 | 60 | 2.75 | 42 | 2.75 | 50 | 1376 | |
| SC-3-B-s6 | 60 | 2.75 | 42 | 2.75 | 60 | 1364 | |
| SC-3-B-s7 | 60 | 2.75 | 42 | 2.75 | 75 | 1365 | |
| SC-3-B-s8 | 60 | 2.75 | 42 | 2.75 | 100 | 1364 | |
| (c) | |||||||
| Specimens (Type C) | |||||||
| SC-3-C-1 | 40 | 2.75 | 8 | 21 | 2.75 | 50 | 1023 |
| SC-3-C-2 | 50 | 2.75 | 8 | 21 | 2.75 | 50 | 1145 |
| SC-3-C-3 | 60 | 2.75 | 8 | 21 | 2.75 | 50 | 1283 |
| SC-3-C-4 | 70 | 2.75 | 8 | 21 | 2.75 | 50 | 1385 |
| SC-3-C-5 | 40 | 1.2 | 8 | 21 | 2.75 | 50 | 748 |
| SC-3-C-6 | 50 | 1.2 | 8 | 21 | 2.75 | 50 | 873 |
| SC-3-C-7 | 60 | 1.2 | 8 | 21 | 2.75 | 50 | 998 |
| SC-3-C-8 | 70 | 1.2 | 8 | 21 | 2.75 | 50 | 1124 |
| SC-5-C-1 | 40 | 2.75 | 8 | 21 | 4.75 | 50 | 1106 |
| SC-5-C-2 | 50 | 2.75 | 8 | 21 | 4.75 | 50 | 1230 |
| SC-5-C-3 | 60 | 2.75 | 8 | 21 | 4.75 | 50 | 1351 |
| SC-5-C-4 | 70 | 2.75 | 8 | 21 | 4.75 | 50 | 1469 |
| SC-5-C-5 | 40 | 1.2 | 8 | 21 | 4.75 | 50 | 813 |
| SC-5-C-6 | 50 | 1.2 | 8 | 21 | 4.75 | 50 | 936 |
| SC-5-C-7 | 60 | 1.2 | 8 | 21 | 4.75 | 50 | 1056 |
| SC-5-C-8 | 70 | 1.2 | 8 | 21 | 4.75 | 50 | 1148 |
| SC-3-C-d1 | 60 | 2.75 | 21 | 2.75 | 50 | 1303 | |
| SC-3-C-d2 | 60 | 2.75 | 21 | 2.75 | 50 | 1283 | |
| SC-3-C-d3 | 60 | 2.75 | 21 | 2.75 | 50 | 1248 | |
| SC-3-C-d4 | 60 | 2.75 | 21 | 2.75 | 50 | 1216 | |
| SC-5-C-d1 | 60 | 2.75 | 21 | 4.75 | 50 | 1368 | |
| SC-5-C-d2 | 60 | 2.75 | 21 | 4.75 | 50 | 1351 | |
| SC-5-C-d3 | 60 | 2.75 | 21 | 4.75 | 50 | 1271 | |
| SC-5-C-d4 | 60 | 2.75 | 21 | 4.75 | 50 | 1222 | |
| (d) | |||||||
| Specimens (Type D1) | |||||||
| SC-3-D1-1 | 40 | 2.75 | 16 | 42 | 2.75 | 50 | 902 |
| SC-3-D1-2 | 50 | 2.75 | 16 | 42 | 2.75 | 50 | 1023 |
| SC-3-D1-3 | 60 | 2.75 | 16 | 42 | 2.75 | 50 | 1245 |
| SC-3-D1-4 | 70 | 2.75 | 16 | 42 | 2.75 | 50 | 1343 |
| SC-3-D1-5 | 40 | 1.2 | 16 | 42 | 2.75 | 50 | 731 |
| SC-3-D1-6 | 50 | 1.2 | 16 | 42 | 2.75 | 50 | 849 |
| SC-3-D1-7 | 60 | 1.2 | 16 | 42 | 2.75 | 50 | 975 |
| SC-3-D1-8 | 70 | 1.2 | 16 | 42 | 2.75 | 50 | 1094 |
| SC-5-D1-1 | 40 | 2.75 | 16 | 42 | 4.75 | 50 | 1249 |
| SC-5-D1-2 | 50 | 2.75 | 16 | 42 | 4.75 | 50 | 1368 |
| SC-5-D1-3 | 60 | 2.75 | 16 | 42 | 4.75 | 50 | 1478 |
| SC-5-D1-4 | 70 | 2.75 | 16 | 42 | 4.75 | 50 | 1596 |
| SC-5-D1-5 | 40 | 1.2 | 16 | 42 | 4.75 | 50 | 937 |
| SC-5-D1-6 | 50 | 1.2 | 16 | 42 | 4.75 | 50 | 1060 |
| SC-5-D1-7 | 60 | 1.2 | 16 | 42 | 4.75 | 50 | 1180 |
| SC-5-D1-8 | 70 | 1.2 | 16 | 42 | 4.75 | 50 | 1300 |
| (e) | |||||||
| Specimens (Type D2) | |||||||
| SC-3-D2-1 | 40 | 2.75 | 21 | 55 | 2.75 | 50 | 1026 |
| SC-3-D2-2 | 50 | 2.75 | 21 | 55 | 2.75 | 50 | 1145 |
| SC-3-D2-3 | 60 | 2.75 | 21 | 55 | 2.75 | 50 | 1261 |
| SC-3-D2-4 | 70 | 2.75 | 21 | 55 | 2.75 | 50 | 1374 |
| SC-3-D2-5 | 40 | 1.2 | 21 | 55 | 2.75 | 50 | 778 |
| SC-3-D2-6 | 50 | 1.2 | 21 | 55 | 2.75 | 50 | 903 |
| SC-3-D2-7 | 60 | 1.2 | 21 | 55 | 2.75 | 50 | 1024 |
| SC-3-D2-8 | 70 | 1.2 | 21 | 55 | 2.75 | 50 | 1144 |
| SC-5-D2-1 | 40 | 2.75 | 21 | 55 | 4.75 | 50 | 1341 |
| SC-5-D2-2 | 50 | 2.75 | 21 | 55 | 4.75 | 50 | 1457 |
| SC-5-D2-3 | 60 | 2.75 | 21 | 55 | 4.75 | 50 | 1568 |
| SC-5-D2-4 | 70 | 2.75 | 21 | 55 | 4.75 | 50 | 1682 |
| SC-5-D2-5 | 40 | 1.2 | 21 | 55 | 4.75 | 50 | 1060 |
| SC-5-D2-6 | 50 | 1.2 | 21 | 55 | 4.75 | 50 | 1186 |
| SC-5-D2-7 | 60 | 1.2 | 21 | 55 | 4.75 | 50 | 1306 |
| SC-5-D2-8 | 70 | 1.2 | 21 | 55 | 4.75 | 50 | 1422 |
| SC-3-D2-d1 | 60 | 2.75 | 55 | 2.75 | 50 | 1305 | |
| SC-3-D2-d2 | 60 | 2.75 | 55 | 2.75 | 50 | 1261 | |
| SC-3-D2-d3 | 60 | 2.75 | 55 | 2.75 | 50 | 1216 | |
| SC-3-D2-d4 | 60 | 2.75 | 55 | 2.75 | 50 | 1181 | |
| SC-5-D2-d1 | 60 | 2.75 | 55 | 4.75 | 50 | 1638 | |
| SC-5-D2-d2 | 60 | 2.75 | 55 | 4.75 | 50 | 1568 | |
| SC-5-D2-d3 | 60 | 2.75 | 55 | 4.75 | 50 | 1510 | |
| SC-5-D2-d4 | 60 | 2.75 | 55 | 4.75 | 50 | 1452 | |
| Specimen | Source | |||||||||
|---|---|---|---|---|---|---|---|---|---|---|
| SC-3-A | 1348 | 0.894 | 0.614 | 0.960 | 0.964 | 0.982 | 0.961 | 1358 | 1.008 | [15] |
| SC-5-A | 1326 | 0.970 | 0.618 | 1.036 | 1.067 | 1.059 | 1.037 | 1437 | 1.083 | |
| SC-3-B | 1332 | 0.904 | 0.622 | 0.972 | 0.976 | 0.994 | 0.972 | 1475 | 1.107 | |
| SC-5-B | 1462 | 0.880 | 0.560 | 0.940 | 0.968 | 0.960 | 0.940 | 1548 | 1.059 | |
| SC-3-C | 1189 | 1.013 | 0.697 | 1.089 | 1.093 | 1.113 | 1.089 | 1339 | 1.126 | |
| SC-5-C | 1262 | 1.019 | 0.649 | 1.089 | 1.121 | 1.112 | 1.089 | 1417 | 1.123 | |
| SC-3-D1 | 1262 | 0.955 | 0.656 | 1.026 | 1.030 | 1.049 | 1.026 | 1388 | 1.100 | |
| SC-3-D2 | 1318 | 0.953 | 0.625 | 1.020 | 1.031 | 1.042 | 1.021 | 1434 | 1.088 | |
| SC-5-D1 | 1541 | 0.835 | 0.532 | 0.892 | 0.918 | 0.911 | 0.892 | 1460 | 0.948 | |
| SC-5-D2 | 1638 | 0.832 | 0.496 | 0.884 | 0.921 | 0.903 | 0.885 | 1529 | 0.933 | |
| SCB-20-1 | 4096 | 0.791 | 0.557 | 0.849 | 0.806 | 0.856 | 0.845 | 3620 | 0.884 | [8] |
| SCC-20-1 | 4122 | 0.786 | 0.553 | 0.844 | 0.800 | 0.851 | 0.840 | 3842 | 0.932 | |
| SCC-20-2 | 3874 | 0.837 | 0.589 | 0.898 | 0.852 | 0.905 | 0.893 | 3842 | 0.992 | |
| SCC-20-3 | 3955 | 0.819 | 0.577 | 0.879 | 0.834 | 0.887 | 0.875 | 3842 | 0.971 | |
| SCB-30-1 | 6798 | 0.882 | 0.616 | 0.963 | 0.895 | 0.961 | 0.957 | 6841 | 1.006 | |
| SCC-30-1 | 7793 | 0.769 | 0.537 | 0.840 | 0.781 | 0.839 | 0.835 | 7123 | 0.914 | |
| SCC-30-2 | 7088 | 0.846 | 0.590 | 0.924 | 0.858 | 0.922 | 0.918 | 7064 | 0.997 | |
| SCC-30-3 | 6954 | 0.862 | 0.602 | 0.942 | 0.875 | 0.940 | 0.936 | 6833 | 0.983 | |
| SCB-30-2 | 5984 | 0.854 | 0.591 | 0.948 | 0.872 | 0.946 | 0.941 | 5944 | 0.993 | |
| SCC-30-4 | 5089 | 1.004 | 0.695 | 1.115 | 1.025 | 1.113 | 1.107 | 5997 | 1.178 | |
| SCC-30-5 | 5969 | 0.856 | 0.593 | 0.950 | 0.874 | 0.949 | 0.943 | 5957 | 0.998 | |
| SCC-30-6 | 6111 | 0.836 | 0.579 | 0.928 | 0.854 | 0.927 | 0.921 | 5803 | 0.950 | |
| SCB-30-3 | 10,997 | 0.735 | 0.519 | 0.782 | 0.773 | 0.802 | 0.779 | 8933 | 0.812 | |
| SCC-30-7 | 10,063 | 0.804 | 0.567 | 0.855 | 0.845 | 0.877 | 0.851 | 9722 | 0.966 | |
| SCC-30-8 | 9566 | 0.845 | 0.597 | 0.899 | 0.889 | 0.922 | 0.895 | 9615 | 1.005 | |
| SCC-30-9 | 8777 | 0.921 | 0.651 | 0.980 | 0.968 | 1.005 | 0.976 | 9193 | 1.047 | |
| SS-2-2-B | 5501 | 0.767 | 0.512 | 0.882 | 0.797 | 0.895 | 0.888 | 5384 | 0.979 | [11] |
| SS-2-2-B3 | 5188 | 0.814 | 0.543 | 0.936 | 0.845 | 0.949 | 0.942 | 5349 | 1.031 | |
| SS-2-3-B | 5605 | 0.819 | 0.499 | 0.932 | 0.864 | 0.944 | 0.937 | 5719 | 1.020 | |
| SS-2-6-B | 5871 | 0.849 | 0.469 | 0.955 | 0.917 | 0.966 | 0.960 | 6056 | 1.032 | |
| SS-3-2-B | 6184 | 0.811 | 0.580 | 0.913 | 0.867 | 0.918 | 0.917 | 6235 | 1.008 | |
| SS-3-3-B | 6677 | 0.807 | 0.535 | 0.900 | 0.871 | 0.905 | 0.904 | 6565 | 0.983 | |
| SS-3-6-B | 6754 | 0.855 | 0.522 | 0.946 | 0.940 | 0.951 | 0.950 | 6896 | 1.021 | |
| SS-6-2-B | 7374 | 0.792 | 0.598 | 0.873 | 0.880 | 0.897 | 0.877 | 7122 | 0.966 | |
| SS-6-3-B | 7540 | 0.822 | 0.583 | 0.901 | 0.919 | 0.925 | 0.905 | 7438 | 0.986 | |
| SS-2-2-H | 5427 | 0.770 | 0.520 | 0.888 | 0.799 | 0.900 | 0.894 | 5336 | 0.983 | [12] |
| SS-2-3-H | 5843 | 0.763 | 0.481 | 0.872 | 0.800 | 0.883 | 0.877 | 5552 | 0.950 | |
| SS-3-2-H | 6015 | 0.805 | 0.576 | 0.909 | 0.883 | 0.917 | 0.914 | 6049 | 1.006 | |
| SS-3-3-H | 6468 | 0.812 | 0.554 | 0.909 | 0.873 | 0.914 | 0.914 | 6397 | 0.989 | |
| Average | 0.851 | 0.575 | 0.930 | 0.903 | 0.943 | 0.931 | — | 1.004 | ||
| Standard Deviation | 0.069 | 0.053 | 0.070 | 0.086 | 0.071 | 0.069 | — | 0.069 | ||
Disclaimer/Publisher’s Note: The statements, opinions and data contained in all publications are solely those of the individual author(s) and contributor(s) and not of MDPI and/or the editor(s). MDPI and/or the editor(s) disclaim responsibility for any injury to people or property resulting from any ideas, methods, instructions or products referred to in the content. |
© 2023 by the authors. Licensee MDPI, Basel, Switzerland. This article is an open access article distributed under the terms and conditions of the Creative Commons Attribution (CC BY) license (https://creativecommons.org/licenses/by/4.0/).
Share and Cite
Diao, Y.; Guo, J.; He, S. Numerical Analysis of CFST Column with PBL Stiffeners under Axial Compression. Processes 2023, 11, 769. https://doi.org/10.3390/pr11030769
Diao Y, Guo J, He S. Numerical Analysis of CFST Column with PBL Stiffeners under Axial Compression. Processes. 2023; 11(3):769. https://doi.org/10.3390/pr11030769
Chicago/Turabian StyleDiao, Yan, Jiahao Guo, and Shiyi He. 2023. "Numerical Analysis of CFST Column with PBL Stiffeners under Axial Compression" Processes 11, no. 3: 769. https://doi.org/10.3390/pr11030769