Article

Numerical Simulation of a Class I Gas Hydrate Reservoir Depressurized by a Fishbone Well

Sinopec Petroleum Exploration and Production Research Institute, Beijing 102206, China
Processes 2023, 11(3), 771; https://doi.org/10.3390/pr11030771
Submission received: 9 February 2023 / Revised: 28 February 2023 / Accepted: 2 March 2023 / Published: 5 March 2023
(This article belongs to the Section Energy Systems)

Abstract

:
The results of the second trial production of the gas hydrate reservoir in the Shenhu area of the South China Sea show that the production of a gas hydrate reservoir by horizontal wells can greatly increase the daily gas production, but the current trial production is still far below the minimum production required for commercial development. Compared with a single horizontal well, a fishbone well has a larger reservoir contact area and is expected to achieve higher productivity in the depressurization development of gas hydrate reservoirs. However, there is still a lack of systematic research on the application of fishbone wells in Class I gas hydrate reservoirs. In this paper, a grid system for gas hydrate reservoirs containing fishbone wells is first established using the PEBI unstructured grid, and fine-grained simulation of reservoirs near the bottom of the wells is achieved by adaptive grid encryption while ensuring computational efficiency. On this basis, Tough + Hydrate software is adopted to simulate the productivity and physical field change of a fishbone well with different branching numbers. The results show that: the higher the number of branches in a fishbone well, the faster the free water production rate, reservoir depressurization, and free gas production rate in the initial stage of depressurization development, and the faster depressurization can effectively promote hydrate dissociation. Compared with a single horizontal well, the cumulative gas production of a six branch fishbone well can increase by 59.3%. Therefore, using multi-branch fishbone depressurization to develop Class I gas hydrate reservoirs can effectively improve productivity and the depressurization effect, but the hydrate dissociation will absorb a lot of heat and lead to a rapid decrease in reservoir temperature and hydrate dissociation rate. At the end of the simulation, the hydrate dissociation rate of all schemes was lower than 50%. In the later stage of depressurization development, the combined development method of heat injection and depressurization is expected to further provide sufficient thermal energy for hydrate dissociation and promote the dissociation of the hydrate.

1. Introduction

Due to the gradual reduction of fossil energy, the world will face a serious energy crisis; all countries in the world are actively looking for renewable energy sources which can replace traditional energy [1,2,3,4]. Gas hydrate reserves are widely found in deep-sea sediments or permafrost on land; their reserves are huge and the pollution caused by combustion is much lower than that of traditional fossil fuels such as coal and petroleum. Therefore, it has become one of the most potential new energy sources in the 21st century [3,4,5,6]. At present, the former Soviet Union, the United States, Japan, Canada, and China have successfully carried out trial gas hydrate deposits, proving the technical feasibility of gas hydrate deposit development [7,8,9,10,11].
The development methods of gas hydrate reservoirs mainly include depressurization, thermal stimulation, inhibitor injection, and the exchange of methane molecules in the hydrate structure for carbon dioxide molecules. The thermal stimulation, CO2 replacement, and inhibitor injection methods all require the injection of fluids (hot water, CO2, or inhibitors) into the reservoir, making them costly and difficult to achieve commercial development under current technological conditions [12,13,14,15]. In order to accelerate the commercial development of gas hydrate reservoirs, the United States, Canada, Japan, and China have evaluated the production capacity of depressurized gas hydrate reservoirs in the trial production. China conducted two trial productions in the Shenhu Sea in 2017 and 2020, respectively. The first trial production used straight wells for depressurization development, and the average daily gas production was only 5151 m3/d, while the second trial production used horizontal wells for depressurization development, and the average daily gas production increased significantly to 2.87 × 10⁴ m3/d. In other words, the results of the two trial productions show that using long horizontal wellbores for depressurization can be used to achieve better development results [16,17,18,19,20,21]. Moreover, many other researchers also found that a horizontal well can greatly increase the contact area between the wellbore and reservoir. Thus, the gas production can be enhanced. Sasaki et al. and Li conducted physical experiments and found that the SAGD-type well configuration can greatly accelerate the hydrate dissociation [22,23]. Feng et al. compared the performance of a vertical well and a horizontal well in depressurization and thermal stimulation development. The results showed that the gas production rate, the heat transfer rate, and the accumulative dissociation ratio of the horizontal well are much higher than those of the vertical well [24]. Choudhary and Phirani built a numerical simulation model based on the geological parameters of KG Basin NGHP-02-09 site and the performances of vertical wells and horizontal wells were compared. The results showed that the horizontal well leads to early gas production [25]. Moridis also compared the performance of a vertical well and a horizontal well and found that production using horizontal wells is approximately two orders of magnitude larger than that from vertical wells accessing the same section of the HBL [26].
All above analysis has shown that the performance of a horizontal well obtains better performance than a vertical well due to the large contact area between the well and reservoir. Fishbone well drilling technology is to drill multiple branching wellbores on the main wellbore and form a fishbone-type branching distribution. Compared with conventional horizontal wells, fishbone wells can achieve a larger wellbore–reservoir contact area, which is expected to result in higher depressurized production [27,28]. Tough drilling a fishbone in a shallowly buried reservoir is challenging; many researchers have studied the feasibility of drilling complex shaped wells in hydrate reservoirs by experimental or numerical methods [29,30]. However, there is a lack of systematic research on the development of gas hydrate reservoirs by depressurization in fishbone wells, and the complex wellbore structure of fishbone wells poses a major challenge for gridding. This paper firstly implements the mesh delineation of reservoirs containing fishbone wells based on the PEBI unstructured mesh delineation method, and on this basis, the Tough + Hydrate software is used to simulate the development of fishbone wells with different branch numbers by depressurization and obtain the variation law of production capacity and physical field of gas hydrate reservoirs developed by fishbone wells.

2. Mathematical Model and Validation

2.1. Mathematical Model

The current simulators on the development of hydrate reservoirs include Tough + Hydrate, MH21-HYDRES, STOMP-HYD, etc. Among these simulators, Tough + Hydrate considers comprehensive mechanisms and has become the most widely used simulator at present. Therefore, the Tough + Hydrate simulator was used for the subsequent research. The motion equation and conservation equation in the mathematical model of a gas hydrate reservoir are similar to those of conventional oil and gas reservoirs. Fluid flow follows Darcy’s law. Since hydrate phase and ice phase are both non-mobile phases, only water phase and gas phase can be considered in the motion equation, which is shown in Equation (1):
F β = k k r β ρ β μ β ( P β ρ β g ) ( β = W , G )
where F β is the mass flow velocity of β phase, kg·m−2·s−1; k is absolute permeability, ×10−3 μm2; k r β is the relative permeability of β phase, dimensionless; μ β is the viscosity of β phase, Pa·s; P β is the pressure of β phase, Pa; and g is the gravitational acceleration, 9.8 m·s−2.
In order to reflect the interaction between the seepage field and the temperature field in the mathematical model, it is necessary to consider two sets of conservation equations, namely the mass conservation equation and the energy conservation equation. The mass conservation equation of a natural gas hydrate reservoir is shown in Equation (2):
t ( β = G , W , I , H ϕ S β ρ β X β κ ) + ( β = G , W X β κ F β ) = β = G , W X q , β κ q β
where φ is the porosity of the reservoir, dimensionless; S β is the saturation of β phase, dimensionless; ρ β is the density of β phase, kg·m−3; X β m is the mass fraction of methane in fluid β phase in the reservoir, dimensionless; X q , β m is the mass fraction of methane in the source/sink fluid β phase of the hydrate reservoir, dimensionless; q m is the source/sink term of methane components in the hydrate reservoir, kg·m−3·s−1 X β w is the mass fraction of water component in the hydrate reservoir in fluid β phase, dimensionless; X q , β w is the mass fraction of water in the source/sink fluid β phase of the hydrate reservoir, dimensionless; and q w is the source/sink term of water components in the hydrate reservoir, kg·m−3·s−1.
The energy conservation of the mathematical model for natural gas hydrate reservoirs is then related to the energy variation within the reservoir and the source/sink term, with the equations shown in Equations (3)–(6):
M e t + F e = q e
M e = ( 1 ϕ ) ρ R H R + β = G , W , I , H ϕ S β ρ β H β + ϕ Δ S H ρ H Δ H 0
F e = [ ( 1 ϕ ) λ R + β = W , G , I , H ϕ S β λ β ] T + β = W , G H β F β + ε σ T 4
q e = β = G , W H β q β
where M e is energy accumulation in the reservoir, J·m−3; F e is rate of energy change within the reservoir, J·m−2·s−1; q e is the source and sink term of energy in the reservoir, J·m−3·s−1; ρ R is the density of rock, kg·m−3; H R is the enthalpy of rock, J·kg−1; H β is the enthalpy of the β phase of fluid in the reservoir, J·kg−1; Δ S H is the change amount of hydrate saturation in the reservoir, dimensionless; Δ H 0 is the enthalpy of hydrate formation/dissociation in the reservoir, J·kg−1; λ R is the thermal conductivity of the rock, W·m−1·K−1; λ β is the thermal conductivity of the β phase, W·m−1·K−1; ε is the coefficient of thermal radiation dimensionless; and σ = 5.6687 × 10 8 J m 2 K 4 is the Stefan–Boltzmann constant.
In order to quantitatively characterize the phase equilibrium relationship between hydrate formation and dissociation, the model adopts the phase equilibrium relationship established by Moridis. The model matches the laboratory experimental data well and, more importantly, the model is continuous and derivable. Therefore, the model proposed by Moridis is suitable for numerical simulation and is used to describe the relationship between pressure and temperature on the I-H-G and W-H-G equilibrium curves, as shown in Equation (7) [31]:
ln P e = { 1.94138504464560 × 10 5 + 3.31018213397926 × 10 3 T 2.25540264493806 × 10 1 T 2 + 7.67559117787059 × 10 2 T 3 1.30465829788791 × 10 4 T 4 + 8.86065316687571 × 10 8 T 5 T 273.2 K 4.38921173434628 × 10 1 + 7.76302133739303 × 10 1 T 7.27291427030502 × 10 5 T 2 + 3.85413985900724 × 10 5 T 3 1.03669656828834 × 10 7 T 4 + 1.09882180475307 × 10 10 T 5 T < 273.2 K
where P e is the phase equilibrium pressure of natural gas hydrate, MPa; T is the phase equilibrium temperature of natural gas hydrate, K.
There are two kinds of models used in Tough + Hydrate simulator, that is, the phase equilibrium model and kinetic model. In the phase equilibrium model, the hydrates occupy some of the pore space. Once the hydrates dissociate, the saturation of water and gas increase. Otherwise, the saturation of water and gas decrease. By this way, the relative permeability of gas and water is influenced by hydrate dissociation and formation. In the kinetic model, the permeability is directly related with hydrate saturation. Kowalsky and Moridis compared the simulation results of the two models and nearly the same results were obtained [14]. However, the phase equilibrium model is much faster than the kinetic model and, therefore, they suggest the use of the phase equilibrium model. In this paper, the phase equilibrium model is adopted and the phase permeability curve model for natural gas hydrate reservoirs uses a modified Stone empirical model to predict the relative permeability of the three-phase fluids, which is shown in Equation (8):
{ k rW = ( S W S irW 1 S irW ) N w k rG = ( S G S irG 1 S irG ) N g k H = 0
where k rW is the relative permeability of the water phase, dimensionless; k rG is the relative permeability of the gas phase, dimensionless; S irW is bound water saturation, dimensionless; S irG is bound gas saturation, dimensionless; N w is the decrease index of relative permeability of the water phase, dimensionless; N g is the decrease index of relative permeability of the gas phase, dimensionless.
The closed boundary condition that belongs to the Neumann boundary condition is used in this paper. The formula can be expressed as:
{ p W Γ = 0 p G Γ = 0
where p W and p G are the pressure of the water phase and gas phase at the boundary Γ , respectively, Pa.

2.2. Validation

Konno conducted a simulation study of a hydrate reservoir using the MH21-HYDRES simulator, and the detailed parameters are comprehensively described [32]. In order to validate the effectiveness of the model, the simulation results of Konno and the model in this paper are compared. The target hydrate reservoir is a class III reservoir. A radial grid is used, and the depth of the hydrate layer is 50 m. The thickness of the single grid is 1 m and therefore there are 50 grids in the vertical direction. In order to simulate the influence of overburden and underburden on hydrate dissociation, the depths of the overburden and underburden are both 50 m. A vertical well is used for depressurization development and the bottom hole pressure is kept at 4 MPa. The reservoir permeability is 500 mD and the comparison of the results is shown in Figure 1. As shown in this figure, the peak gas production of the model in this paper is slightly higher than that of Konno. However, the shapes are quite similar, and a good matching result is obtained. Therefore, the model in this paper is reliable and can be used for the subsequent simulation.

3. Numerical Models and Simulation Approach

3.1. PEBI Unstructured Grid Generation

At present, the commonly used modeling grid systems mainly include the Cartesian grid system, corner grid system, and unstructured grid system. The Cartesian grid system is orthogonal to each other, so it is only used for simple model modeling and grid division. The corner grid system can move the corner points of the grid, which makes up for the defects of the Cartesian grid system to some extent. However, when the boundary or well type is too complex, the shape of the mesh near the boundary or complex well may become distorted, which in turn may lead to convergence problems. The PEBI unstructured grid system is well suited to modeling complex structural wells or boundaries while maintaining the local orthogonality of the mesh and enabling local mesh encryption near the well or boundary [33]. In view of the advantages of the PEBI unstructured grid in modeling, this paper adopts the system for subsequent simulation research.
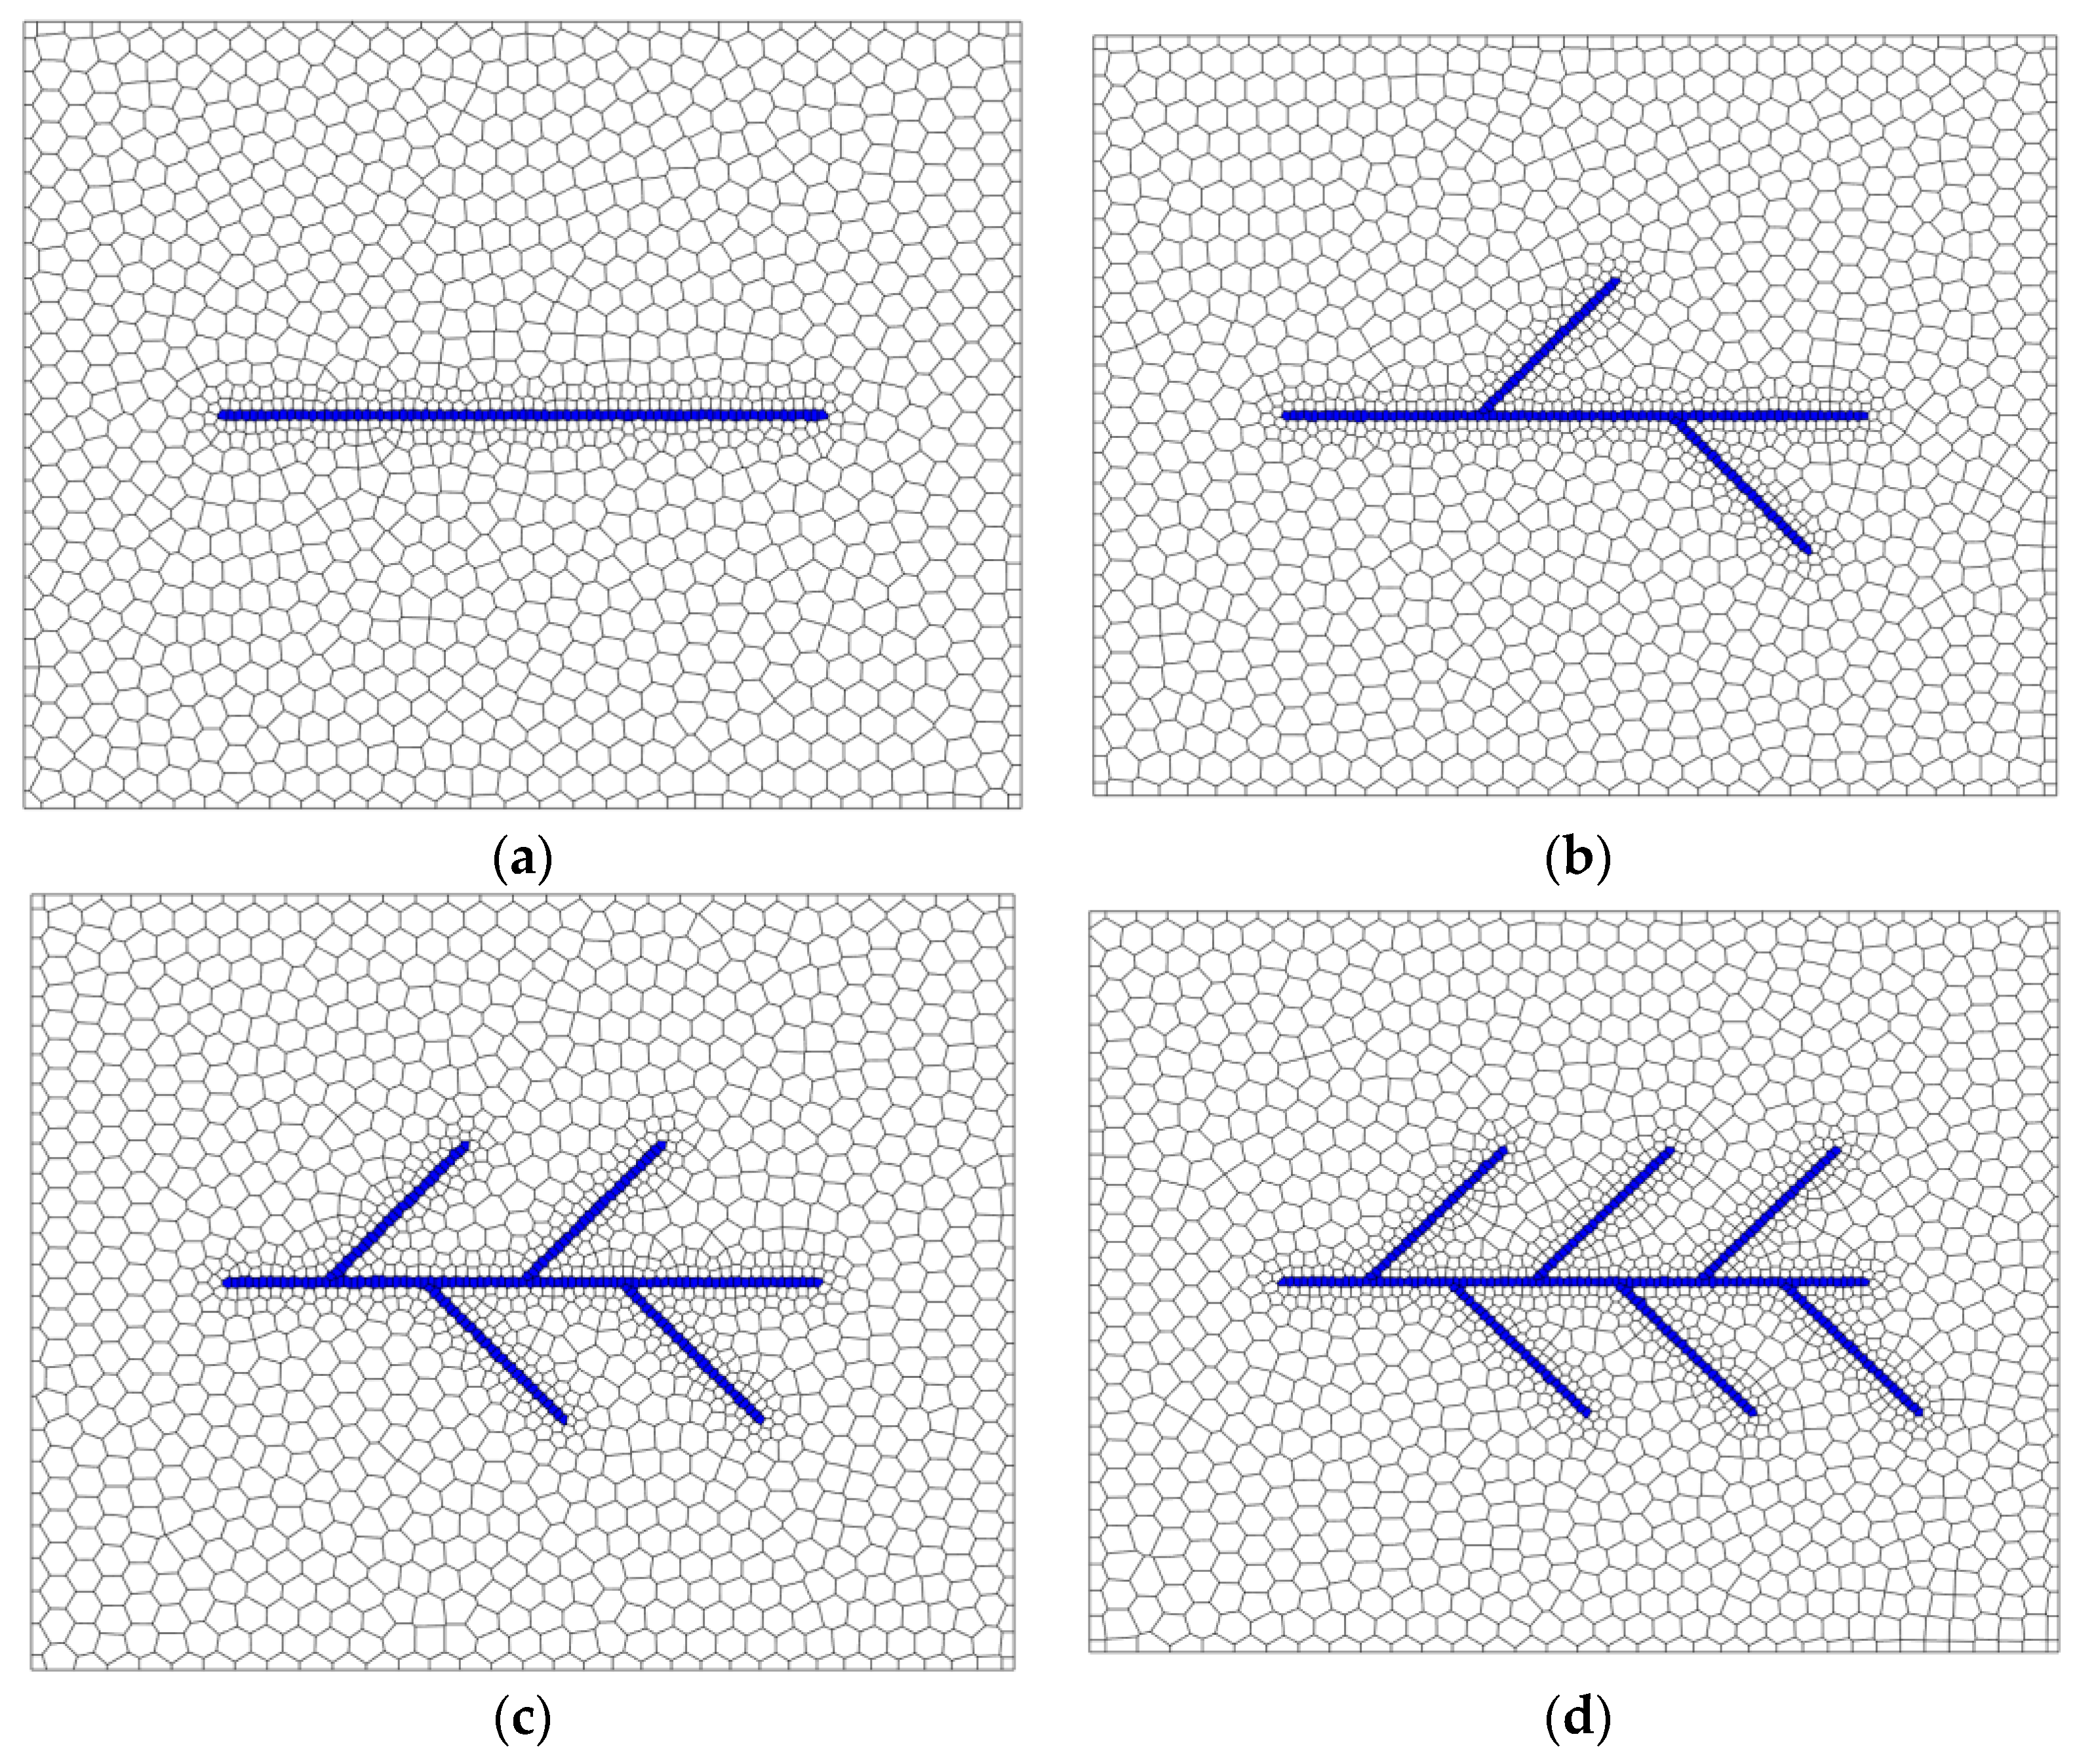
In order to obtain the effect of the number of branches on the depressurization development effect of a fishbone well, the models of a single horizontal well, two-branch fishbone well, four-branch fishbone well, and six-branch fishbone well were respectively modeled. Figure 2 shows a planar grid system built using the PEBI unstructured grid. The grid where the well is located is marked in blue. The size of the model is 500 m × 400 m, the length of a single horizontal well is 300 m, the branch length of the fishbone well is 100 m, the main shaft length of the fishbone well is 300 m, and the angle between each branch and the main shaft is 45°. The modeling results show that the PEBI grid is locally encrypted near the wellbore, and there is no mesh distortion at the encryption area and model boundary; the modeling effect is good.

3.2. Modeling of Class I Gas Hydrate Reservoirs

Although the PEBI unstructured grid has good orthogonality, it may be difficult to maintain the orthogonality of the mesh around the well or boundary when the well structure or boundary is too complex, and flux correction is required for flow simulations using a non-orthogonal grid. The main numerical simulators currently used for natural gas hydrate reservoirs include Tough + Hydrate and STOMP-HYD in the USA, MH21-HYDRES in Japan and the STARS module of CMG in Canada. Among them, Tough + Hydrate mechanism is the most comprehensive and the code is open source for easy modification, so this paper mainly uses Tough + Hydrate software for simulation study [34,35].
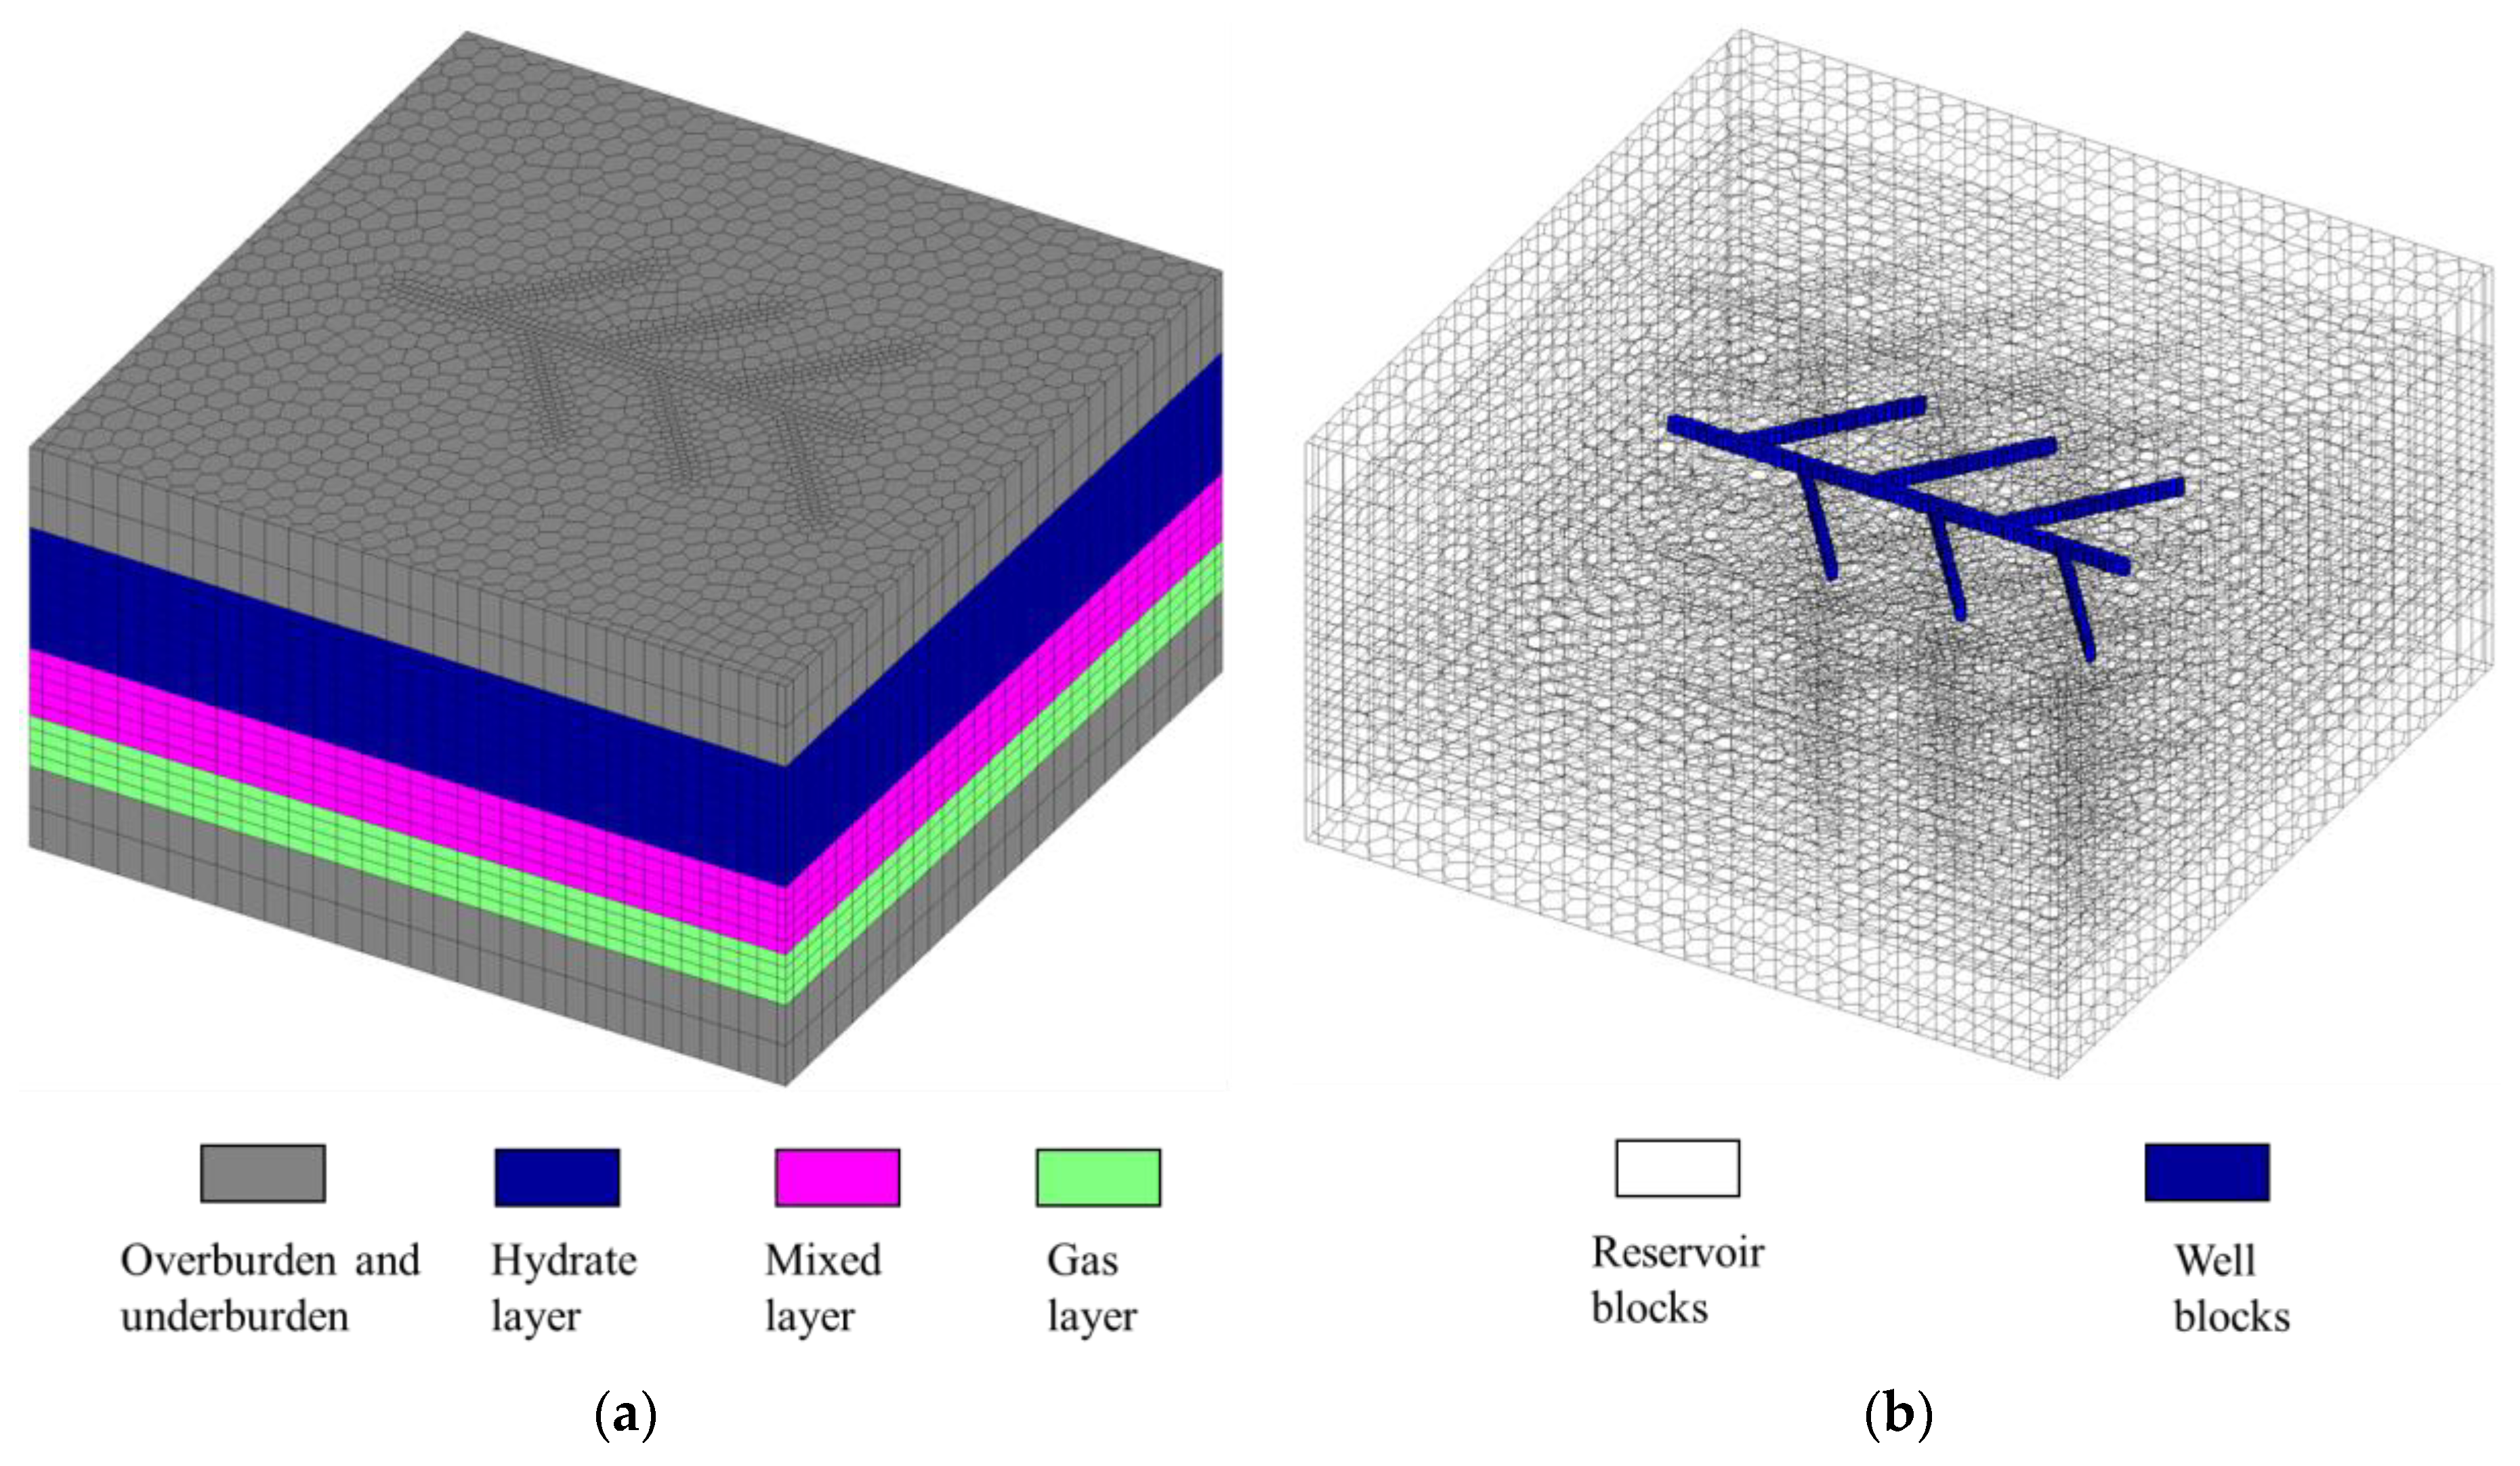
The geological parameters of the gas hydrate reservoir for the second trial test in the Shenhu area of South China Sea were investigated, and the values of main parameters were shown in Table 1 [17]. The gas hydrate reservoir in the test production area contains three main horizons, namely, the hydrate layer, mixed layer, and gas layer. As shown in Figure 3a, the hydrate layer is saturated with water and hydrate, the mixed layer is saturated with water, hydrate, and gas, and the gas layer mainly contains gas and water. Considering that generated gas and free gas are easy to migrate to the top of the reservoir and form a secondary gas top after depressurized development, fishbone wells are arranged in the hydrate layer in order to improve gas recovery, as shown in Figure 3b. The fishbone well was produced with a constant bottomhole pressure of 4 MPa, and the simulated production time was 1000 days. The maximum timestep is 10 days and the convergence criteria is that the differences of the primary variables between two Newton iterations are all smaller than 1 × 10⁻⁵.

3.3. Results and Discussions

3.3.1. Evolution of the Gas and Water Productions

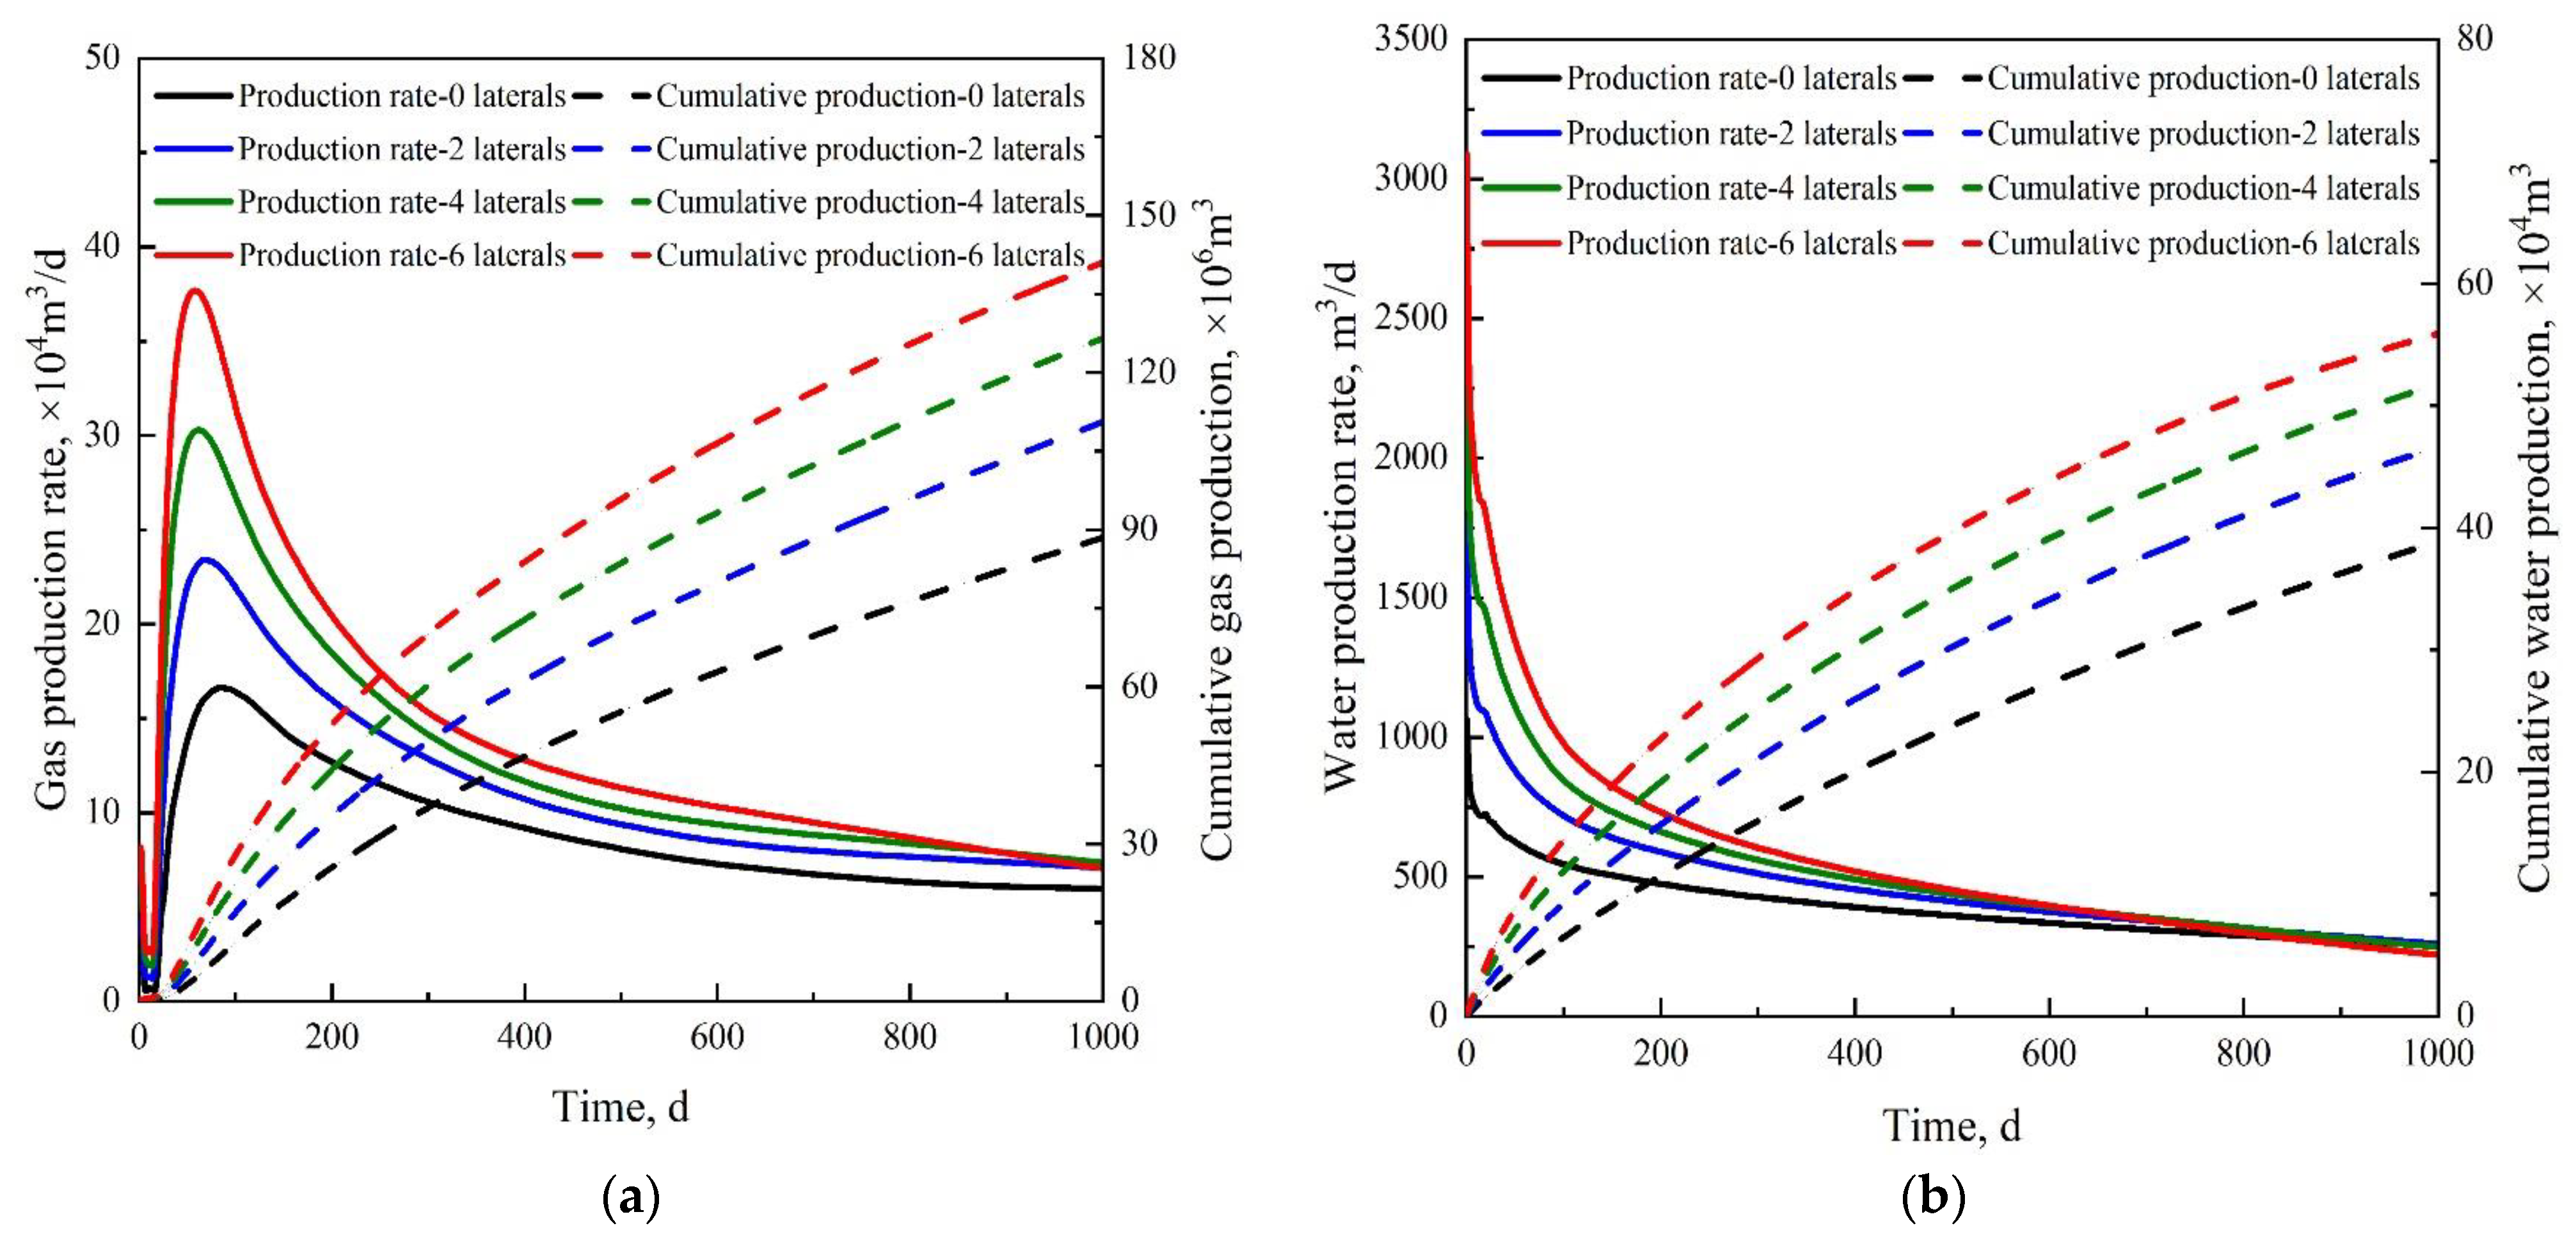
Pattern of change in gas and water production is consistent across the scenarios. As shown in Figure 4, in the initial stage of depressurized development, the gas production was low, but with the development of depressurized development, the daily gas production increased rapidly and then declined after reaching the peak. The larger the number of branches, the larger the peak gas production. For water production, the highest was in the initial stage of depressurization development, and then it continuously decreased. The more branch water, the higher the water production. This is mainly because the larger the number of branches, the larger the contact area between the fishbone well and the reservoir, and the faster the free water in the reservoir at the beginning of depressurization development. The cumulative water production of the four schemes within 100 days was 64,742 m3, 92,858 m3, 118,683 m3, and 144,488 m3, respectively. Compared with a single horizontal well, the initial water production of the six-branch fishbone well increased by 123.2%. Obviously, the faster free water production rate will greatly accelerate the depressurization rate of the reservoir. When the reservoir pressure around the wellbore drops to the equilibrium pressure of the hydrate phase, the hydrate begins to decompose and the dissociation gas begins to be produced in large quantities. In addition, after the reservoir pressure drops, the free gas in the mixed and free gas reservoirs starts to return upward. The faster the reservoir pressure drops, the faster the free gas returns upward. Therefore, the more branches of fishbone wells, the faster the gas production rate. The cumulative gas production of unbranched, double-branched, four-branched, and six-branched fishbone wells is 8.85 × 10⁷ m3/d, 1.11 × 10⁸ m3/d, 1.27 × 10⁸ m3/d and 1.41 × 10⁸ m3/d, respectively. Compared with a single horizontal well, the cumulative gas production of six-branched fishbone wells can increase by 59.3%. Therefore, the exploitation of Class I gas hydrate reservoir with multi-branch fish spur depressurization can effectively improve the productivity and depressurization development effect.

3.3.2. Evolution of the Hydrate Reserves

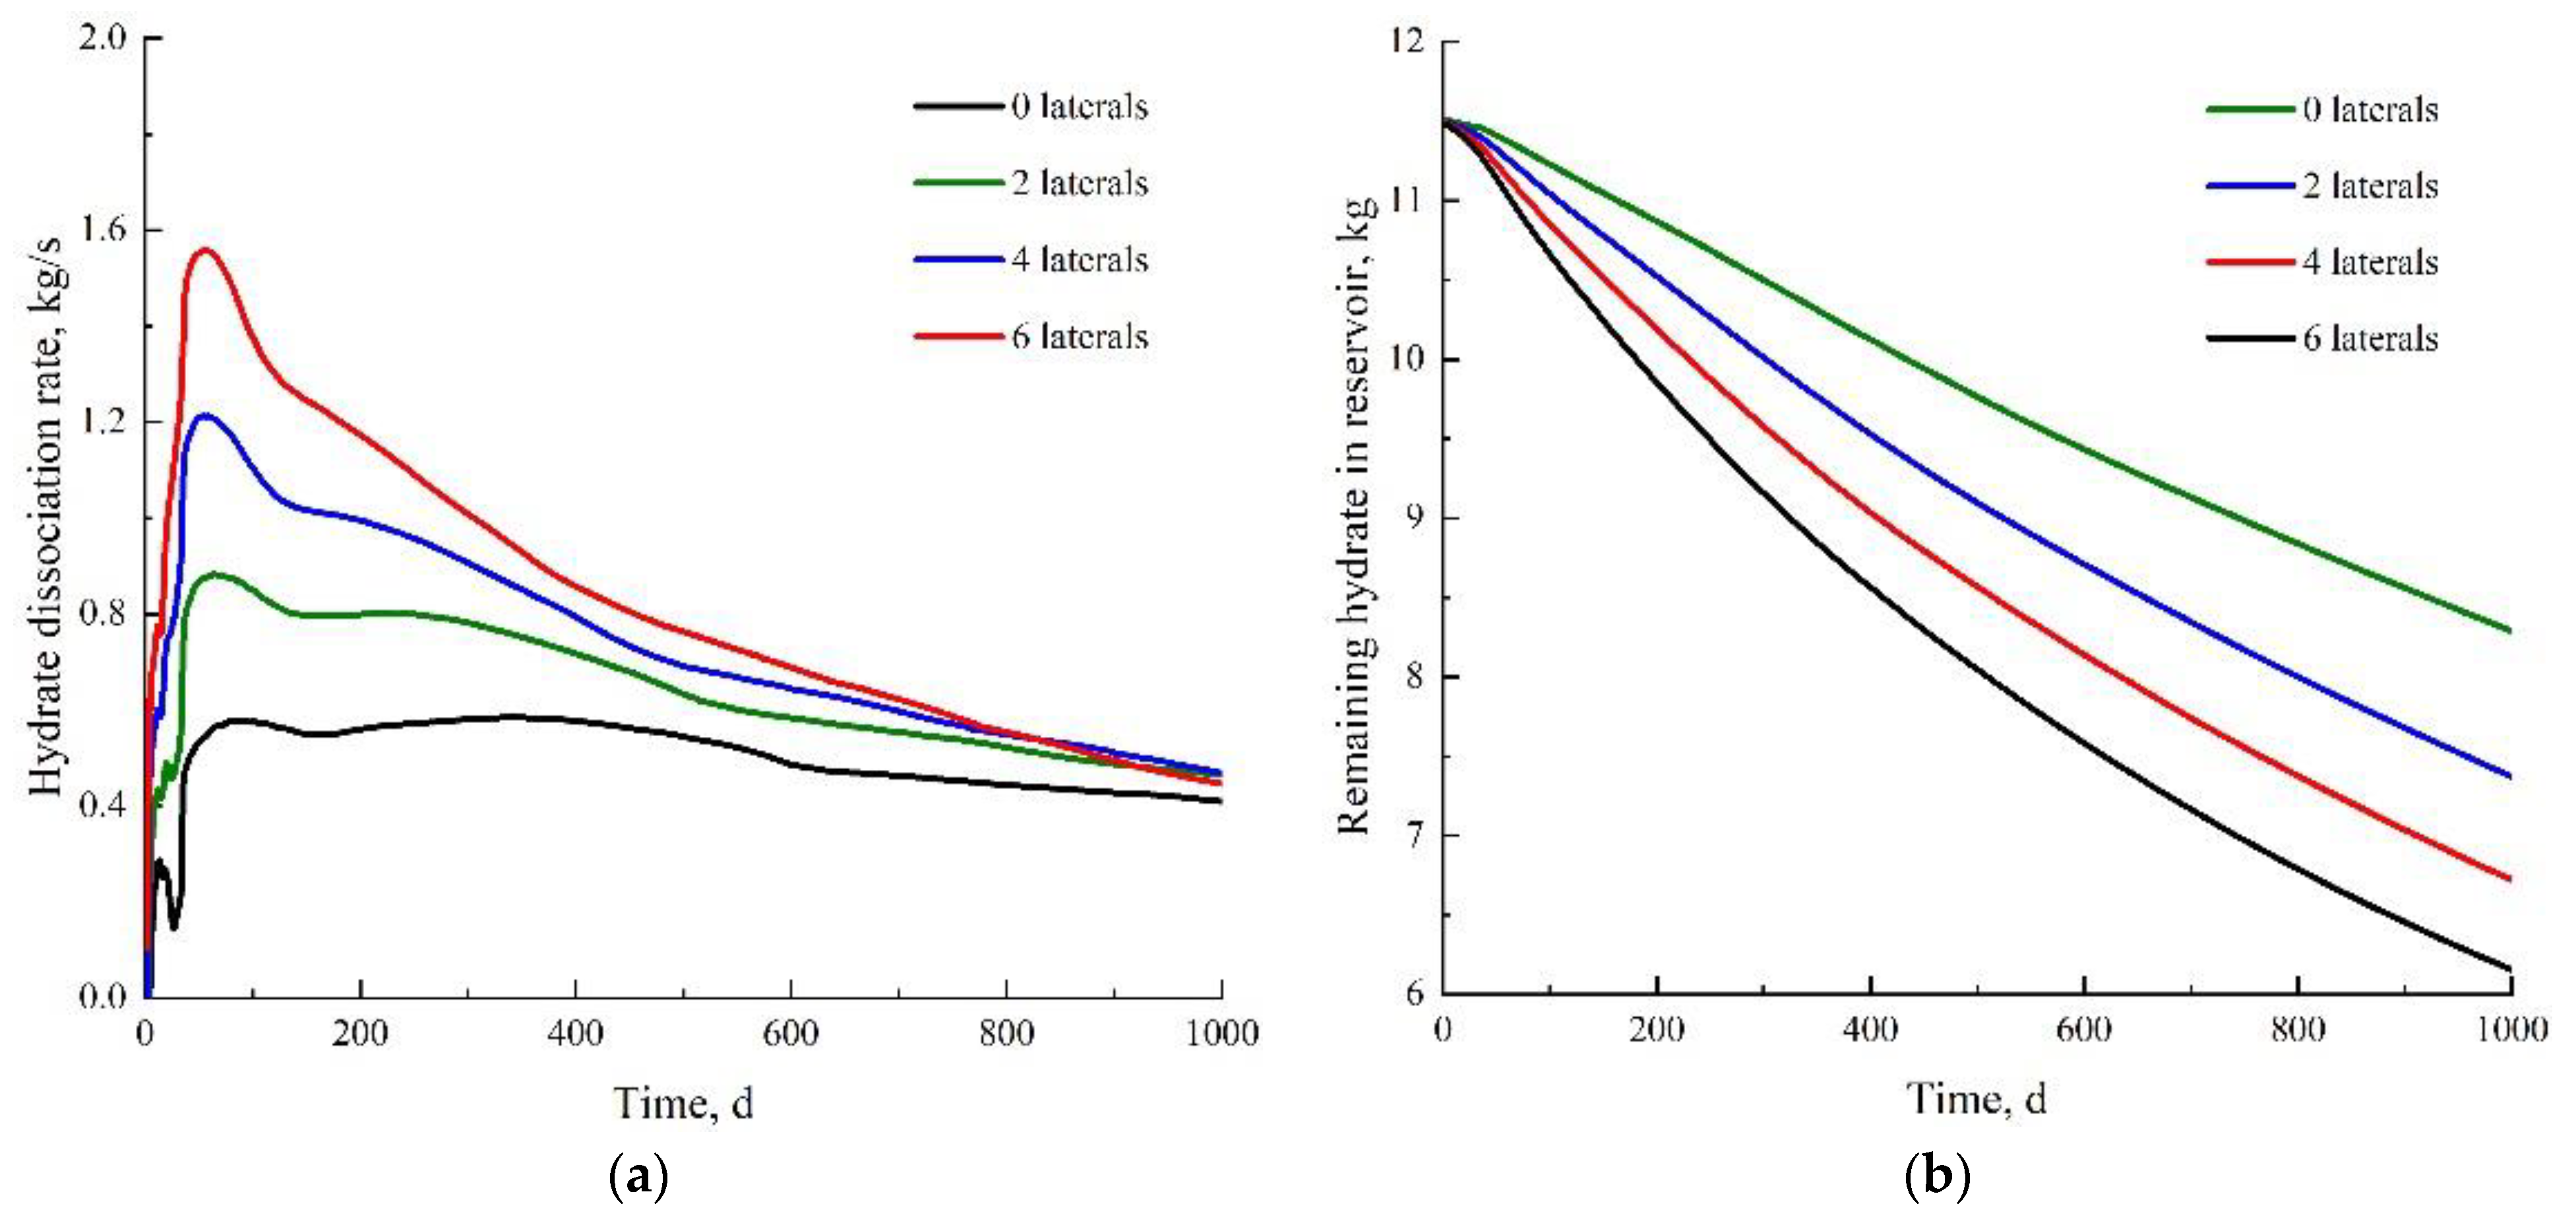
Figure 5 shows the rate of hydrate dissociation and the mass of the hydrate remaining for each scenario. As can be seen in Figure 5a, the rate of hydrate dissociation is low at the beginning of the depressurization development and rises rapidly with decreasing reservoir pressure and reaches a peak. In the later stage of depressurization development, the difference between hydrate dissociation rates of various schemes decreases. Comparing the scenarios, it can be seen that the higher the number of branches in the fishbone well, the higher the peak hydrate dissociation rate. However, at the same time, the rate of hydrate dissociation decreases rapidly due to the heat absorption by hydrate dissociation and therefore the reservoir heat is consumed heavily in the later stages of the buck development. The more branches there are, the more heat energy is consumed by hydrate dissociation, and the faster the hydrate dissociation rate decreases in the late stage of depressurization development. It can be seen in Figure 5b that the initial hydrate mass is 1.15 × 10⁹ kg. At the end of the simulation, the remaining hydrate mass corresponding to the four schemes is 8.29 × 10⁸ kg, 7.37 × 10⁸ kg, 6.72 × 10⁸ kg, and 6.15 × 10⁸ kg, respectively. The dissociation rates of the hydrate are 27.9%, 35.9%, 41.6%, and 46.5%. It can be seen from these results that the more branches of the fishbone well, the higher the hydrate dissociation rate, but the hydrate dissociation rate of all schemes is lower than 50%. In the later stage of depressurization development, the combined development method of heat injection and depressurization is expected to further provide sufficient heat energy for the hydrate dissociation and promote the hydrate dissociation.

3.3.3. Evolution of the Physical Field

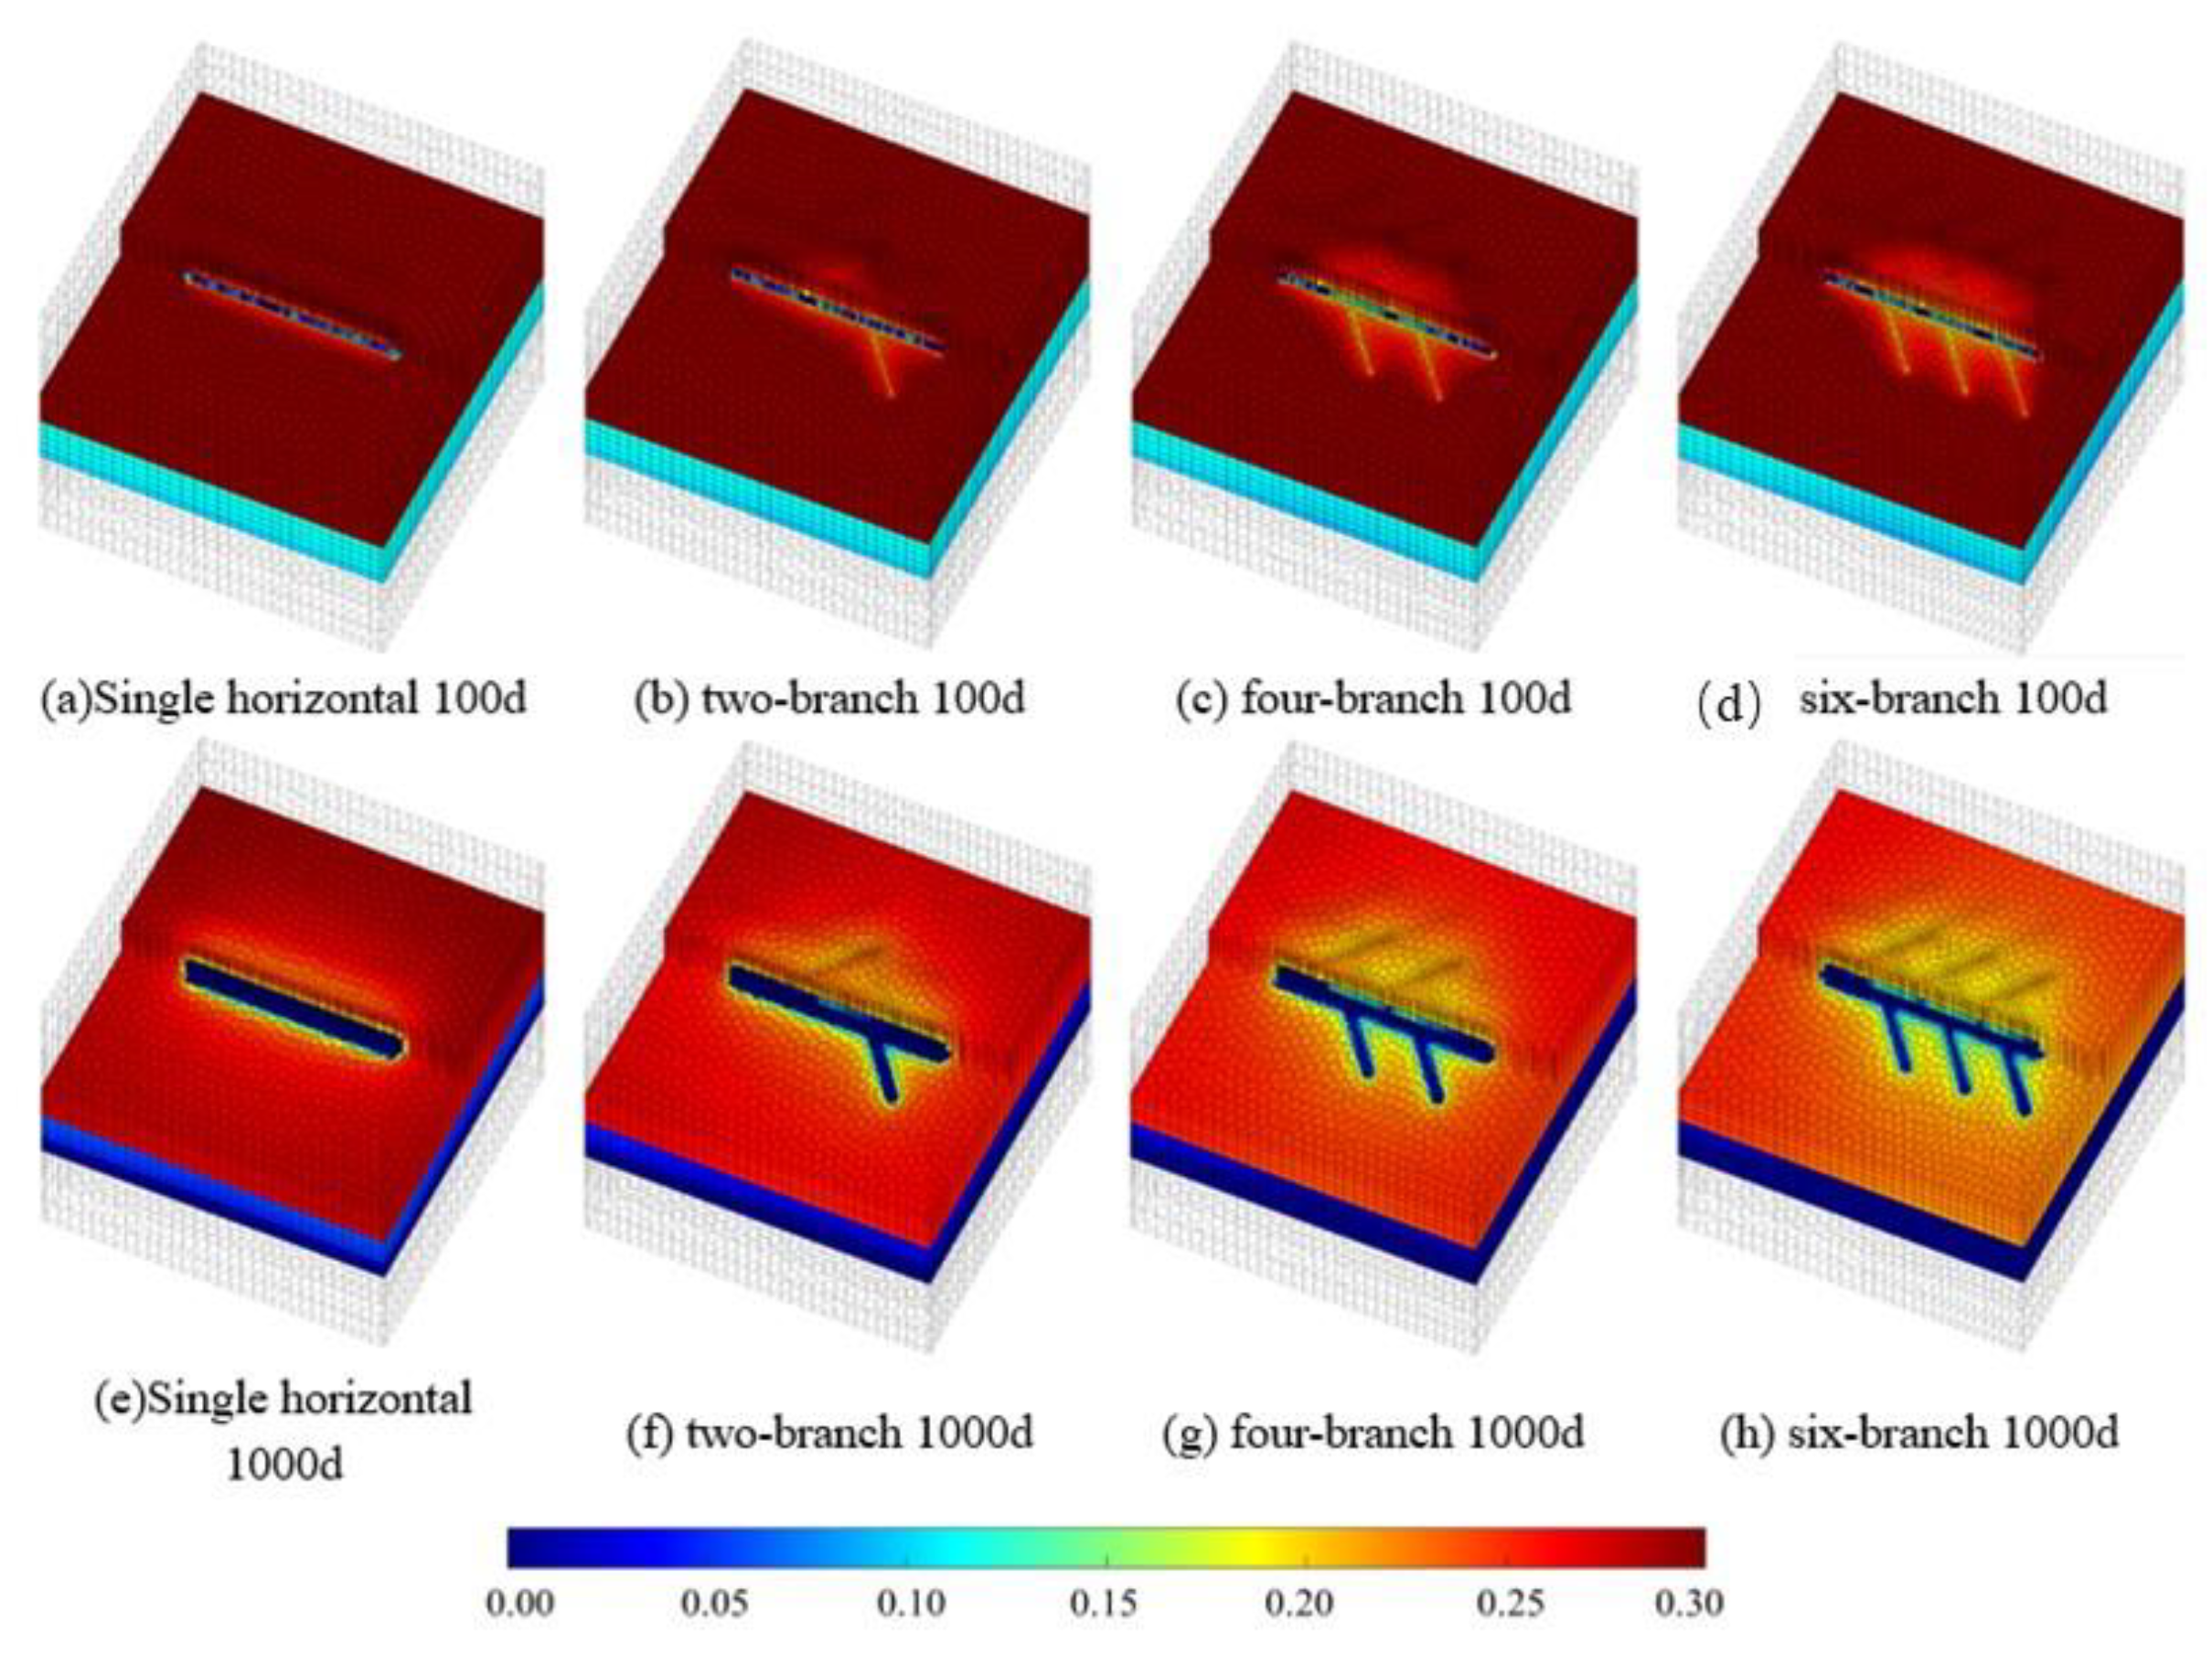
Figure 6, Figure 7 and Figure 8, respectively, show the comparison of temperature, pressure, and hydrate saturation fields in the depressurization development process of fishbone wells with different numbers of branches. As can be seen in Figure 6, for a single horizontal well, the pressure-drop area only expands from the vicinity of the main shaft, while for a multi-branch horizontal well, the formation around each branch also shows obvious pressure drop. A comparison of Figure 7a,d shows that the pressure-drop range of the six-branch fishbone well is significantly higher than that of the horizontal well without branches, and the pressure-drop range is also relatively high. At the end of the simulation, there is a substantial reduction in the whole simulation range. However, the pressure in the area far away from the wellbore is still significantly higher than the set bottomhole pressure after 1000 days of depressurized development of a single horizontal well.
Since the decomposition of hydrates absorbs a large amount of heat, it can be seen in Figure 7 that the distribution of the temperature field and the distribution of the pressure field are similar, i.e., the low-temperature zone corresponding to the unbranched horizontal well is mainly near the horizontal wellbore, and the temperature in the area away from the horizontal wellbore is still higher at the end of the simulation. The higher the number of branches, the more pronounced the drop in temperature of the hydrate reservoir. For the six-branch fishbone well scheme, the temperature of the whole hydrate reservoir decreased significantly at the end of the simulation. However, due to the existence of a geothermal gradient, and the fact that the free gas layer does not contain hydrates, it can be seen that the upper and lower temperatures of the reservoir are very different. At the end of the simulation, the free gas layer at the bottom still has a high temperature.
As can be seen in Figure 8, in the hydrate layer, the hydrate decomposition area is mainly located around the wellbore, and the more branches there are, the larger the range of hydrate decomposition will be. At the end of the simulation, the hydrate in the mixed layer of each scheme was nearly completely decomposed. This was because, on the one hand, the decrease of reservoir pressure leads to hydrate decomposition; on the other hand, the free gas in the gas layer will carry heat into the mixed layer when it returns upward and promote hydrate decomposition. However, for the hydrate layer, there is still a large amount of remaining hydrate in the area far away from the wellbore at the end of the simulation.

4. Conclusions

In this paper, a PEBI unstructured grid is used to establish a grid system for depressurizing the gas hydrate reservoir in the multi-branch fishbone well, and a numerical simulation model is established according to the basic geological parameters of the gas hydrate reservoir in the Shenhu area of the South China Sea. By using Tough + Hydrate software, this paper compares the productivity and physical field change in the fishbone well with different branching numbers. The main conclusions are as follows:
(1)
The PEBI unstructured grid can ensure the orthogonality of the grids as much as possible while adapting to the complex shape of the fishbone well. Compared with the conventional Cartesian grid system and corner grid system, the PEBI unstructured grid can effectively avoid the grid distortion caused by complex well or complex boundaries and ensure the convergence of the simulation;
(2)
The multi-branch fishbone well can effectively increase the contact area between wellbore and reservoir, promote the rapid production of primary water and the rapid reduction of reservoir pressure in the initial stage of depressurization, and promote the decomposition of the hydrate and the upward return of free gas in gas and mixed layers. Compared with a single horizontal well, the cumulative gas production of the six-branch fishbone well increases by 59.3%. Therefore, using the multi-branch fishbone well depressurization to develop the Class I gas hydrate reservoir can effectively improve the productivity and development effect;
(3)
The more branches of the fishbone well, the higher the rate of hydrate decomposition. However, due to the large amount of heat absorption caused by hydrate decomposition, the hydrate decomposition rate decreases rapidly after the heat energy in the reservoir is consumed in the late stage of development. The simulation results show that the hydrate decomposition rate of all schemes is lower than 50%. Therefore, in the later stage of depressurization development, the combined development method of heat injection and depressurization is expected to further provide sufficient heat energy for hydrate decomposition and thus promote the decomposition of the hydrate.

Funding

This research was funded by China Petroleum and Chemical Corporation grant number P20040-4 and by Sinopec Excellent Youth Innovation Fund Project grant number p20025.

Data Availability Statement

Not applicable.

Acknowledgments

This work was supported by China Petroleum and Chemical Corporation for financial support (Grant No. P20040-4), and Sinopec Excellent Youth Innovation Fund Project (p20025).

Conflicts of Interest

The author declares no conflict of interest.

References

  1. Lu, S. A global survey of gas hydrate development and reserves: Specifically in the marine field. Renew. Sustain. Energy Rev. 2015, 41, 884–900. [Google Scholar] [CrossRef]
  2. Wei, J.; Fang, Y.; Lu, H.; Lu, J.; Liang, J.; Yang, S. Distribution and characteristics of natural gas hydrates in the Shenhu Sea Area, South China Sea. Mar. Pet. Geol. 2018, 98, 622–628. [Google Scholar] [CrossRef]
  3. Liu, Y.; Hou, J.; Zhao, H.; Liu, X.; Xia, Z. A method to recover natural gas hydrates with geothermal energy conveyed by CO2. Energy 2018, 144, 265–278. [Google Scholar] [CrossRef]
  4. Li, Q.; Wang, F.; Wang, Y.; Bai, B.; Zhang, J.; Lili, C.; Sun, Q.; Wang, Y.; Forson, K. Adsorption behavior and mechanism analysis of siloxane thickener for CO2 fracturing fluid on shallow shale soil. J. Mol. Liq. 2023, 276, 121394. [Google Scholar] [CrossRef]
  5. Li, S.; Wu, D.; Wang, X.; Hao, Y. Enhanced gas production from marine hydrate reservoirs by hydraulic fracturing assisted with sealing burdens. Energy 2021, 232, 120889. [Google Scholar] [CrossRef]
  6. Anderson, B.J.; Kurihara, M.; White, M.D.; Moridis, G.J.; Wilson, S.J.; Pooladi-Darvish, M.; Gaddipati, M.; Masuda, Y.; Collett, T.S.; Hunter, R.B.; et al. Regional long-term production modeling from a single well test, Mount Elbert Gas Hydrate Stratigraphic Test Well, Alaska North Slope. Mar. Pet. Geol. 2011, 28, 493–501. [Google Scholar] [CrossRef]
  7. Yamamoto, K.; Wang, X.; Tamaki, M.; Suzuki, K. The second offshore production of methane hydrate in the Nankai Trough and gas production behavior from a heterogeneous methane hydrate reservoir. RSC Adv. 2019, 9, 25987. [Google Scholar] [CrossRef] [PubMed] [Green Version]
  8. Moridis, G. Numerical studies of gas production from class 2 and class 3 hydrate accumulations at the Mallik Site, Mackenzie Delta, Canada. SPE Reserv. Eval. Eng. 2004, 7, 175–183. [Google Scholar] [CrossRef]
  9. Hou, J.; Xia, Z.; Li, S.; Zhou, K.; Lu, N. Operation parameter optimization of a gas hydrate reservoir developed by cyclic hot water stimulation with a separated-zone horizontal well based on particle swarm algorithm. Energy 2016, 96, 581–591. [Google Scholar] [CrossRef]
  10. Huang, X.; Zhang, L.; Cai, W.; He, J.; Lu, H. Study on the characteristic spectral bands of water molecule and hydrogen bond of methane hydrate. Chem. Eng. Sci. 2022, 248, 117117. [Google Scholar] [CrossRef]
  11. Zhang, L.; Huang, X.; He, J.; Cen, X.; Liu, Y. Parameter optimization study of gas hydrate reservoir development based on a surrogate model assisted particle swarm algorithm. Geofluids 2022, 203, 2056323. [Google Scholar] [CrossRef]
  12. Nair, V.; Ramesh, S.; Ramadass, G.; Sangwai, J. Influence of thermal stimulation on the methane hydrate dissociation in porous media under confined reservoir. J. Pet. Sci. Eng. 2016, 147, 547–559. [Google Scholar] [CrossRef]
  13. Yu, T.; Guan, G.; Wang, D.; Song, Y.; Abudula, A. Gas Production Enhancement from a multilayered hydrate reservoir in the south china sea by hydraulic fracturing. Energy Fuels 2021, 35, 12104–12118. [Google Scholar] [CrossRef]
  14. Kowalsky, M.; Moridis, G. Comparison of kinetic and equilibrium reaction models in simulating gas hydrate behavior in porous media. Energy Convers. Manag. 2007, 48, 1850–1863. [Google Scholar] [CrossRef] [Green Version]
  15. Li, G.; Moridis, G.; Zhang, K.; Li, X. Evaluation of gas production potential from marine gas hydrate deposits in Shenhu Area of South China Sea. Energy Fuels 2010, 24, 6018–6033. [Google Scholar] [CrossRef]
  16. Li, J.-F.; Ye, J.-L.; Qin, X.-W.; Qiu, H.-J.; Wu, N.-Y.; Lu, H.-L.; Xie, W.-W.; Lu, J.-A.; Peng, F.; Xu, Z.-Q.; et al. The first offshore natural gas hydrate production test in South China Sea. China Geol. 2018, 1, 5–16. [Google Scholar] [CrossRef]
  17. Ye, J.-L.; Survey, M.O.N.R.C.G.; Qin, X.-W.; Xie, W.-W.; Lu, H.-L.; Ma, B.-J.; Qiu, H.-J.; Liang, J.-Q.; Lu, J.-A.; Kuang, Z.-G.; et al. The second natural gas hydrate production test in the South China Sea. China Geol. 2020, 3, 197–209. [Google Scholar] [CrossRef]
  18. Liu, Y.; Hou, J.; Zhao, H.; Liu, X.; Xia, Z. Numerical simulation of simultaneous exploitation of geothermal energy and natural gas hydrates by water injection into a geothermal heat exchange well. Renew. Sustain. Energy Rev. 2019, 109, 467–481. [Google Scholar] [CrossRef]
  19. Liu, Y.; Li, G.; Chen, J.; Bai, Y.; Hou, J.; Xu, H.; Zhao, E.; Chen, Z.; He, J.; Zhang, L.; et al. Numerical simulation of hydraulic fracturing-assisted depressurization development in hydrate bearing layers based on discrete fracture models. Energy 2023, 263, 126146. [Google Scholar] [CrossRef]
  20. Wang, H.; Zhang, L.; He, J.; Zhou, T. The Development of natural gas hydrate exploitation technology from perspective of patents. Front. Energy Res. 2022, 10, 860591. [Google Scholar] [CrossRef]
  21. Huang, X.; Li, Z.; Zhang, L.; He, J.; Lu, H. Molecular insights into the effect of nitrogen bubbles on the formation of tetrahydrofuran hydrates. Molecules 2022, 27, 4945. [Google Scholar] [CrossRef]
  22. Sasaki, K.; Ono, S.; Sugai, Y.; Ebinuma, T.; Narita, H.; Yamaguchi, T. Gas production system from methane hydrate layers by hot water injection using dual horizontal wells. J. Can. Pet. Technol. 2009, 48, 21–26. [Google Scholar] [CrossRef]
  23. Li, X.; Yang, B.; Duan, L.; Li, G.; Huang, N.; Zhang, Y. Experimental study on gas production from methane hydrate in porous media by SAGD method. Appl. Energy 2013, 112, 1233–1240. [Google Scholar] [CrossRef]
  24. Feng, Y.; Chen, L.; Suzuki, A.; Kogawa, T.; Okajima, J.; Komiya, A.; Maruyama, S. Enhancement of gas production from methane hydrate reservoirs by the combination of hydraulic fracturing and depressurization method. Energy Convers. Manag. 2019, 184, 194–204. [Google Scholar] [CrossRef]
  25. Choudhary, N.; Phirani, J. Effect of well configuration, well placement and reservoir characteristics on the performance of marine gas hydrate reservoir. Fuel 2022, 310, 122377. [Google Scholar] [CrossRef]
  26. Moridis, G.; Silpngarmlert, S.; Reagan, M.; Collett, T.; Zhang, K. Gas production from a cold, stratigraphically-bounded gas hydrate deposit at the Mount Elbert Gas Hydrate Stratigraphic Test Well, Alaska North Slope: Implications of uncertainties. Mar. Pet. Geol. 2011, 28, 517–534. [Google Scholar] [CrossRef]
  27. Hassen, A.; Elkatatny, S.; Abdulraheem, A. Application of artificial intelligence techniques to predict the well productivity of fishbone wells. Sustainability 2019, 11, 6083. [Google Scholar] [CrossRef] [Green Version]
  28. Zhou, X.; Feng, F.; Zhang, L. Improving Steam-Assisted Gravity Drainage performance in oil sands with a top water zone using polymer injection and the fishbone well pattern. Fuel 2016, 184, 449–465. [Google Scholar] [CrossRef]
  29. Li, Q.; Wu, J. Factors affecting the lower limit of the safe mud weight window for drilling operation in hydrate-bearing sediments in the Northern South China Sea. Geomech. Geophys. Geo-Energy Geo-Resour. 2022, 8, 82. [Google Scholar] [CrossRef]
  30. Zhang, Y.; Hu, X.; Wu, X.; Li, G.; Li, J.; Tian, S.; Shen, K. A study of swirling jet drilling and its specific energy for hydrate-bearing sediments. SPE J. 2022, 04, 1–15. [Google Scholar] [CrossRef]
  31. Moridis, G.J.; Collett, T.S.; Pooladi-Darvish, M.; Hancock, S.H.; Santamarina, C.; Boswell, R.; Kneafsey, T.J.; Rutqvist, J.; Kowalsky, M.B.; Reagan, M.T.; et al. Challenges, uncertainties, and issues facing gas production from gas-hydrate deposits. SPE Reserv. Eval. Eng. 2011, 14, 76–112. [Google Scholar] [CrossRef] [Green Version]
  32. Konno, Y.; Masuda, Y.; Hariguchi, Y.; Kurihara, M.; Ouchi, H. Key factors for depressurization-induced gas production from oceanic methane hydrates. Energy Fuels 2010, 24, 1736–1744. [Google Scholar] [CrossRef]
  33. Berge, R.; Klemetsdal, Ø.; Lie, K. Unstructured Voronoi grids conforming to lower dimensional objects. Comput. Geosci. 2019, 23, 169–188. [Google Scholar] [CrossRef]
  34. Mlacnik, M.; Louis, J. Durlofsky. Sequentially adapted flow-based PEBI grids for reservoir simulation. SPE J. 2006, 11, 317–327. [Google Scholar] [CrossRef]
  35. Zhang, L.; Li, D.; Wang, L.; Lu, D. Simulation of gas transport in tight/shale gas reservoirs by a multicomponent model based on PEBI grid. J. Chem. 2015, 2015, 572434. [Google Scholar] [CrossRef] [Green Version]
Figure 1. Comparison between Konno’s model and the model in this paper.
Processes 11 00771 g001
Figure 2. (a) Single horizontal well, (b) two-branch fishbone well, (c) four-branch fishbone well, (d) six-branch fishbone well. PBEI unstructured meshing.
Processes 11 00771 g002
Figure 3. (a) Reservoir and well location setting, (b) six-branch fishbone well. Well location setting and 3D grid generation.
Processes 11 00771 g003
Figure 4. (a) Gas production, (b) water production. Production of fishbone well with different branches using depressurization.
Processes 11 00771 g004
Figure 5. (a) Hydrate dissociation rate, (b) hydrate mass.
Processes 11 00771 g005
Figure 6. Pressure field in depressurized development of fishbone well with different number of branches.
Processes 11 00771 g006
Figure 7. Temperature field in depressurized development of fishbone well with different number of branches.
Processes 11 00771 g007
Figure 8. Hydrate saturation field in depressurized development of fishbone well with different number of branches.
Processes 11 00771 g008
Table 1. Hydrate deposit properties and initial conditions in the Shenhu area [17].
ParametersValueParametersValue
Hydrate layer water saturation0.69Gas layer permeability/mD6.8
Hydrate layer hydrate saturation0.31Hydrate layer average temperature/°C12.73
Mixed layer water saturation0.751Hydrate layer average pressure/MPa12.92
Mixed layer gas saturation0.132Mixed layer average temperature/°C14.31
Mixed layer hydrate saturation0.117Mixed layer average pressure/MPa13.98
Gas layer water saturation0.927Gas layer average temperature/°C15.84
Gas layer gas saturation0.073Gas layer average pressure/MPa14.89
Salt mass fraction0.0305SirG0.05
Hydrate layer porosity0.373Ng2.0
Mixed layer porosity0.346SirW0.3
Gas layer porosity0.347Nw2.0
Hydrate layer permeability /mD2.38Pressure gradient/(MPa/100 m)1.0
Mixed layer permeability /mD6.63Temperature gradient/(°C/100 m)4.5
Disclaimer/Publisher’s Note: The statements, opinions and data contained in all publications are solely those of the individual author(s) and contributor(s) and not of MDPI and/or the editor(s). MDPI and/or the editor(s) disclaim responsibility for any injury to people or property resulting from any ideas, methods, instructions or products referred to in the content.