Article

Feasibility Analysis for the Direct Hydration of 1-Octene in a Catalytic Distillation Process Using Residual Curve Maps

College of Chemistry and Chemical Engineering, Yantai University, Yantai 264005, China
*
Author to whom correspondence should be addressed.
Processes 2023, 11(3), 777; https://doi.org/10.3390/pr11030777
Submission received: 6 February 2023 / Revised: 28 February 2023 / Accepted: 2 March 2023 / Published: 6 March 2023
(This article belongs to the Section Chemical Processes and Systems)

Abstract

:
The very useful organic solvent 2-octanol is widely employed in the industry, and the direct hydration of olefins is an important method for its production. However, a slow transfer rate during a reaction due to the poor mutual solubility of the reactants is a problem; a cosolvent can be used to solve it. In this study, the feasibility of using the direct hydration of 1-octene via a catalytic distillation process using 1,4-dioxane as a cosolvent was investigated. First, the COSMOtherm program was used to identify and screen many typical cosolvents. Subsequently, the kinetics of the direct hydration reaction of 1-octene using 1,4-dioxane as a cosolvent and an HZSM-5 molecular sieve as the catalyst were determined experimentally. Finally, kinetic and thermodynamic models were utilized to create non-reactive and reactive residual curve maps to assess the feasibility of proceeding with the reaction. Applying a suitable Damköhler number (Da) value and the residual curve changes demonstrated that proceeding with the process was reasonable and feasible. For 0 < Da < 0.03, the reaction kinetics drove the process and 2-octanol was produced via a reaction distillation column procedure. Lastly, two conceptual design processes for the synthesis process of 2-octanol catalytic distillation were proposed and the related analysis carried out.

1. Introduction

The very useful organic solvent 2-octanol is widely employed in the synthesis of defoamers, plasticizers, surfactants, agricultural emulsifiers, and mineral flotation agents, and to improve lubricants, among other uses. In addition, oxidizing 2-octanol with nitric acid to produce hexanoic acid and hexyl hexanoate has been industrially applied. With its increasing use in domestic applications and the continual improvement of environmental protection standards, the market demand for 2-octanol is rapidly expanding. Presently, there are three main production routes for 2-octanol: (1) castor oil cracking, (2) 2-octanone hydrogenation, and (3) carbonyl synthesis. While the latter is the most extensively used, the process is more complex and dangerous than the others [1]. Though the product obtained via the hydrogenation of 2-octanone is highly pure, the disadvantages of the process are high cost and harsh reaction conditions [2]. In contrast, while the castor oil cracking process is inexpensive, product purity is low and the application range is limited [3]. Due to increasing concern about environmental pollution, the direct hydration of 1-octene via a green reaction route is the most desirable.
The direct hydration of olefins is an important method for the industrial production of alcohols. The majority of hydration reactions documented in the literature are for low-carbon or cyclic olefins, as well as certain complex olefins such as α,β-pinene and camphene. However, there has been little research on the hydration of high-carbon olefins to produce alcohols. The direct hydration of olefins has issues that hinder their broad applicability, such as a slow reaction rate and low mutual solubility of olefins and water. Nevertheless, this process is essential for the direct hydration of high-carbon olefins to produce alcohols.
Although little research has been conducted on the hydration of 1-octene, the influence of a cosolvent on the hydration reaction of cyclohexene used to solve the problem of the slow reaction rate with olefins has been reported. Panneman and Beenackers [4,5,6] analyzed the effect of using cyclobutane sulfone on the kinetics of the cyclohexene hydration reaction, with the strongly acidic macroporous cation-exchange resin XE-307 as the catalyst used in this system; their results showed that the addition of cyclobutane sulfone effectively increased the solubility of cyclohexene, which hastened the reaction rate. Shan et al. [7] examined the effect of ethylene glycol on the cyclohexene hydration reaction catalyzed by HZSM-5 and found that, although it did not change the mechanism, it reduced the activation energy, water, and cyclohexanol adsorption constants. Since alcohols with 1–10 carbon atoms, ethers, phenol, halogenated hydrocarbons, fluoro-alcohols, acetone, methyl ethyl ketone, benzoic acid, aliphatic carboxylic acids, cycloalkanones, aromatic heterocyclic carboxylic acids, and other cosolvents can be used in the cyclohexene hydration process, a suitable cosolvent needs to be obtained via screening.
In response to the problem of poor equilibrium conversion, researchers have used the reactive distillation process; mathematical modeling for it was rapidly developed in the 1970s and 1980s. For example, although Krishnamurthy and Taylor’s [8] non-equilibrium stage model is accurate in its conclusions, it suffers from the disadvantages of being complex and computationally intensive. The harsh operating conditions are especially not conducive to the preliminary design. Because of the advantages of using a graphical technique, such as intuitiveness, conciseness, and speed, to develop reaction distillation column (RDC) processes, their use has steadily become more prevalent since the mid-1980s. The conventional McCabe–Thiele and Ponchon–Savarit graphical approaches are used to determine the reaction interval in the column by adjusting the amount of catalyst on the theoretical plate for a given reaction conversion. However, these two approaches are only applicable to binary reaction mixes and can only serve as a starting point for multivariate reaction systems [9].
The main graphical methods currently available are the traditional graphical method, the zone of availability method and the residual curve method. The traditional graphical method is an easy-to-understand visual plate-by-plate calculation process that allows you to see the influence of the feed position and reaction section area in the tower. However, the method has major limitations and can currently only be applied to isomerisation and decomposition reactions, and is limited by the inherent properties of the graph. The advantage of the region method is that it does not require a superstructure to be given, but its application is limited by the number of dimensions due to the inherent nature of the graph. The residual curve method is one of the main preliminary design methods being investigated, which is not only applicable to a wide range of different reaction systems, but also addresses, to some extent, the inherent limitations of the graphical method by way of conversion composition.
In 1985, Dongen and Doherty [10] applied a graphical method for ordinary distillation to other processes, such as azeotropic and extractive distillation, and achieved good results. Barbosa and Doherty [11] used the notion of reaction composition to compute reaction residual curves and investigate the coupling of reactions and phase equilibria. In 1988, Barbosa and Doherty [12] derived differential equations for simple distillation processes involving homogeneous reactions by using transforming compositional variables, and demonstrated that for both, the original boundary of distillation can be removed or a new boundary can be generated. Barbosa and Doherty [13,14] presented the boundary design approach including design equations for each section of an RDC for varied feeds to offer a theoretical foundation for its integrated design. In 1997, Thiel et al. [15,16] used residual curves to investigate the non-homogeneous catalytic reaction processes for methyl tert-butyl ether, methyl tert-pentyl ether, and ethyl tert-butyl ether production and concluded that the main influencing factors in the residual curves were the operating pressure and the Damköhler number (Da). Venimadavan [17] utilized Da to represent the extent of the response and produced a mathematical equation for the residual curve.
Reaction residual curves are increasingly being used to build RDCs. Zheng et al. [18] investigated residual curves based on the synthesis of ethyl acetate; the analysis indicated that the process can produce highly pure ethyl acetate. Binous [19] investigated the residual curve of an esterification process under atmospheric pressure and developed a technique for calculating it. Claudia et al. [20] suggested a simpler technique for calculating a system’s phase equilibrium and found that the simulation results agreed well with the rigorous calculations. Raphaële et al. [21] proposed a reaction extraction curve based on the reaction residual curve and used it for constructing two-strand feed RDCs. Steyer et al. [22] proposed a process for cyclohexanol using reactive distillation technology in 2002, and assessed its feasibility using reaction residual curves; they revealed that cyclohexanol could be obtained from the bottom of the RDC for Da < 0.109. Khaledi and Bishnoi [23] modeled a cyclohexene hydration process and found that under certain operating conditions, reactive distillation produces highly pure cyclohexanol. Steyer et al. [24,25] used residual curves to analyze the feasibility of an indirect hydration process for cyclohexene using formic acid as a reactive entrainer to produce cyclohexanol and concluded that their process is safer with fewer by-products than the conventional method.
A cosolvent can be used to solve the problem of a slow transfer rate during a reaction due to the poor mutual solubility of the reactants. Zheng et al. [26] added isophorone as a cosolvent to enhance a cyclohexene hydration process and discovered that the trend and path of the reaction residual curve changed considerably for different Da values. The presence of a reaction azeotrope [27] in the system with a relatively large Da value was especially optimal. Qiu et al. [28] confirmed the viability of cyclohexene hydration via an RDC method with an ion exchange resin as the catalyst and 1,4-dioxane as the cosolvent using residual curves. Ye et al. [29] proposed a reactive distillation process with side reactors for cyclohexene hydration to cyclohexanol after considering catalysts’ effectiveness and volume fraction in an RDC. However, the number of side reactors in parallel was quite large.
In the present study, based on a previous study, cosolvents were first screened by using COSMOtherm, after which 1,4-dioxane was chosen. The kinetics of the direct hydration reaction of 1-octene using 1,4-dioxane as the cosolvent were then evaluated experimentally. The experimental data were fitted using a pseudo-homogeneous model to obtain the kinetic equations that provided the kinetic parameters for the feasibility analysis. The UNIFAC model was used to predict the missing thermodynamic parameters in the 1-octene hydration system. Finally, the kinetic and thermodynamic parameters were used in the model comprising residual curve maps for the process feasibility study. For the first time, the feasibility of using 1,4-dioxane as a cosolvent for the 1-octene hydration reaction in a catalytic distillation system was examined, which could be relevant for the study of other hydration reactions.

2. Theoretical Model

2.1. The Kinetic Model

2.1.1. Selection of the Cosolvent

In the literature, COSMOtherm has been widely used for screening solvents and drug molecules for a variety of reactions. Li et al. [30] used COSMOtherm to screen various organic solvents and ionic liquids for extracting and recovering heavy hydrocarbons more efficiently. Therefore, in the present study, four common cosolvents were screened for the 1-octene hydration system using COSMOtherm. Figure 1 shows that 1,4-dioxane has the best solubilization impact, whereas methanol has the worst. Because of its stable cyclic structure, 1,4-dioxane will not react with any substance under the reaction conditions, and its boiling point is not significantly different from the reactants. Thus, it could be easier to contact the RDC. However, the difference between its boiling point and 2-octanol is large, which makes it easy to separate them. Hence, we selected 1,4-dioxane as the most suitable cosolvent.
The kinetics of the direct hydration reaction of 1-octene catalyzed by using an HZSM-5 molecular sieve and with 1,4-dioxane as the cosolvent were analyzed. The effects of stirring speed, reaction temperature, and catalyst amount on the reaction were examined, from which a kinetic model of the reaction was obtained by fitting the experimental data.

2.1.2. Materials and Methods

1-Octene, 2-octanol, and 1,4-dioxane were obtained from Shanghai McLean Biochemical Technology Co., Ltd. (Shanghai, China); 1-octene and 2-octanol were chemically pure, whereas 1,4-dioxane was analytically pure. Distilled water was self-produced in the laboratory. Ethanol (analytical grade) was obtained from Sinopharm Chemical Reagent Co., Ltd. (Shanghai, China). The HZSM-5 molecular sieve was obtained from the catalyst factory at Nankai University.
An Agilent GC8890 gas chromatograph (Agilent Technologies, Inc, Wlimington, Delaware USA) with a hydrogen flame ionization detector and an HP-5 chromatographic column (30 m × 320 μm × 0.25 μm) was used to detect the sample compositions. The detection and analysis conditions were a detection temperature of 300 °C and a rear inlet temperature of 250 °C. Using temperature programming, an initial temperature of 50 °C was held for 2 min, increased at 20 °C/min to 150 °C, held for 30 s, increased at 20 °C/min to 220 °C, and finally held for 2 min. The carrier gas was N2, the flow rate was 25 mL/min, the split ratio was 20/1, and the injection volume was 1 μL. The sampling time was 13 min. Due to the need to accurately analyze the composition, quantitative analysis was carried out after adding ethanol to the sample vials as an internal standard.

2.1.3. Experimental Procedure

Various proportions of reactant, cosolvent, and catalyst were placed in a stainless-steel reactor, and sealed as shown in Figure 2. The reactor controller was then turned on, and the temperature and rotational speed set. Samples were taken at predetermined times and quantitatively analyzed.
Octanol is produced by the liquid phase reaction of 1-octene and water in the presence of a catalyst according to Equation (1).
Processes 11 00777 i001

2.1.4. The Effect of Diffusion on the Reaction

The catalyst used in this experiment was an HZSM-5 molecular sieve, which is nanoscale in size. Zhang et al. [31] studied the kinetics of solid acid-catalyzed cyclohexene hydration and discovered that grinding the catalyst into smaller particles resulted in somewhat lower cyclohexene conversion and a slower reaction rate. Therefore, the effect of internal diffusion on the hydration reaction catalyzed by using an HZSM-5 molecular sieve can be considered negligible. Thus, only the influence of stirring speed on the reaction needed to be investigated.
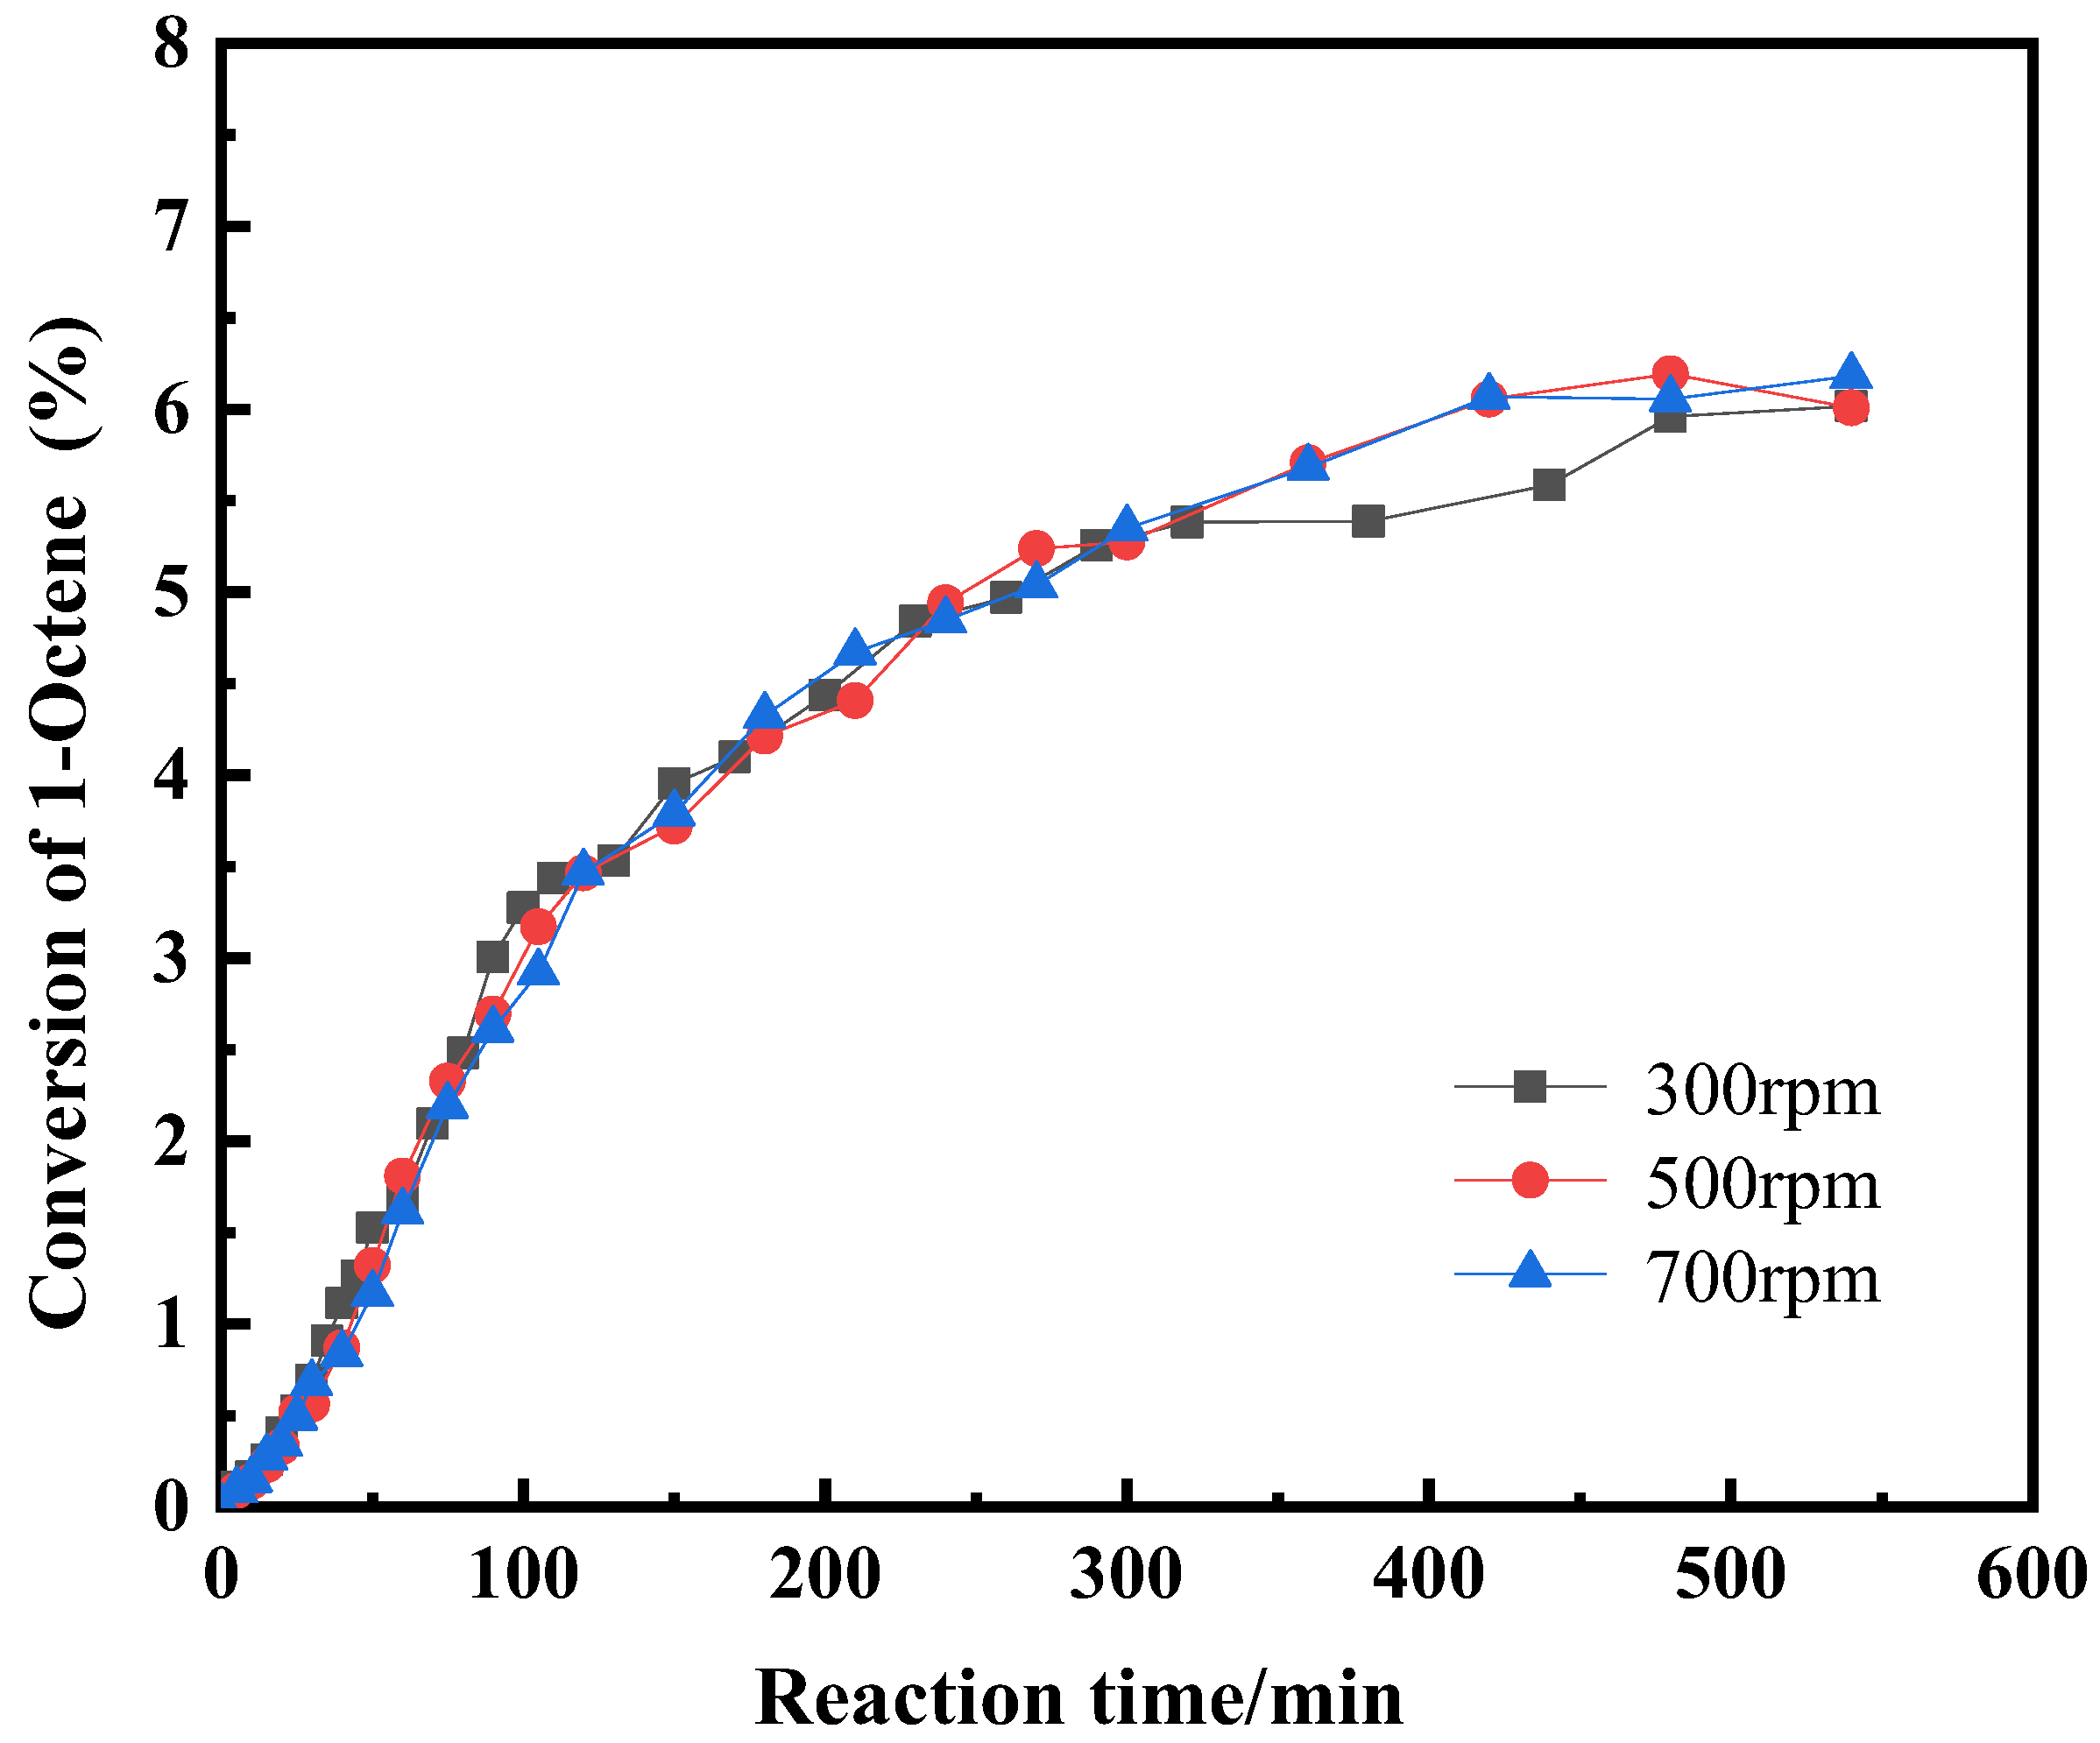
The influence of stirring speed on the reaction was studied at a temperature of 418.15 K, a water-to-1-octene molar ratio of 3:1, a 1,4-dioxane-to-1-octene molar ratio of 5:1, and a catalyst concentration of 13%. As shown in Figure 3, the conversion of 1-octene remained essentially unchanged as the stirring speed increased. Although stirring speed had little influence on the reaction, 500 rpm was chosen to guarantee that the reaction system received adequate agitation.

2.1.5. The Effect of Temperature on the Reaction

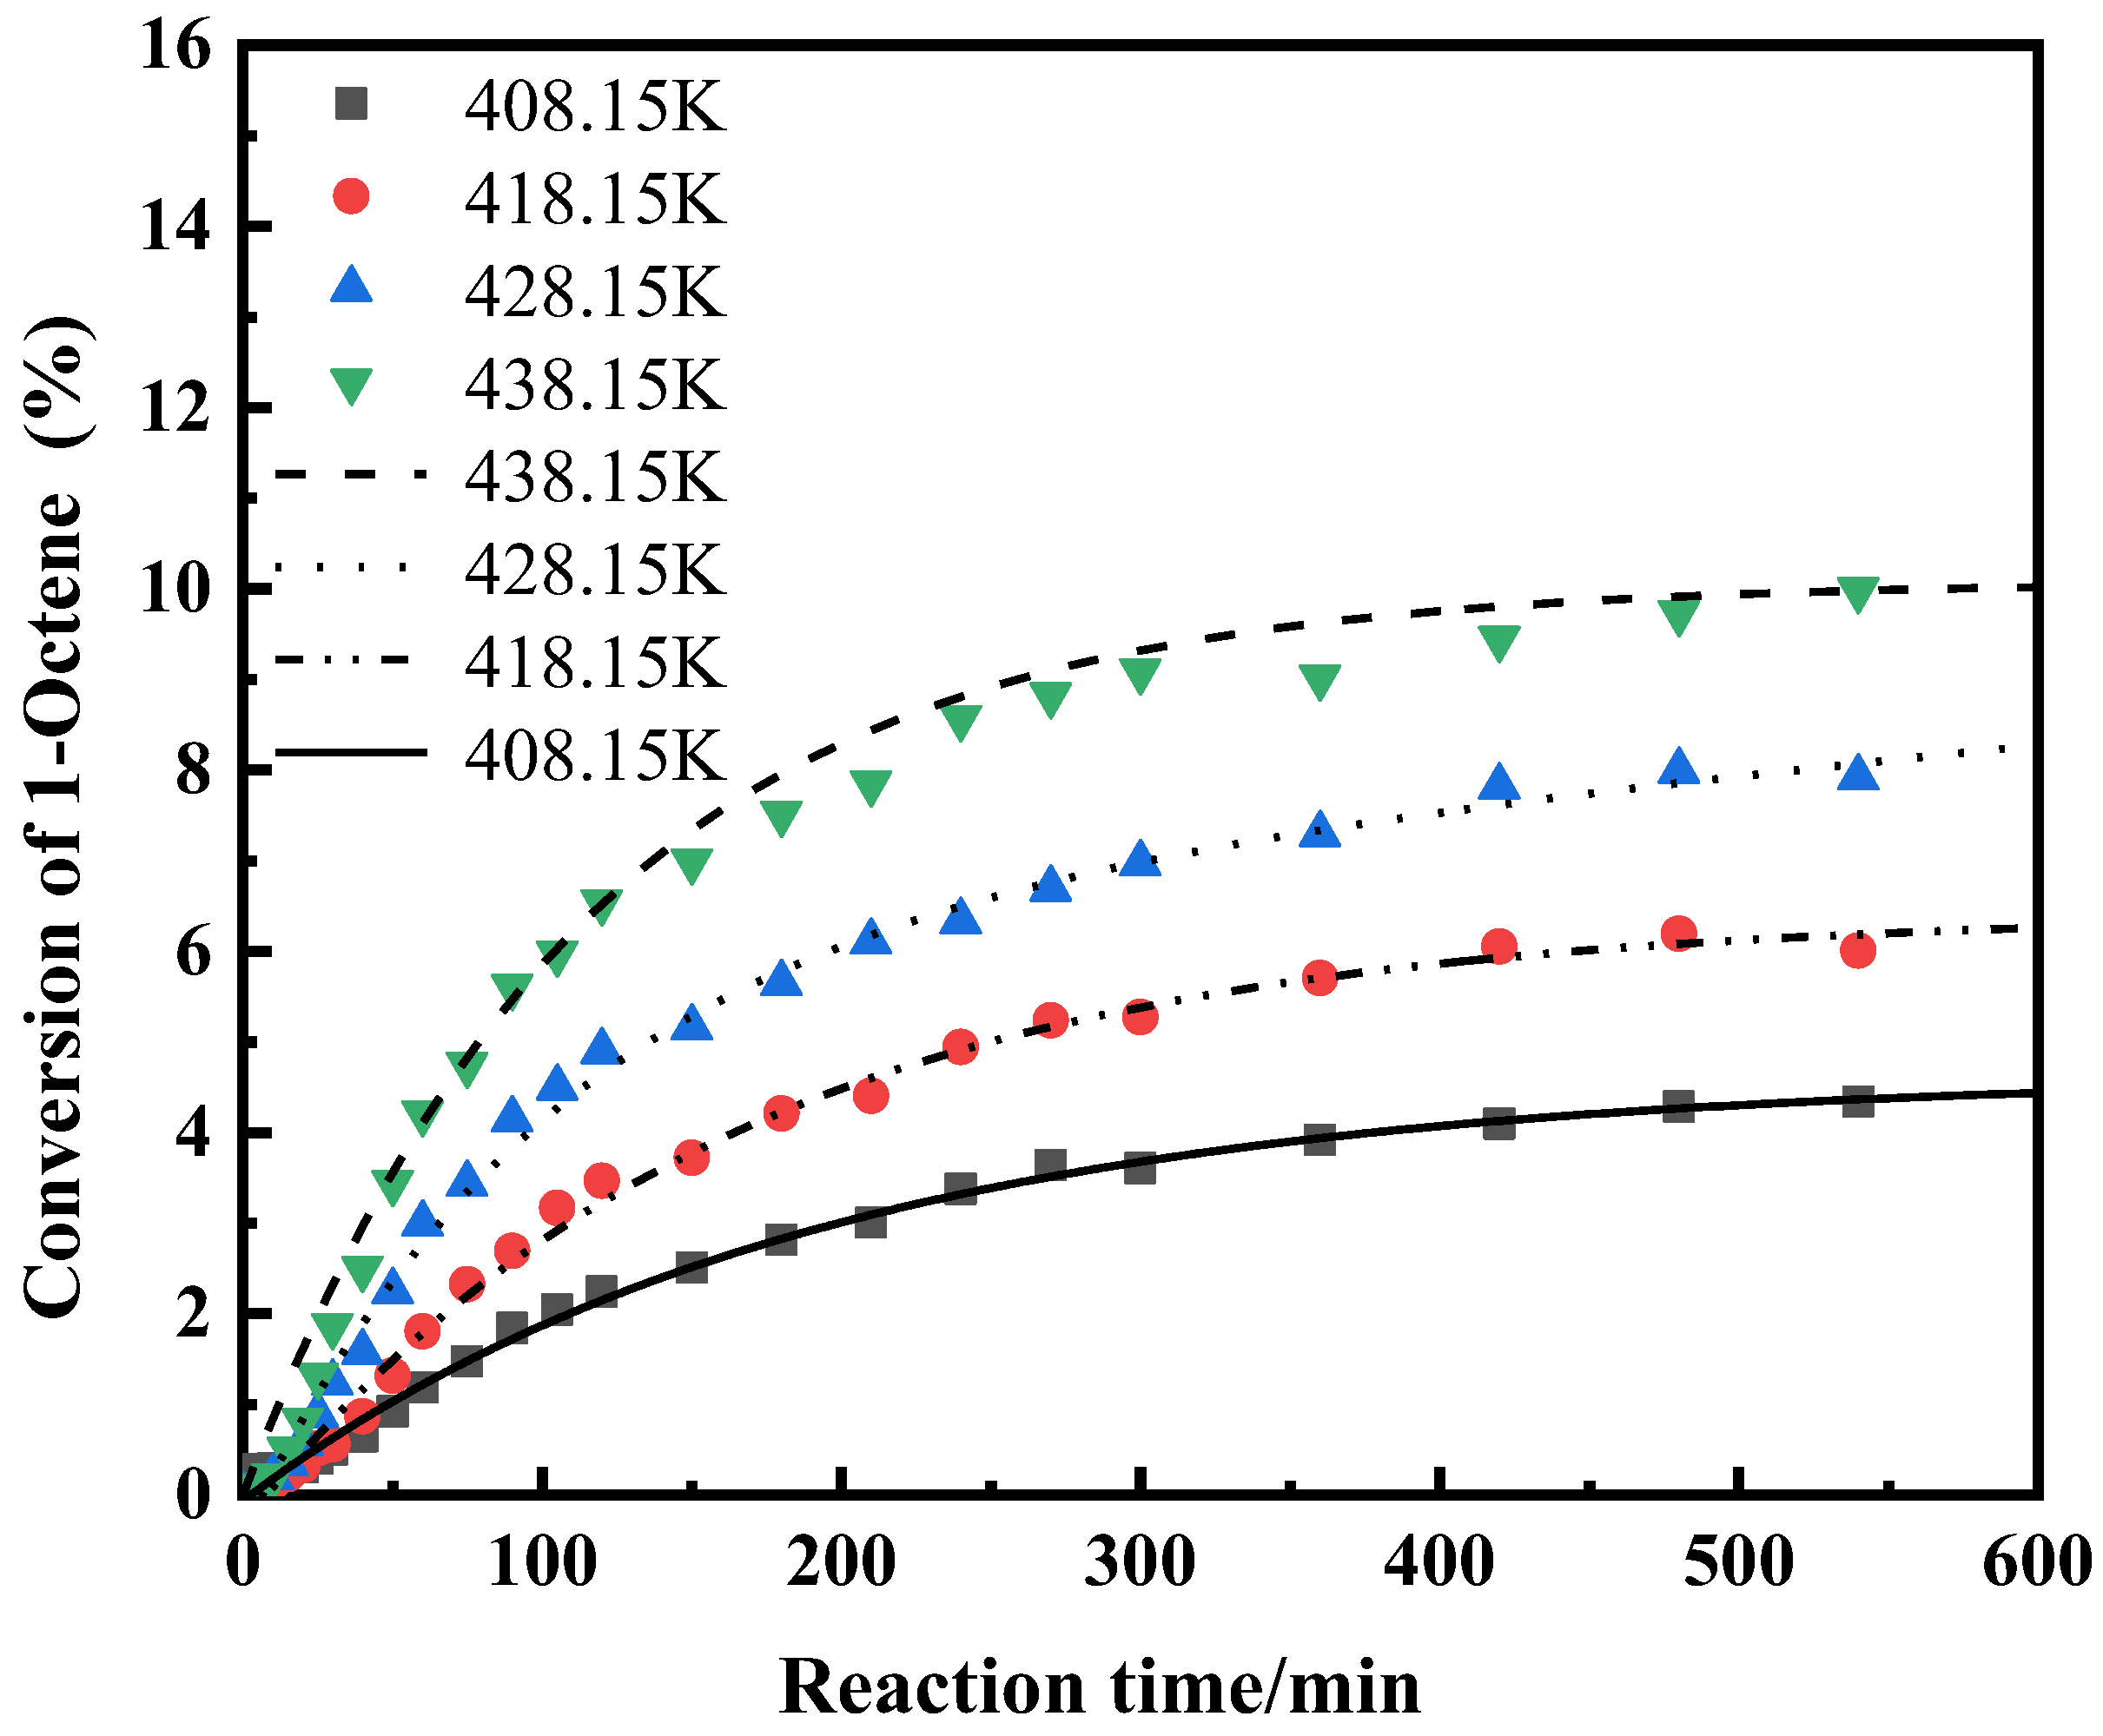
The effect of temperature was analyzed at a stirring speed of 500 rpm, a water-to-1-octene molar ratio of 3:1, a1,4 dioxane-to-1-octene molar ratio of 5:1, and 13% catalyst content. Figure 4 illustrates that the conversion of 1-octene rose with increasing reaction temperature. This is mainly because as the reaction temperature increased, the number of activated molecules per unit volume of reaction solution increased, and thus the chance of an effective collision increased. From the results, 438.15 K was the optimal reaction temperature in the temperature range studied.

2.1.6. The Effect of Catalyst Content on the Reaction

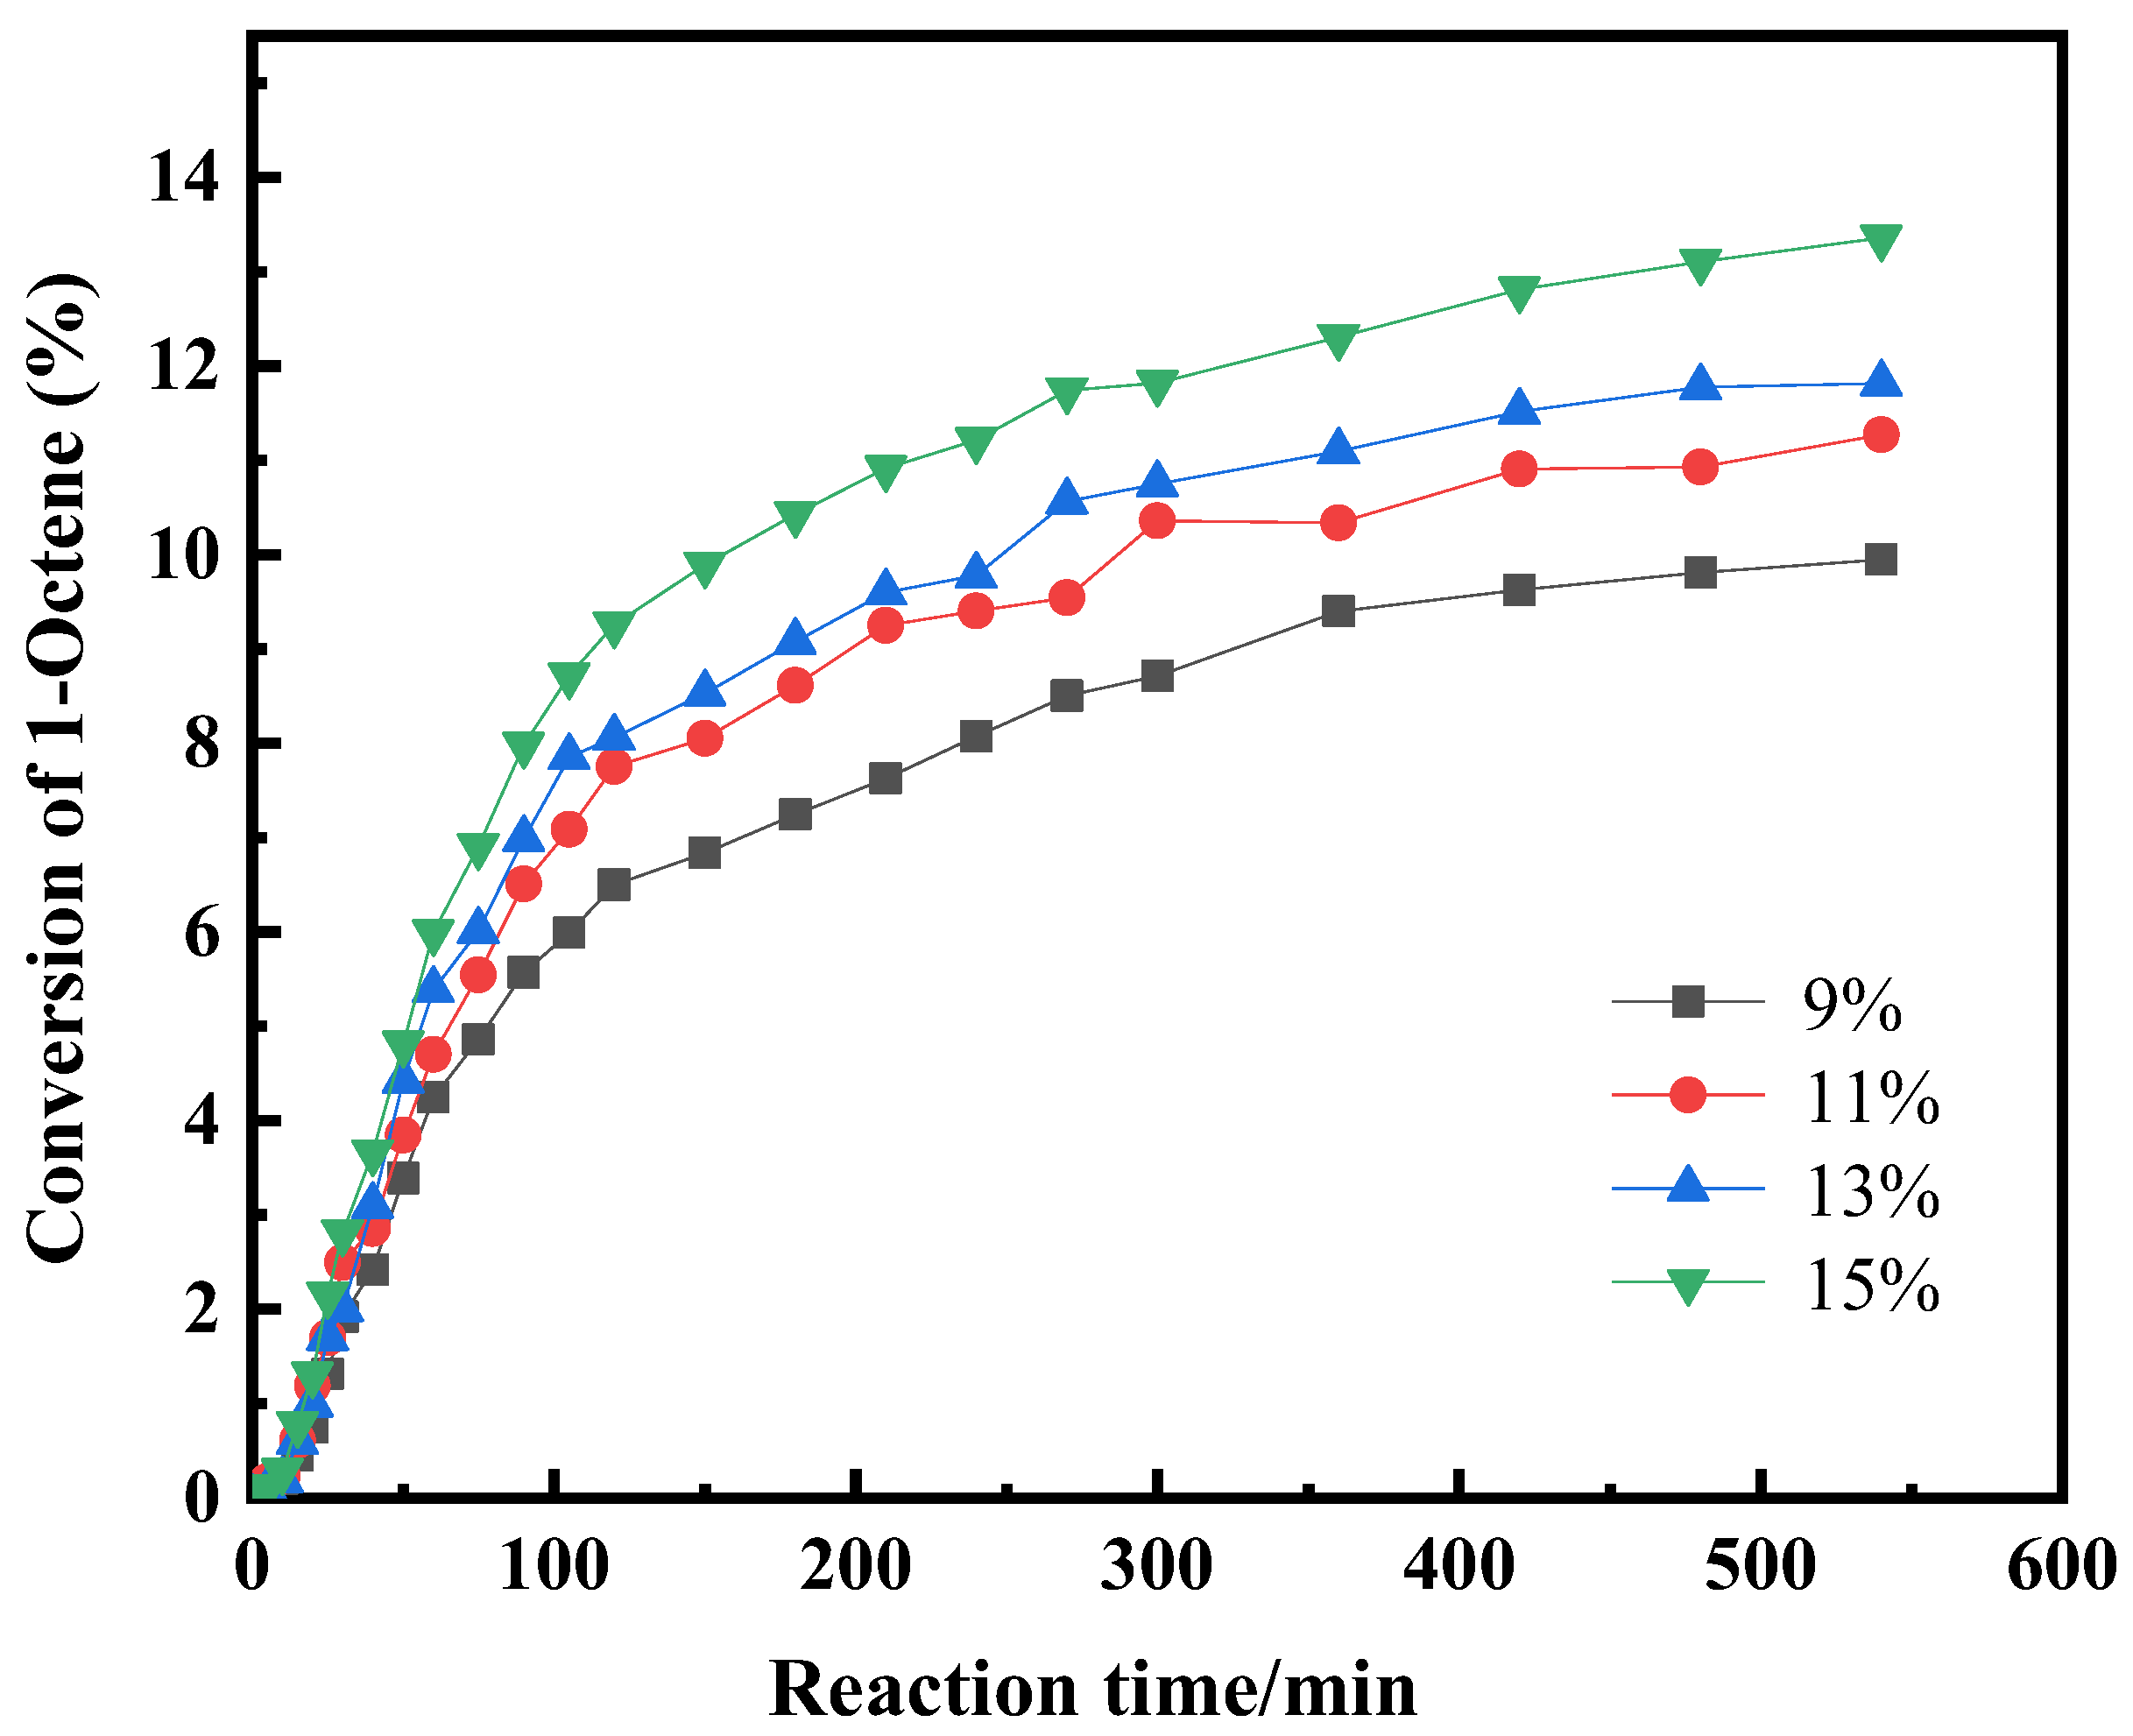
The effect of catalyst content was studied at a reaction temperature of 438.15 K, a stirring speed of 500 rpm, a water-to-1-octene molar ratio of 4:1, and a 1,4 dioxane-to-1-octene molar ratio of 5:1. In Figure 5, it can be seen that the conversion of 1-octene increased with an increasing amount of catalyst. This is primarily because increasing the amount of catalyst increased the number of active centers in the reaction system. Thus, more water or 1-octene molecules can interact with them per unit volume and react with each other, resulting in a quicker reaction rate. The highest conversion of 1-octene was achieved with 15% catalyst content, thus, this was the optimal amount.

2.1.7. Model Parameter Identification and Reliability Verification

It was assumed that the 1-octene hydration reaction catalyzed with an HZSM-5 molecular sieve catalyst and 1,4-dioxane as the cosolvent was homogeneous; therefore, a pseudo-homogeneous reaction model was used to fit the data.
The reaction kinetic model is as follows:
r n o l = k a     C e n e     C w a t e r   k b     C n o l
K = k a k b
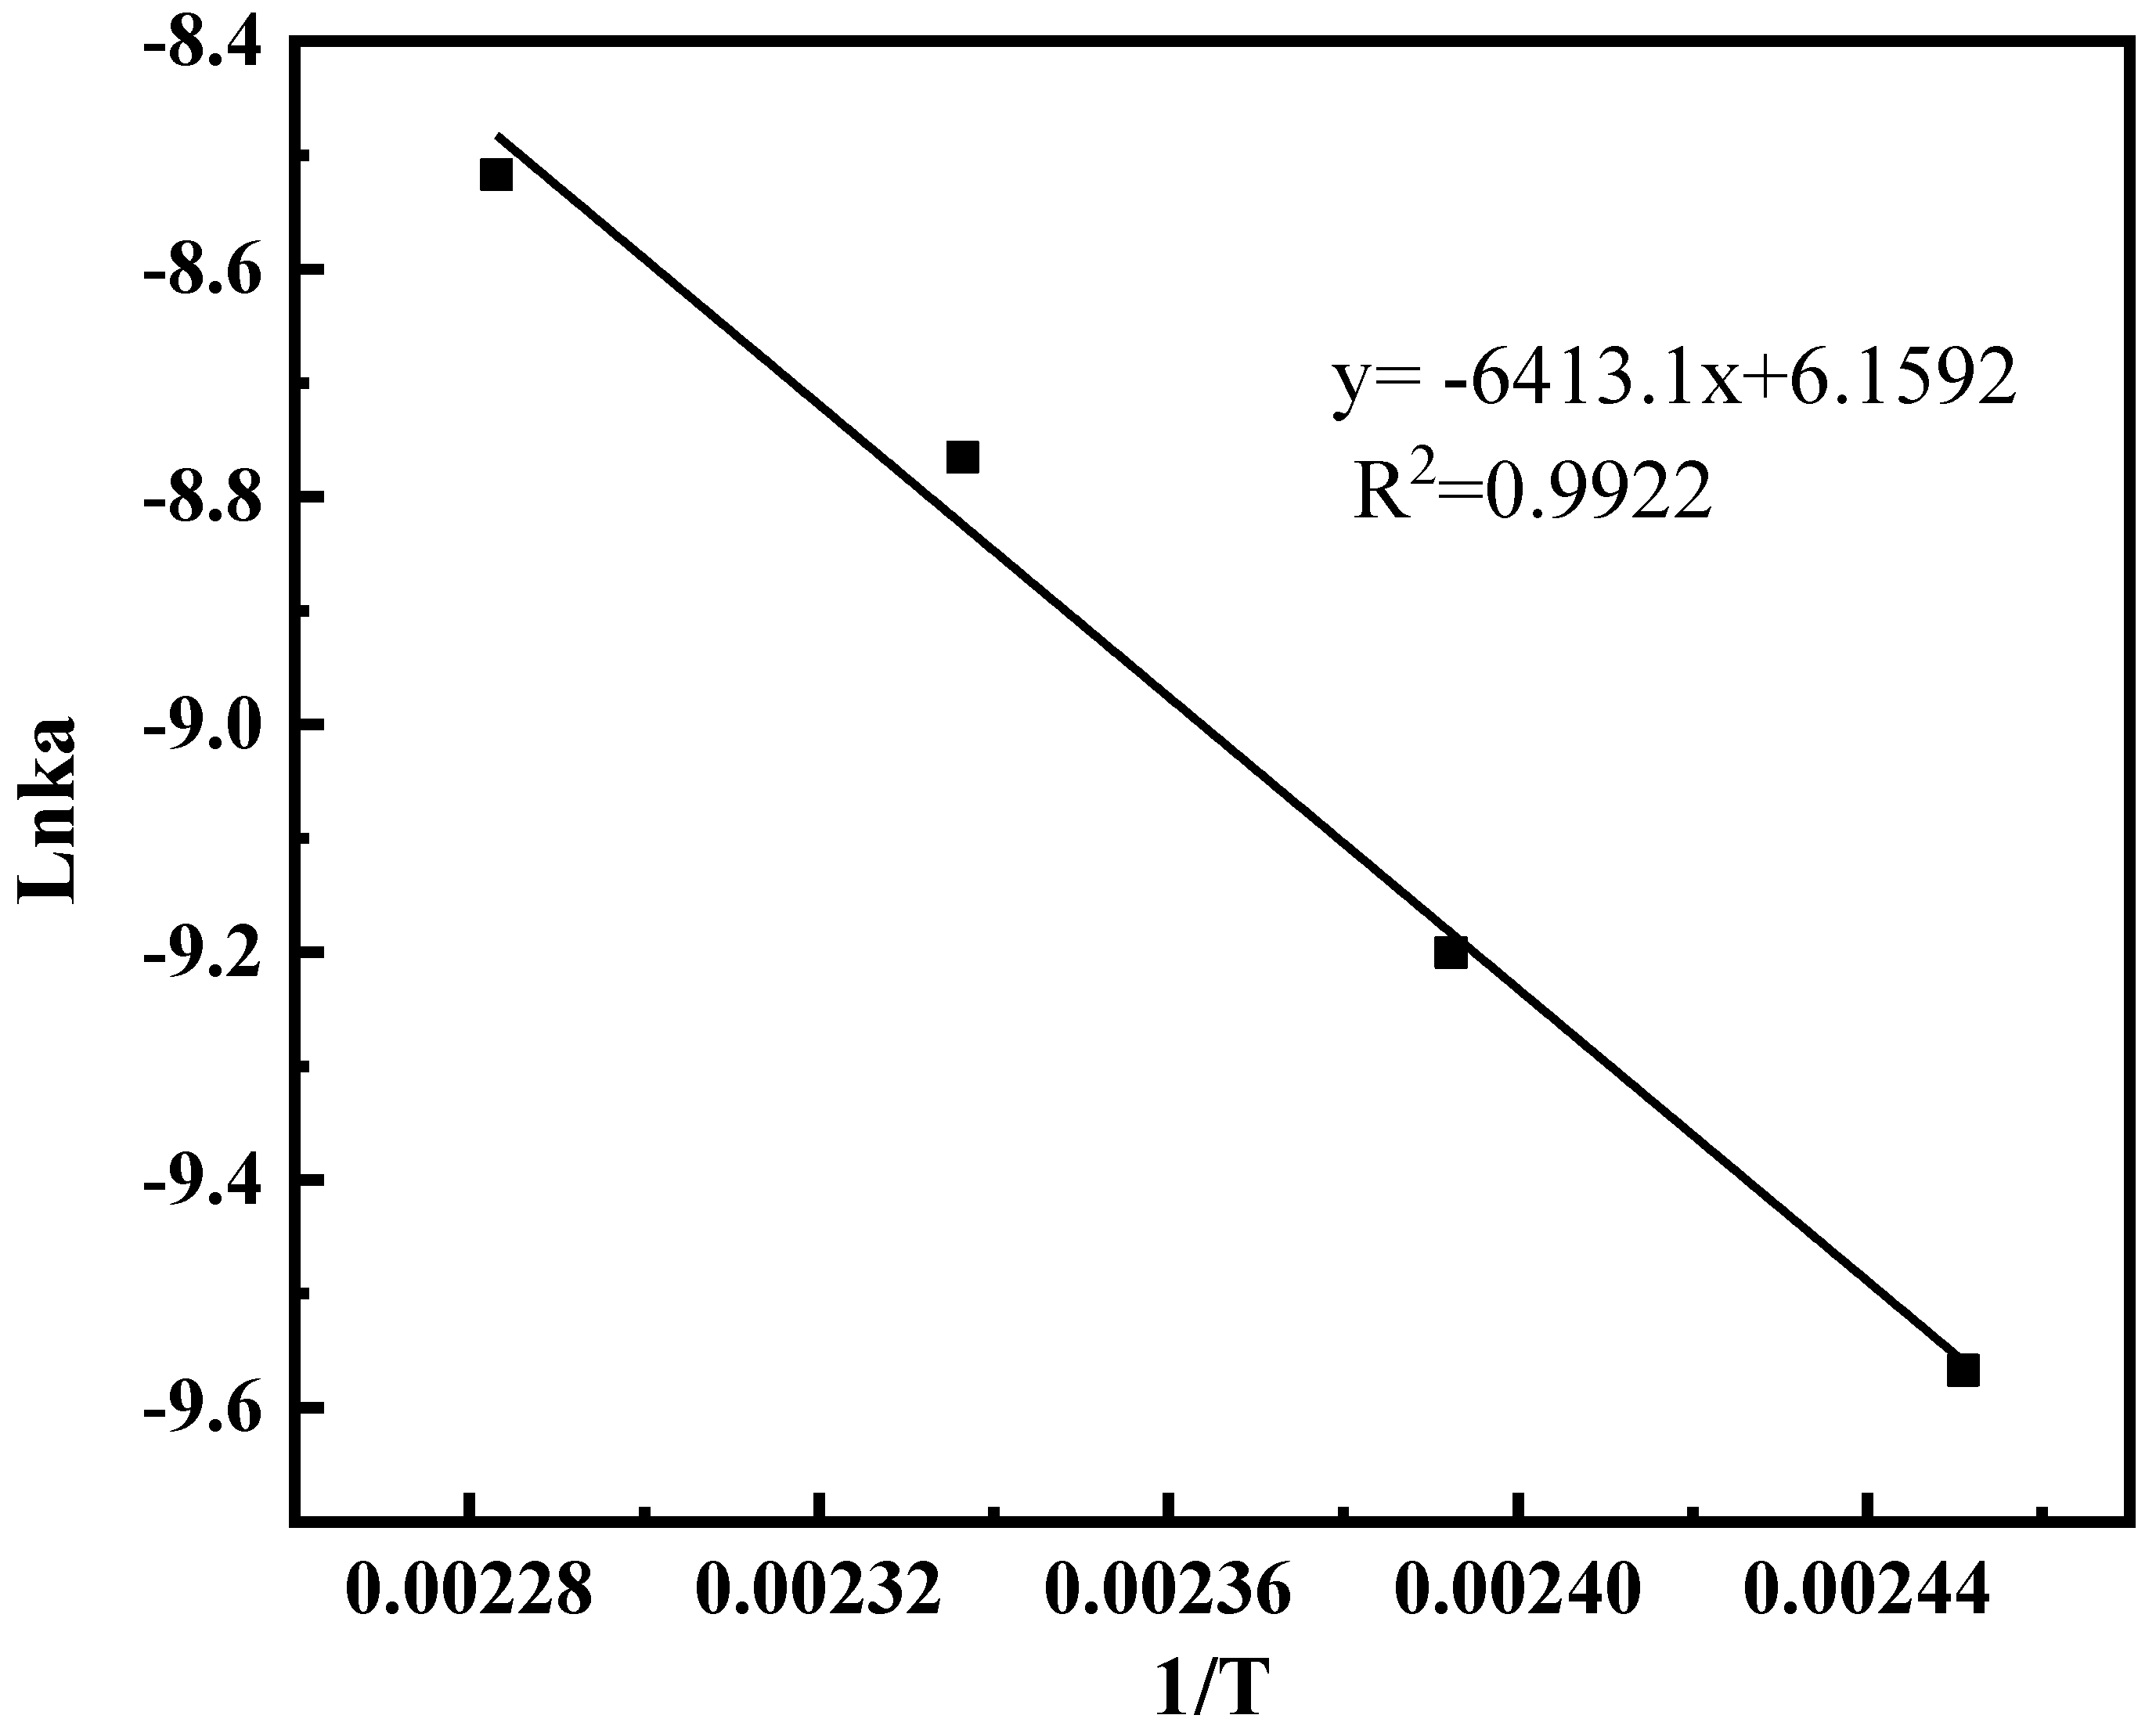
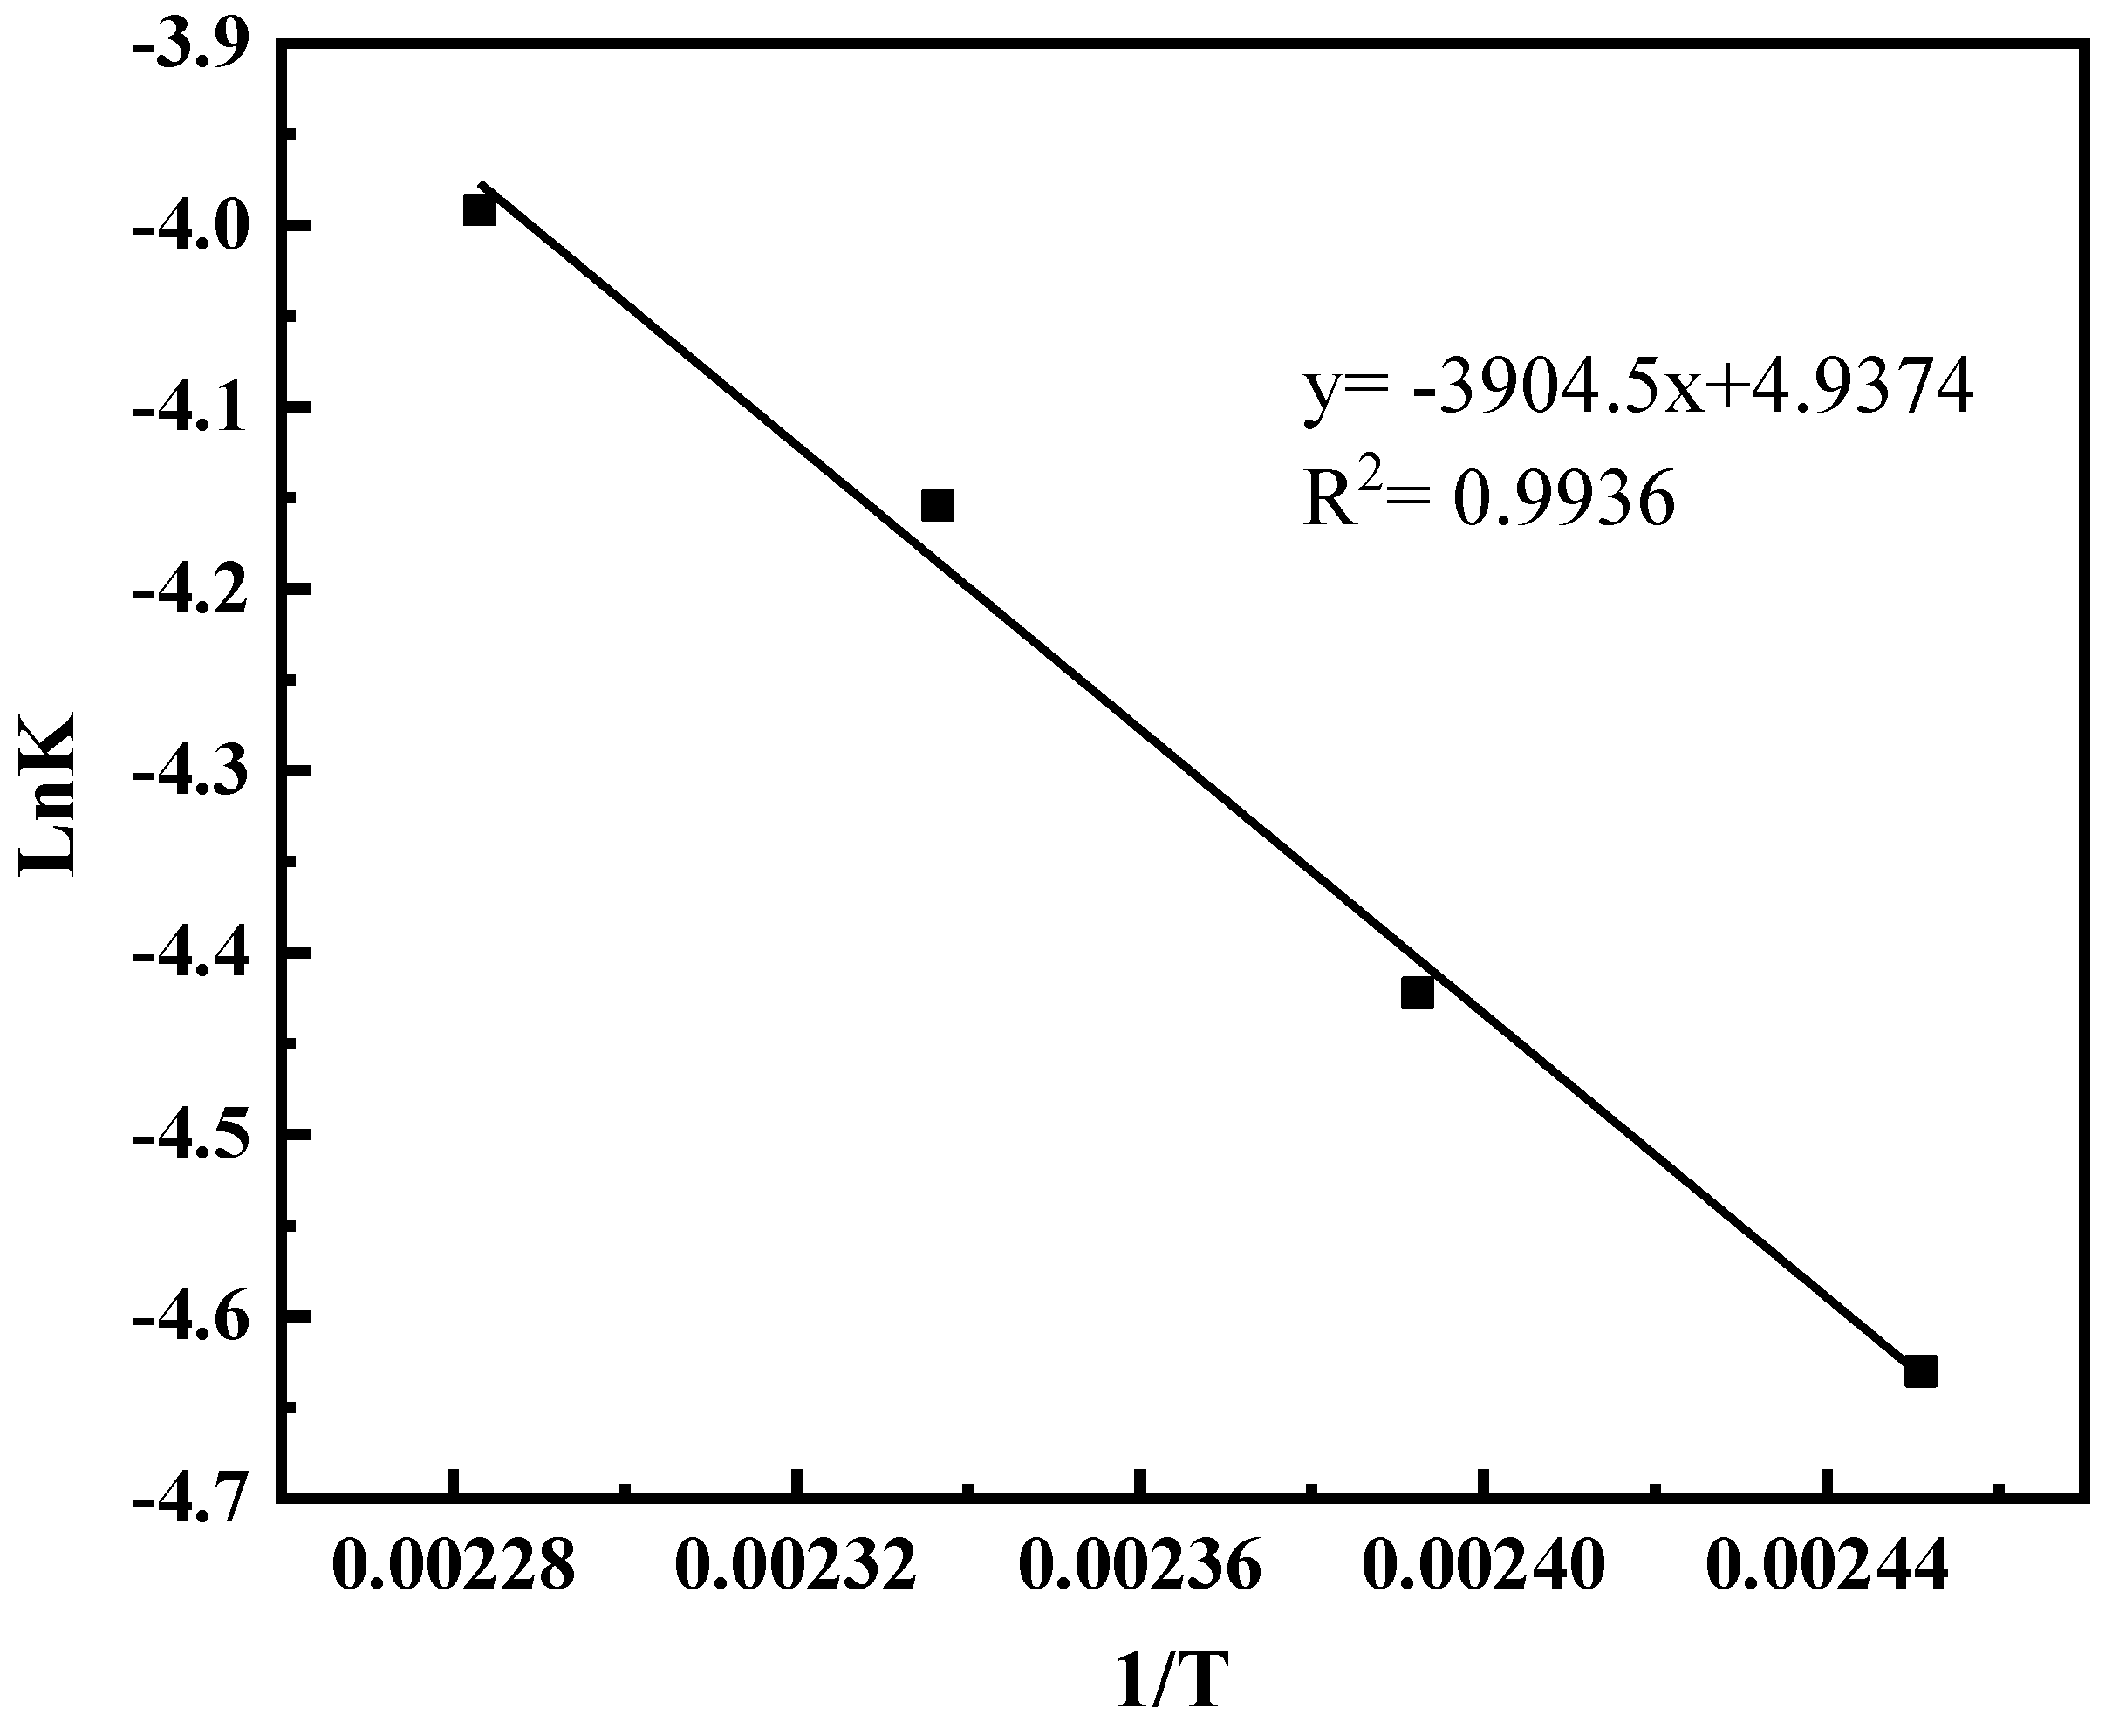
where k a and k b are the positive and negative reaction rate constants, respectively; C e n e , C w a t e r , and C n o l are the concentrations of 1-octene, water, and 2-octanol, respectively; and K is the chemical equilibrium constant. Linear regression of the temperature data yields the response rate constant, after which ln k a vs. 1/T was plotted (Figure 6) and Equation (4) was obtained through the fitting. Subsequently ln K vs. 1/T was plotted (Figure 7) and Equation (5) was obtained through the fitting.
k a = exp ( 6413.10 T + 6.1592 )
K = exp ( 3904.5 T + 4.9374 )
By substituting the above-mentioned fitted parameters into the kinetic model, the 1-octene conversion rate can be determined at various temperatures according to the kinetic model. As shown in Figure 4, the calculated value is in good agreement with the experimental value with an average deviation of 0.02, which is within the acceptable range. Therefore, the kinetic model for 2-octanol synthesis established through experiments can be used to analyze the hydration reaction process for 1-octene.

2.2. The Non-Random Two-Liquid (NRTL) Model Equation

Due to the lack of phase equilibrium data for the 1-octene-related binary system, the missing parameters were obtained by applying UNIFAC model estimation, and then the model parameters reported in Table 1 were analyzed by using the NRTL model equation, expressed as:
ln γ i = j = 1 n τ j i G j i x j k = 1 n G k i x k + j = 1 n x j G i j j = 1 n G k j x k ( τ i j m = 1 n x m τ m j G m j k = 1 n G k j x k )
τ i j = α i j + b i j T + e i j ln T + f i j T
G i j = exp ( α i j τ i j )
α i j = c i j + d i j ( T 273.15 K )
τ i i = 0
G i i = 1
To prove the correctness of the thermodynamic parameters, the existing azeotrope data in the solvent handbook written by Cheng [32] were compared with the data calculated using the NRTL model. From the results in Table 2, it can be seen that when the absolute difference temperature is 1.03 °C, the maximum error of the mass composition obtained via different methods is 4.75%. That is to say, the model parameters used in this study are adequately reliable.
To further demonstrate whether NRTL parameters can predict liquid phase splitting, the simulated data of the liquid–liquid phase equilibrium of 1-octene–water–1,4-dioxane were first calculated by using the NRTL parameters. Subsequently, the experimental data for the liquid–liquid phase equilibrium of 1-octene–water–1,4-dioxane at the same temperature were measured by using a liquid–liquid phase equilibrium kettle. The analysis method was the same as that detailed in Section 2.1.2. From the results in Table 3, it can be seen that when the temperature is 55 °C, the maximum error between the simulated value and the experimental value is approximately 0.25. Thus, the NRTL parameters are credible and can predict liquid phase splitting.

2.3. The Residual Curve Model

Analysis of the feasibility of this process was performed using the residual curve model for an RDC reported by Qi et al. [33] Equation (12) for the residual curve model is:
d x d ξ = ( z i y i ) + k f k f , r e f ( v i v T z i ) D a R
R = r n o l k a
where z i is the average molar composition of the liquids phase, y i is the molar composition of the gaseous phase, k f , r e f is generally assumed to be the positive reaction rate constant with the lowest boiling point as the reference temperature, v i is the stoichiometric coefficient, v T is the total molar change of the reaction, Da is the characteristic quantity of the RDC system (the magnitude of the latter indicates the extent to which the residual curve is affected by the reaction), and p i s a t is the saturation vapor pressure of component i. The calculation formulas for 1-octene and 2-octanol were obtained from the Aspen Plus database, while those for water and 1,4-dioxane were obtained from Qiu et al. [28]. The specific calculation formula is shown in Table 4. In Equation (13), r n o l is the reaction rate, and k a is the positive reaction rate constant.

3. Residual Curve Analysis

The residual curve graphs for various Da values can be obtained by solving Equation (12) using the residual curve model. The non-reactive residual curves are analyzed first followed by the reactive residual curves.

3.1. The Non-Reactive Residual Curves

The non-reactive residual curves for the unreacted quaternary system are produced by solving Equation (12). Figure 8 depicts the non-reactive residual curves of the quaternary system for the direct hydration process of 1-octene at a pressure of 1 atm. The illustration shows that the system contains four binary azeotropes (Az.1–4 in Figure 8). The blue line in Figure 8 is the liquid–liquid equilibrium line of 1-octene–water–1,4-dioxane. The lowest temperature in the system is the boiling point of the water–1,4-dioxane azeotrope, which is used as the reference temperature. As can be seen in Figure 8, when the quaternary component is present, no new azeotropes are produced in the system, whereas the original non-reactive azeotropes are still present. Because there are four components and four azeotropes in the 1-octene hydration reaction system, reactive distillation is the most suitable separation production technique. Accordingly, further research into the residual curves of the reactions is required.

3.2. The Reactive Residual Curves

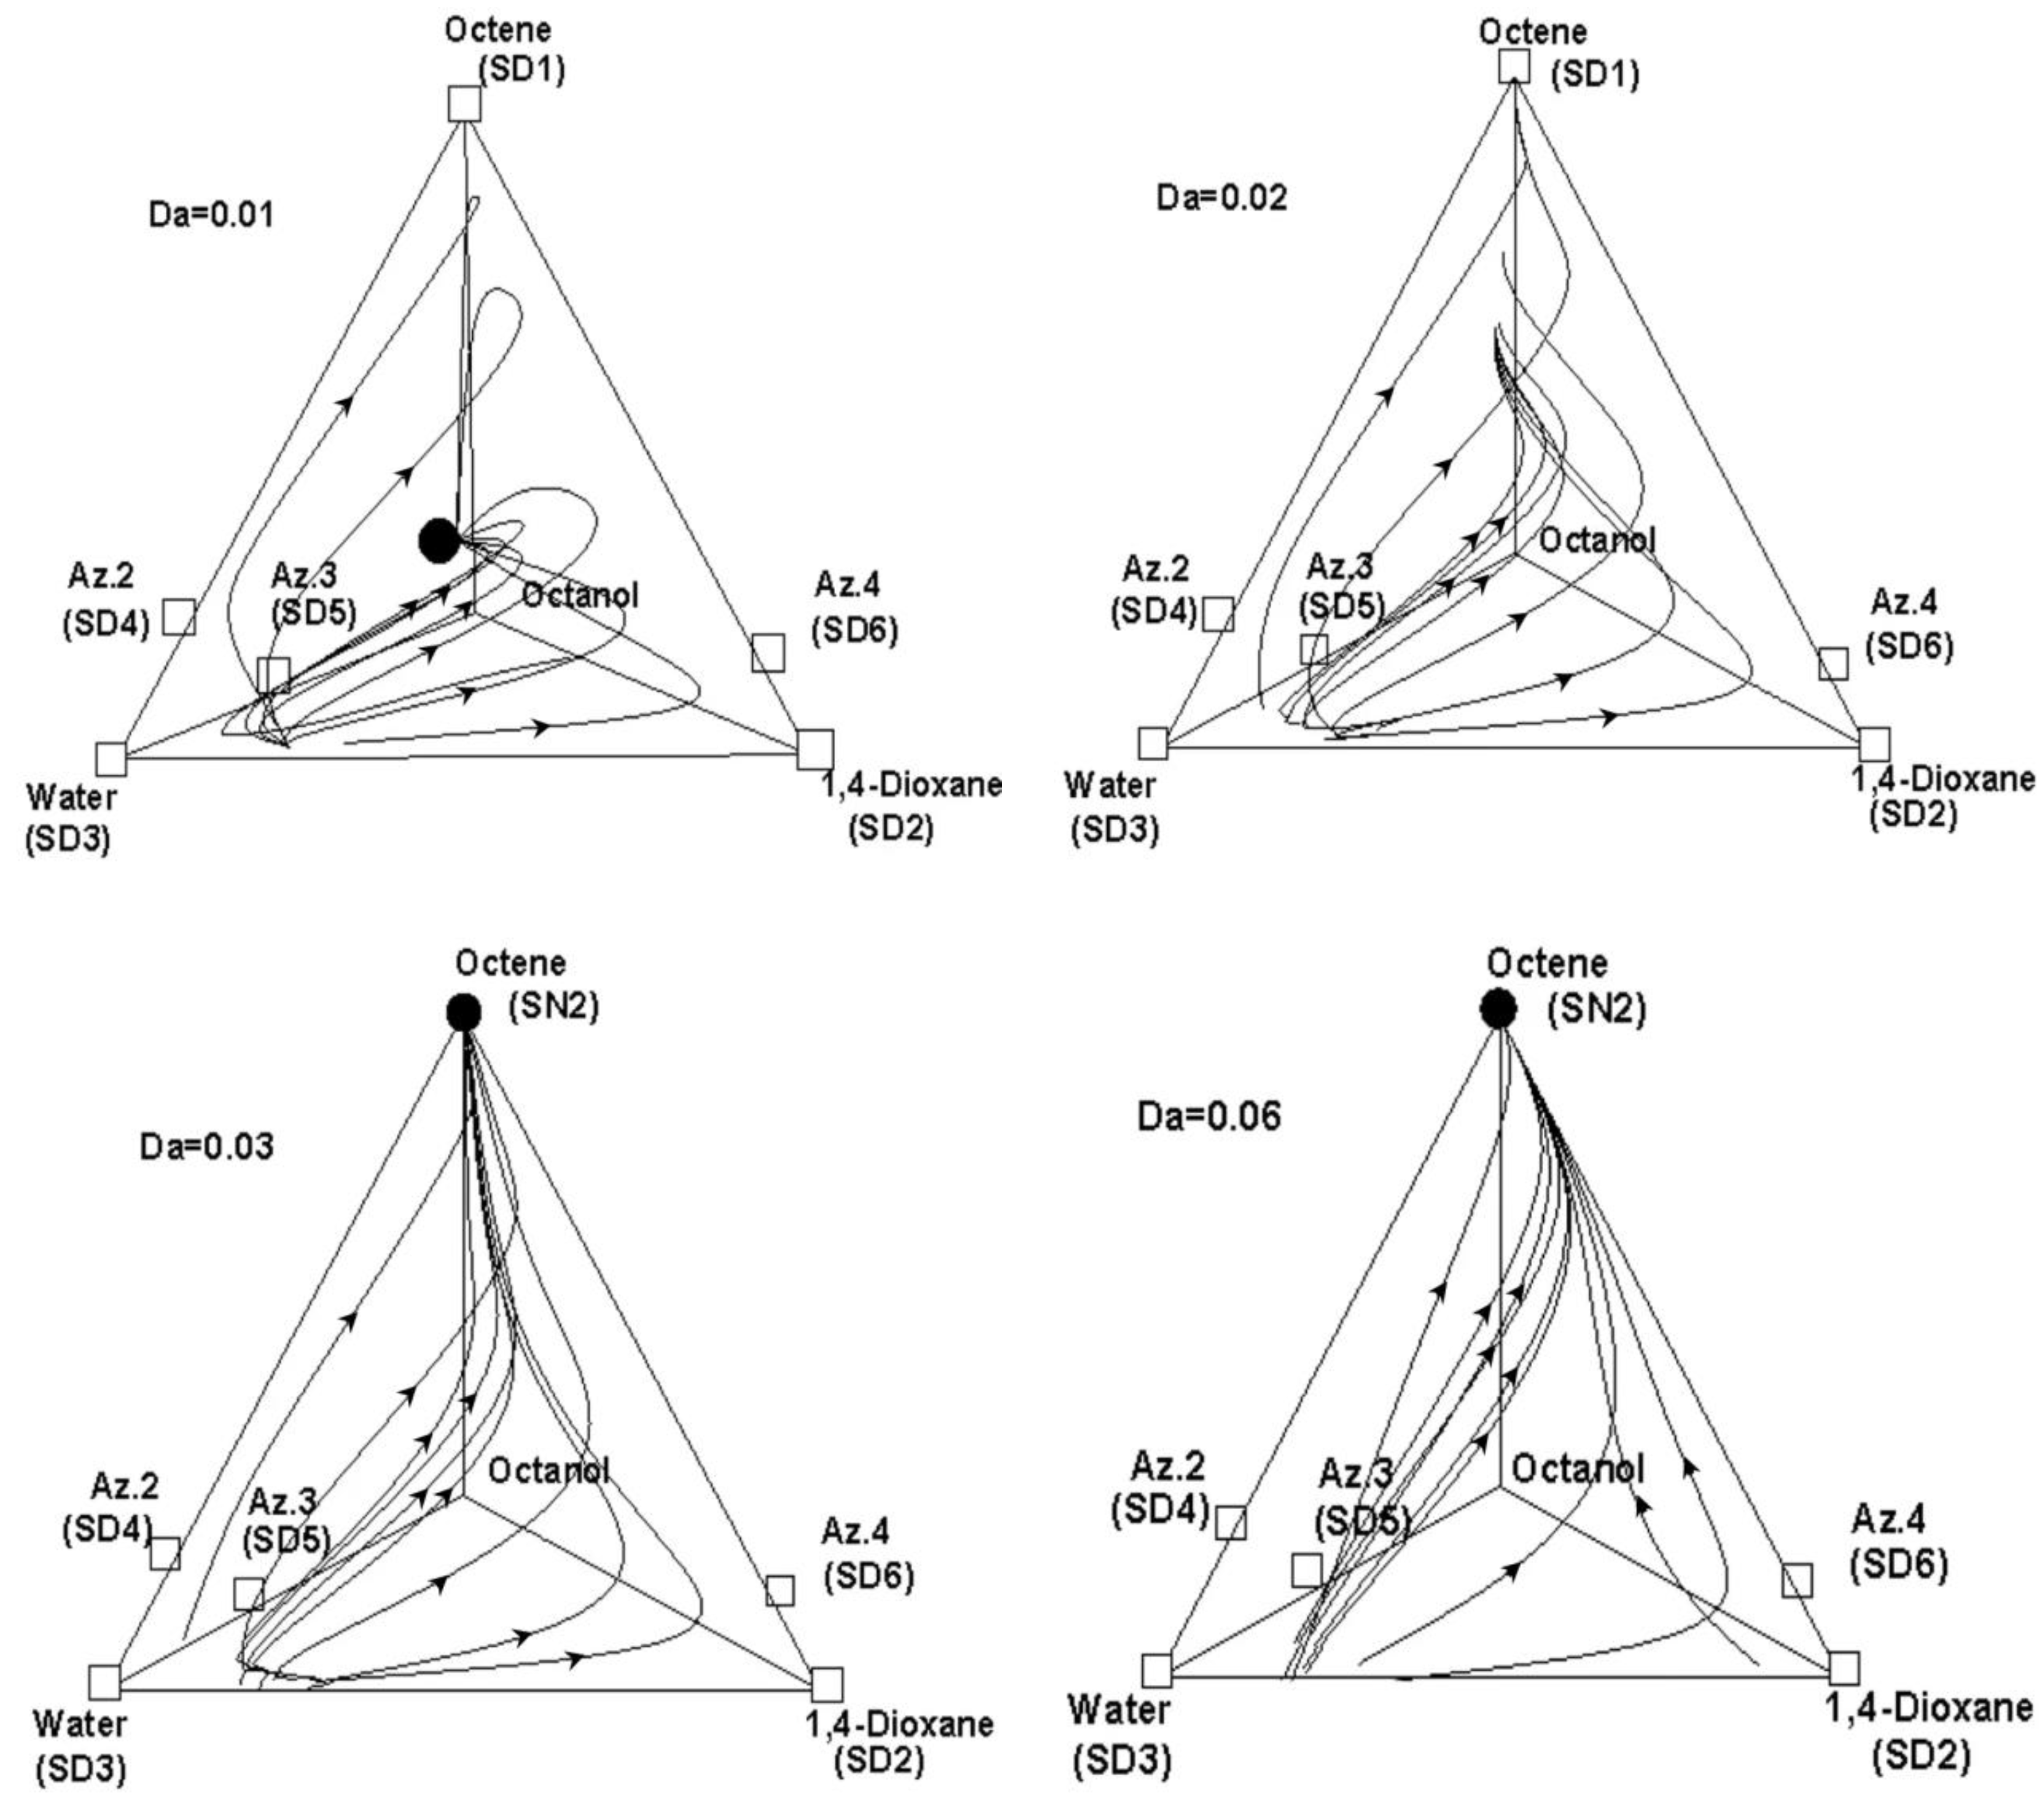
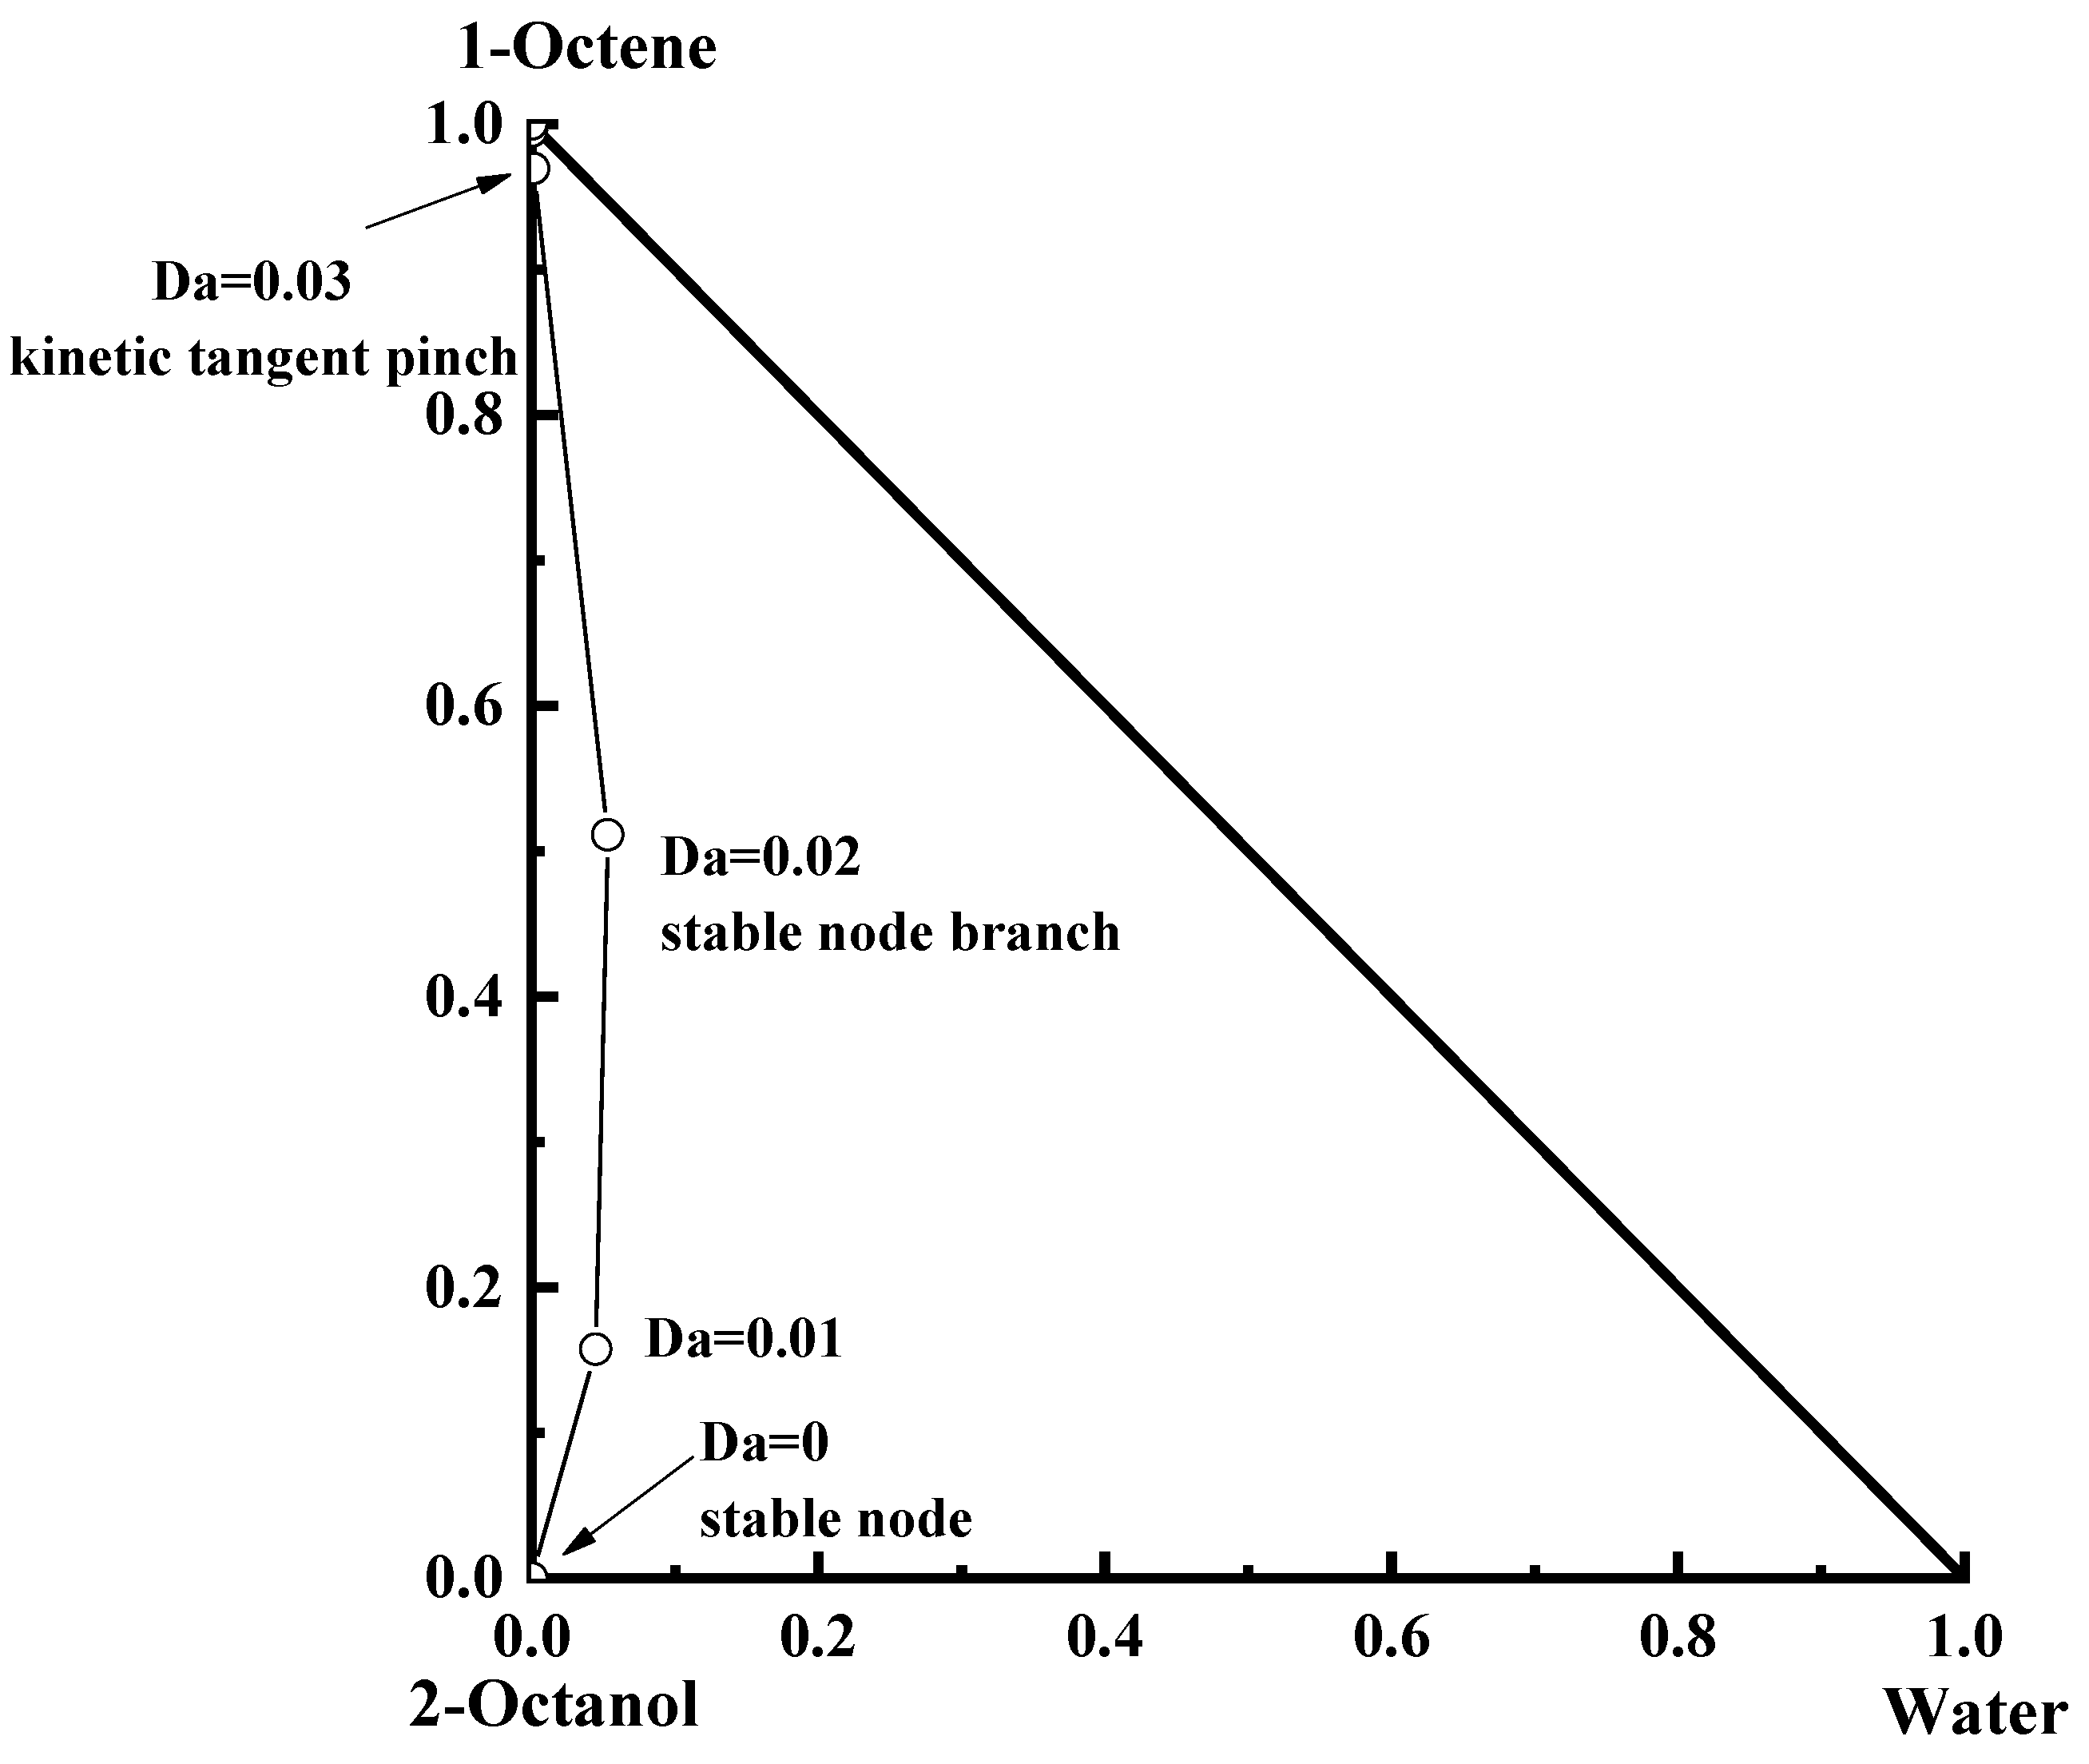
The residual curves for different Da values were obtained by applying Equation (12), as shown in Figure 8 and Figure 9. At Da = 0, unstable node 1 (denoted as UN1) is the azeotropic point for water–1,4-dioxane whereas stable node 1 (denoted as SN1) is pure 2-octanol. At this point, the residual curves in Figure 8 all point from unstable node 1 to stable node 1. The 1-octene, 1,4-dioxane, water, and azeotropes Az.2, Az.3, and Az.4 are known as saddles (denoted as SD1 to SD6) due to the residual curves never being able to bisect them. The residual curve plots also changed with increasing Da value. For Da = 0.01, unstable node 1 disappeared, and thus there were no longer any unstable nodes in the system. However, pure 2-octanol was no longer stable node 1 owing to the breakdown of 2-octanol into 1-octene and water, which resulted in stable node 1 becoming a combination of 1-octene, water, and 2-octanol. The trajectory can be observed in the reaction residual curve diagram 9 in Figure 10, where stable node 1 and saddle 1 (pure 1-octene) gradually approach each other. For Da = 0.03, new stable node 2 (1-octene) appears (denoted as SN2) whereas for Da > 0.03, the region ended by stable node 1 vanished and was replaced by the region terminated by stable node 2. Meanwhile, the system only contained stable node 2, which was reached by all of the residual curves. This is mainly because for Da = 0.03, stable node 1 and saddle 1 met and disappeared, leaving a tangent pinch behind [16,34], while 1-octene changed from a saddle to a stable node. Furthermore, because 1,4-dioxane did not react with any of the reaction system components, stable node 1 and saddle 1 only moved along the 1-octene–water–2-octanol plane. As can be observed in Figure 9, the residual curve changed to indicate pure 1-octene for Da > 0.03, at which point the singularity in the residual graph of the reaction no longer changed.

4. The Conceptual Design Based on the Residual Curve Analysis

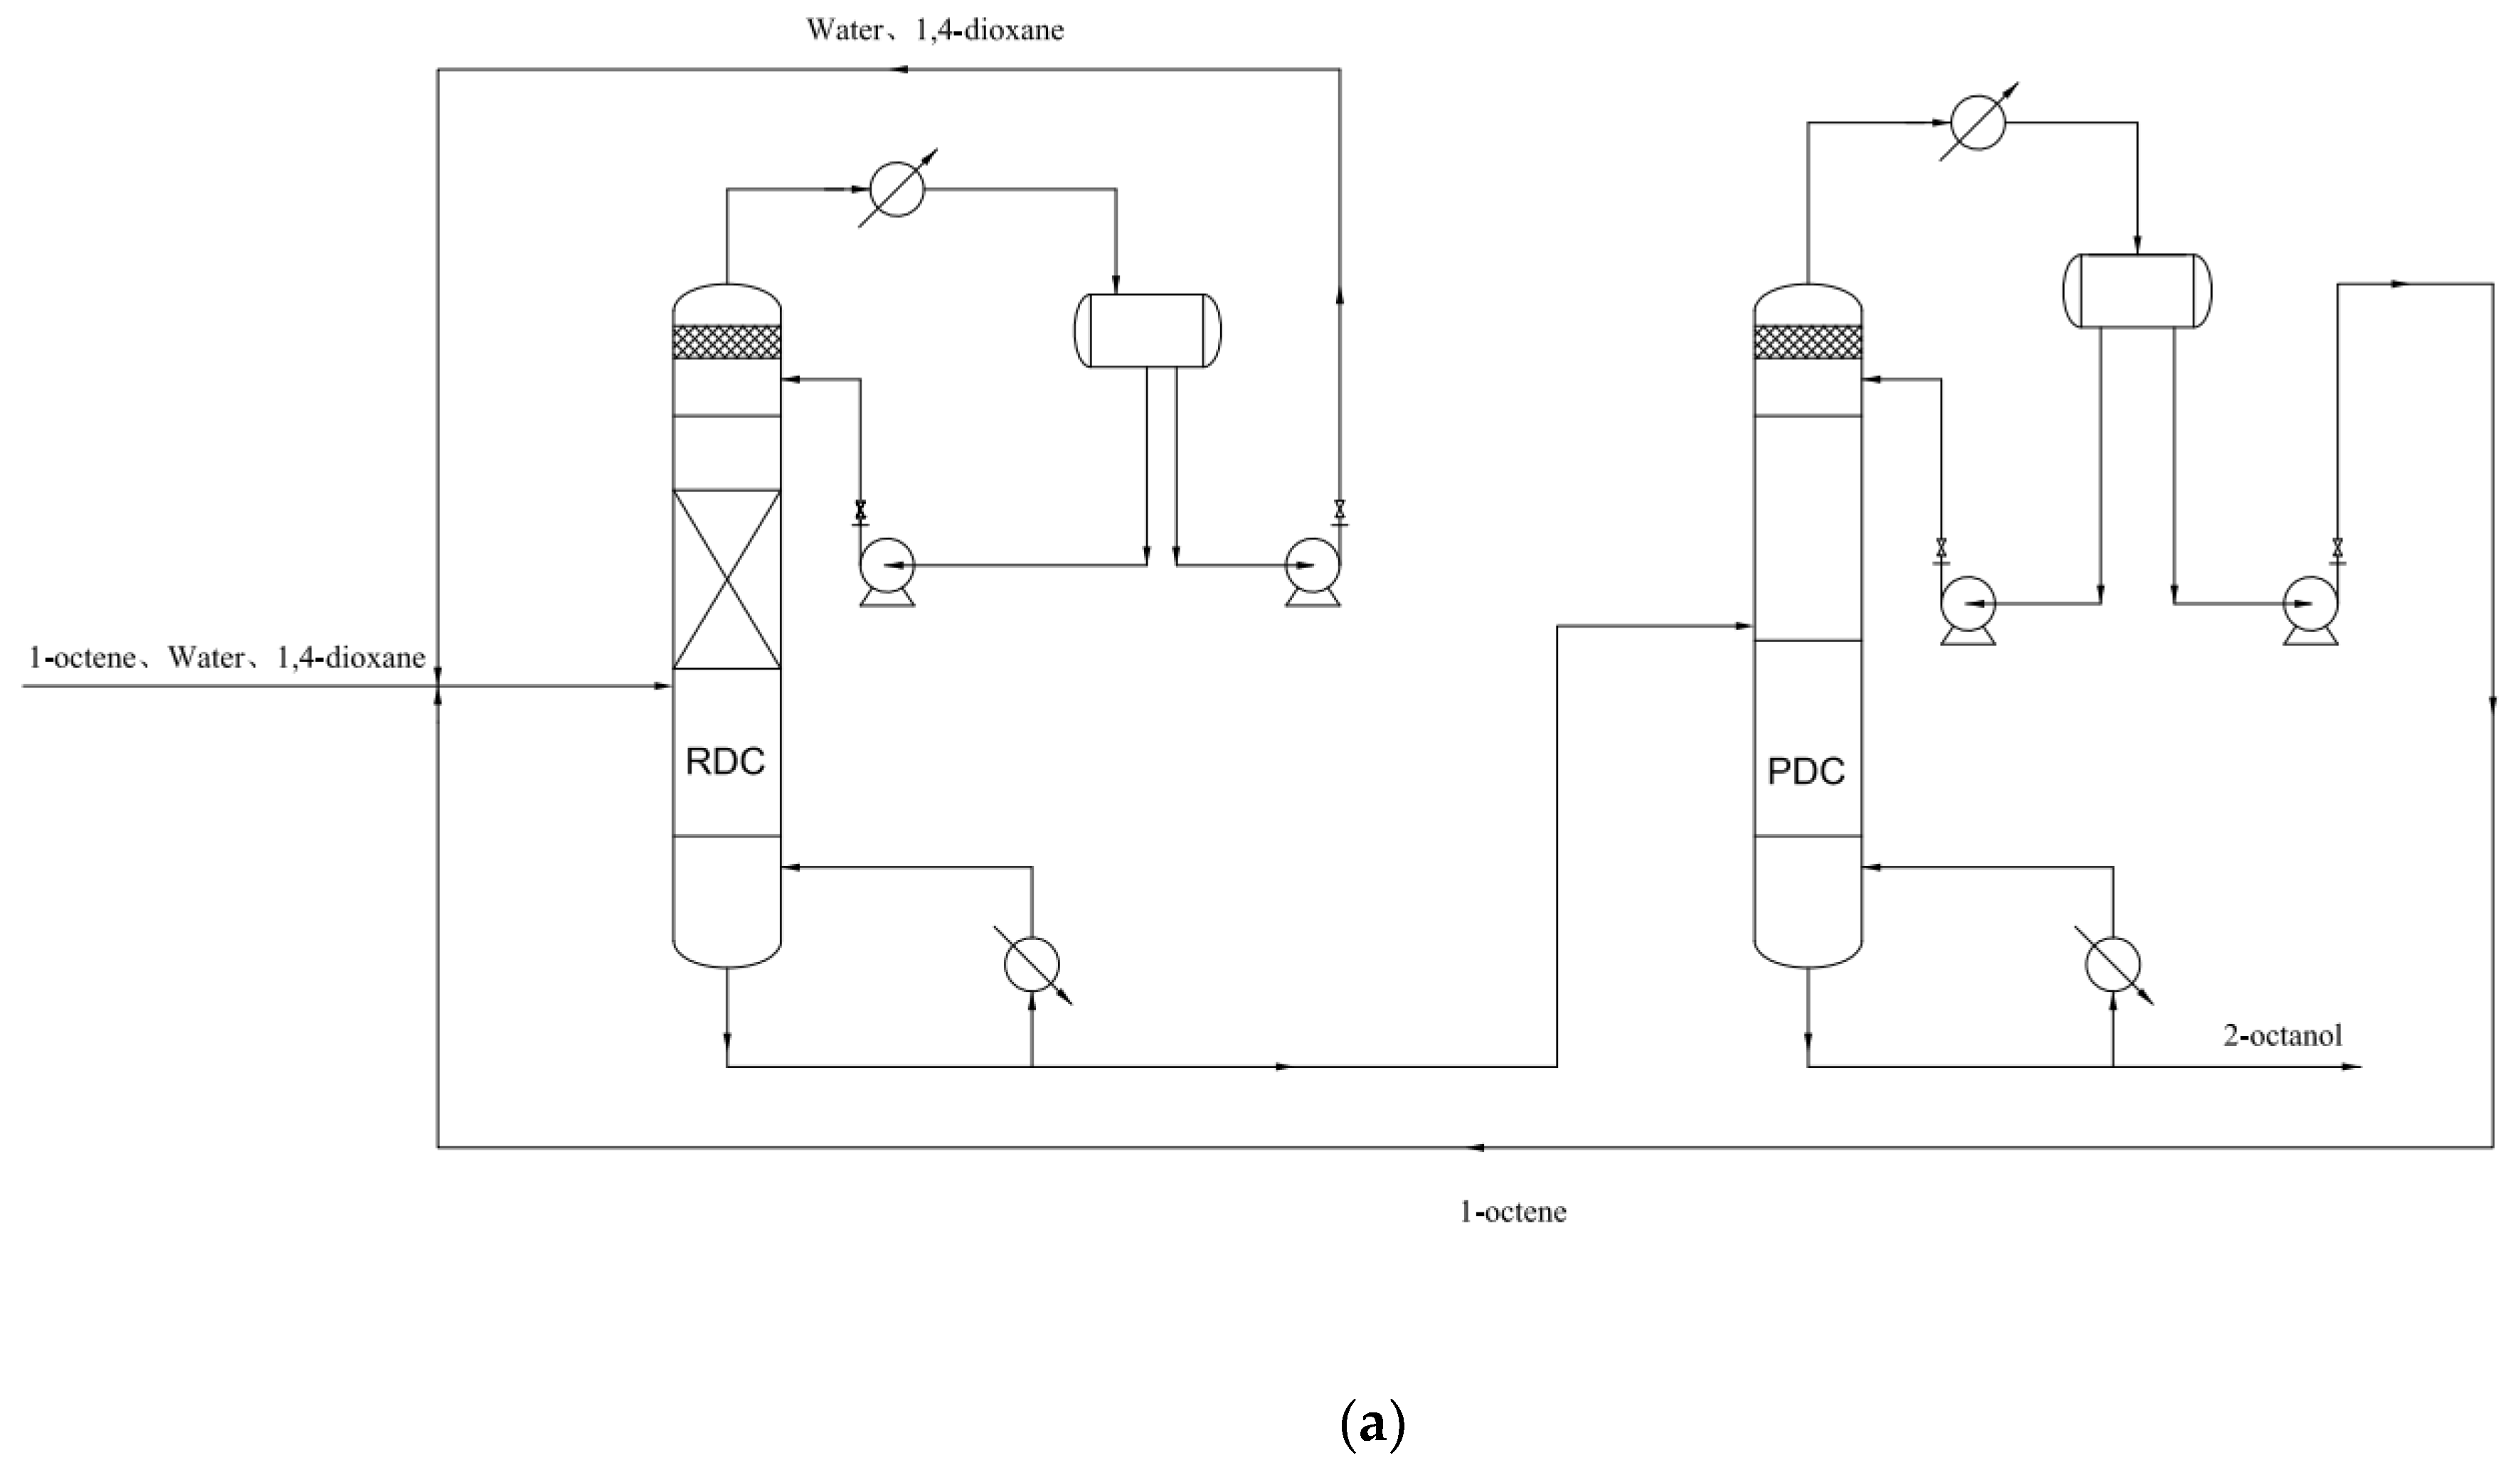
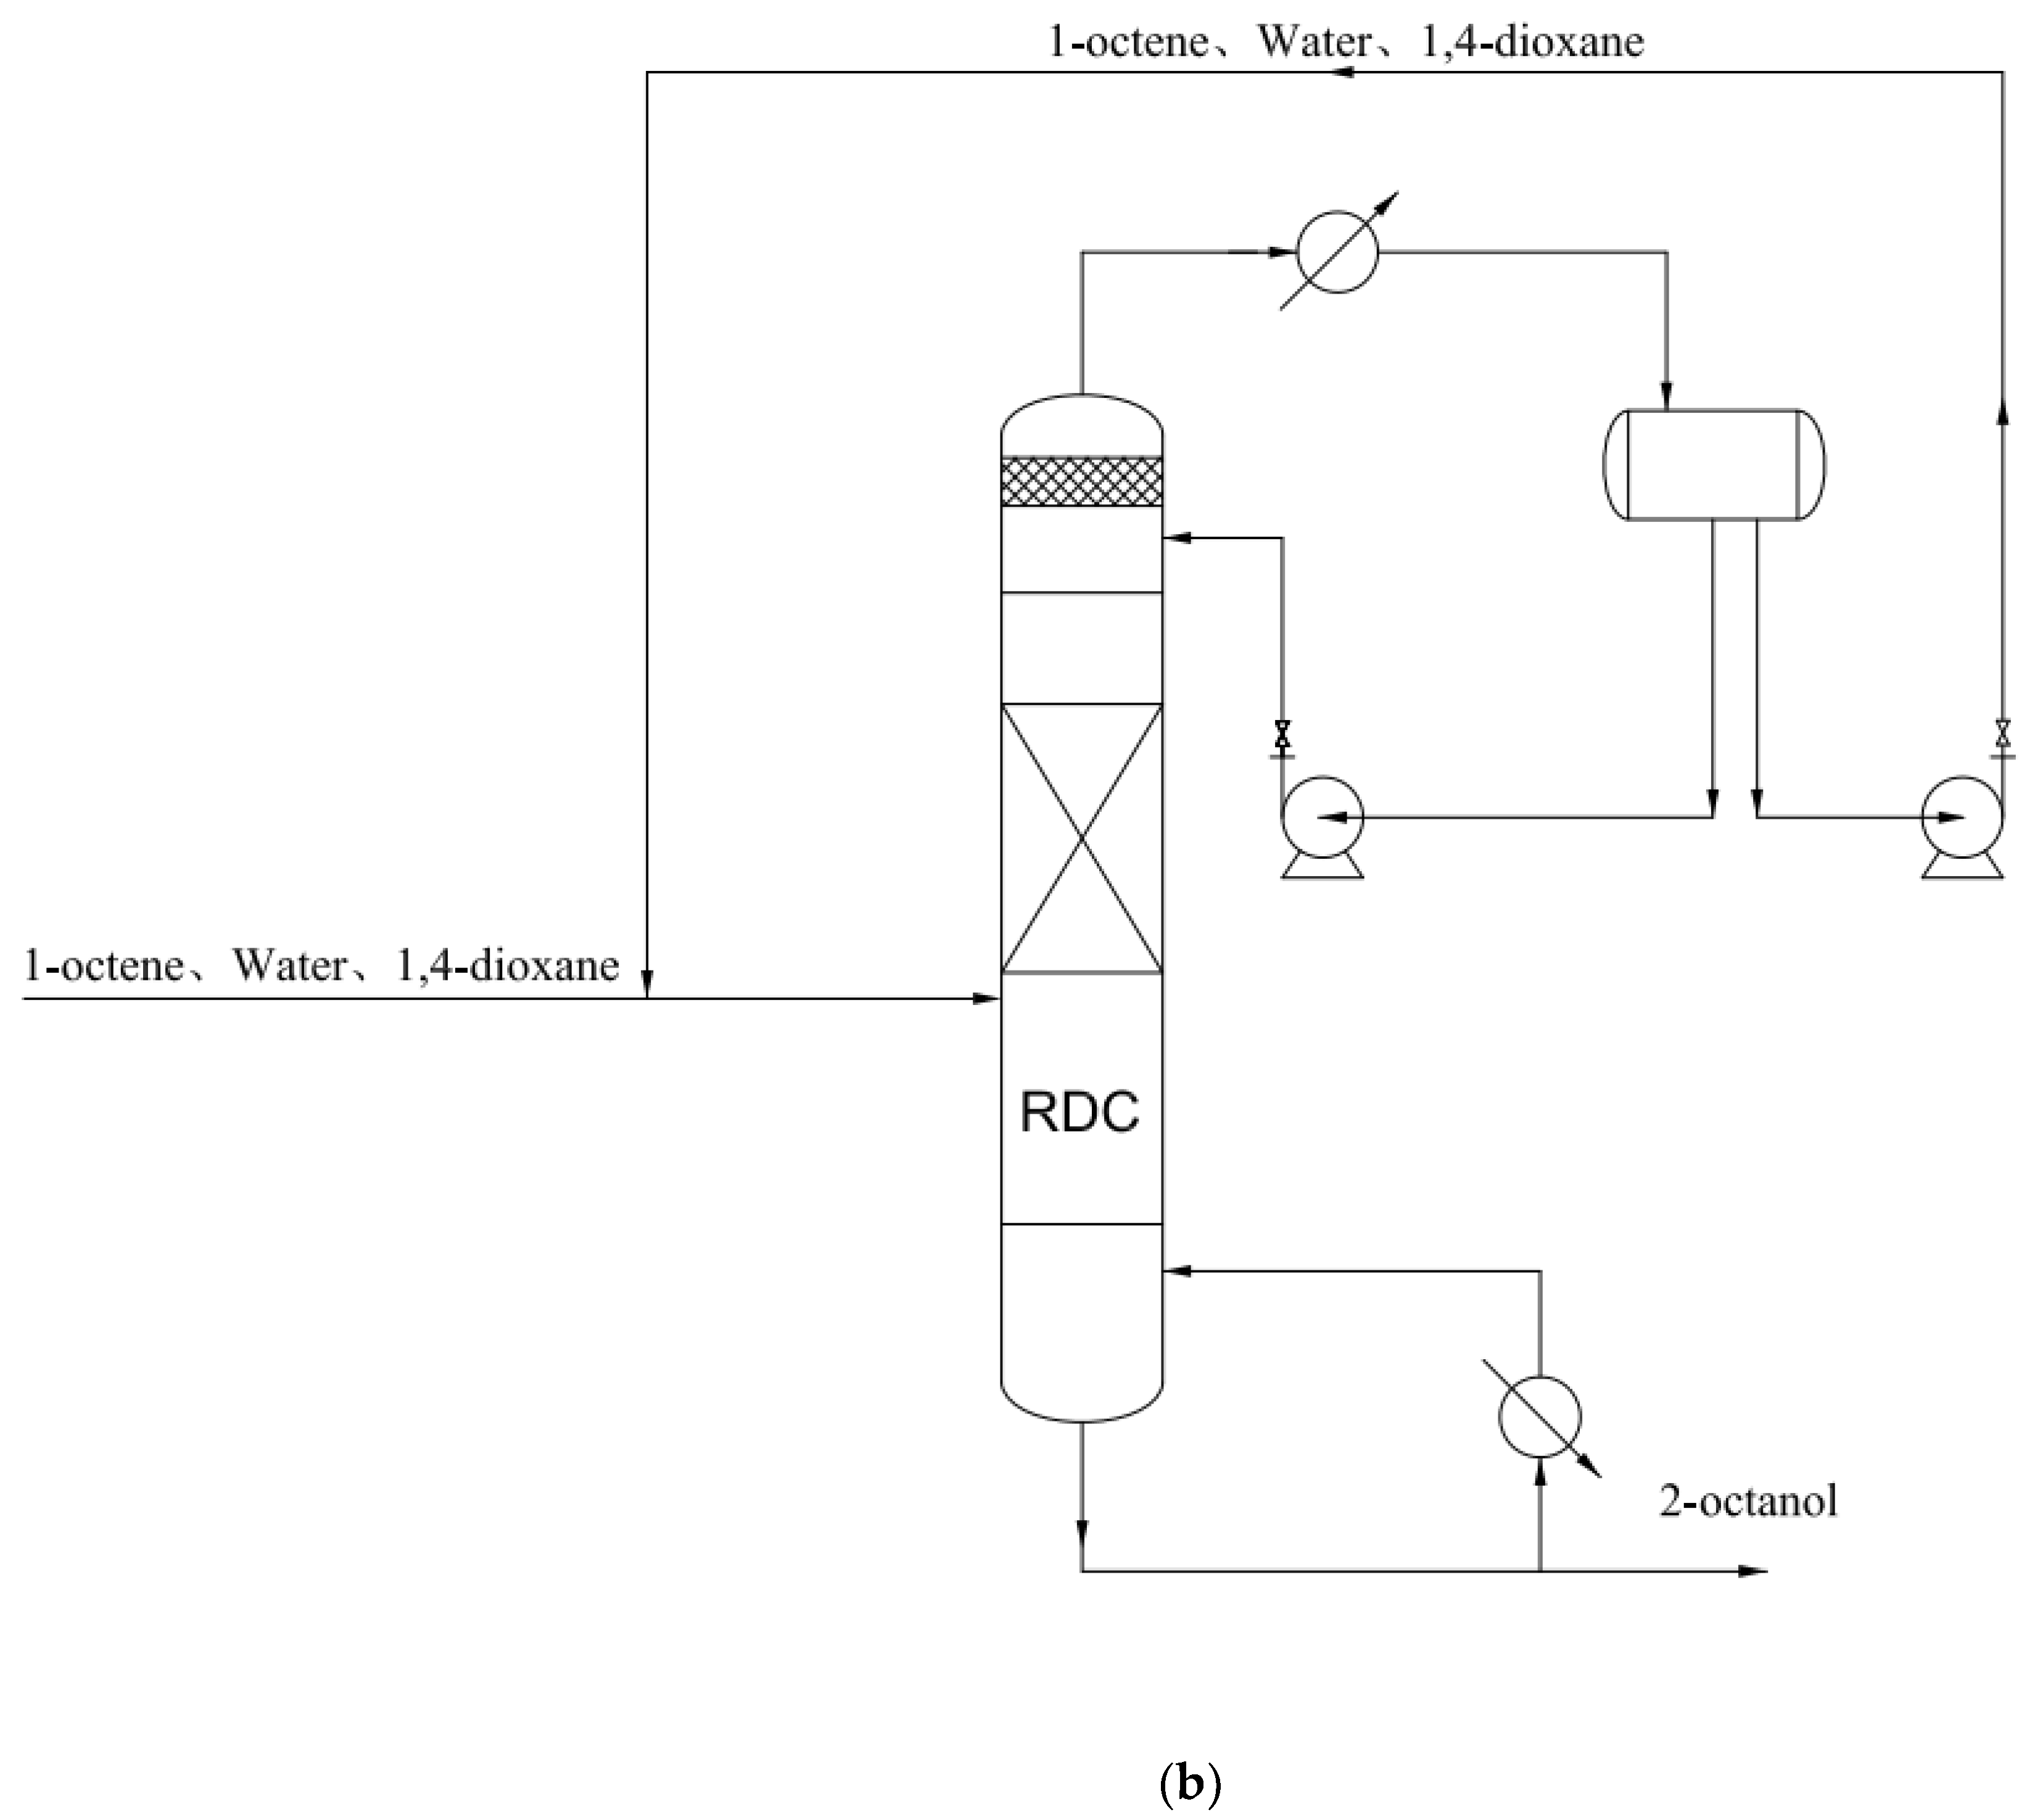
From the analysis of the residual curves and azeotropes, 2-octanol and 1-octene can be obtained from the bottom of the column, while the pure components (water and 1,4-dioxane) and azeotropes (water–1,4-dioxane, 1-octene–water, 2-octanol–water, and 1-octene–1,4-dioxane) with lower boiling points can be obtained at the top of the column. For Da = 0.03, the phase equilibrium and reaction equilibrium reach equilibrium, so Da < 0.03 is required for the production of 2-octanol. As Da increases, the residual curve points toward 1-octene. This is because 1-octene is present in excess compared to 2-octanol in the 1-octene hydration reaction. As the reaction proceeds, a mixture of 1-octene and 2-octanol appears in the system, thus the latter needs to be purified to obtain it at high purity (>99%). Therefore, based on the above analysis, two conceptual design options can be used for the 2-octanol catalytic distillation production process, as shown in Figure 11. In the first conceptual design (Figure 11a), 1-octene, water, and 1,4-dioxane are added to the RDC. After reaction and separation, water and 1,4-dioxane and the binary azeotrope are distilled out from the top of the column in the gaseous phase due to their low boiling points, and the gas is condensed and enters the reflux tank where it is partially refluxed and partially mined out. The 1-octene and 2-octanol are distilled out from the bottom of the RDC and then flow into a pre-concentration distillation column (PDC) for purification and separation: 2-octanol product is obtained from the bottom in the liquid phase, while 1-octene is obtained from the top in the gaseous phase, which is condensed and then recycled back into the RDC to restock the source. In the second conceptual design (Figure 11b), 1-octene, water, and 1,4-dioxane are added to the RDC, and then enter the reaction section in the middle of the column to react together, after which highly pure 2-octanol can be obtained from the RDC kettle. The 1-octene, water, 1,4-dioxane, and their azeotropes are distilled out in the gaseous phase at the top of the RDC due to their low boiling points, and after condensing in the condenser, they flow into the reflux tank where they are circulated and a small portion of each is returned to the RDC to continue the reaction. The best production process can be obtained by comparing and analyzing the energy consumption and cost of the above two conceptual designs.

5. Conclusions

In this study, kinetic data on the hydration reaction of 1-octene using 1,4-dioxane as the solvent were evaluated experimentally, and kinetic equations for the reaction system were established by fitting the experimental data with a pseudo-homogeneous kinetic model. Subsequently, the thermodynamic parameters for the 1-octene hydration system were estimated by using a UNIFAC model and then analyzed via a residual curve model. Since the yield of target product 2-octanol was better at lower Da values, it could be produced via an RDC process. However, for Da > 0.03, stable node 1 did not exist and the goal product was not formed. Moreover, the direct hydration of 1-octene via an RDC method presented in this study with 1,4-dioxane as a cosolvent is governed by its reaction kinetics. The residual curve analysis indicated that the target product did not provide a stable node for Da ≠ 0, but did so for Da = 0. Thus, the direct hydration of 1-octene to 2-octanol in an RDC is viable. Through the analysis of the azeotropes and the residual curves, two conceptual design processes for the synthesis process of 2-octanol catalytic distillation were proposed and the related analysis carried out.

Author Contributions

Conceptualization, H.T. and J.L.; methodology, M.C.; software, J.L.; validation, J.L. and H.T.; formal analysis, X.C.; investigation, X.C.; resources, M.C.; data curation, J.L.; writing—original draft preparation, J.L.; writing—review and editing, H.T.; visualization, X.C.; supervision, H.T.; project administration, H.T.; funding acquisition, H.T. All authors have read and agreed to the published version of the manuscript.

Funding

This research was funded by the Key Research and Development Plan of Shandong Province (Major Scientific and Technological Innovation Project) (2021ZDSYS24), and the Open Project Program of Fujian Universities Engineering Research Center of Reactive Distillation Technology (RDRC202204), Fuzhou University and the APC was funded by Hui Tian.

Data Availability Statement

Not applicable.

Conflicts of Interest

The authors declare no conflict of interest.

References

  1. Lv, C. Research and Development of Chloroisooctane-Isooctanol Separation Technology; TJU: Tianjin, China; Philadelphia, PA, USA, 2013. [Google Scholar]
  2. Liu, S. Study on the Process of Condensation-Hydrogenation of Secoctanone to Advanced Alcohols; UPC: Qingdao, China, 2010. [Google Scholar]
  3. Yu, S. Study on the Improvement of the Preparation Process of Sebacic Acid; NCU: Taiyuan, China; Scottsdale, AZ, USA, 2020. [Google Scholar]
  4. Panneman, H.J.; Beenackers, A. Solvent effects on the hydration of cyclohexene catalyzed by a strong acid ion-exchange resin.1.Solubility of Cyclohexene in Aqueous SulfolaneMixtures. Ind. Eng. Chem. Res. 1992, 31, 1227–1231. [Google Scholar] [CrossRef]
  5. Panneman, H.J.; Beenackers, A. Solvent effects on the hydration of cyclohexene catalyzed by a strong acid ion-exchange resin.2. Effect of sulfolane on the Reaction Kinetics. Ind. Eng. Chem. Res. 1992, 31, 1425–1433. [Google Scholar]
  6. Panneman, H.J.; Beenackers, A. Solvent effects on the hydration of cyclohexene catalyzed by a strong acid ion-exchange resin.3. Effect of sulfolane on the equilibrium conversion. Ind. Eng. Chem. Res. 1992, 31, 1433–1440. [Google Scholar]
  7. Shan, X.; Cheng, Z.; Li, Y. Solvent Effects on Hydration of Cyclohexene over H-ZSM-5 Catalyst. J. Chem. Eng. Data 2011, 56, 4310–4316. [Google Scholar] [CrossRef]
  8. Krishnamurthy, R.; Taylor, R. A nonequilibrium stage model of multicomponent separation processes. Part I: Model description and method of solution. AIChE J. 1985, 31, 449–456. [Google Scholar] [CrossRef]
  9. Kong, Z.Y.; Sánchez-Ramírez, E.; Yang, A.; Shen, W.; Segovia-Hernández, J.G.; Sunarso, J. Process intensification from conventional to advanced distillations: Past, present, and future. Chem. Eng. Res. Des. 2022, 188, 378–392. [Google Scholar] [CrossRef]
  10. Van Dongen, D.B.; Doherty, M.F. Design and synthesis of homogeneous azeotropic distillations. 1. Problem formulation for a single column. Ind. Eng. Chem. Fundam. 1985, 24, 454–463. [Google Scholar] [CrossRef]
  11. Barbosa, D.; Doherty, M.F. A New Set of Composition Variables for the Representation of Reactive-Phase Diagrams. Proc. R. Soc. A-Math. Phys. Sci. 1987, 413, 459–464. [Google Scholar]
  12. Barbosa, D.; Doherty, M.F. The simple distillation of homogeneous reactive mixtures. Chem. Eng. Sci. 1988, 43, 541–550. [Google Scholar] [CrossRef]
  13. Barbosa, D.; Doherty, M.F. Design and minimum-reflux calculations for single-feed multicomponent reactive distillation columns. Chem. Eng. Sci. 1988, 43, 1523–1537. [Google Scholar] [CrossRef]
  14. Barbosa, D.; Doherty, M.F. Design and minimum-reflux calculations for double-feed multicomponent reactive distillation columns. Chem. Eng. Sci. 1988, 43, 2377–2389. [Google Scholar] [CrossRef]
  15. Thiel, C.; Kai, S.; Ulrich, H. Residue curve maps for heterogeneously catalysed reactive distillation of fuel ethers MTBE and TAME. Chem. Eng. Sci. 1997, 52, 993–1005. [Google Scholar] [CrossRef]
  16. Thiel, C.; Kai, S.; Ulrich, H. Synthesis of ETBE: Residue Curve Maps for the Heterogeneously Catalysed Reactive Distillation Process. Chem. Eng. J. 1997, 66, 181–191. [Google Scholar] [CrossRef]
  17. Venimadhavan, G.; Buzad, G.; Doherty, M.F.; Malone, M.F. Effect of kinetics on residue curve maps for reactive distillation. AIChE J. 1994, 40, 1814–1824. [Google Scholar] [CrossRef]
  18. Zheng, H.; Tian, H.; Zou, W.; Huang, Z.; Wang, X.; Qiu, T.; Zhao, S.; Wu, Y. Residue curve maps of ethyl acetate synthesis reaction. J. Cent. South. Univ. 2013, 20, 50–55. [Google Scholar] [CrossRef]
  19. Binous, H. Residue curve map for homogeneous reactive quaternary mixtures. Comput. Appl. Eng. Educ. 2007, 15, 73–77. [Google Scholar] [CrossRef]
  20. Claudia, G.; Miguel, V.; Aruturo, J. A Fast Method to Calculate Residue Curve Maps. Ind. Eng. Chem. Res. 2006, 45, 4429–4432. [Google Scholar]
  21. Raphaële, T.; Xuan, M.; Meyer, M.; Xavier, J. Feasibility analysis, synthesis, and design of reactive distillation processes: A focus on double-feed processes. AIChE J. 2012, 58, 2346–2356. [Google Scholar]
  22. Steyer, F.; Qi, Z.; Kai, S. Synthesis of cylohexanol by three-phase reactive distillation: Influence of kinetics on phase equilibria. Chem. Eng. Sci. 2002, 57, 1511–1520. [Google Scholar] [CrossRef]
  23. Khaledi, R.; Bishnoi, P.R. A Method for Modeling Two- and Three-Phase Reactive Distillation Columns. Ind. Eng. Chem. Res. 2006, 45, 6007–6020. [Google Scholar] [CrossRef]
  24. Steyer, F.; Sundmacher, K. Cyclohexanol Production via Esterification of Cyclohexene with Formic Acid and Subsequent Hy-dration of the EsterReaction Kinetics. Ind. Eng. Chem. Res. 2007, 46, 1099–1104. [Google Scholar] [CrossRef]
  25. Steyer, F.; Freund, H.; Sundmacher, K. A Novel Reactive Distillation Process for the Indirect Hydration of Cyclohexene to Cy-clohexanol Using a Reactive Entrainer. Ind. Eng. Chem. Res. 2008, 47, 9581–9587. [Google Scholar] [CrossRef]
  26. Zheng, H.; Lin, M.; Qiu, T.T.; Shen, Y.; Tian, H.; Zhao, S. Simulation study of direct hydration of cyclohexene to cyclohexanol using isophorone as cosolvent. Chem. Eng. Res. Des. 2017, 117, 346–354. [Google Scholar] [CrossRef]
  27. Frey, T.; Stichlmair, J. Reactive Azeotropes in Kinetically Controlled Reactive Distillation. Chem. Eng. Res. Des. 1999, 77, 613–618. [Google Scholar] [CrossRef]
  28. Qiu, T.; Kuang, C.-H.; Li, C.-G.; Zhang, X.-W.; Wang, X.-D. Study on Feasibility of Reactive Distillation Process for the Direct Hydration of Cyclohexene to Cyclohexanol Using a Cosolvent. Ind. Eng. Chem. Res. 2013, 52, 8139–8148. [Google Scholar] [CrossRef]
  29. Ye, J.; Li, J.; Sha, Y.; Lin, H.; Zhou, D. Evaluation of Reactive Distillation and Side Reactor Configuration for Direct Hydration of Cyclohexene to Cyclohexanol. Ind. Eng. Chem. Res. 2014, 53, 1461–1469. [Google Scholar] [CrossRef]
  30. Li, X.; Wang, J.; He, L.; Sui, H.; Yin, W. Ionic Liquid-Assisted Solvent Extraction for Unconventional Oil Recovery: Computational Simulation and Experimental Tests. Energy Fuels 2016, 30, 7074–7081. [Google Scholar] [CrossRef]
  31. Zhang, H.; Mahajani, S.; Sharma, M.; Sridhar, T. Hydration of cyclohexane with solid acid catalysts. Chem. Eng. Sci. 2002, 57, 315–322. [Google Scholar] [CrossRef]
  32. Cheng, L. Solvent Manual; Chem Ind Pre.: Beijing, China, 2007; pp. 1–1309. [Google Scholar]
  33. Qi, Z.; Kolah, A.; Sundmacher, K. Residue curve maps for reactive distillation systems with liquid-phase splitting. Chem. Eng. Sci. 2002, 57, 163–178. [Google Scholar] [CrossRef]
  34. Qi, Z.; Flockerzi, D.; Sundmacher, K. Singular points of reactive distillation systems. AIChE J. 2004, 50, 2866–2876. [Google Scholar] [CrossRef] [Green Version]
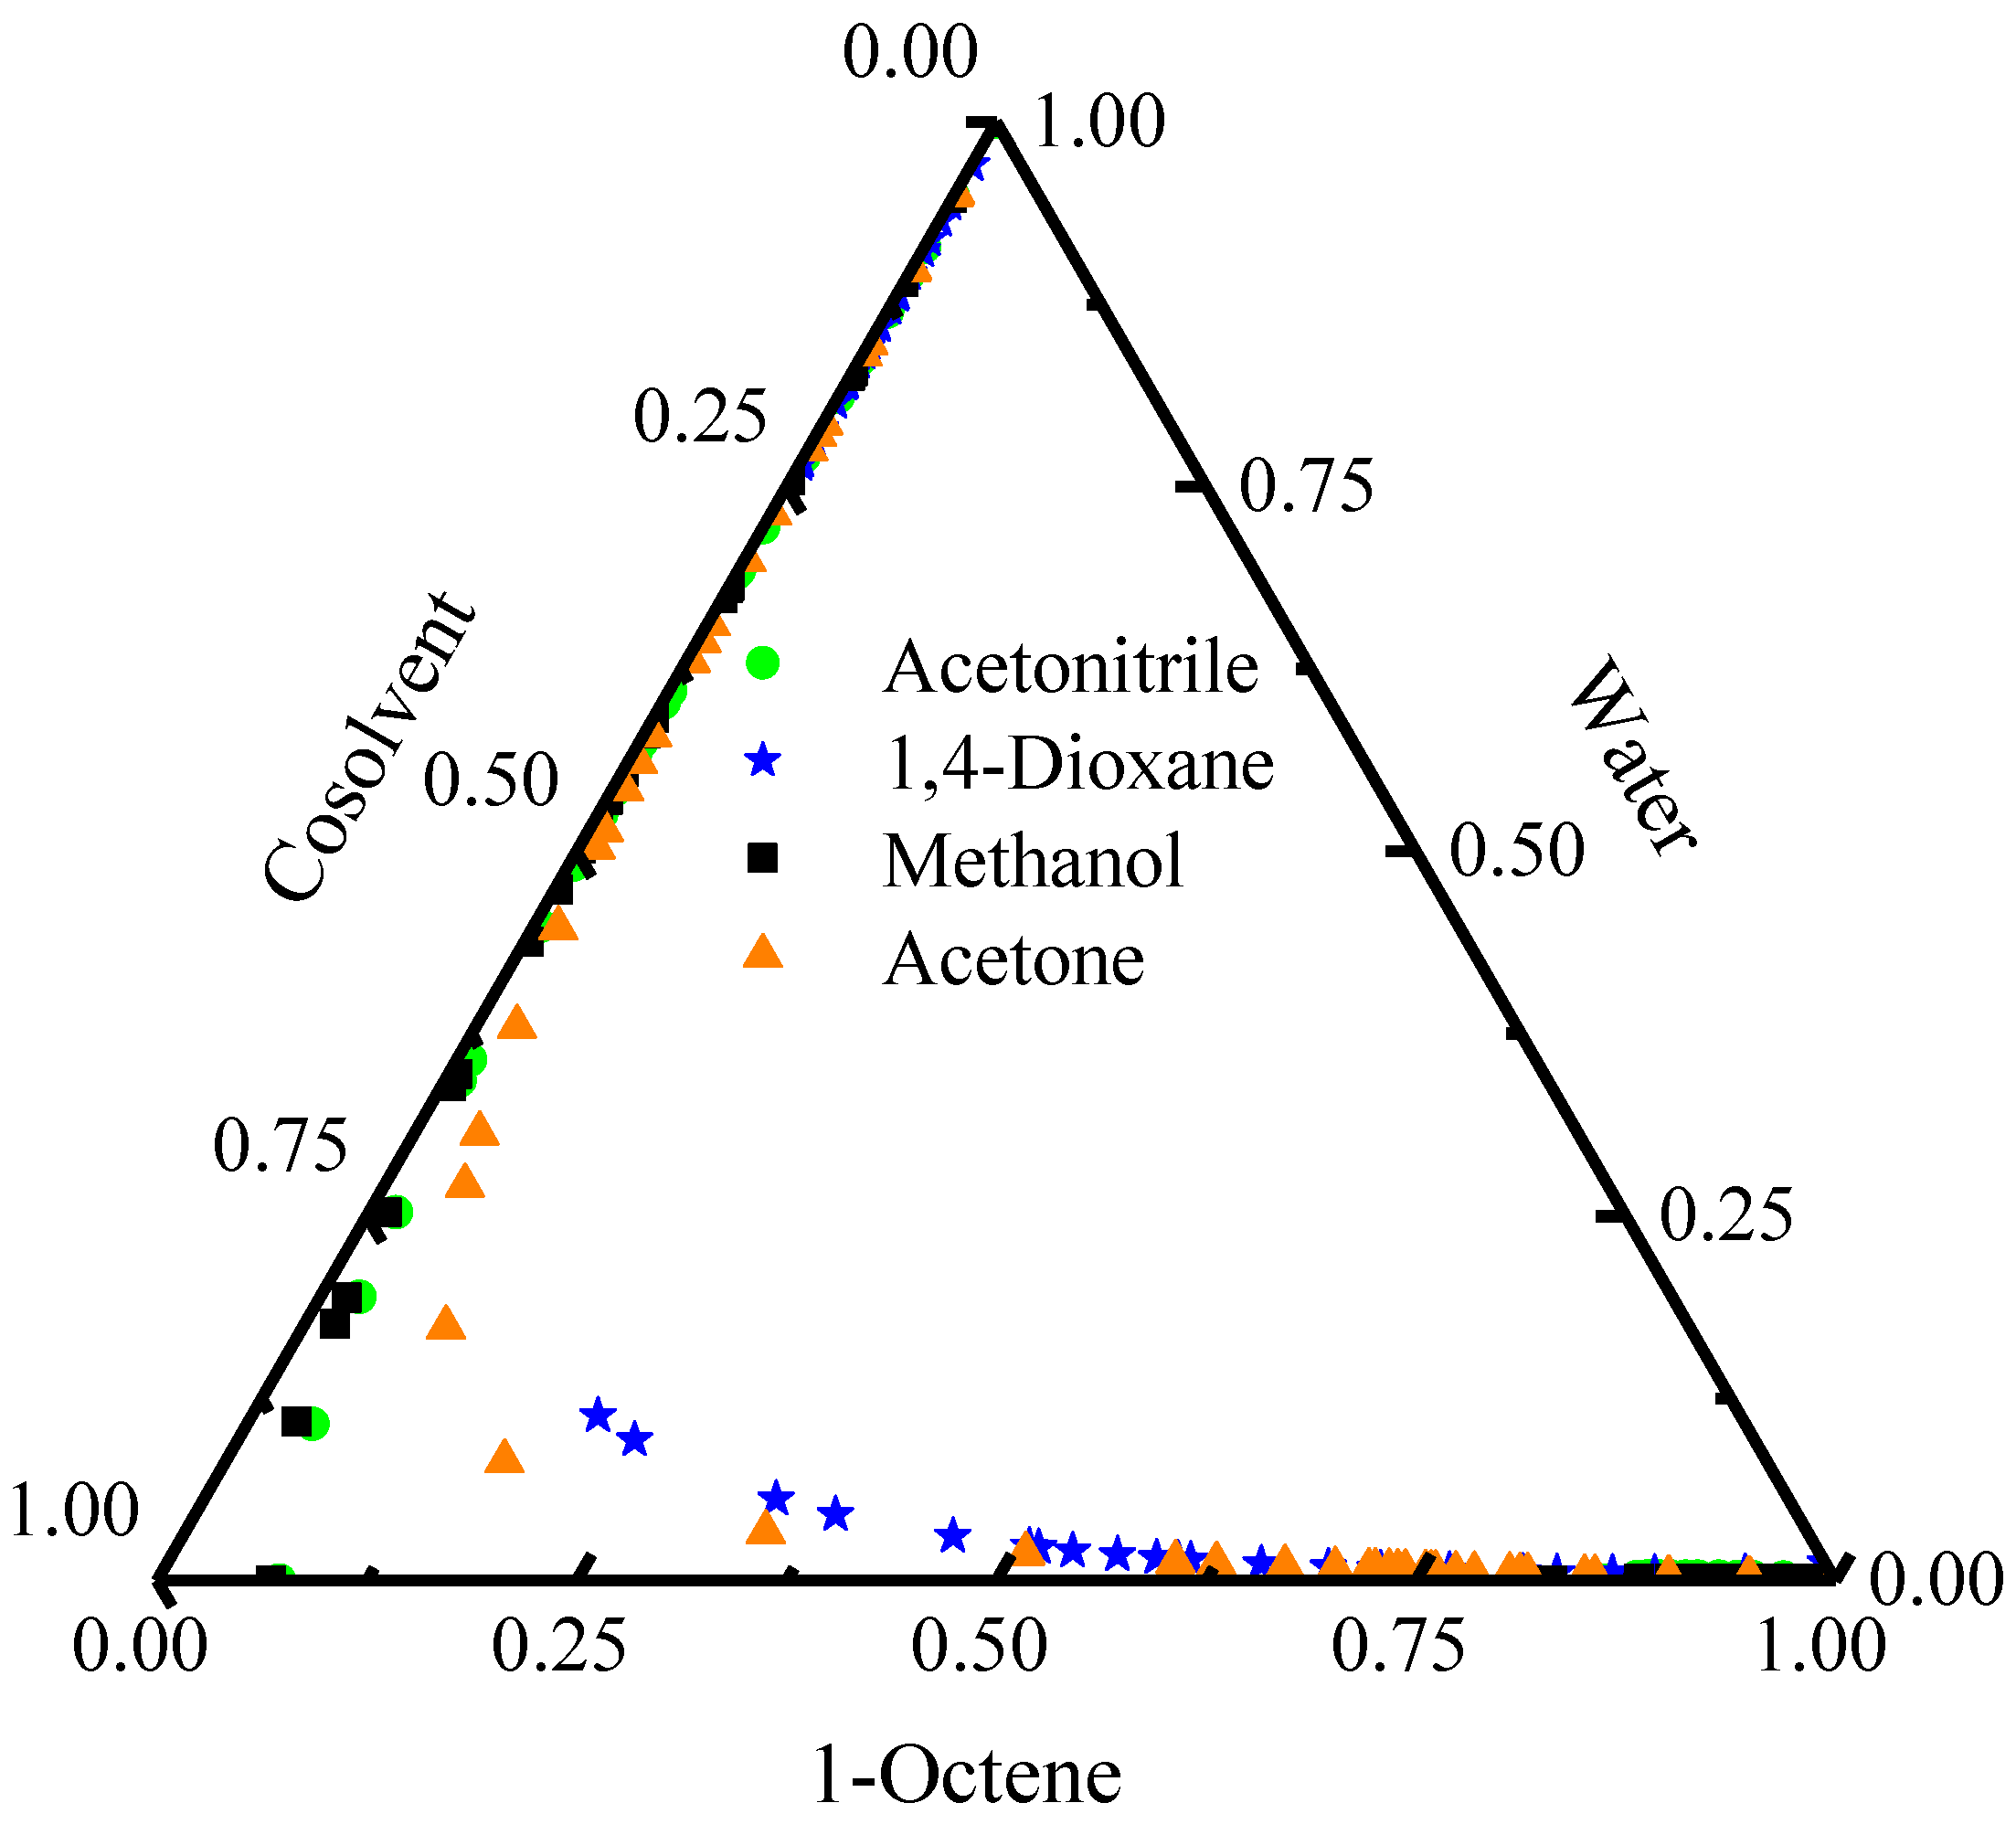
Figure 1. Ternary phase diagram of 1-octene–water–different cosolvents.
Processes 11 00777 g001
Figure 2. Experimental setup diagram. 1—mechanical stirrer, 2—pressure tap, 3—thermocouple, 4—autoclave, 5—heating jacket, 6—reactor controller.
Processes 11 00777 g002
Figure 3. Effect of stirring speed on the reaction.
Processes 11 00777 g003
Figure 4. Effect of temperature on the reaction. Note: the dots in the figure are used to represent experimental values and the lines are calculated values.
Processes 11 00777 g004
Figure 5. Effect of catalyst content on the reaction.
Processes 11 00777 g005
Figure 6. Positive reaction rate constant versus temperature.
Processes 11 00777 g006
Figure 7. Equilibrium constant versus temperature.
Processes 11 00777 g007
Figure 8. Residual curve plot of 1-octene hydration reaction quaternary system (1 atm).
Processes 11 00777 g008
Figure 9. Residual curve of 1-octene hydration reaction with different Da values (1 atm).
Processes 11 00777 g009
Figure 10. Trajectory plots of stable and saddle points at different Da values (1 atm).
Processes 11 00777 g010
Figure 11. Preliminary design of the process for producing 2-octanol by reactive distillation. (a): the first conceptual design; (b): the second conceptual design.
Processes 11 00777 g011aProcesses 11 00777 g011b
Table 1. NRTL model parameters.
Component ieneH2OeneeneH2Onol
Component jH2Onolnolaneaneane
TKKKKKK
α i j 000000
α j i 000000
b i j 994.1134404.598494.851−357.9702359.867−582.155
b j i 4637.743−303.495−138.528727.074−78.838692.938
Note: the above parameters are obtained from Aspen software.
Table 2. Comparison of literature value and calculated compositions of the azeotropes involved in 1-octene hydration reaction at normal pressure.
AzeotropeMass Composition/%Literature Value [32]Calculated ValueAbsolute
Difference
Water-1,4-dioxaneWater18.419.541.14
1, 4-dioxane81.680.461.14
T/°C87.887.880.08
1-octene-water1-octeneNo literature
was found
76.95
water23.05
T/°C88.41
2-octanol-water2-octanol2722.254.75
water7377.754.75
T/°C9899.031.03
1-octene-1, 4-dioxane1-octeneNo literature
was found
20.20
1, 4-dioxane79.80
T/°C99.98
Table 3. Comparison of experimental and calculated values of liquid–liquid two-phase in 1-octene–water–1,4-dioxane system at 55 °C.
Molar FractionComponentExperimental ValueCalculated ValueAbsolute Error
1-octene0.0001714.19 × 10−42.48 × 10⁻⁴
Aqueous phaseWater0.8350500.9468190.111769
1,4-dioxane0.1647800.0527620.112018
1-octene0.5271500.6664720.139322
Oil phaseWater0.0202900.1325410.112251
1,4-dioxane0.4525600.2009870.251573
1-octene0.0002800.0008615.81 × 10−4
Aqueous phaseWater0.8107100.9238420.113132
1,4-dioxane0.1890100.0752980.113712
1-octene0.4427400.5570790.114339
Oil phaseWater0.0463200.1777380.131418
1,4-dioxane0.5109400.2651820.245758
1-octene0.0004250.0014741.05 × 10−3
Aqueous phaseWater0.7902900.9024220.112132
1,4-dioxane0.2092900.0961040.113186
1-octene0.3797800.4740920.094312
Oil phaseWater0.0682100.2113120.143102
1,4-dioxane0.5520100.3145960.237414
Table 4. Saturated vapor pressure calculation formula for each component.
Calculation Formula
p e n e s a t = exp [ 74.936 7155.9 / T 7.5843 log ( T ) + ( 1.7106 10 17 ) T 6 ]
P H 2 O s a t = exp [ 18.3036 3816.44 / ( T 46.13 ) ] 101,325 / 760
p n o l s a t = exp [ 185.83 14520 / T 23.624 log ( T ) + 0.000010885 T 2 ]
p a n e s a t = exp [ 37.586 5406.7 / T 3.1287 log ( T ) + 2 10 ( 0 18 ) T 6 ] 1000
The units of P e n e s a t , p H 2 O s a t , p n o l s a t and p a n e s a t are Pa, and the units of temperature T are K
Disclaimer/Publisher’s Note: The statements, opinions and data contained in all publications are solely those of the individual author(s) and contributor(s) and not of MDPI and/or the editor(s). MDPI and/or the editor(s) disclaim responsibility for any injury to people or property resulting from any ideas, methods, instructions or products referred to in the content.