Article

Evaluation of Relative Permeability Curves in Sandstone Core Flooding Using Computational Fluid Dynamics

1
Department of Physics and Engineering, California State University, Bakersfield, CA 93311, USA
2
Department of Geological Sciences, California State University, Bakersfield, CA 93311, USA
*
Author to whom correspondence should be addressed.
Processes 2023, 11(3), 780; https://doi.org/10.3390/pr11030780
Submission received: 12 February 2023 / Revised: 2 March 2023 / Accepted: 3 March 2023 / Published: 6 March 2023
(This article belongs to the Section Chemical Processes and Systems)

Abstract

:
Geological carbon sequestration is a proven method of safely storing carbon dioxide in formations, thereby reducing atmospheric carbon imprint and mitigating global warming. The relative permeability to carbon dioxide versus brine/water in geological formations determines flow characteristics of one fluid in the presence of another. The objective of this research is to evaluate the relative permeability to carbon dioxide in both the gas phase and the supercritical state in the presence of water in a Vedder sandstone core sample. The sandstone sample used is medium- to fine-grain arkosic artenite containing primarily quartz, potassium feldspar, plagioclase, and biotite. The effect of the viscosity ratio between the non-wetting phase and the wetting phase, on the relative permeability to the non-wetting phase, is studied. Computational fluid dynamics (CFD) is used for this study. Results show that with the same amount of irreducible water fraction, the endpoint relative permeability to the non-wetting phase is approximately one order of magnitude lower for supercritical carbon dioxide than for gaseous carbon dioxide. The endpoint relative permeability does not change significantly with the change in inlet pressure for gaseous carbon dioxide. Additionally, the endpoint relative permeability to the non-wetting phase increases with an increase in the viscosity ratio. Results suggest that CFD can be effectively used to study relative permeability, precluding expensive experiments.

1. Introduction

The development of industries and the increase in human activities worldwide has caused the amount of worldwide greenhouse gas emissions to surge through the past few decades. Worldwide greenhouse gas emissions have increased from 32.65 billion tons in 1990 to 48.94 billion tons in 2018 [1]. Carbon dioxide (CO2) is a greenhouse gas that contributes to global warming. At the global scale, carbon dioxide contributes to 76% of the greenhouse gases emitted to the atmosphere [2]. Carbon dioxide traps heat that is produced both naturally and through anthropogenic activities. Human activities such as fossil fuel combustion, limestone usage for making concrete, and land use change significantly add atmospheric carbon imprint.
Carbon sequestration is a well-known method of securing carbon dioxide such that it is prevented from entering Earth’s atmosphere. Carbon sequestration can be generally classified into two categories: (a) biological carbon sequestration and (b) geological carbon sequestration. Biological carbon sequestration is the process of storing carbon dioxide in oceans and various forms of vegetation such as forests and grasslands. Several oceanic sequestration processes are effective towards reducing atmospheric carbon imprint. One such mechanism is Phytoplankton photosynthesis. However, excess carbon dioxide is also known to reduce ocean’s pH, rendering ocean water more acidic. On the other hand, terrestrial sequestration is a type of biological carbon sequestration which is associated with capturing and storing carbon dioxide in soil and vegetation closer to Earth’s surface. Terrestrial sequestration involves storing carbon dioxide in both live and dead organic matter, which may also be associated with several advantages such as enhancement in crop yield, improvement of the quality of water and soil, and restoration of ecosystems. Similarly, geological carbon sequestration is the method of capturing and storing atmospheric carbon dioxide in underground formations such as various rocks, saline aquifers, and depleted hydrocarbon reservoirs. A significant challenge associated with geological carbon sequestration is the sealing capacity of low-permeable caprocks around the potential storage reservoirs identified for sequestration. It is suggested that the technology to safely store carbon dioxide should be considered only if it can be stored for a minimum of 1000 years with a leakage rate as low as 0.1% for a year. Caprocks have been known to fail through mechanisms such as pore space leakage by exceeding the capillary breakthrough pressure, well leakage due to degradation or inappropriate abandoning of wells, or caprock diffusive losses. While caprock diffusive losses are usually low, leakage due to faults can be critical [3,4,5,6,7,8,9,10,11,12]. The carbon dioxide injection system used in geological carbon sequestration consists of three main components such as the tubing pipe, the casing pipe, and the well annulus. Carbon dioxide flows from the tubing pipe to the well-bottom with perforations and is eventually injected into the formations. The process has been proven promising, as it can help reduce the carbon imprint in the atmosphere, which, in turn, can mitigate global warming. Carbon dioxide is injected into the small pores of rocks that are generally occupied by saline groundwater. The simultaneous presence of at least two fluids in the porous rocks makes the process very complex. This also suggests that the ability of one fluid to flow in the presence of the other is reduced [13].
One of the key parameters associated with the injection of carbon dioxide into geological formations is the relative permeability to carbon dioxide in relation to water or brine, which determines the flow characteristics within the formations [14,15]. The relative permeability is a non-dimensional parameter that is defined as the ratio of the effective permeability to a phase in the multiphase flow to the absolute permeability to the wetting phase in the single-phase flow. The relative permeability is given by Equation (1):
k r i = k i k ,
where k r i is the relative permeability to phase i, k i is the effective permeability to phase i, and k is the absolute permeability to the wetting phase in the single-phase flow. The effective permeability to the phase can be calculated using Darcy’s law, as given by Equation (2):
q i = k i μ i P i ,
where q i is the volumetric flow rate of the fluid phase i, μ i is the dynamic viscosity of the fluid phase, and P i is the pressure drop associated with the phase. Relative permeability curves provide useful information about the multiphase flow processes in different natural settings as well as engineering applications such as the production of hydrocarbons from subsurface reservoirs, groundwater remediation, and carbon sequestration.
The relative permeability to the non-wetting phase such as carbon dioxide is also influenced by the irreducible concentration of the wetting phase such as water or brine. The irreducible concentration of water is defined as the fraction of pore space occupied by water that cannot further be reduced through carbon dioxide injection. Traditionally, relative permeability curves have been obtained experimentally. One of the earliest reports that investigated the relationship between liquid saturation in porous media and its permeability to the liquid or gas phase showed experimental results using water and carbon dioxide in a consolidated sandstone [16]. Several subsequent published manuscripts confirmed the following observations: (a) With increasing saturation of the non-wetting phase, the relative permeability to the wetting phase ( k r w ) tends to decrease; (b) With increasing saturation of the non-wetting phase, the relative permeability to the non-wetting phase ( k r n w ) tends to increase [17,18,19,20]. Traditionally, relative permeability curves have been measured through core flooding experiments in the laboratory. However, these experiments are time-consuming and expensive. Hence, numerical simulations can provide valuable information and, thereby, reduce costs associated with expensive experimentation.
Currently, limited published data are available on relative permeability measurements from drainage experiments. Additionally, a lot of the published literature associated with such measurements discusses relative permeability associated with gases other than carbon dioxide [16,21,22,23]. In addition, most CFD literature modeling carbon dioxide versus brine drainage experiments study supercritical carbon dioxide [24,25,26,27,28]. Carbon dioxide exists in the supercritical state when the temperature and pressure are above critical values (Tc = 31.1 °C, and Pc = 7.38 MPa). In the supercritical state, carbon dioxide behaves similar to a gas, but its density is comparable to that of a liquid. Additionally, there are large discrepancies in the available experimental data on the endpoint relative permeability to the non-wetting phase ( k r n w ). For instance, while some articles reported endpoint relative permeability to the non-wetting phase being as high as close to unity [16,21,29,30,31], some of the recently published articles showed that the endpoint relative permeability was 0.7 or less [23,32,33,34]. General observations by separate research groups from the 1970s through the 1990s suggested that with an irreducible wetting phase fraction of approximately 20%, the relative permeability to the non-wetting phase was almost unity [29,30,31]. On the other hand, while Oak et al. reported the endpoint relative permeability to the non-wetting phase as approximately 0.7 [23], Krevor et al. reported a relative permeability which was as low as approximately 0.4 [32]. In many of these articles, results were reported at significantly different conditions that would not warrant direct comparisons. For example, various researchers used different fluids at different temperatures and pressures. While Pini and Benson [13] reported data with gaseous nitrogen displacing water, and with supercritical carbon dioxide displacing brine in sandstone core samples, Botset [16] reported results with carbon dioxide in the gas phase displacing water. Likewise, Brooks and Corey [21] reported results with air as the non-wetting phase and a hydrocarbon liquid as the wetting phase. Oak et al. [23] conducted their research with nitrogen replacing brine in the sandstone core sample. Krevor et al. [32] showed their results with supercritical carbon dioxide displacing water. In addition, the sandstone cores used in these experiments were associated with varying degrees of porosities and permeabilities and had different sizes.
The goal of this research is (i) to use CFD to study the endpoint relative permeability to the non-wetting phase across varying inlet pressures with carbon dioxide in both the gas phase and the supercritical state displacing water in the Vedder sandstone core sample; (ii) to evaluate the effect of viscosity ratio on endpoint relative permeability to the non-wetting phase; and (iii) to assess the applicability of CFD to study relative permeability to the non-wetting phase in a typical drainage experiment involving a sandstone core sample. If applicable, then CFD can be used with confidence to reduce costs associated with expensive experimentation.

2. Materials and Methods

To simulate the drainage experiment associated with the injection of carbon dioxide in a sandstone core, the authors measure porosity in a similar sandstone core such that it may be used as an input for numerical simulations. For the purposes of measurement only, one Vedder sandstone core sample was taken from Round Mountain No. 1 Well in Round Mountain Oilfield located on the east side of the San Joaquin Basin of California. The Vedder Sandstone Formation is an Oligocene oil-bearing sandstone deposited in a shallow marine environment approximately 23–33.9 million years ago. It is also the most prolific formation in the Round Mountain Oil Field [35]. Porosity is measured using image analysis of the microCT scan. The grayscale of the scan represents X-ray attenuation, resulting in the pore space being displayed as very low grayscale. The scan data volumes were thresholded and the pore space was segmented. Following this step, the porosity was calculated. The following section details the experimental apparatus and the general method used for the measurement of porosity.

2.1. Micro-CT Scan and Image Processing Methods

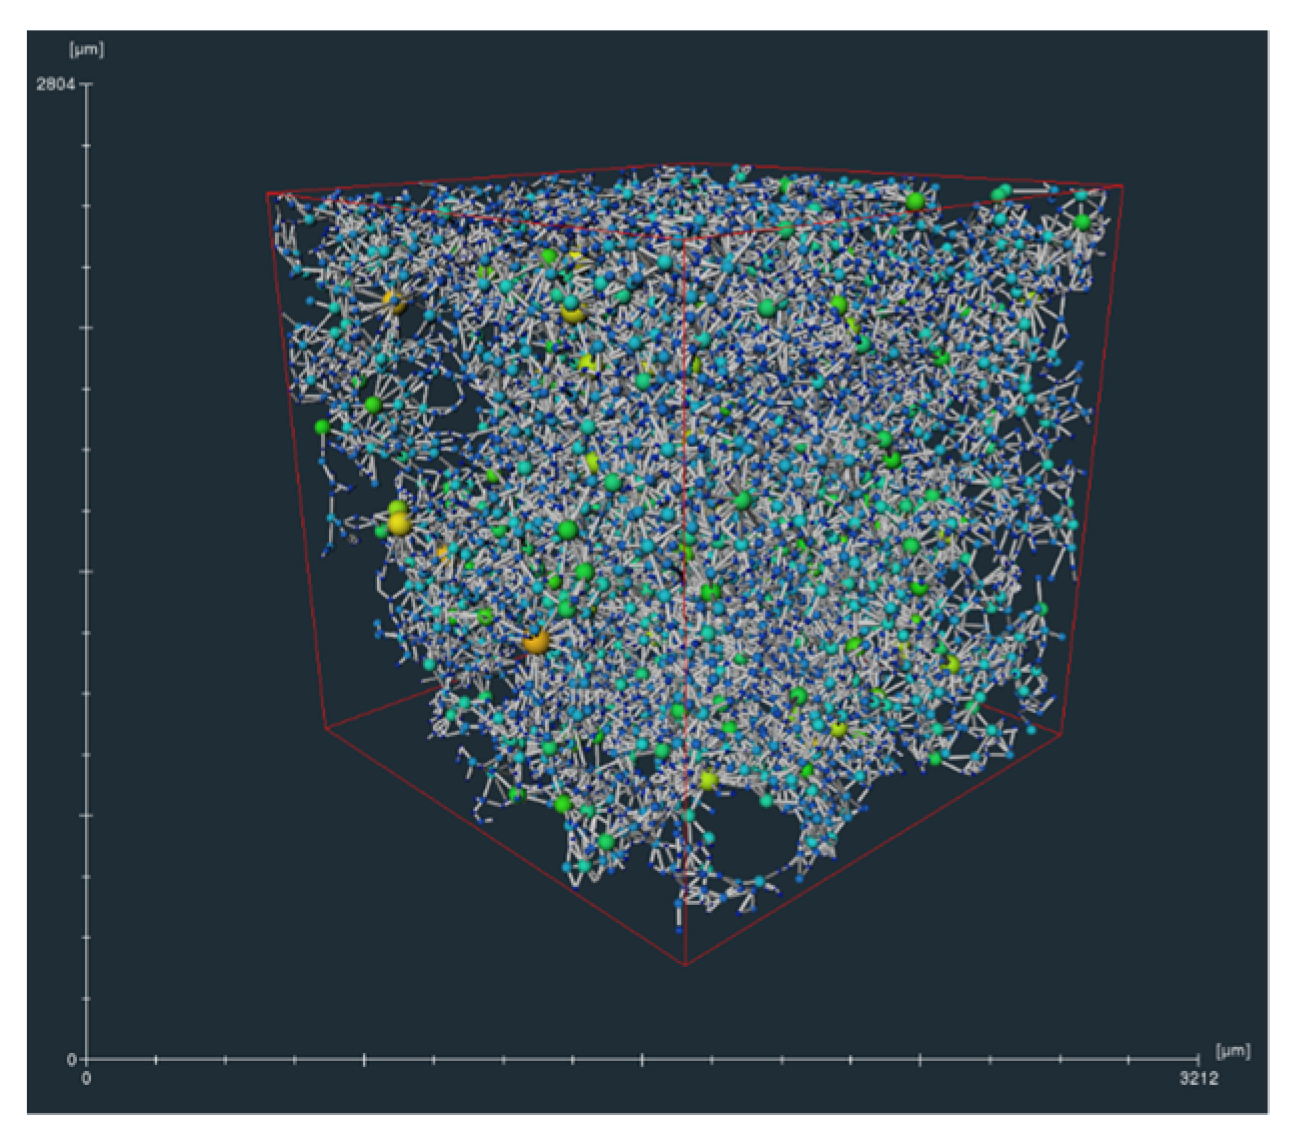
Prior to scanning, the representative core sample of Vedder sandstone was cut and polished into an 8 mm × 8 mm × 5 mm cuboid at California State University, Bakersfield, Sample Preparation Laboratory. The polished sample was scanned with a Phoenix Nanotom M nanofocus X-ray CT system. The detector used was dxr-5001, the timing was 1250.361 ms, the X-ray voltage was 100 kV, the current was 90 μA, and the filter was 0.1 mm Cu. The voxel size of the raw scan was 3.3 μm. The resulting image stack was processed with PerGeos Software. As shown in Figure 1, the raw scan was subsampled to 6003 voxels. To reduce noise and enhance the contrast, a non-local means filter was applied to the raw scan [36]. Next, pores were manually segmented from the rock volume. Porosity was obtained as the voxel number of pores divided by the total number of voxels in the rock volume. As shown in Figure 2, an idealized pore network model was extracted from the connected porosity [37]. Finally, the measured porosity is used in numerical analysis to simulate a typical drainage experiment in a cylindrical sandstone core sample of given dimensions.

2.2. Numerical Method

Computational fluid dynamics (CFD) simulations are performed using the commercial code, ANSYS Fluent 18.2 [38]. Transient multiphase flow simulations are performed. Initially, the core sample is filled with water. Carbon dioxide is injected through the inlet at a given inlet pressure. The permeability and the resistance loss coefficient used in the simulations are 1 × 10⁻¹² m2 and 1 × 10⁻¹² m−1, respectively, as these values are representative of typical drainage experiments [39]. The laminar flow model is used. The relative permeability of carbon dioxide is calculated every second. The volume of fluid (VOF) multiphase flow model is used. This model is typically used when two or more immiscible fluids are modeled. In addition, the model is useful towards tracking any liquid–gas interface in steady or transient CFD simulations [38]. To solve the transient problem, the mass and momentum conservation equations are solved as shown by Equations (3) and (4), respectively. The interface between the phases is tracked using the solution of the mass conservation equation as shown by Equation (3):
t α q ρ q + . α q ρ q v q = 0 ,
where α q is the volume fraction of the qth phase, ρ q is the density of the qth phase, and v q is the velocity of the qth phase.
A single momentum equation is solved throughout the flow domain and the resulting velocity field is shared by the phases.
t ρ v + . ρ v v = p + . μ v + v T + ρ g + F ,
where p is the pressure associated with the flow, g is the acceleration due to gravity, and F is the body force.
Similarly, the energy equation is also shared among the phases as shown by Equation (5):
t ρ E + . v ρ E + p = . k e f f T + S h ,
where E is energy, T is temperature, and k e f f is the effective thermal conductivity. The source term S h contains contributions from radiation or any other volumetric heat sources [17]. The porous media within the sandstone core is modeled using two terms: (a) viscous resistance and (b) inertial resistance. The source term including these terms is defined by Equation (6):
S i = j = 1 3 D i j μ v j + j = 1 3 C i j 1 2 ρ v j v j ,
where S i is the source term for the ith momentum equation, and D and C are the prescribed matrices associated with the viscous losses and inertial losses, respectively. As the criteria for convergence, the residuals for all equations are set as 10−5.
Meshing
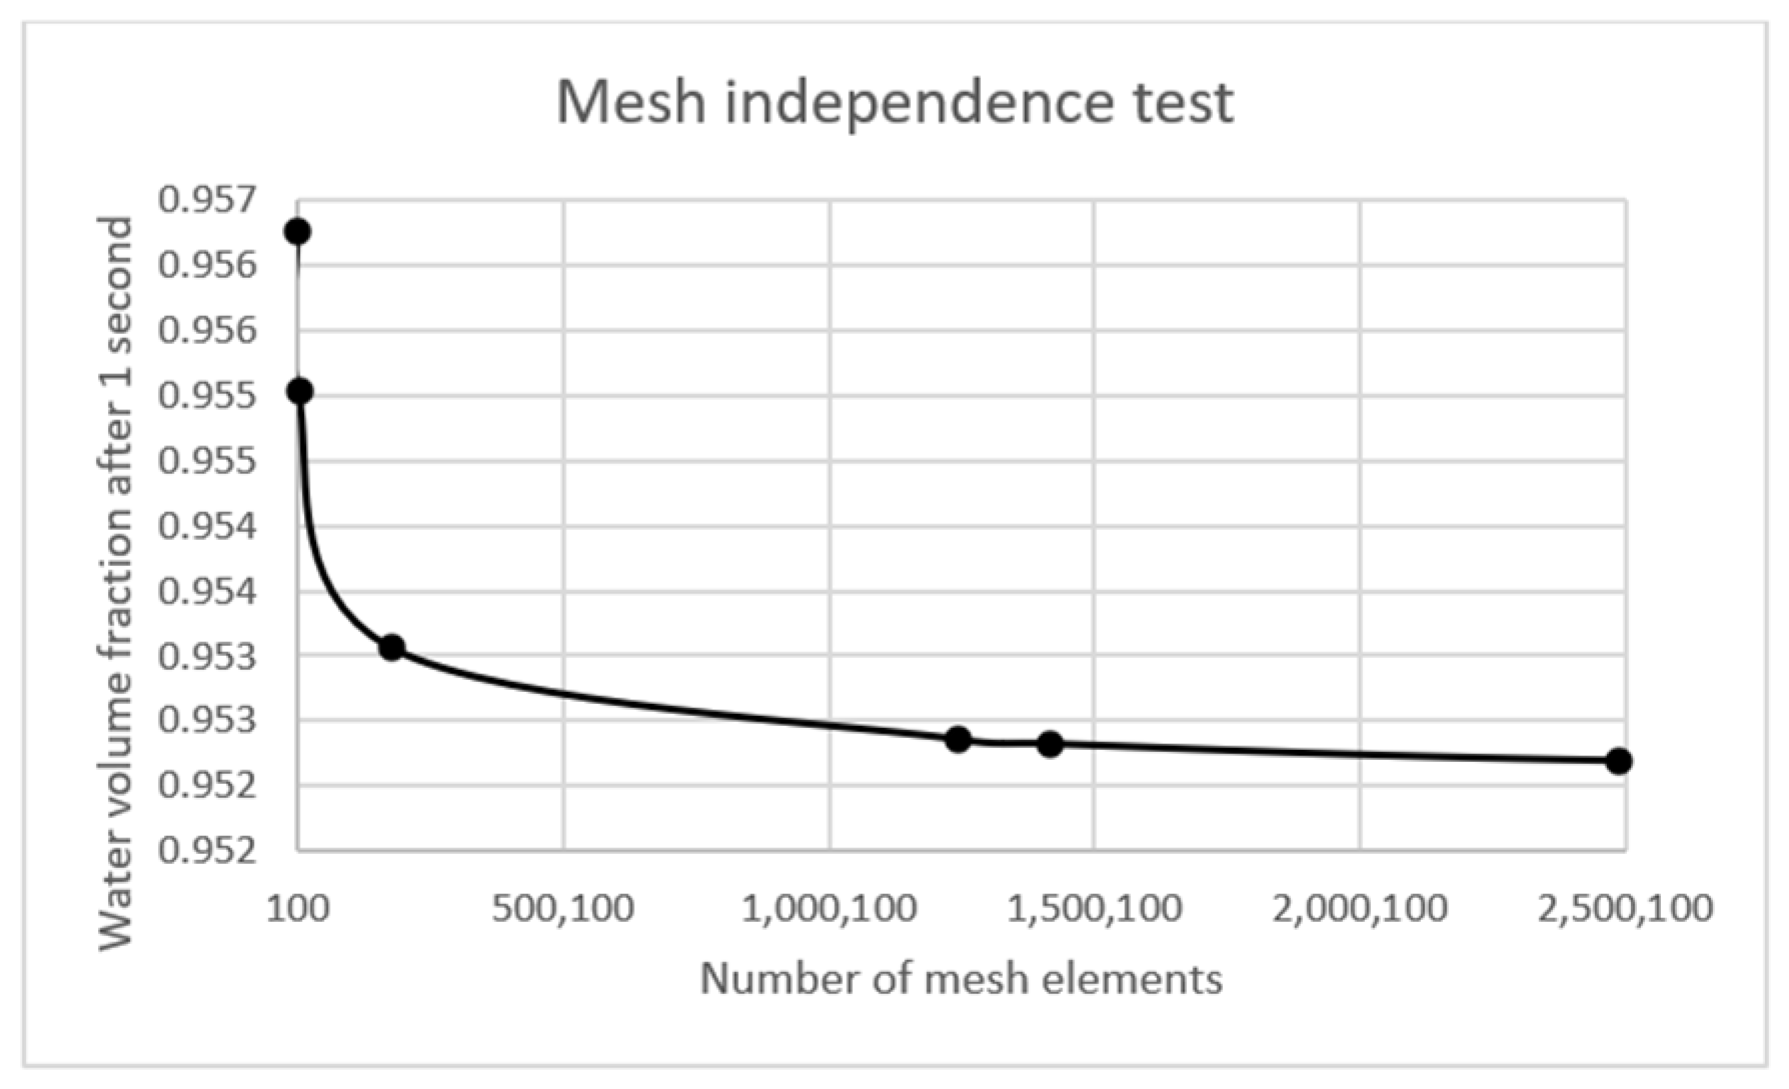
The geometry is meshed using the ANSYS meshing tool. Hexahedral mesh elements are used. Figure 3 shows the meshed geometry. Mesh independence is obtained with a maximum mesh size of 0.05 cm, and 1.24 million mesh elements. To check mesh independence, the water volume fraction after 1 s is obtained as a function of the number of mesh elements. Figure 4 shows the mesh independence test results.

3. Results and Discussion

Transient CFD simulations are performed to simulate carbon dioxide injection into the sandstone core sample to displace water. The numerical method is validated against experimental results reported by Cole and Rasouli [39].

3.1. Validation

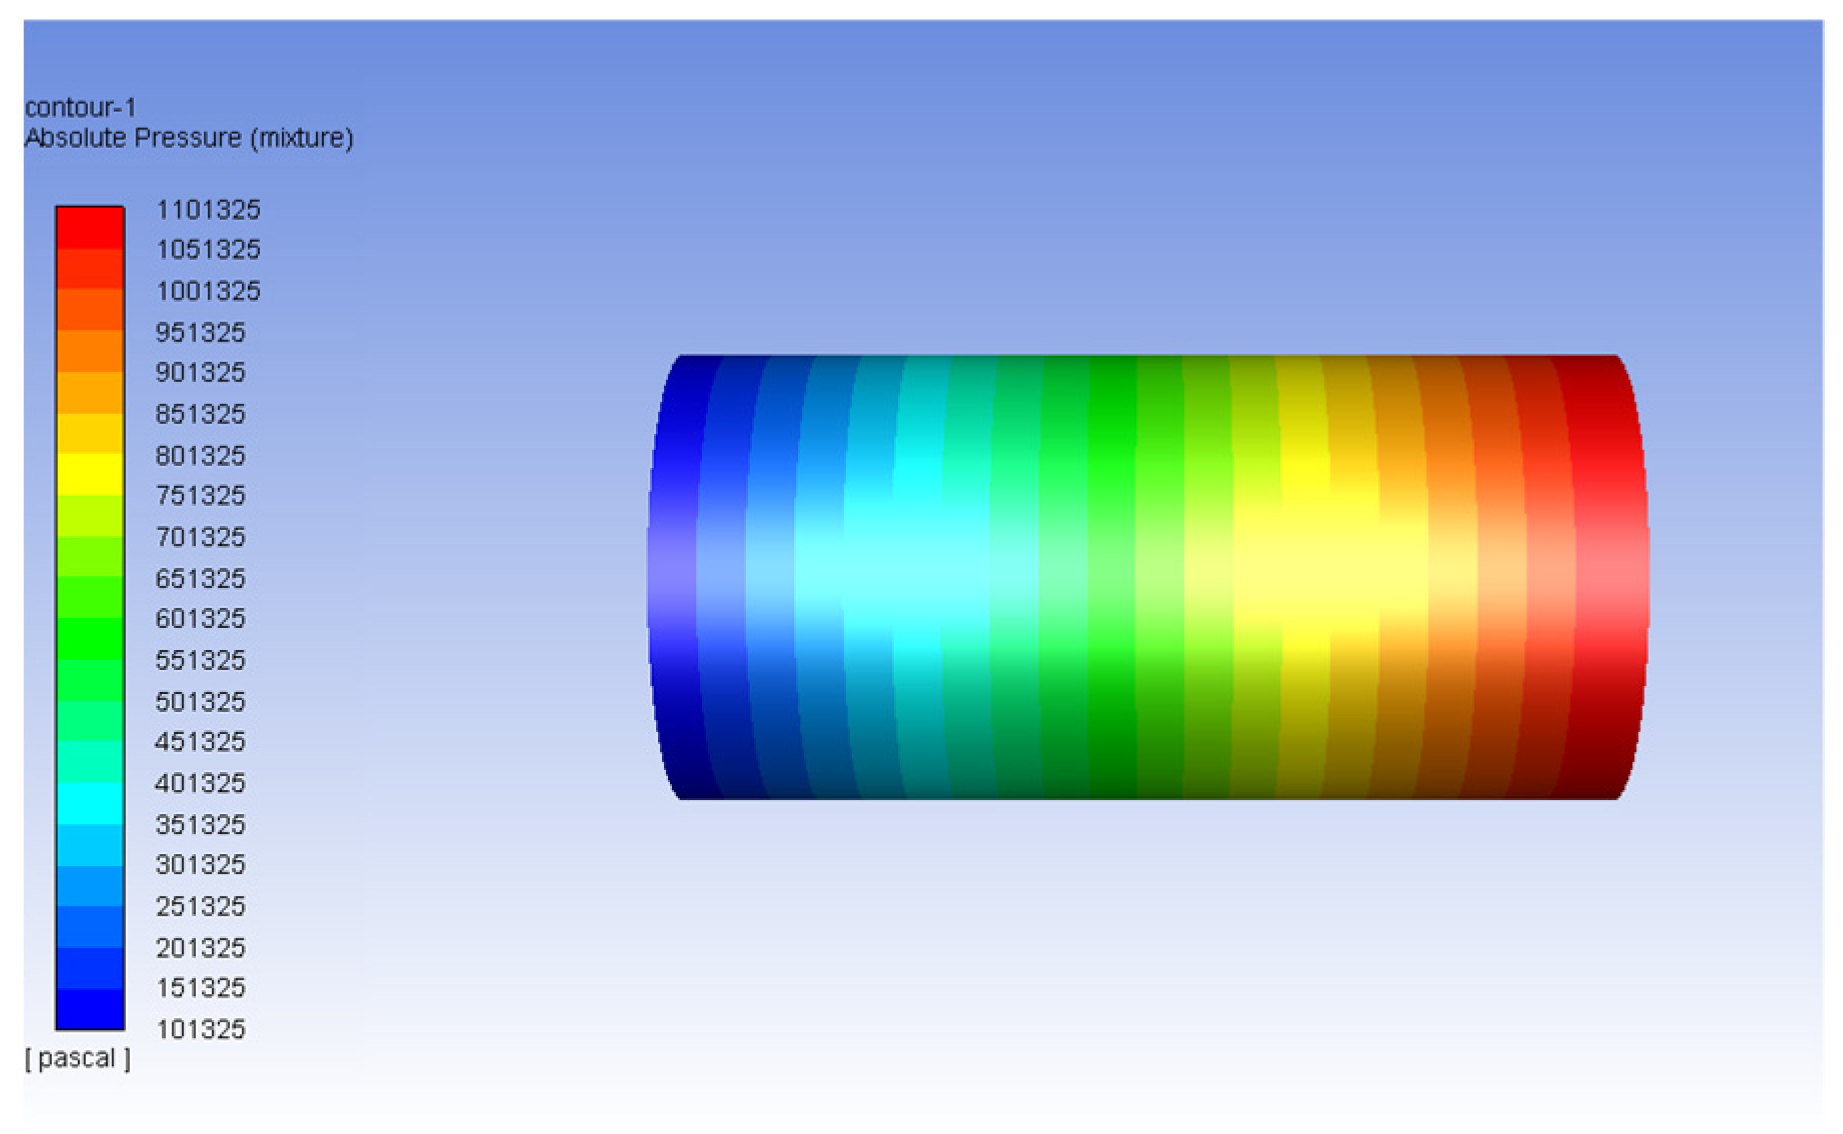
The sandstone core sample geometry used by previous researchers was cylindrical, 38 mm in diameter and 79 mm in length. The porosity of the sandstone core was 0.2. The irreducible water fraction within the geometry was 45.57% [39]. For the simulations, the sandstone core is filled with water initially, when carbon dioxide in the gas phase is injected into the core through the inlet. The boundary conditions are set to replicate the experimental conditions in the laboratory [39]. At the inlet, a uniformly distributed gauge pressure of 1 MPa is introduced. The outlet is left at atmospheric pressure. Figure 5 shows the pressure drop across the sandstone core after 1 s from start. Carbon dioxide is injected in the positive direction of the Z axis.
The percentage pore volume of water displaced is calculated as a function of time. Figure 6 shows a comparison between the previously reported experimental data and the numerical results obtained. The results show a close agreement between the simulation results and the previously reported experimental results. The percentage pore volume of produced water approaches 0.5 after approximately 40 s from the start.

3.2. Carbon Dioxide in Gas Phase Versus Water

The validated CFD model is used to simulate relative permeability to each phase as a function of gas saturation. The authors use the same simulation geometry, which is 38 mm in diameter and 79 mm in length. A porosity of 0.188 measured on the Vedder sandstone is used as an input. With carbon dioxide in the gas phase, three different simulations are performed at inlet pressures of 2.6 MPa, 5.2 MPa, and 7.2 MPa. The outlet is left at atmospheric pressure. The temperature is kept constant at 50 °C. The dynamic viscosity of carbon dioxide in the gas phase at these three pressures are the same. At time t = 0, the sandstone core is filled with water and carbon dioxide is injected through the inlet. Table 1 shows the material properties of the fluids used in simulations [40,41].
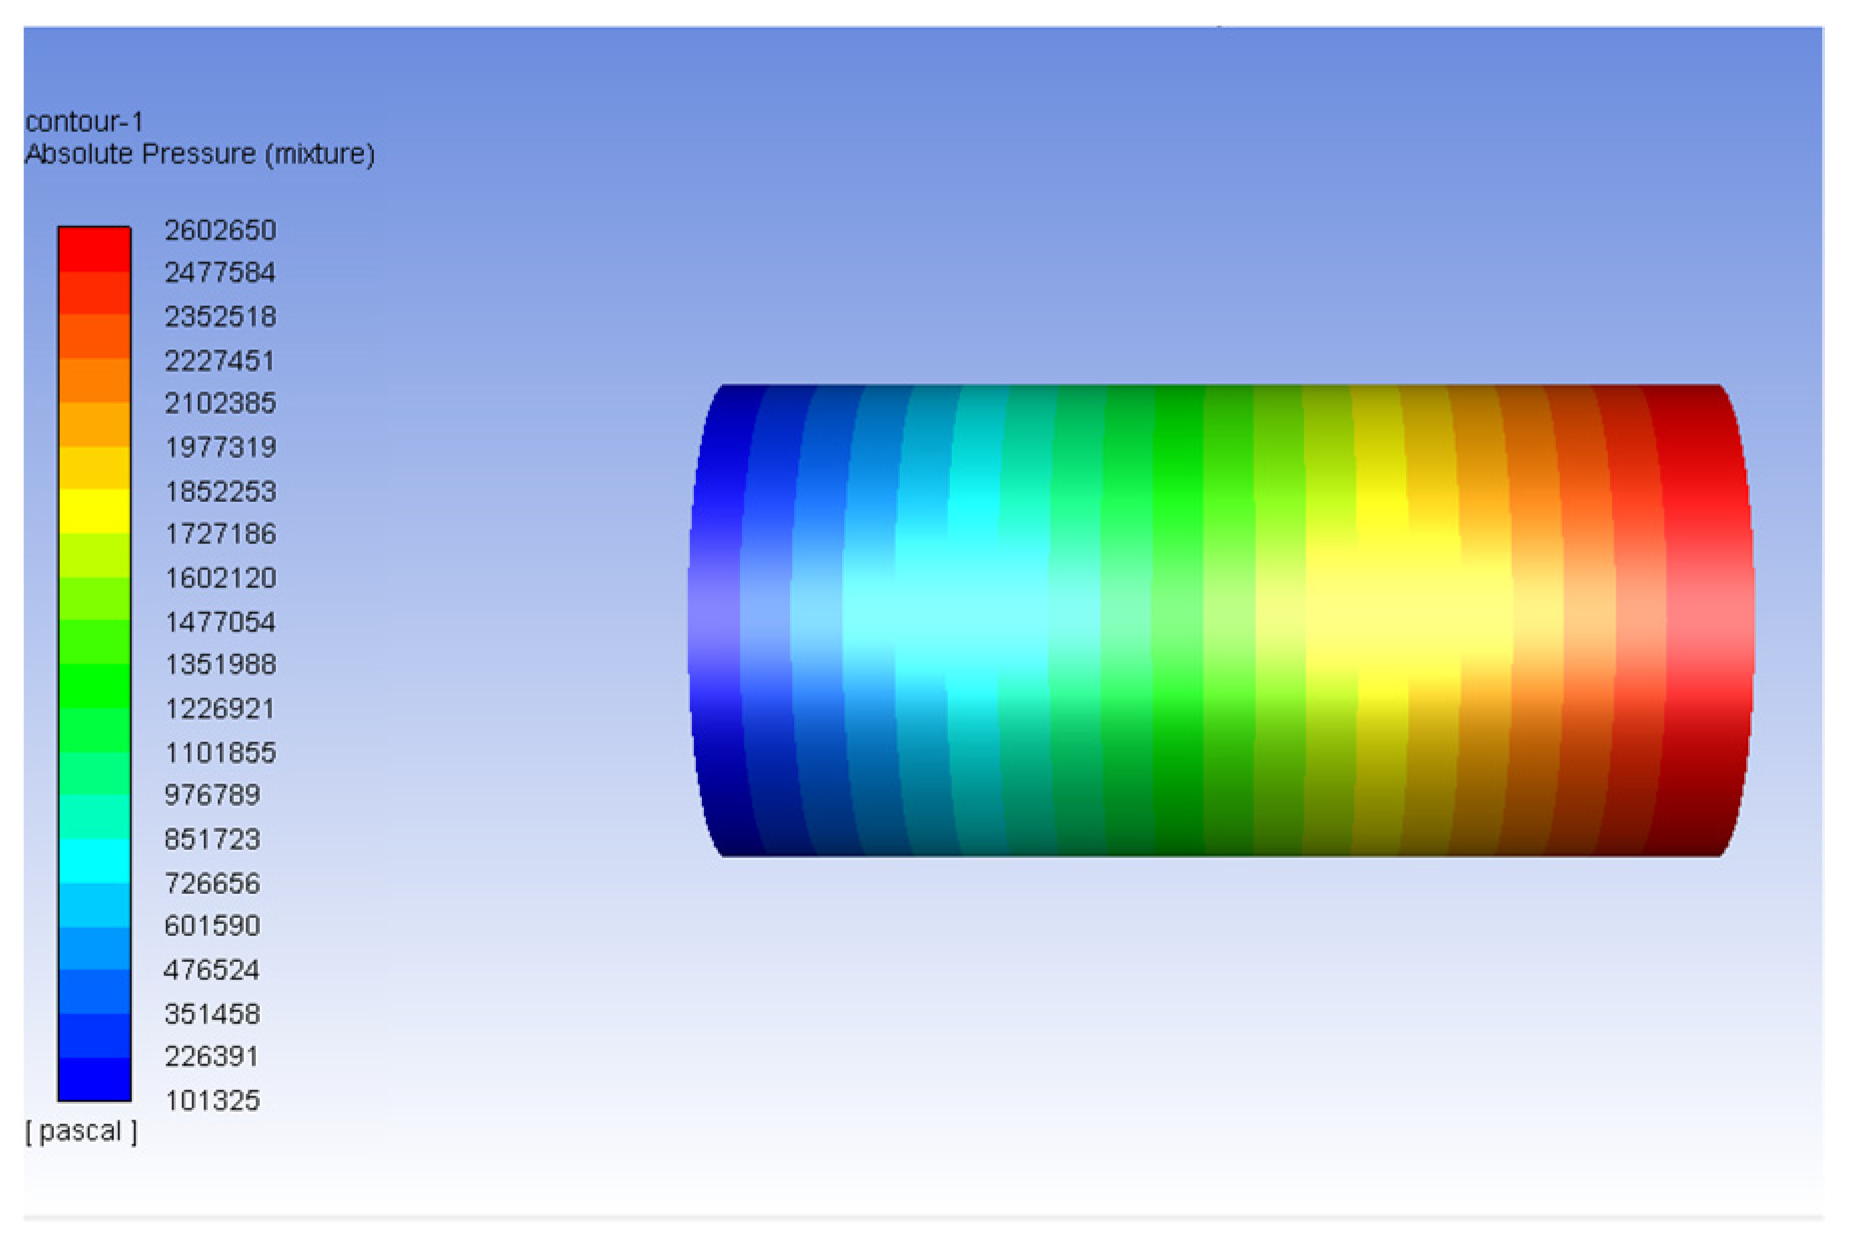
Figure 7 shows the pressure drop across the sandstone core sample after 1 s from start with an inlet absolute pressure of 2.6 MPa. The pressure drops uniformly to atmospheric pressure at the outlet. The pressure profile is representative of the drainage experiments involving carbon dioxide in the gas phase.
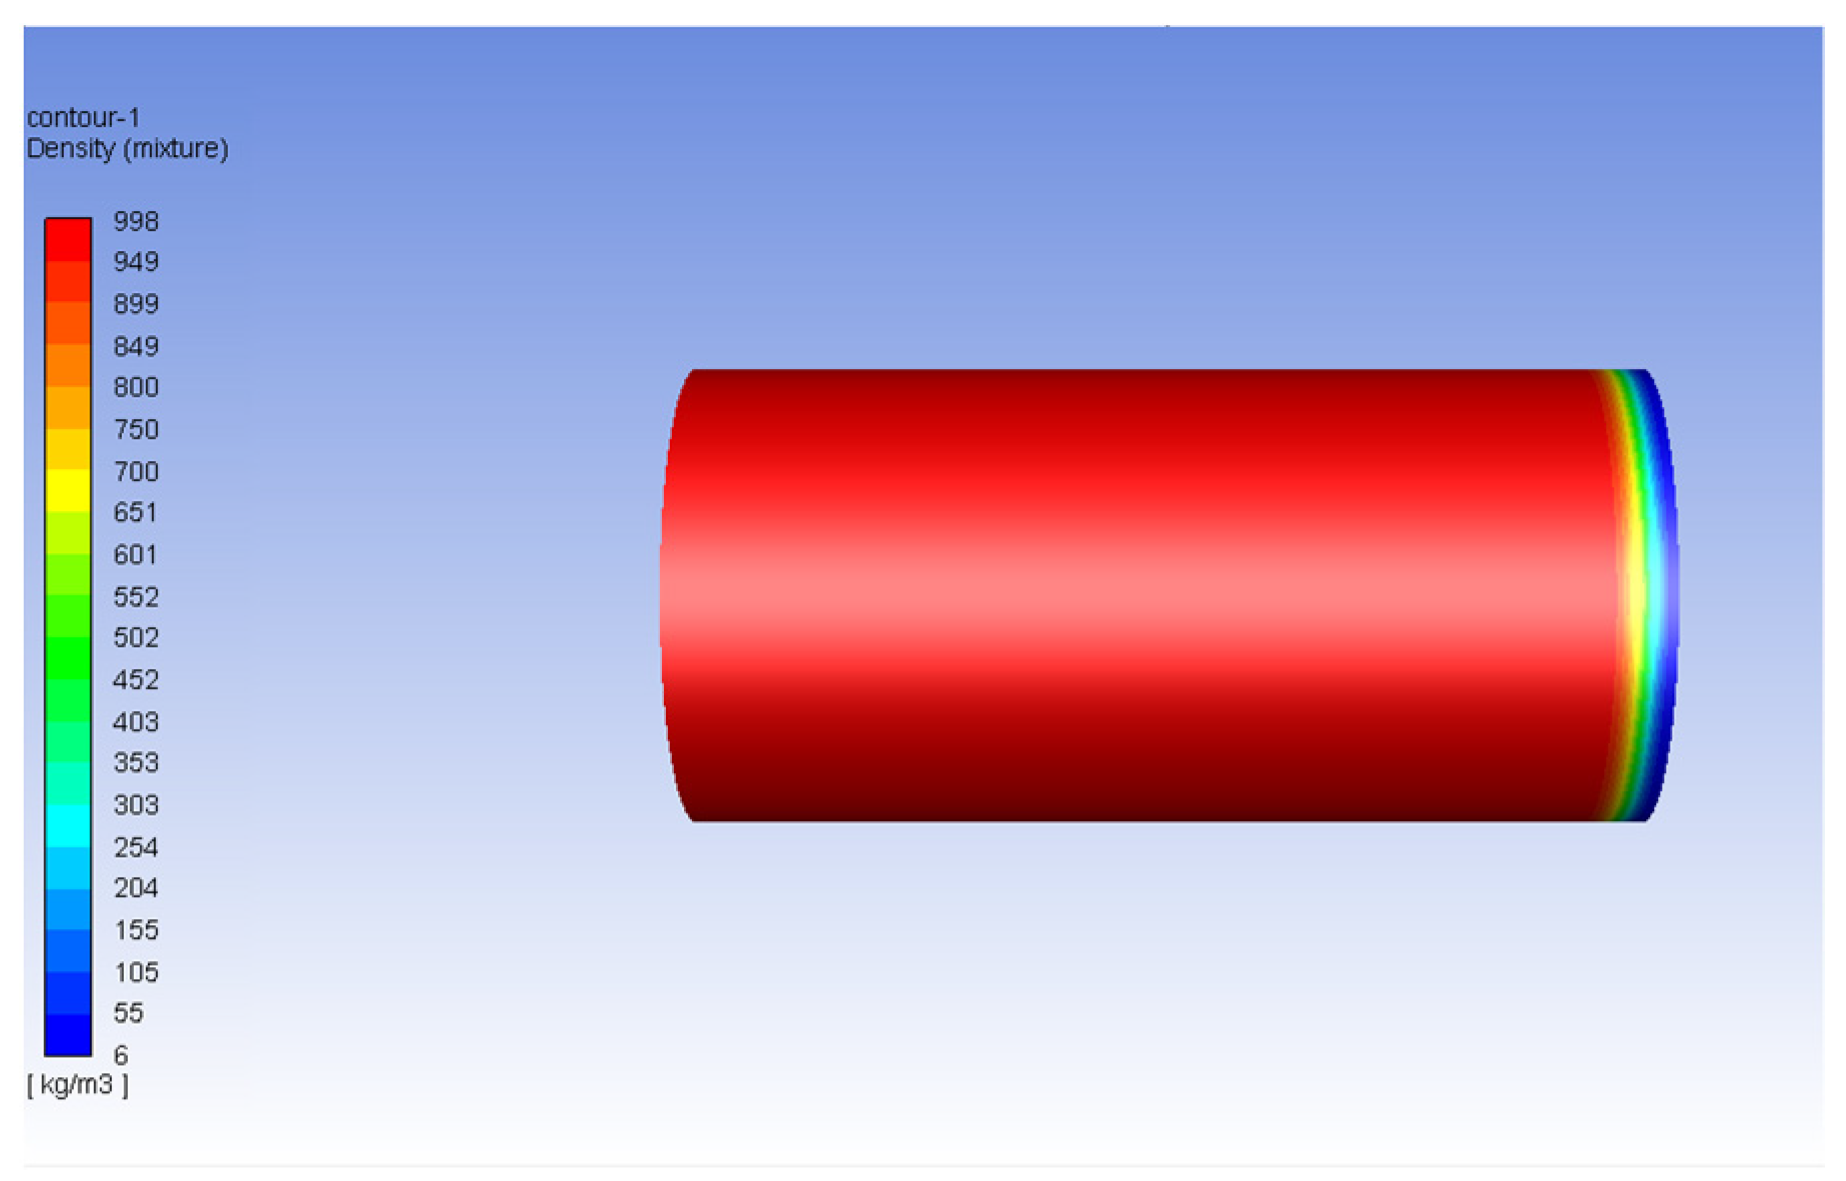
Figure 8 shows the density profile across the sandstone core 1 s after injection of carbon dioxide in the gas phase. The density profile is also suggestive of the propagation of carbon dioxide as it displaces water in the sandstone core sample.
Figure 9 shows the volume fraction of carbon dioxide as it displaces water within the sandstone core after 1 s, 5 s, and 20 s, from the start at an inlet pressure of 2.6 MPa. The average volume fraction of carbon dioxide within the sandstone core increases from 0.8% after 1 s to approximately 43.6% after 20 s.
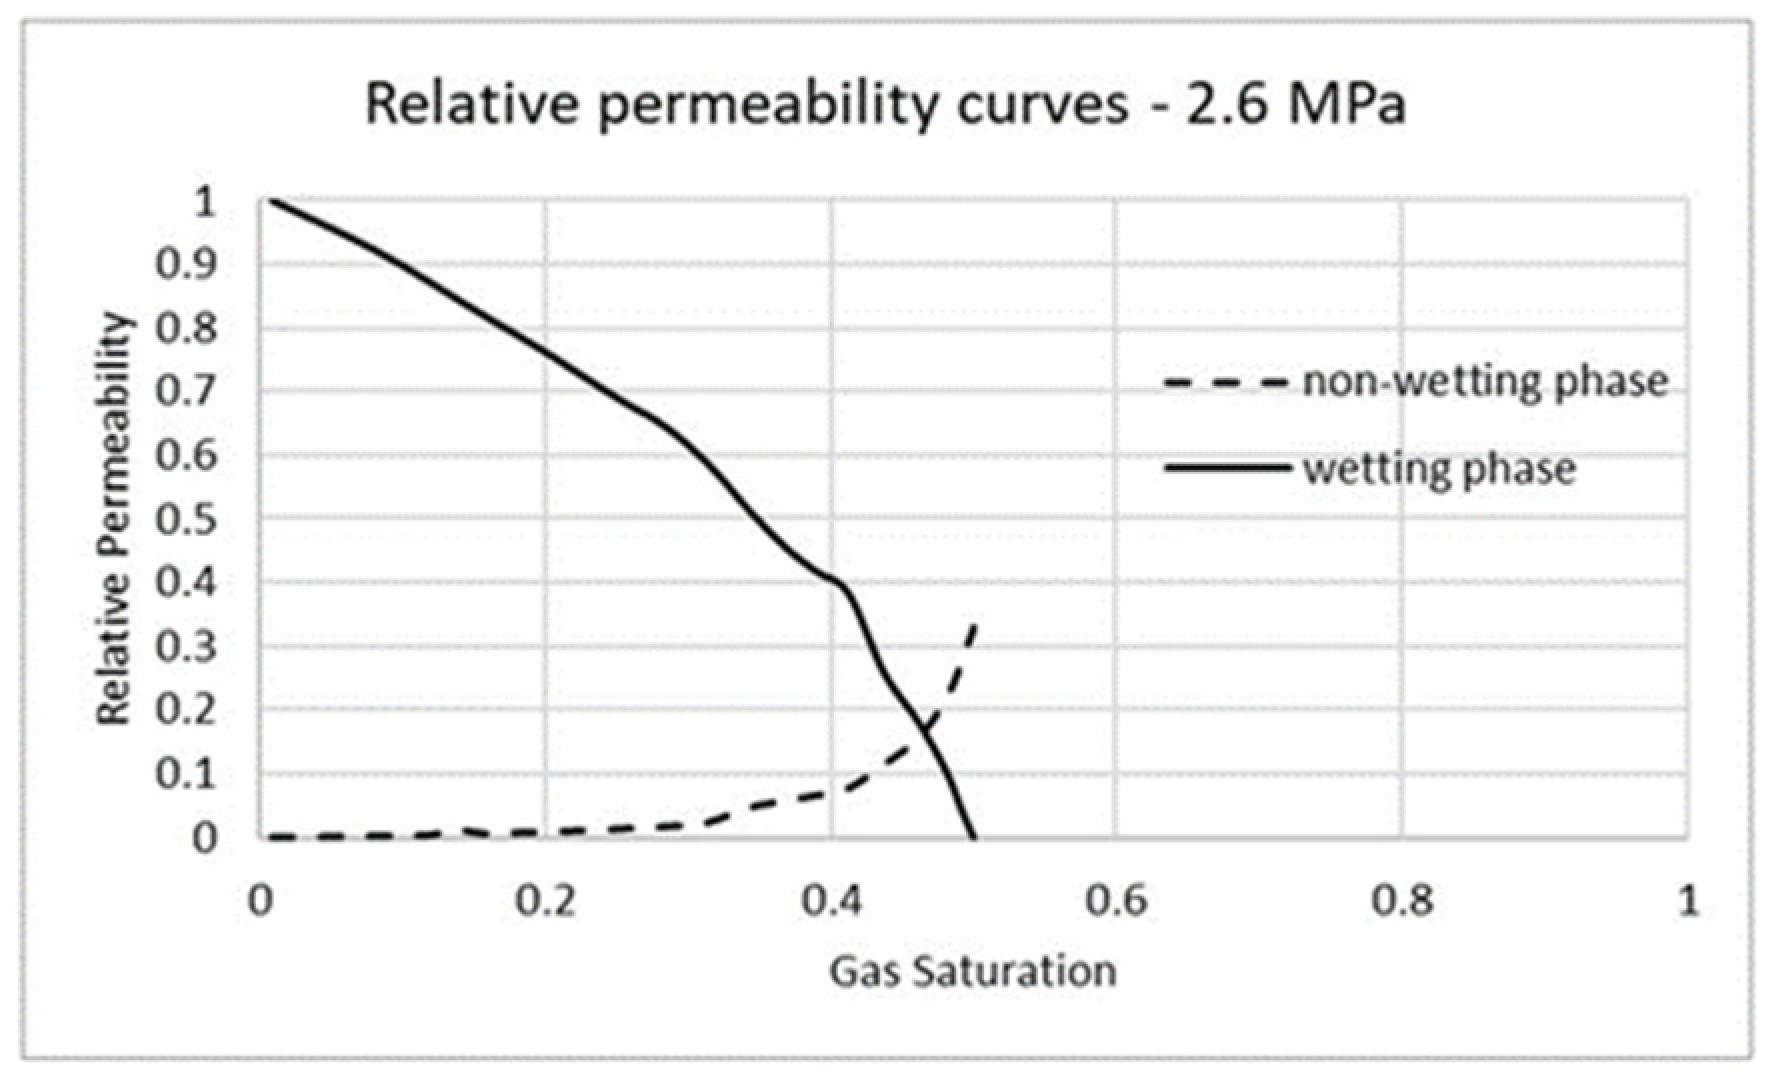
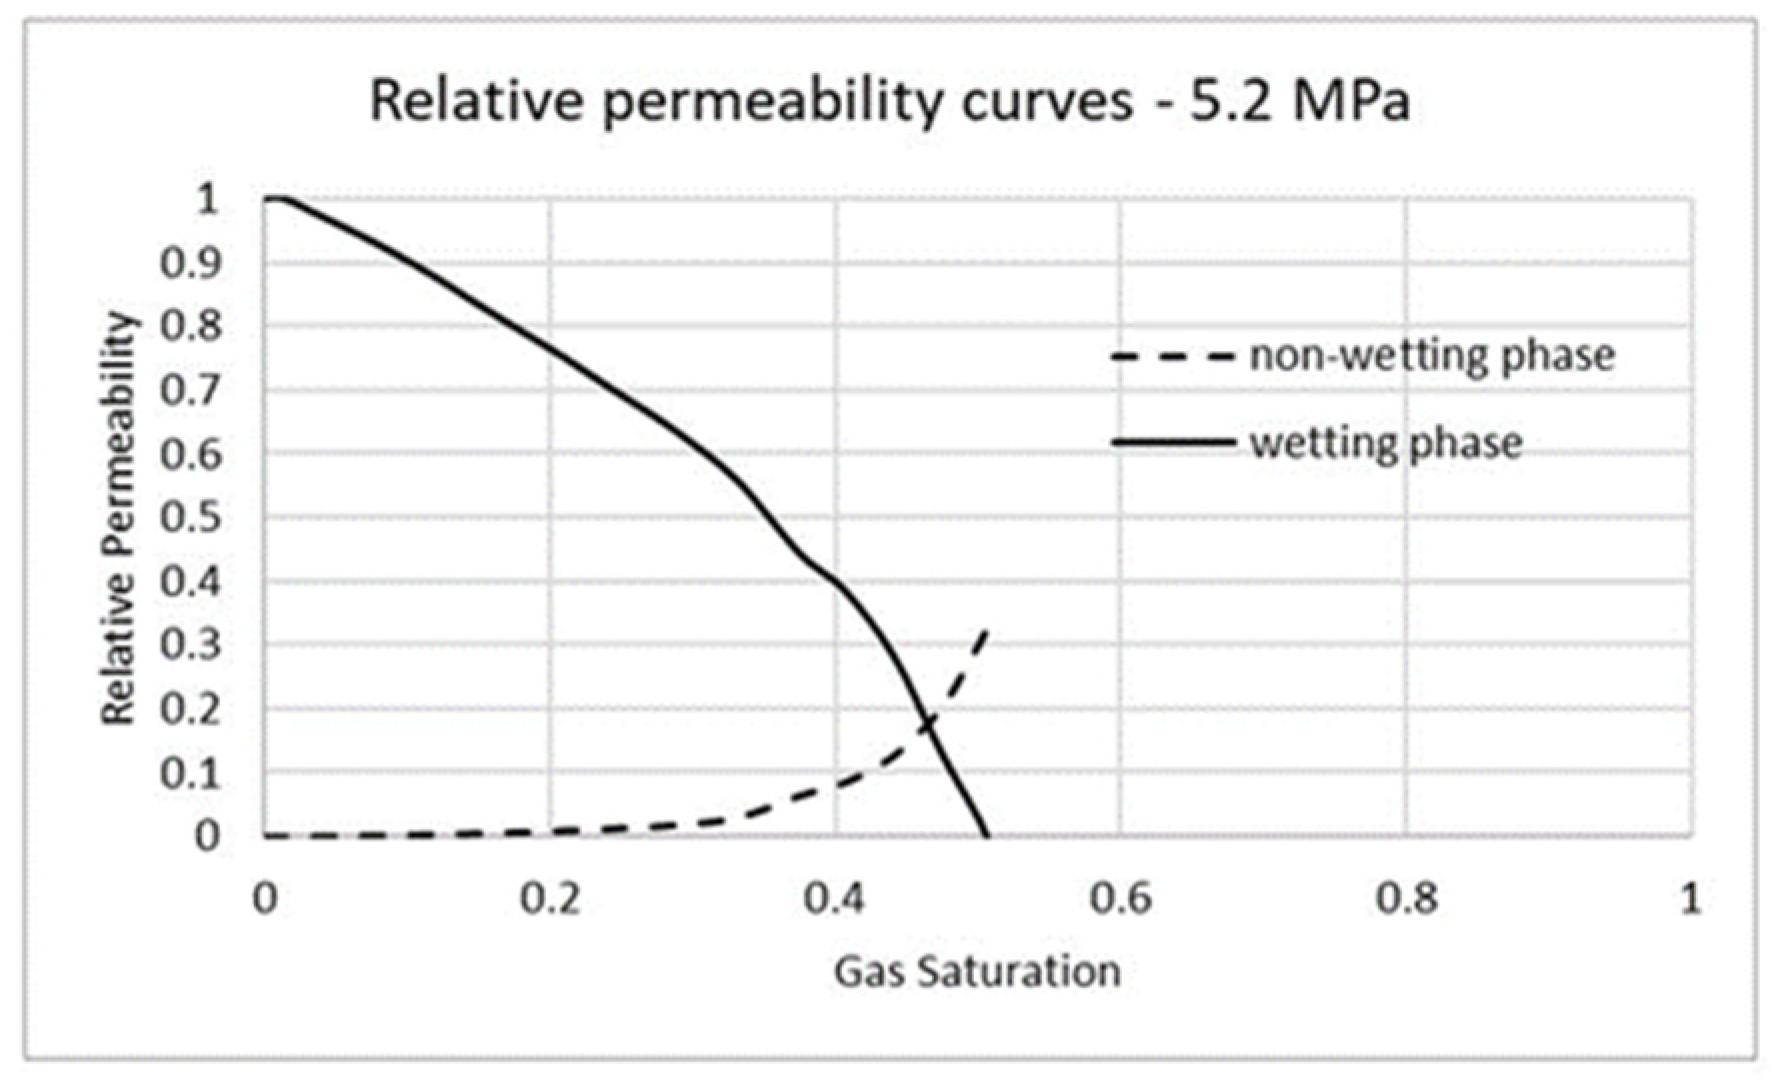
Using Equations (1) and (2), the relative permeability curves are generated for both carbon dioxide and water, which are the non-wetting phase and the wetting phase respectively. Figure 10, Figure 11 and Figure 12 show the relative permeability curves at inlet pressures of 2.6 MPa, 5.2 MPa, and 7.2 MPa, respectively. The results show very similar results at the three different inlet pressures. The results also agree with the general characteristics obtained through experiments by previous researchers where the relative permeability to the wetting phase drops from unity to zero while the relative permeability to the non-wetting phase gradually increases from zero. The authors observe that the low endpoint relative permeability to the non-wetting phase is consistent with results reported by previous researchers [13,22,32]. The next set of simulations are performed to model drainage experiments with supercritical carbon dioxide displacing water in the same sandstone core sample. Table 1 shows the material properties of supercritical carbon dioxide as well.

3.3. Carbon Dioxide in Supercritical Phase Versus Water

Additional CFD simulations are performed with supercritical carbon dioxide and water at pressures of 10.1 MPa and 20.2 MPa. The temperature is kept constant at 50 °C. The density and the dynamic viscosity of supercritical carbon dioxide are obtained from published literature [27,28]. Figure 13 shows the pressure drop across the sandstone core sample after 1 s from start with an inlet absolute pressure of 10.1 MPa. Pressure through the sandstone core drops to atmospheric pressure at the outlet.
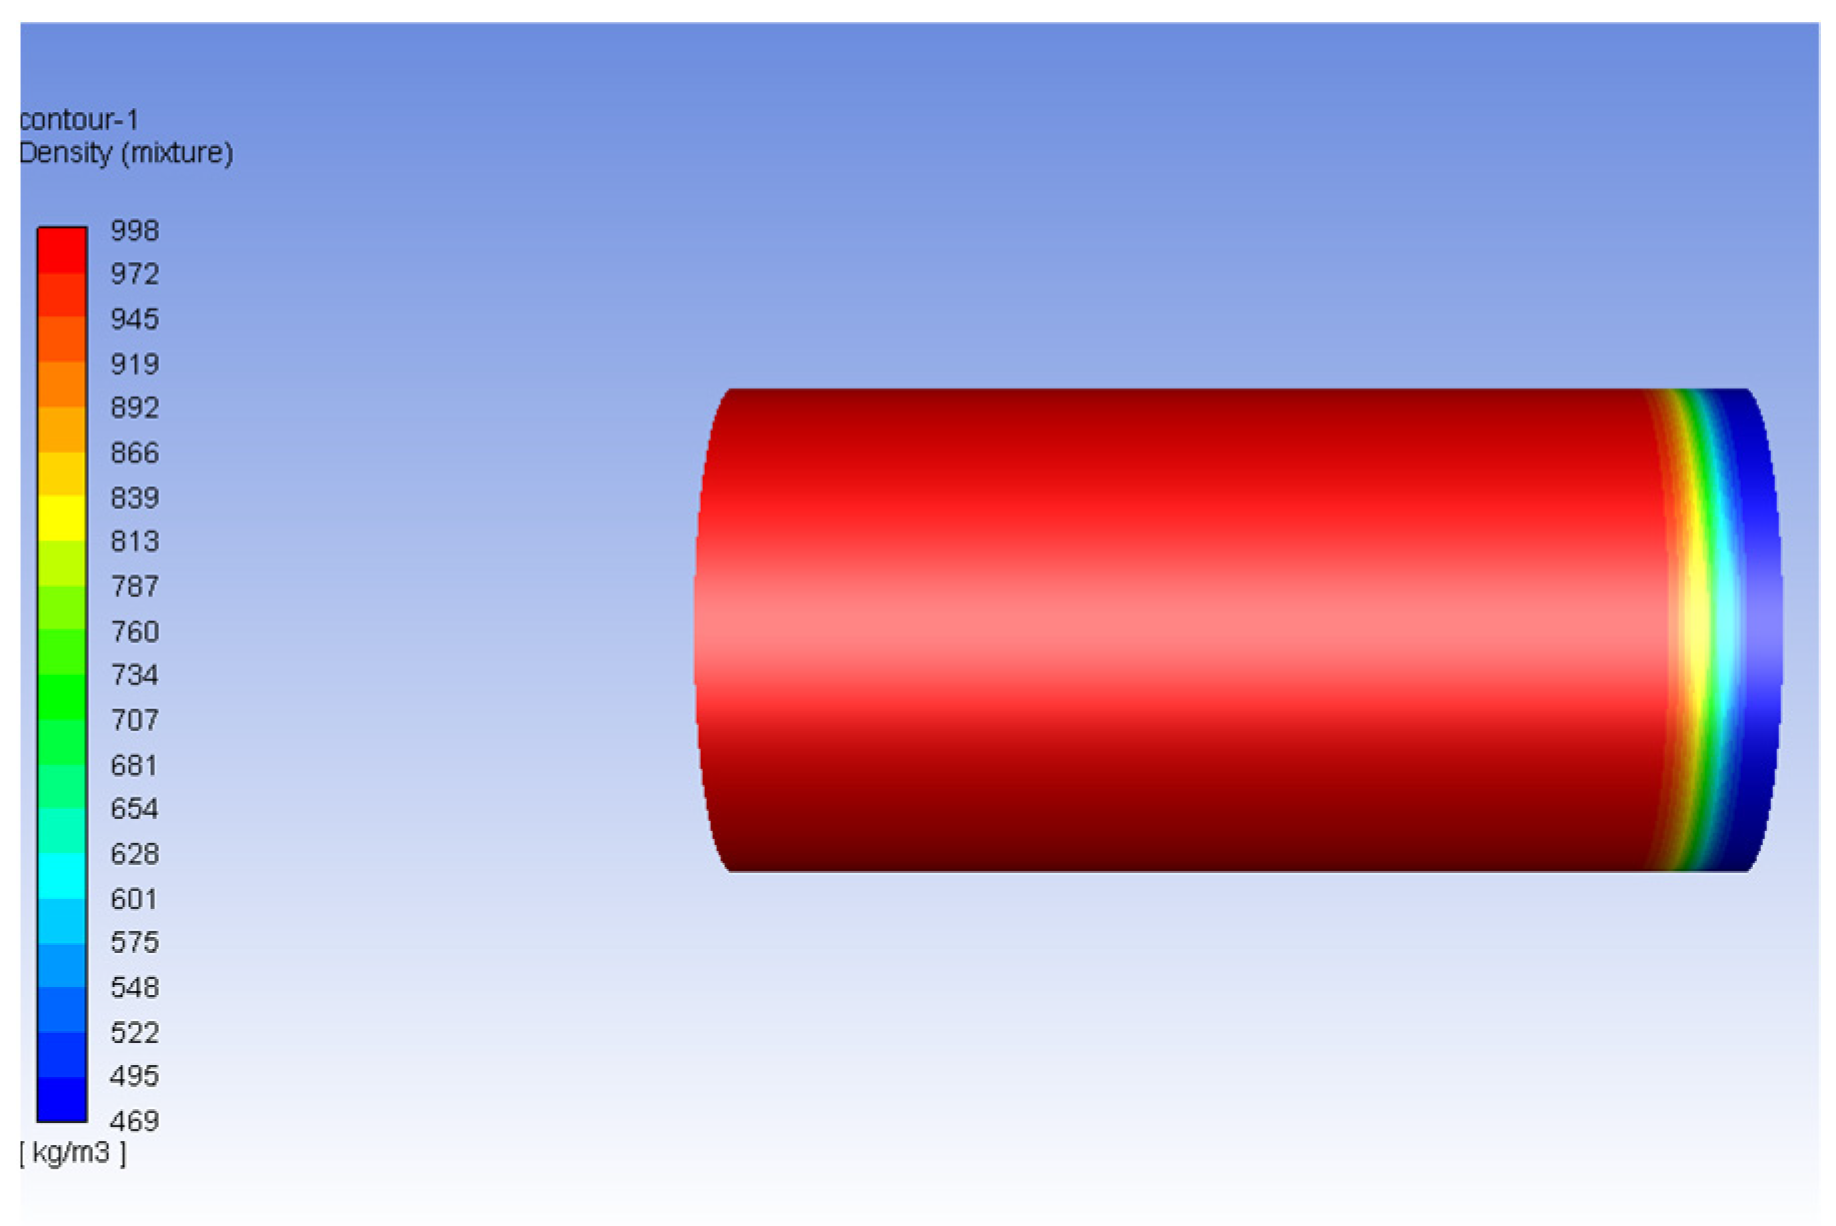
Figure 14 shows the mixture density profile with supercritical carbon dioxide displacing water through the sandstone core 1 s after injection at an inlet pressure of 10.1 MPa. Supercritical carbon dioxide displaces more water than gaseous carbon dioxide.
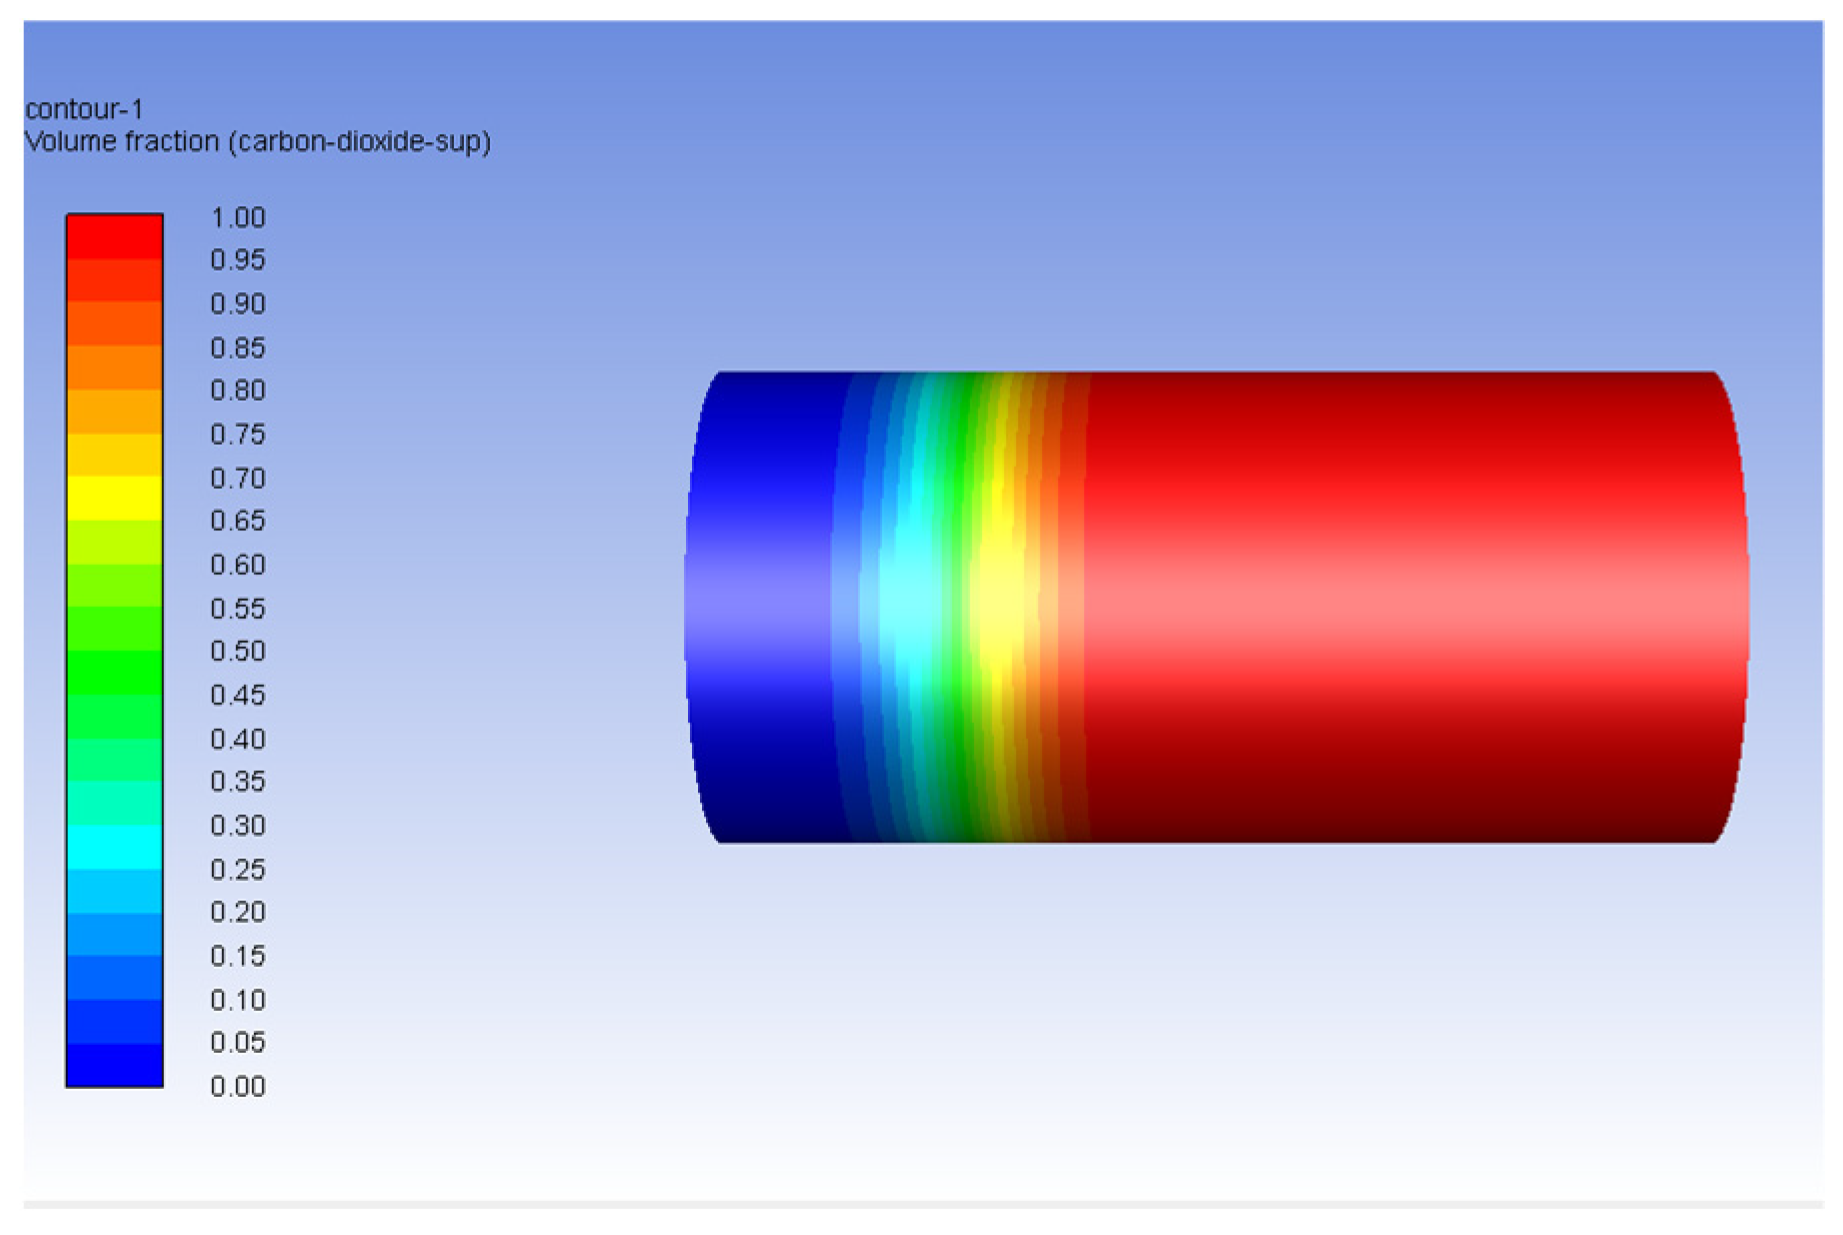
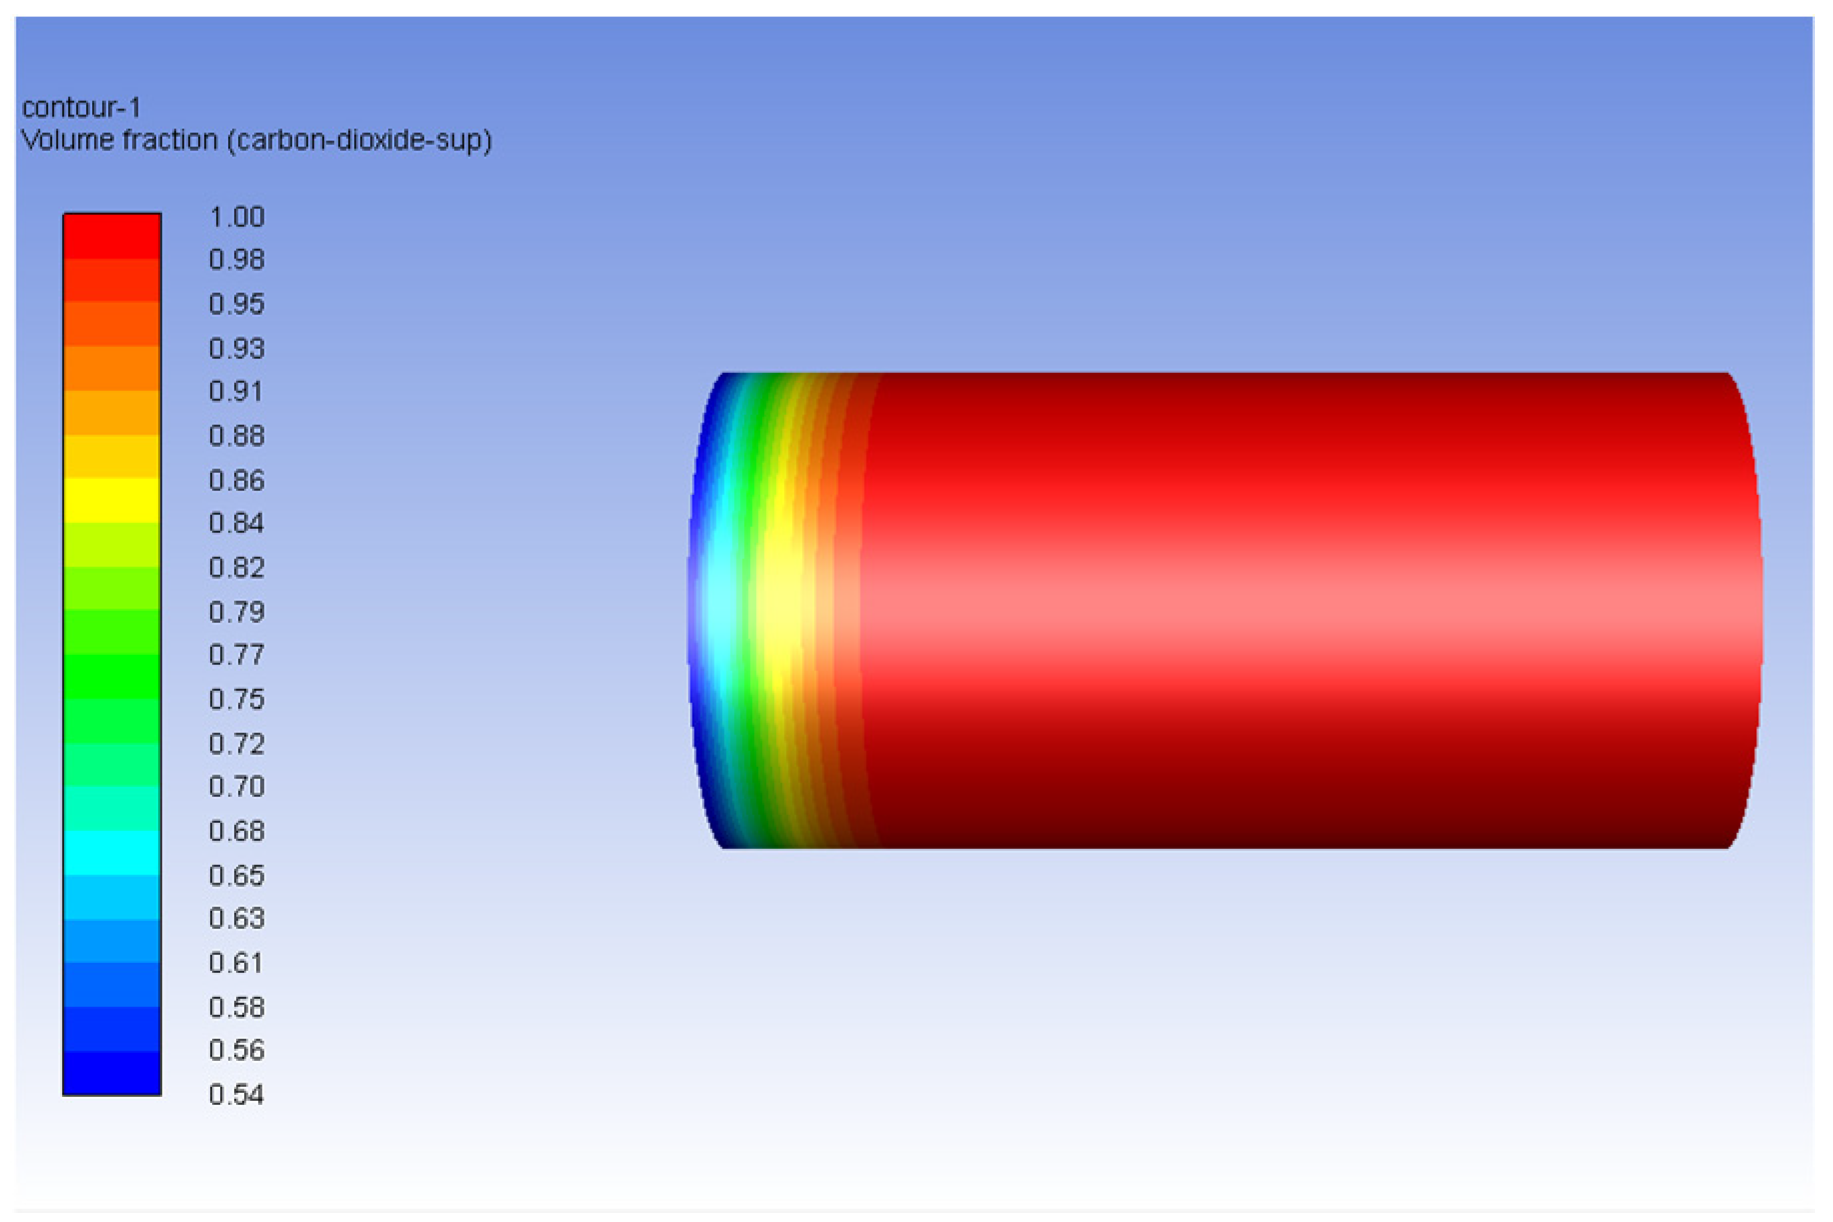
Figure 15 and Figure 16 show the flow characteristics within the sandstone core after 10 s from start at pressures of 10.1 MPa and 20.2 MPa, respectively. The density of supercritical carbon dioxide increases significantly from 10.1 MPa to 20.2 MPa and, therefore, more water is displaced by the latter after 10 s.
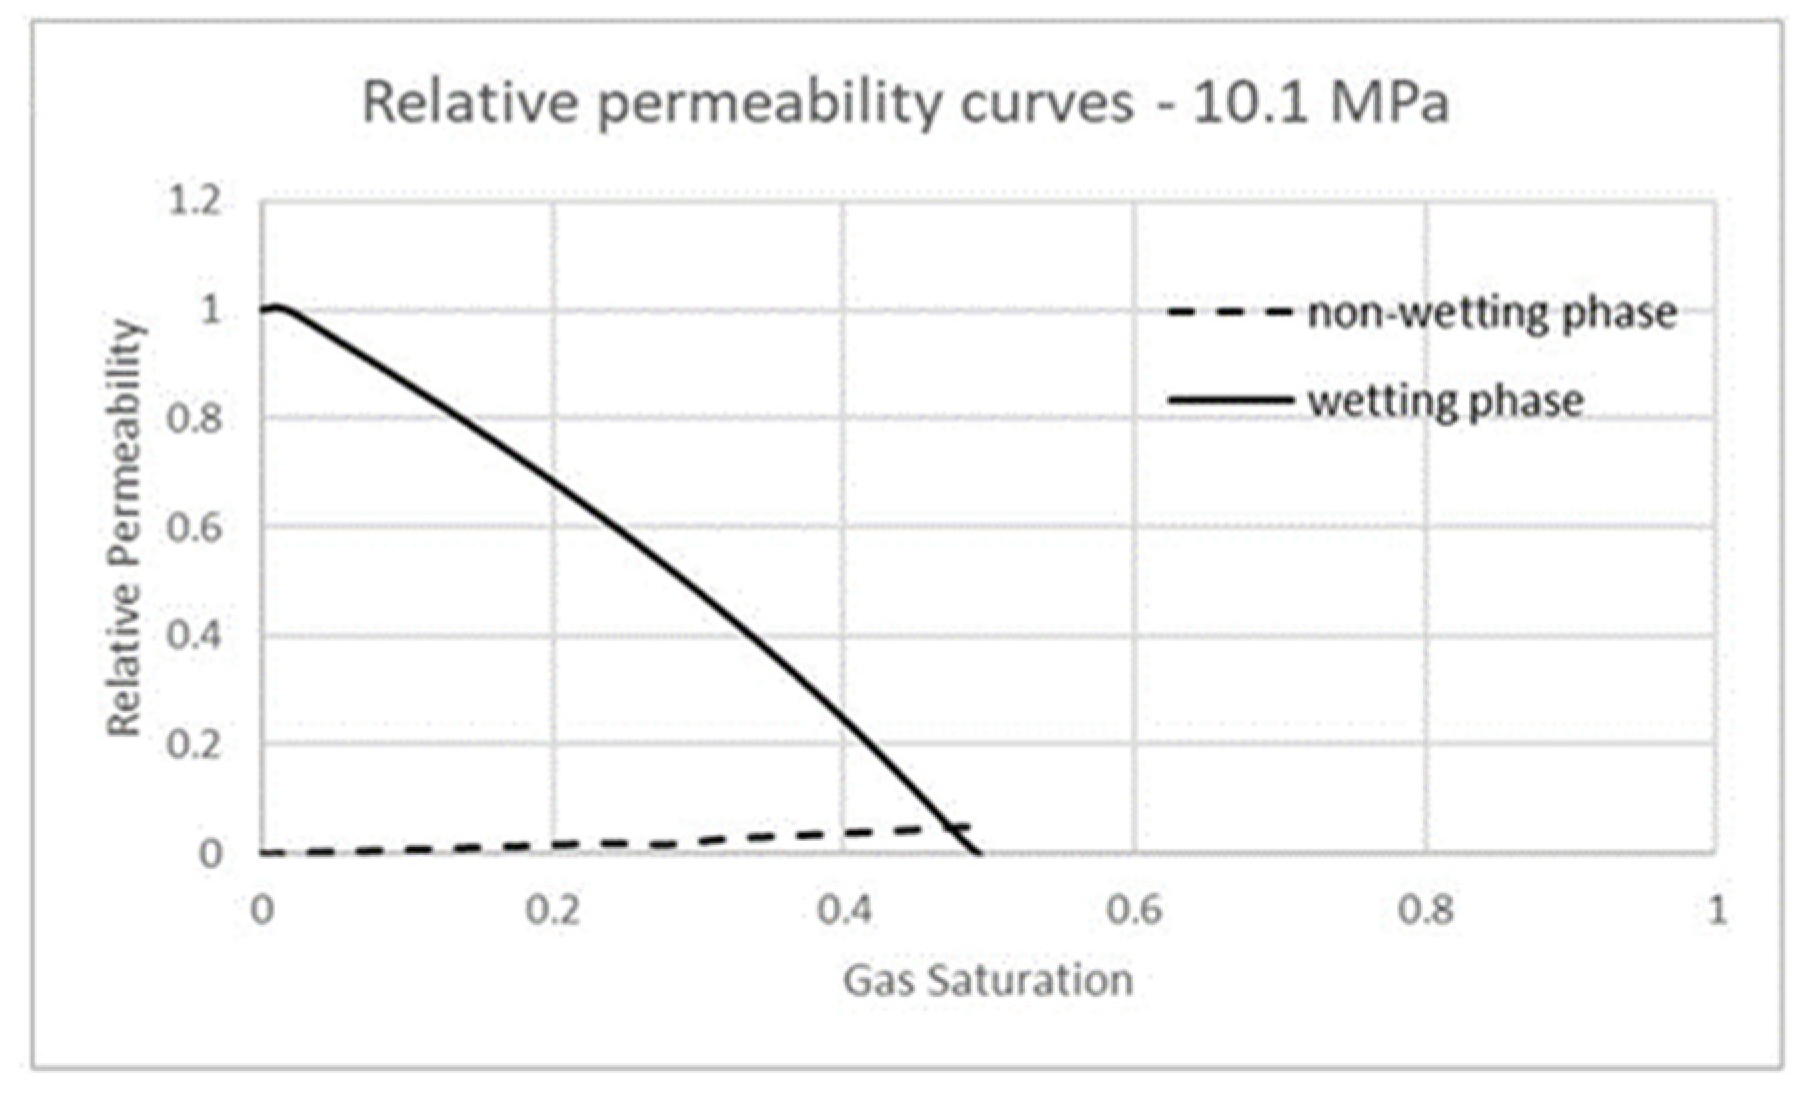
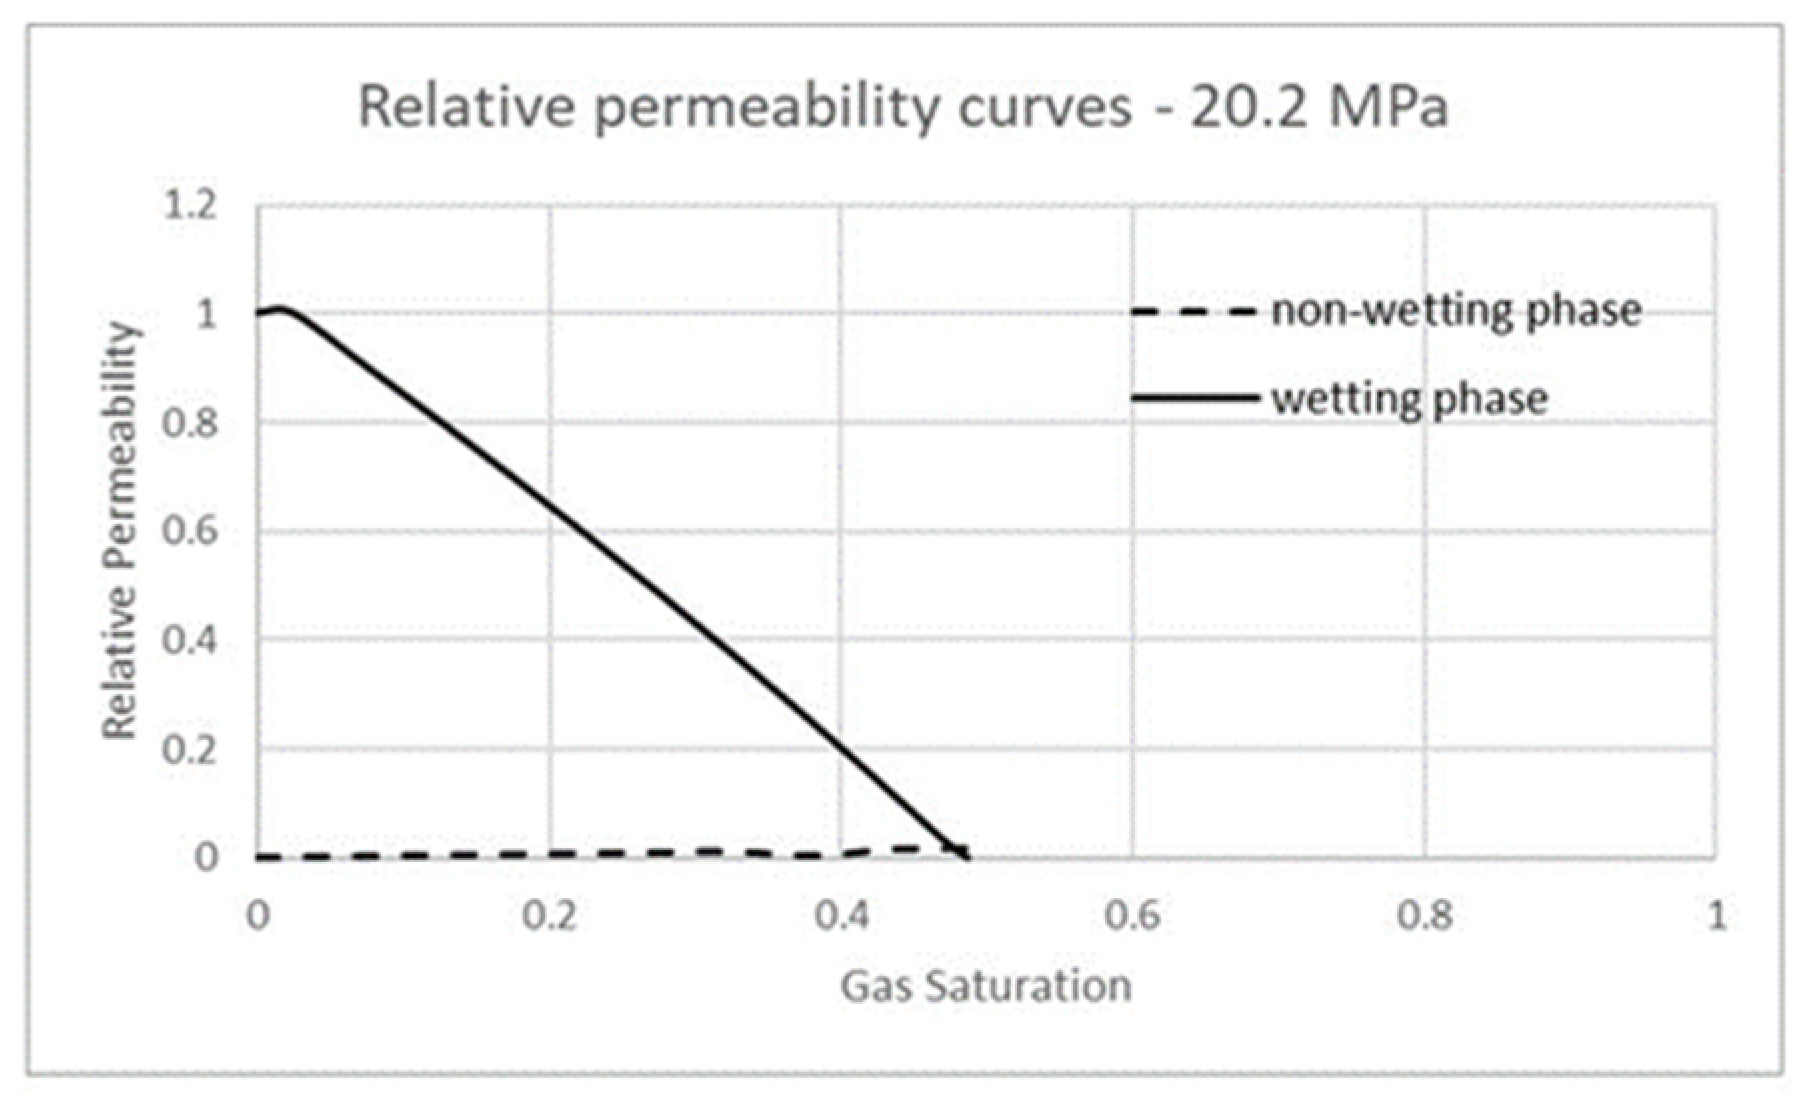
Figure 17 and Figure 18 show the relative permeability curves of supercritical carbon dioxide and water at 10.1 MPa and 20.2 MPa.
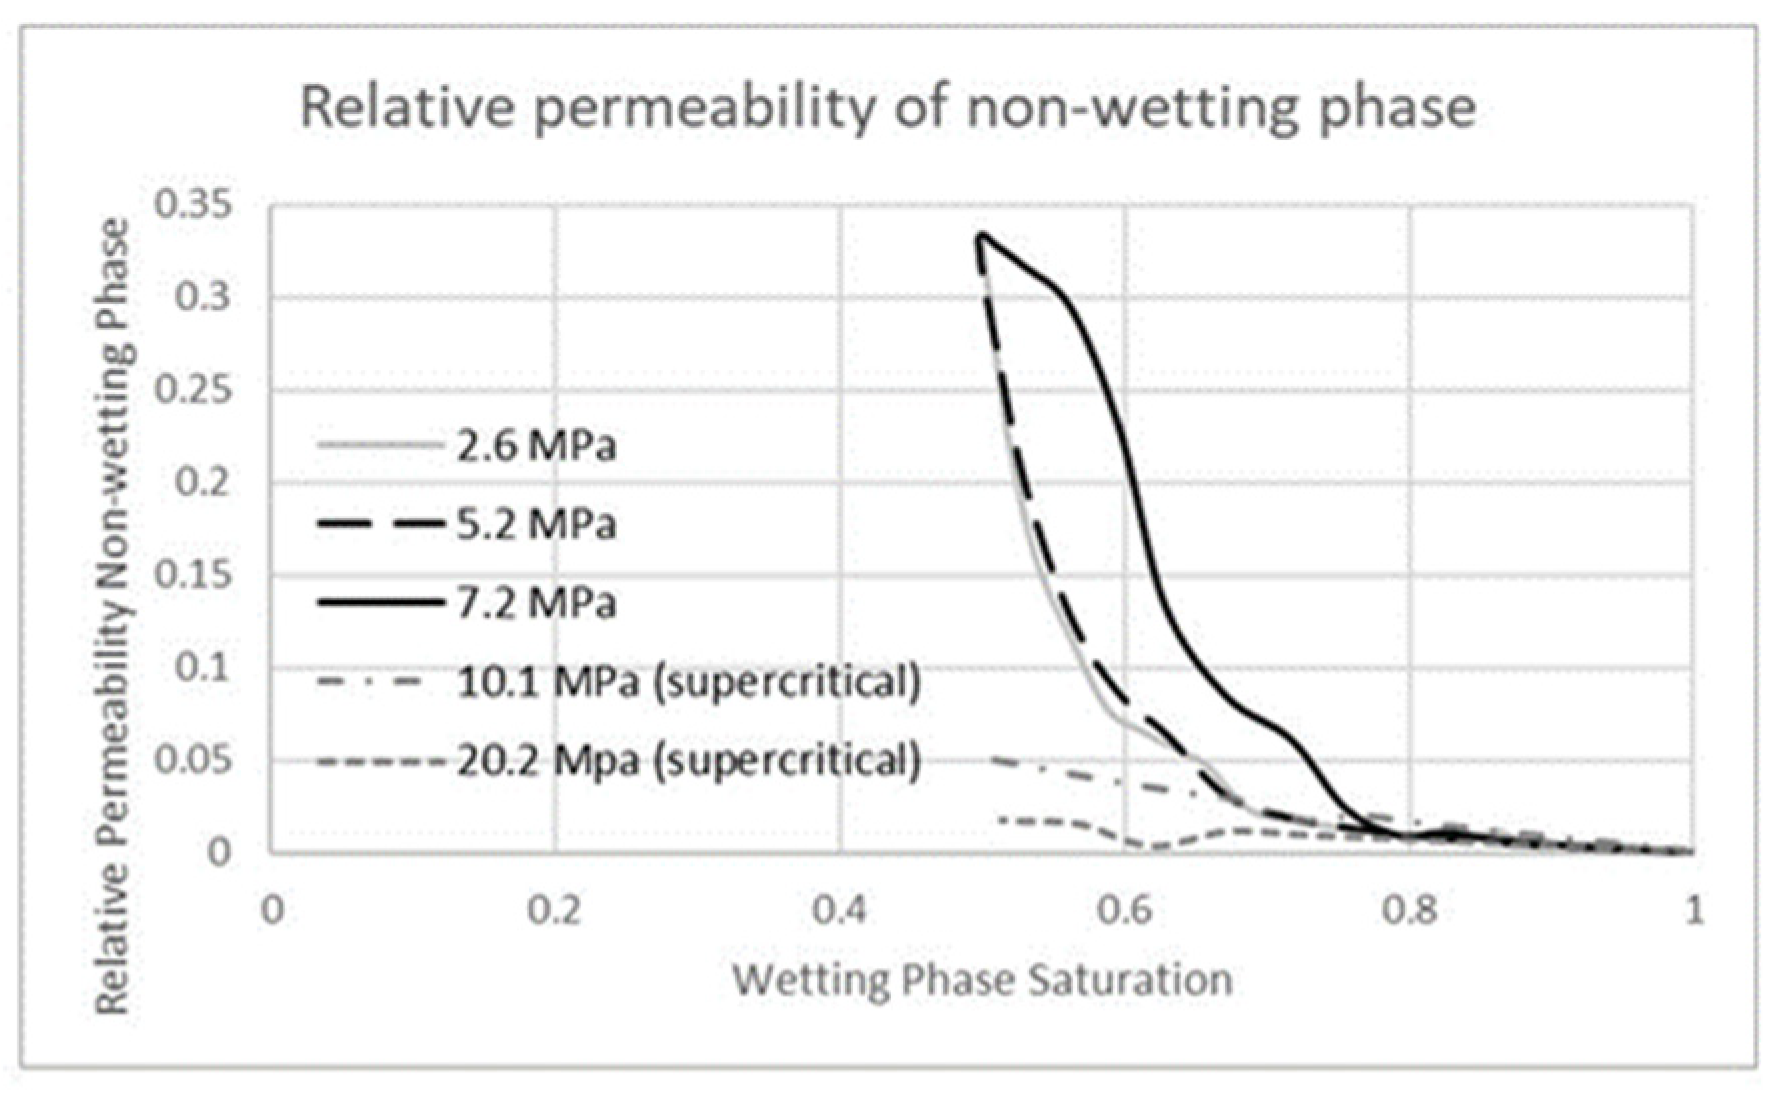
Figure 19 shows a comparison of the relative permeability to the non-wetting phase versus the wetting phase saturation at the five different inlet pressures. The result shows no significant difference between the curves at inlet pressures of 2.6 MPa and 5.2 MPa. However, at the inlet pressure of 7.2 MPa, the relative permeability curve of the non-wetting phase appears somewhat shifted from the other two curves. In addition, the endpoint relative permeability to carbon dioxide in the gas phase does not change significantly with changes in inlet pressure. However, the endpoint relative permeability to carbon dioxide in its supercritical state is approximately one order of magnitude lower under the same conditions. The relative permeability to the non-wetting phase is the lowest at an inlet pressure of 20.2 MPa.
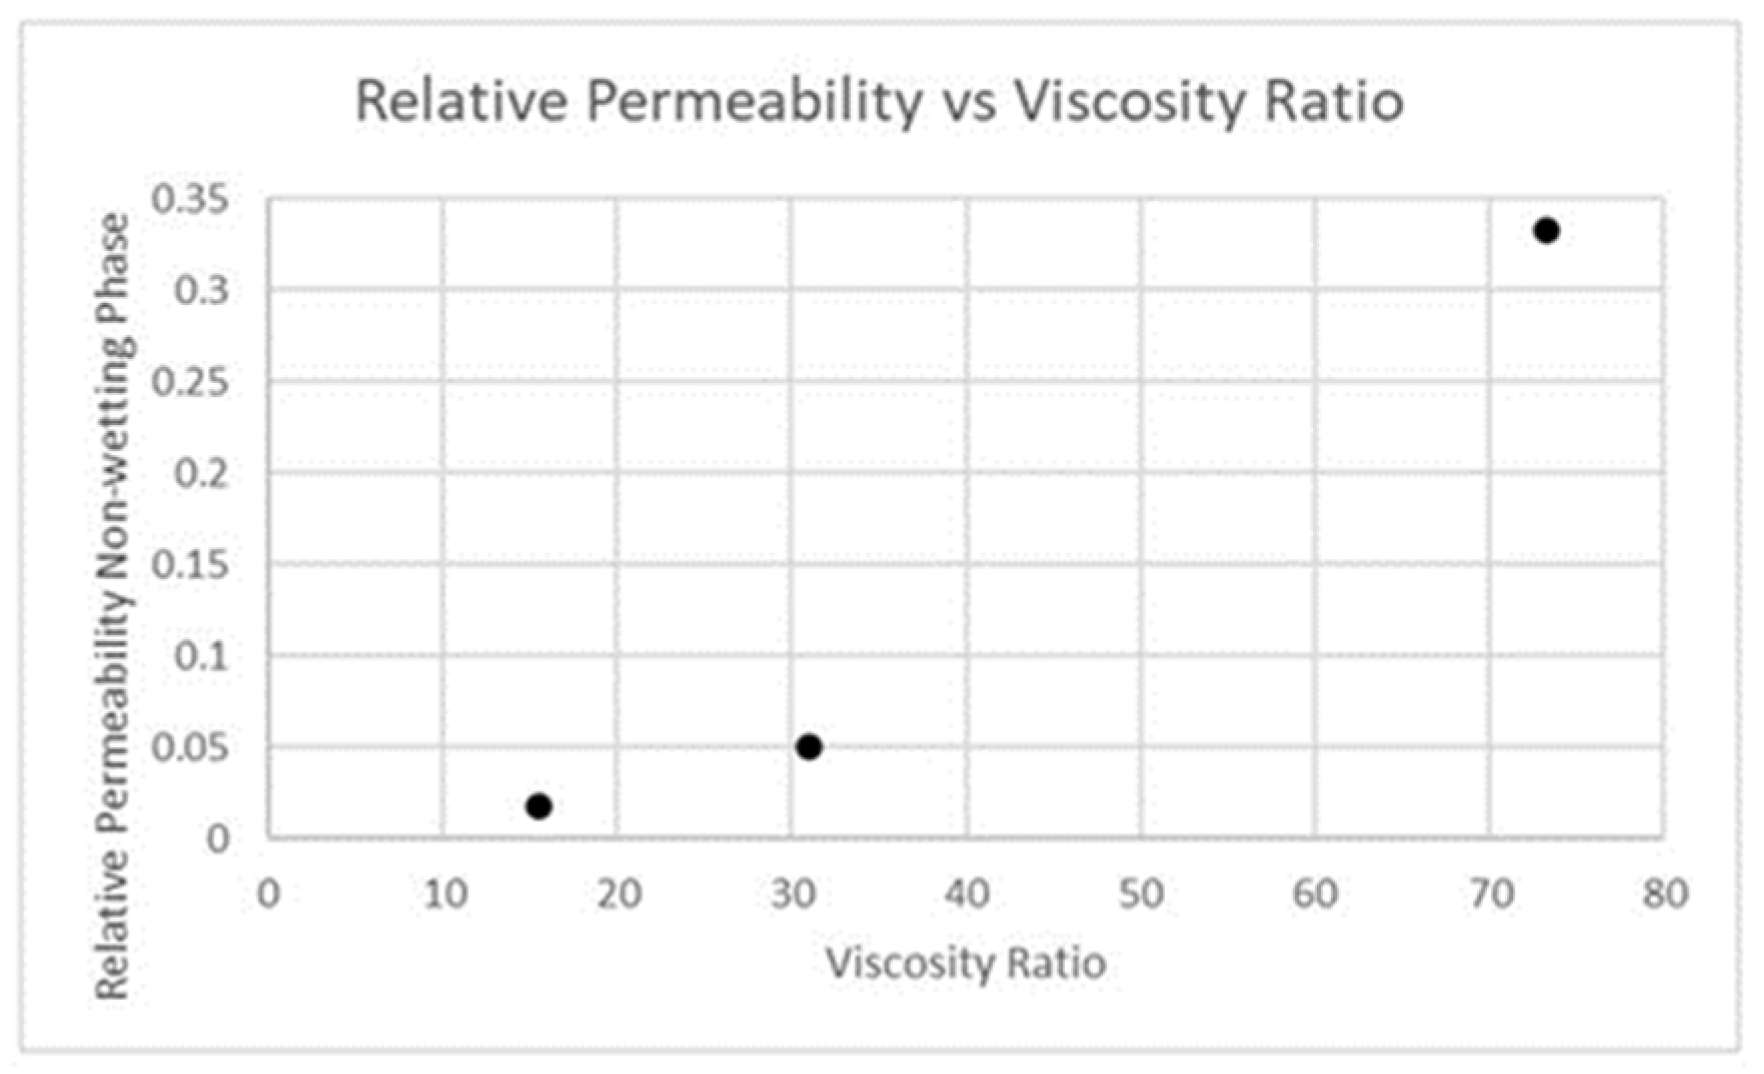
Table 1 also shows the viscosity ratio associated with carbon dioxide in both the gas phase and the supercritical state. Viscosity ratio is defined as the ratio of dynamic viscosity of the wetting phase to the dynamic viscosity of the non-wetting phase. While the dynamic viscosity of the wetting phase is the viscosity of water, the viscosity of carbon dioxide varies between its gas phase and supercritical state. In this article, viscosity ratio is the lowest for supercritical carbon dioxide at the pressure of 20.2 MPa. Figure 20 shows that the endpoint relative permeability to the wetting phase increases with an increasing viscosity ratio. The endpoint relative permeability to carbon dioxide in the gas phase does not change significantly when the inlet pressure is varied from 2.6 MPa through 7.2 MPa. However, the endpoint relative permeability to carbon dioxide in the supercritical state varies significantly from 10.1 MPa to 20.2 MPa. With no significant change in endpoint relative permeability to carbon dioxide in the gas phase at varying inlet pressures, Figure 20 shows only one data point for gaseous carbon dioxide with a viscosity ratio of 73.21. This data point is representative of the endpoint relative permeability to gaseous carbon dioxide, as the non-wetting phase, displacing water in a typical drainage experiment under the given conditions. The endpoint relative permeability to supercritical carbon dioxide increases with an increase in viscosity ratio. Additionally, the endpoint relative permeability to gaseous carbon dioxide having the highest viscosity ratio is approximately an order of magnitude larger than that of carbon dioxide in its supercritical state.
Finally, as an arkosic arenite, the Vedder sandstone represents a typical clastic reservoir rock with medium porosity and permeability. The detrital minerals of the Vedder sandstone include quartz, potassium feldspar, plagioclase, biotite, muscovite, etc. This is also typical of any common sandstone reservoir. Therefore, the results from this research are applicable to other sandstone reservoirs, with special emphasis on shallow marine or submarine fan deposits.

4. Conclusions

In this research, numerical modeling is used to study relative permeability in sandstone rocks similar to Vedder sandstone. The model may be used for clastic reservoir rocks with medium porosity. Relative permeability of fluids in multiphase flows is an important area of research, which is somewhat less explored. Additionally, there is less published literature reporting CFD data on relative permeability. In addition, most CFD articles studied supercritical carbon dioxide as the non-wetting phase. To the best of our knowledge, this is the only article that reports CFD data on relative permeability of gaseous and supercritical carbon dioxide together as a function of the wetting phase saturation. Contrary to some earlier published research, the results show that the endpoint relative permeability to gaseous carbon dioxide is consistently much lower than unity. In addition, the endpoint relative permeability to supercritical carbon dioxide is approximately an order of magnitude lower than carbon dioxide in the gas phase. The endpoint relative permeability does not change significantly as a function of inlet pressure for carbon dioxide in the gas phase. Finally, the results show the influence of the viscosity ratio on the endpoint relative permeability to the non-wetting phase. The endpoint relative permeability to the non-wetting phase increases with an increase in the viscosity ratio. The results show that the CFD model can be used to predict relative permeability to fluids, which is essential towards understanding the multiphase flow characteristics during carbon capture and sequestration.

Author Contributions

The authors of this article are T.A., L.S., E.D. and A.G. The following paragraph details the authors’ contributions. Conceptualization, T.A. and L.S.; methodology, T.A. and L.S.; software, T.A. and A.G.; validation, T.A.; formal analysis, T.A.; investigation, T.A., L.S., A.G., and E.D.; resources, T.A. and L.S.; data curation, T.A., L.S., E.D., and A.G.; writing—original draft preparation, T.A.; writing—review and editing, T.A. and L.S.; visualization, L.S. and E.D.; supervision, T.A.; project administration, T.A.; funding acquisition, T.A. and L.S. All authors have read and agreed to the published version of the manuscript.

Funding

This research was funded through the grant, Chevron: CERC-IERP2021.

Institutional Review Board Statement

Not Applicable.

Informed Consent Statement

Not Applicable.

Data Availability Statement

Raw data were generated at California State University, Bakersfield. Derived data supporting the findings of this study are available from the corresponding author (T.A.) on request.

Acknowledgments

The authors acknowledge Luis Cabrales and Anthony Rathburn for their support to conduct this research.

Conflicts of Interest

The authors declare no conflict of interest.

References

  1. CO2 and Greenhouse Gas Emissions. Available online: https://ourworldindata.org/co2-and-other-greenhouse-gas-emissions (accessed on 7 January 2023).
  2. Global Greenhouse Gas Emissions Data. Available online: https://www.epa.gov/ghgemissions/global-greenhouse-gas-emissions-data (accessed on 7 January 2023).
  3. Zhang, D.; Song, J. Mechanisms for geological carbon sequestration. Procedia IUTAm. 2014, 10, 319–327. [Google Scholar] [CrossRef] [Green Version]
  4. Friedmann, S.J. Geological carbon dioxide sequestration. Elements 2007, 3, 179–184. [Google Scholar] [CrossRef]
  5. Lal, R. Carbon sequestration. Philos. Trans. R. Soc. B Biol. Sci. 2008, 363, 815–830. [Google Scholar] [CrossRef] [PubMed]
  6. Blomberg, A.E.; Waarum, I.K.; Totland, C.; Eek, E. Marine Monitoring for Offshore Geological Carbon Storage—A Review of Strategies, Technologies and Trends. Geosciences 2021, 11, 383. [Google Scholar] [CrossRef]
  7. DePaolo, D.J.; Cole, D.R. Geochemistry of geologic carbon sequestration: An overview. Rev. Mineral. Geochem. 2013, 77, 1–14. [Google Scholar] [CrossRef]
  8. Abidoye, L.K.; Khudaida, K.J.; Das, D.B. Geological carbon sequestration in the context of two-phase flow in porous media: A review. Crit. Rev. Environ. Sci. Technol. 2015, 45, 1105–1147. [Google Scholar] [CrossRef] [Green Version]
  9. Wang, S.; Edwards, I.M.; Clarens, A.F. Wettability phenomena at the CO2–brine–mineral interface: Implications for geologic carbon sequestration. Environ. Sci. Technol. 2013, 47, 234–241. [Google Scholar] [CrossRef]
  10. Cao, S.C.; Dai, S.; Jung, J. Supercritical CO2 and brine displacement in geological carbon sequestration: Micromodel and pore network simulation studies. Int. J. Greenh. Gas Control. 2016, 44, 104–114. [Google Scholar] [CrossRef]
  11. Cannone, S.F.; Lanzini, A.; Santarelli, M. A review on CO2 capture technologies with focus on CO2-enhanced methane recovery from hydrates. Energies 2021, 14, 387. [Google Scholar] [CrossRef]
  12. Christopoulou, M.A.; Koutsovitis, P.; Kostoglou, N.; Paraskevopoulou, C.; Sideridis, A.; Petrounias, P.; Rogkala, A.; Stock, S.; Koukouzas, N. Evaluation of the CO2 Storage Capacity in Sandstone Formations from the Southeast Mesohellenic trough (Greece). Energies 2022, 15, 3491. [Google Scholar] [CrossRef]
  13. Pini, R.; Benson, S.M. Simultaneous determination of capillary pressure and relative permeability curves from core-flooding experiments with various fluid pairs. Water Resour. Res. 2013, 49, 3516–3530. [Google Scholar] [CrossRef]
  14. Medici, G.; West, L.J. Review of groundwater flow and contaminant transport modelling approaches for the Sherwood Sandstone aquifer, UK; insights from analogous successions worldwide. Q. J. Eng. Geol. Hydrogeol. 2022, 55, 2021–2176. [Google Scholar] [CrossRef]
  15. Tellam, J.H.; Barker, R.D. Towards prediction of saturated-zone pollutant movement in groundwaters in fractured permeable-matrix aquifers: The case of the UK Permo-Triassic sandstones. Geol. Soc. Spec. Publ. 2006, 263, 1–48. [Google Scholar] [CrossRef]
  16. Botset, H.G. Flow of gas-liquid mixtures through consolidated sand. Trans. Am. Inst. 1940, 136, 91–105. [Google Scholar] [CrossRef]
  17. Bachu, S.; Bennion, B. Effects of in-situ conditions on relative permeability characteristics of CO2-brine systems. Environ. Geol. 2008, 54, 1707–1722. [Google Scholar] [CrossRef]
  18. Benion, B.; Stefan, B. Relative Permeability Characteristics for Supercritical CO2 Displacing Water in a Variety of Potential Sequestration Zones in the West Canada Sedimentary Basin; SPE Annual Technical Conference and Exhibition: Dallas, TX, USA, 2005. [Google Scholar]
  19. Müller, N. Supercritical CO2-brine relative permeability experiments in reservoir rocks—Literature review and recommendations. Transport. Porous Med. 2011, 87, 367–383. [Google Scholar] [CrossRef]
  20. Reynolds, C.A.; Krevor, S. Characterizing flow behavior for gas injection: Relative permeability of CO2-brine and N2-water in heterogeneous rocks. Water Resour. Res. 2015, 51, 9464–9489. [Google Scholar] [CrossRef] [Green Version]
  21. Brooks, R.H.; Corey, A.T. Hydraulic Properties of Porous Media; Hydrology Paper No. 3; Civil Engineering Department, Colorado State University: Fort Collins, CO, USA, 1964. [Google Scholar]
  22. Richardson, J.G.; Kerver, J.K.; Hafford, J.A.; Osoba, J.S. Laboratory determination of relative permeability. J. Pet. Technol. 1952, 4, 187–196. [Google Scholar] [CrossRef]
  23. Oak, M.J.; Baker, L.E.; Thomas, D.C. Three-phase relative permeability of Berea sandstone. J. Pet. Technol. 1990, 42, 1054–1061. [Google Scholar] [CrossRef]
  24. He, D.; Jiang, P.; Lun, Z.; Liu, X.; Xu, R. Pore scale CFD simulation of supercritical carbon dioxide drainage process in porous media saturated with water. Energ. Source. Part A 2019, 41, 1791–1799. [Google Scholar] [CrossRef]
  25. Garimella, S.S.; Ahmed, S.; Hossain, M. Comparison of different models for predicting drainage relative permeability using pore scale numerical simulation of supercritical carbon dioxide and brine flow. IOP Conf. Ser. Mater. Sci. Eng. 2019, 495, 012111. [Google Scholar] [CrossRef]
  26. Jahan, F. Pore-Scale, Computational Fluid Dynamics-Based Simulation of Supercritical CO2-Brine Flow through Porous Media; Curtin University: Perth, Australia, 2018. [Google Scholar]
  27. Jahan, F.; Ahmed, S.; Hossain, M. Investigating the Influence of Wettability and Direction on Supercritical CO2 Trapping for Supercritical CO2-Brine Imbibition Process at Pore Scale for Bentheimer Sandstone. In Proceedings of the SPE Asia Pacific Oil and Gas Conference and Exhibition, Brisbane, Australia, 23 October 2018. [Google Scholar]
  28. Xu, R.; Luo, S.; Jiang, P. Pore scale numerical simulation of supercritical CO2 injecting into porous media containing water. Energy Procedia 2011, 4, 4418–4424. [Google Scholar] [CrossRef] [Green Version]
  29. Dullien, F.A.L. Porous Media Fluid Transport and Pore Structure; Academic: San Diego, CA, USA, 1992. [Google Scholar]
  30. Lake, L.W. Enhanced Oil Recovery; Prentice Hall: Englewood Cliffs, NJ, USA, 1989. [Google Scholar]
  31. Craig, F.F. The reservoir engineering aspects of waterflooding. In SPE Monograph Series 3; Society of Petroleum Engineers: New York, NY, USA, 1971. [Google Scholar]
  32. Krevor, S.; Pini, R.; Zuo, L.; Benson, S. Relative permeability and trapping of CO2 and water in sandstone rocks at reservoir conditions. Water Resour. Res. 2012, 48, 1–16. [Google Scholar] [CrossRef]
  33. Perrin, J.C.; Benson, S. An experimental study on the influence of sub-core scale heterogeneities on CO2 distribution in reservoir rocks. Transport Porous Med. 2010, 82, 93–109. [Google Scholar] [CrossRef]
  34. Morteza, A.; Piri, M. Relative permeability hysteresis and capillary trapping characteristics of supercritical CO2/brine systems: An experimental study at reservoir conditions. Adv. Water Resour. 2013, 52, 190–206. [Google Scholar]
  35. Chenot, P.E.; David, W. Round Mountain Field, Short Radius Lateral Drilling in the Vedder Sand Round Mountain Field, California (No. DOE/BC/15258-1); National Energy Technology Lab. (NETL): Tulsa, OK, USA; National Petroleum Technology Office (NPTO): Tulsa, OK, USA, 2002. [Google Scholar]
  36. Buades, A.; Coll, B.; Morel, J.M. A non-local algorithm for image denoising. In Proceedings of the 2005 IEEE Computer Society Conference on Computer Vision and Pattern Recognition (CVPR’05), San Diego, CA, USA, 20 June 2005. [Google Scholar]
  37. Bakke, S.; Øren, P.E. 3-D pore-scale modelling of sandstones and flow simulations in the pore networks. SPE J. 1997, 2, 136–149. [Google Scholar] [CrossRef] [Green Version]
  38. Fluent 14.5 User Guide; Fluent Inc.: New York, NY, USA, 2002.
  39. Cole, J.; Rasouli, V. Numerical simulations of CO2 injection into a porous sandstone formation. WIT Trans. Eng. Sci. 2012, 81, 59–69. [Google Scholar]
  40. Baozhi, P.; Lei, J.; Zhang, L.; Guo, Y. Research on the physical properties of supercritical CO2 and the log evaluation of CO2-bearing volcanic reservoirs. J. Geophys. Eng. 2017, 14, 1052–1060. [Google Scholar]
  41. Deng, J.; Zhao, G.; Zhang, L.; Ma, H.; Song, F.; Cao, Q.; Zhang, X. Simple and accurate calculation model of viscosity for supercritical CO2. J. Phys. Conf. Ser. 2021, 2076, 012030. [Google Scholar] [CrossRef]
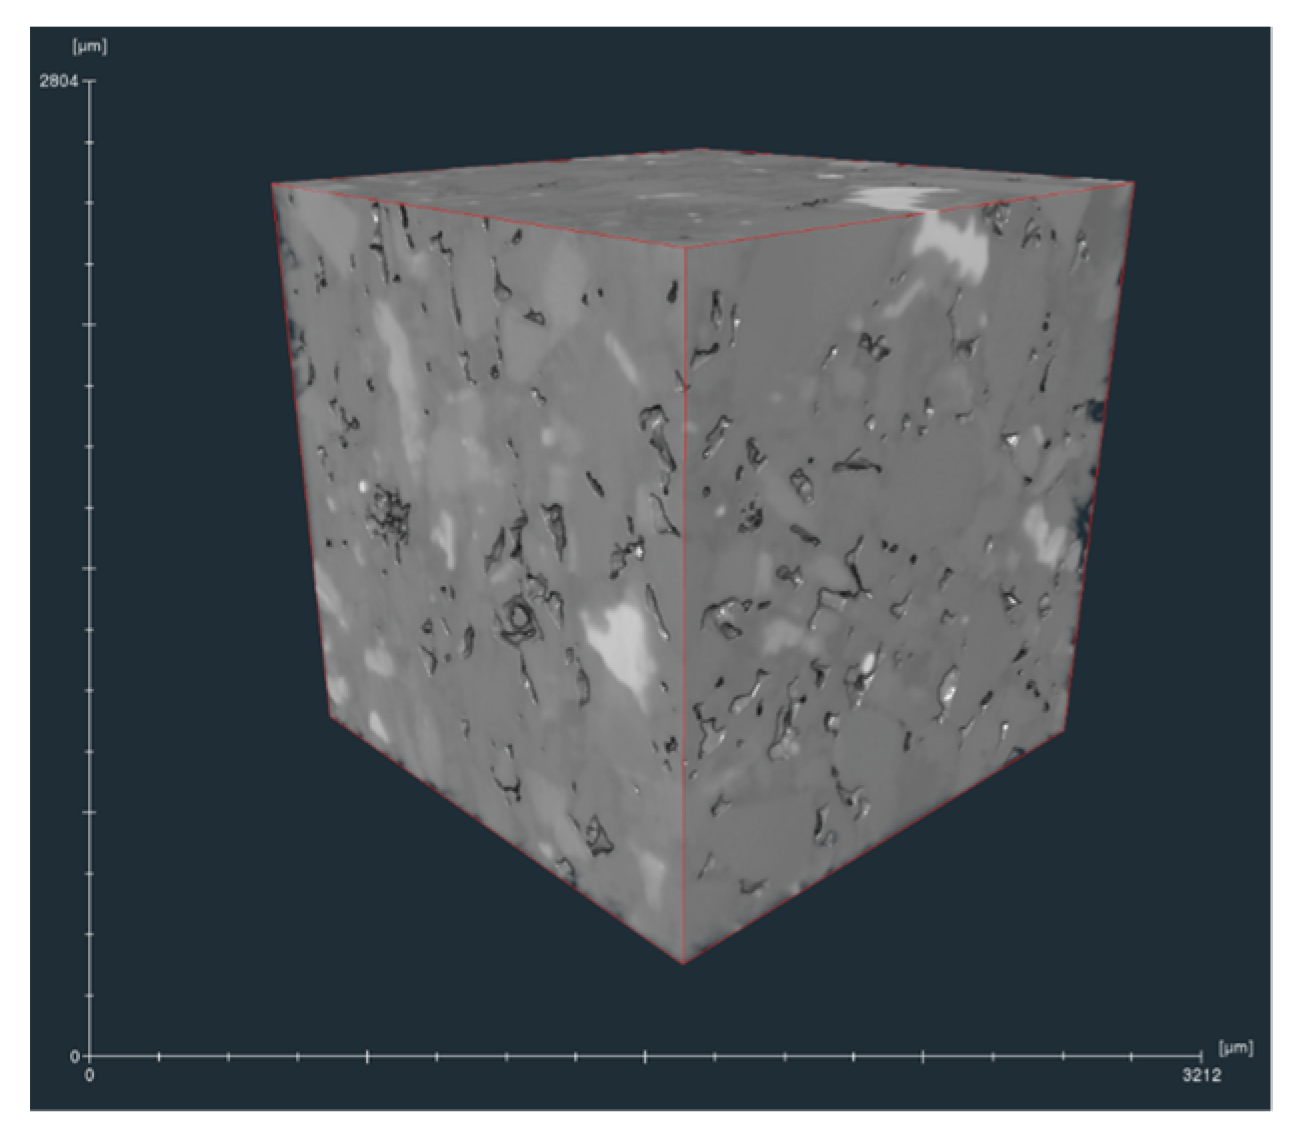
Figure 1. Micro-CT scan of Vedder sandstone sample.
Processes 11 00780 g001
Figure 2. Idealized pore network model extracted from the micro-CT scan.
Processes 11 00780 g002
Figure 3. Mesh geometry.
Processes 11 00780 g003
Figure 4. Mesh independence test results.
Processes 11 00780 g004
Figure 5. Pressure profile across the core after 1 s—validation simulation.
Processes 11 00780 g005
Figure 6. CFD versus experimental results—validation simulation.
Processes 11 00780 g006
Figure 7. Pressure profile across the core—gaseous carbon dioxide inlet pressure 2.6 MPa.
Processes 11 00780 g007
Figure 8. Density profile across the core—gaseous carbon dioxide inlet pressure 2.6 MPa.
Processes 11 00780 g008
Figure 9. CO2 volume fraction after 1 s, 5 s, and 20 s at inlet pressure of 2.6 MPa.
Processes 11 00780 g009
Figure 10. Relative permeability curves at inlet pressure of 2.6 MPa.
Processes 11 00780 g010
Figure 11. Relative permeability curves at inlet pressure of 5.2 MPa.
Processes 11 00780 g011
Figure 12. Relative permeability curves at inlet pressure of 7.2 MPa.
Processes 11 00780 g012
Figure 13. Pressure profile across the core—supercritical carbon dioxide inlet pressure 10.1 MPa.
Processes 11 00780 g013
Figure 14. Density profile across the core—supercritical carbon dioxide inlet pressure 10.1 MPa.
Processes 11 00780 g014
Figure 15. Carbon dioxide volume fraction after 10 s at inlet pressure of 10.1 MPa.
Processes 11 00780 g015
Figure 16. Carbon dioxide volume fraction after 10 s at inlet pressure of 20.2 MPa.
Processes 11 00780 g016
Figure 17. Relative permeability curves at inlet pressure of 10.1 MPa.
Processes 11 00780 g017
Figure 18. Relative permeability curves at inlet pressure of 20.2 MPa.
Processes 11 00780 g018
Figure 19. Relative permeability of non-wetting phase versus wetting phase saturation.
Processes 11 00780 g019
Figure 20. Relative permeability as a function of viscosity ratio.
Processes 11 00780 g020
Table 1. Material properties of fluids used in simulations.
FluidDensity (kg/m3)Viscosity (Pa-s)Viscosity Ratio
carbon dioxide (gas)1.78781.37 × 10−573.21
carbon dioxide (supercritical at 10.1 MPa)4693.239 × 10−530.97
carbon dioxide (supercritical at 20.2 MPa)7506.5 × 10−515.44
water998.20.001003-------
Disclaimer/Publisher’s Note: The statements, opinions and data contained in all publications are solely those of the individual author(s) and contributor(s) and not of MDPI and/or the editor(s). MDPI and/or the editor(s) disclaim responsibility for any injury to people or property resulting from any ideas, methods, instructions or products referred to in the content.