Article

Experimental Study and Molecular Simulation of the Effect of Temperature on the Stability of Surfactant Foam

1
College of Mining Engineering, Taiyuan University of Technology, Taiyuan 030024, China
2
College of Safety and Emergency Management Engineering, Taiyuan University of Technology, Taiyuan 030024, China
3
Key Laboratory of Coal Science and Technology, Taiyuan University of Technology, Ministry of Education and Shanxi Province, Taiyuan 030024, China
*
Author to whom correspondence should be addressed.
Processes 2023, 11(3), 801; https://doi.org/10.3390/pr11030801
Submission received: 20 February 2023 / Revised: 3 March 2023 / Accepted: 4 March 2023 / Published: 8 March 2023

Abstract

:
Temperature changes in CO2 foam-fracturing construction can easily affect surfactant foam stability. To investigate the effect of temperature on the foam stability of different types of surfactants, this study measured the foam half-life and viscosity of four typical surfactants, CTAB, LAS-30, HSB1214, and TX-10, using a novel self-designed and built foam performance measurement device. The effects of temperature on foam half-life and viscosity were studied. The results show that as the temperature increased, the half-life shortened, and the viscosity of the liquid phase decreased, which led to a decrease in foam stability. Moreover, using Materials Studio, a type of molecular simulation software, an interfacial model of the foam film was constructed to calculate the IFE and the self-diffusion coefficient of water molecules at 300 ps after the equilibrium of the foam system to investigate the mechanism of temperature influence on the stability of the foam. The results show that, for CTAB, LAS-30, HSB1214, and TX-10, the temperature increases from 15 °C to 45 °C, the IFE is enhanced by −50.05%, −59.10%, −64.21%, and −44.26%, respectively, the interfacial system changes from a low-energy state to a high-energy state, and the interfacial stability decreases. Meanwhile, Dwater increased 1.10-fold, 0.78-fold, 1.43-fold, and 0.64-fold, respectively, which accelerated the diffusion and migration of water molecules, weakened the intermolecular forces, and accelerated the instability of the foam system.

1. Introduction

Coalbed methane (CBM), as the name suggests [1], is an unconventional natural gas resource stored within coal seams, wherein fracturing has become the primary method of CBM exploitation. CO2 foam fracturing is a process in which fracturing fluids (liquid water and CO2) are injected into the coal seam and, after reaching a critical temperature of 31.1 °C, naturally generate foam that eventually leads to the fracturing of the seam due to a continuous increase in pressure. At the same time, CO2 molecules will begin to gradually displace the existing CH4 molecules in the coal seam due to having a stronger adsorption capacity. CO2 foam fracturing is advantageous due to its inherently limited damage to CBM reservoirs, strong sand-carrying capability, and low water consumption, while at the same time being able to achieve the partial sequestration of CO2 and consequently increasing CBM production. CO2 foam fracturing is also superior to hydraulic fracturing in terms of environmental and economic considerations, therefore it has gradually replaced traditional hydraulic fracturing and is now commonly used in the industry. CO2 foam-fracturing parameters can be determined via experimental testing and analyses of CBM reservoir characteristics and the determination of the optimal ratio for fracturing fluid [2]. As surfactants are often used as foaming agents to prepare foam-fracturing fluids, their performance is a crucial indicator of the efficacy of CO2 foam fracturing and, consequently, the entire CBM extraction operation.
Foam stability is an essential property for the evaluation of foam performance; furthermore, it significantly impacts the transmission of pressure and fracture formation and propagation during fracturing operations [3,4]. The determination of foam stability can be conducted via macroscopic analyses of foam half-life and viscosity and microscopic analyses of interface formation energy (IFE) and the self-diffusion coefficient. Abdelaal et al. [5] studied the theoretical bases and applications of foam-fracturing fluids and found that the success of foam-fracturing operations depends on foam stability and its ability to carry proppants. Ju et al. [6] prepared foam-fracturing fluids with sodium dodecyl sulphonate (SDS) and cetyl trimethyl ammonium bromide (CTAB) foaming agents, quantified foam properties using microscopy, and found that foam half-life is correlated positively and negatively with bubble morphology parameters α and β, respectively. Ahmed et al. [7] established an empirical formula for the relationship between surfactant concentration and polymer foam viscosity under high-pressure and -temperature conditions. Feng et al. [8] conducted rheological tests and numerical simulations and demonstrated that CBM extraction efficacy could be improved by the enhancement of gas desorption and percolation via the utilization of a viscoelastic surfactant, which increases fracture surface area. Chandra et al. [9] found that SDS mobility increases as temperature increases, which accelerates foam coalescence. The findings of Ivanova et al. [10] indicate that hydrogen bonding between surfactants and water molecules decreases as temperature increases, which decreases the solubility of surfactants in water. Surfactants can be categorized into four groups based on dissociation activity, including cationic, anionic, amphoteric, and nonionic [11]. The foam properties of varying surfactants differ, and whether they can be adapted to and applied in coal reservoirs remains to be investigated [12,13,14,15]. During the foam-fracturing fluid flowing in the wellbore, the formation temperature will also change with the increase in wellbore depth [16,17,18]. Currently, for different types of surfactants, the research mechanism of their foam performance affected by temperature change is unclear, which restricts the efficient extraction of coalbed methane wells.
To investigate the effect of temperature on the performance of foam, this study conducted experimental tests and numerical simulations on four types of surfactants, including cationic CTAB, anionic sodium lauryl benzene sulfonate (LAS-30), amphoteric alkyl C12–14 hydroxypropyl sulfobetaine (HSB1214), and nonionic polyoxy ethylene nonyl phenyl ether (TX-10), as shown in Table 1.
The relationships between the foaming volumes of the four surfactants and their respective concentrations were determined via foaming characteristic tests; subsequently, their respective critical micelle concentration (CMC) ranges were obtained. The half-life and viscosity of surfactant foam at different temperatures were measured, and the relationships between temperature, half-life, and viscosity were investigated. An interfacial model was constructed using Materials Studio (MS), a type of molecular dynamics simulation software, to investigate the mechanism of temperature influence on the stability of surfactant foam in terms of the interface formation energy (IFE) of the system and the diffusion characteristics of water molecules. The correlation between foam stability and actual fracturing effect was further verified by simulating the stress conditions during foam fracturing and measuring the Maximum Cracking Pressure (MCP) of sandstone at varying temperatures. This study’s results indicate that the findings are of practical significance for the improvement of CBM fracturing productivity.

2. Experimental and Numerical Simulation

2.1. Experimental Temperature and Surfactant Selection

During the injection of CO2 foam-fracturing fluid into the coal seam through the wellbore, the ambient temperature of the coal seam gradually increases with increasing depth [19]. Taking field data in the Qinshui coalbed methane field, Shanxi Province, as a reference, the temperatures of the thermostatic layer and fractured well were measured to be 15 °C and 45 °C, respectively. Therefore, in this study, 15 °C, 20 °C, 25 °C, 30 °C, 35 °C, 40 °C, and 45 °C were set as the experimental ambient temperature for relevant experimental tests. In this paper, four typical surfactants, CTAB, LAS-30, HSB1214, and TX-10, commonly used in CO2 foam fracturing, are used as research objects, as shown in Table 2. In addition, the density of carbon dioxide liquid is 1.101 g·cm−3, and the vaporization volume expansion is 595.5 times (101.33 Kpa).

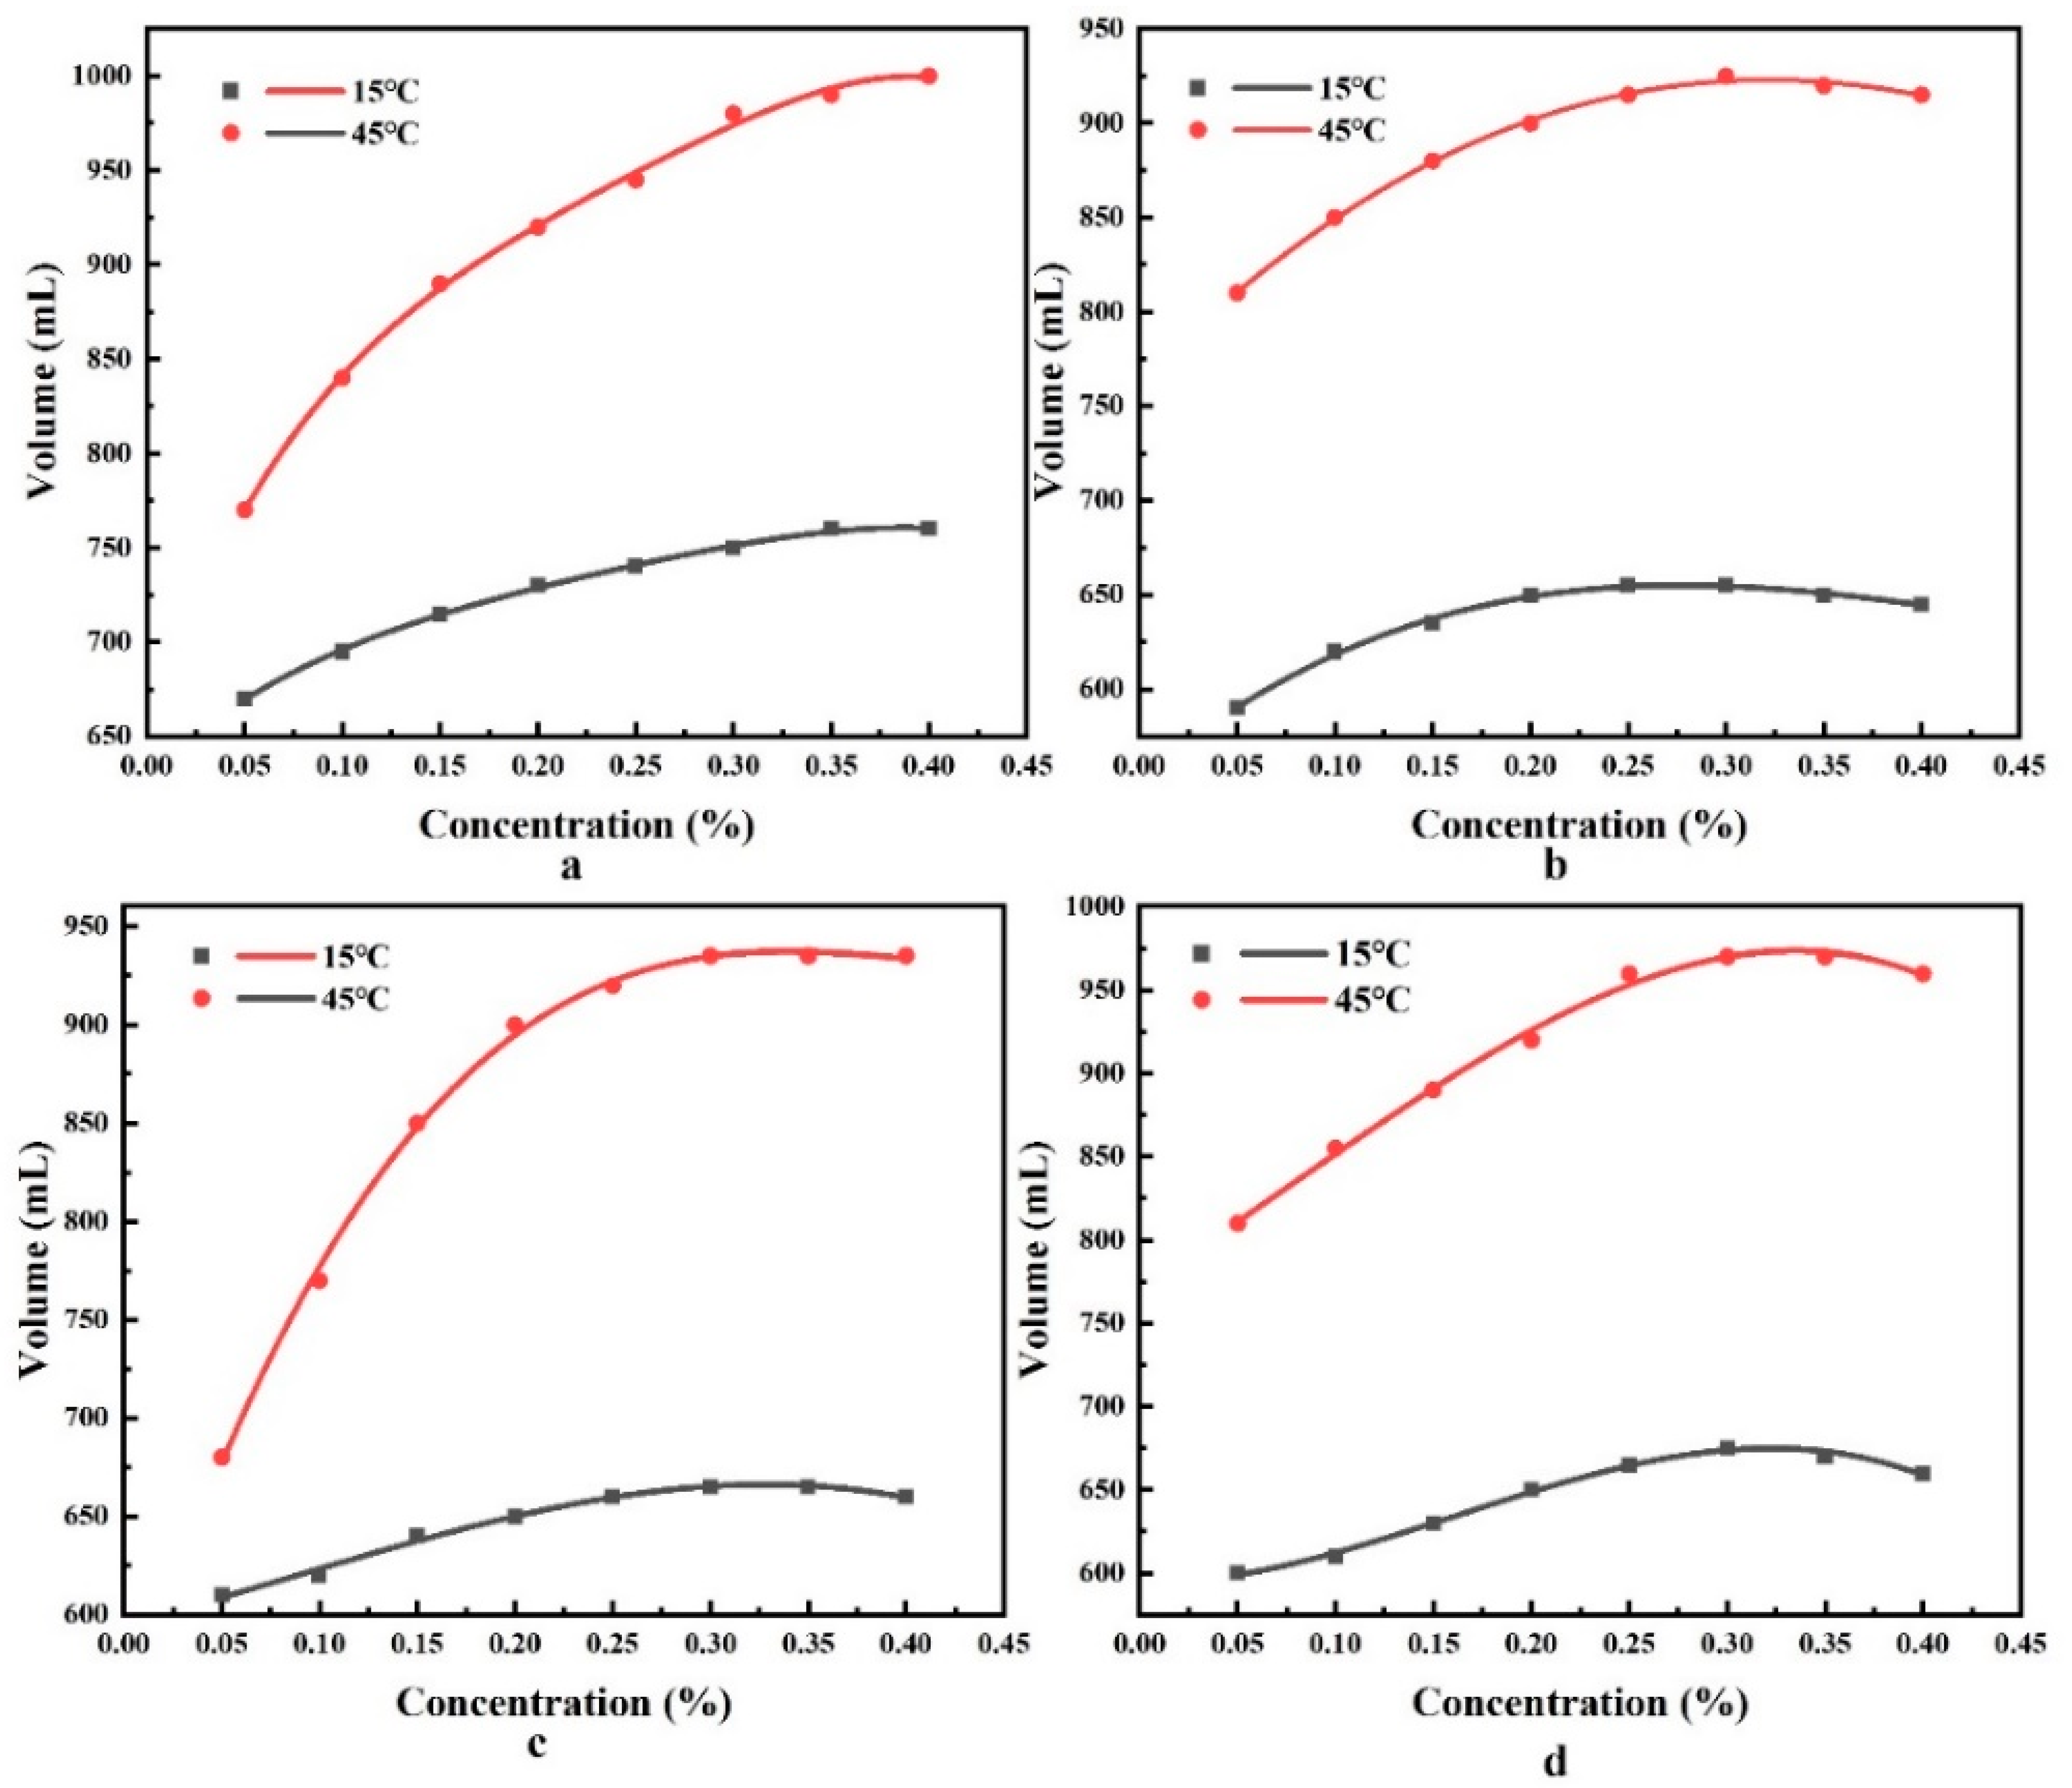
2.2. Measurement of Foam Volume and Half-Life

The foam formation process entails continually increasing foam system surface area and volume and continually thinning foam liquid film [20]. The minimum concentration at which surfactant molecules join in the solvent to form micelles is called the critical micelle concentration (CMC) [21]. By analyzing the increase in surfactant foaming volume with concentration, the range of surfactant CMC value can be judged [22]. When surfactant concentration is equal to CMC, surface tension converges, surface tension and the difference between inside and outside foam pressure reaches equilibrium, foam volume reaches a maximal value, and the number of surfactant molecules at the gas–liquid interface continues to accumulate; as surfactant concentration continues to increase and exceeds CMC, the number of surfactant molecules at the gas–liquid interface continues to increase, the average distance between surfactant molecules decreases, intermolecular repulsion increases, surface tension increases, and foam volume slowly decreases. Foam half-life, which refers to the time required for the foam to discharge half of the liquid volume, is one of the essential indicators that can be used to characterize the foam stability of surfactants, wherein, the longer the foam half-life, the better the foam stability [23,24]. The slower the foam coalesces, the longer the foam half-life. Therefore, the half-life of surfactant foam should be measured experimentally to determine the strength of foam stability.
This experimental apparatus is a self-designed and built foam performance measurement device that consists of an infrared foam measurement system and a gas control and regulation system (Figure 1), which can pass gaseous CO2 into the liquid phase at a constant temperature. First, the surfactant to be tested was prepared with deionized water to 25 mL of surfactant solution of the concentration required for the experiment and transferred to the foam meter tube. Then, the parameters were set through the centralized console, the gas output flow rate was 14.89 mL/s, the output time was 10 s, the output pressure was 1.01 Mpa, and the thermostat was set to the experimental temperature. Then, CO2 was drummed into the foam meter tube, the gas was mixed with the liquid phase through the foaming screen, and the gas–liquid phase was rapidly mixed and foamed. Finally, the infrared receiver sent the real-time signal back to the centralized console for post-processing to obtain the foam volume and half-life.

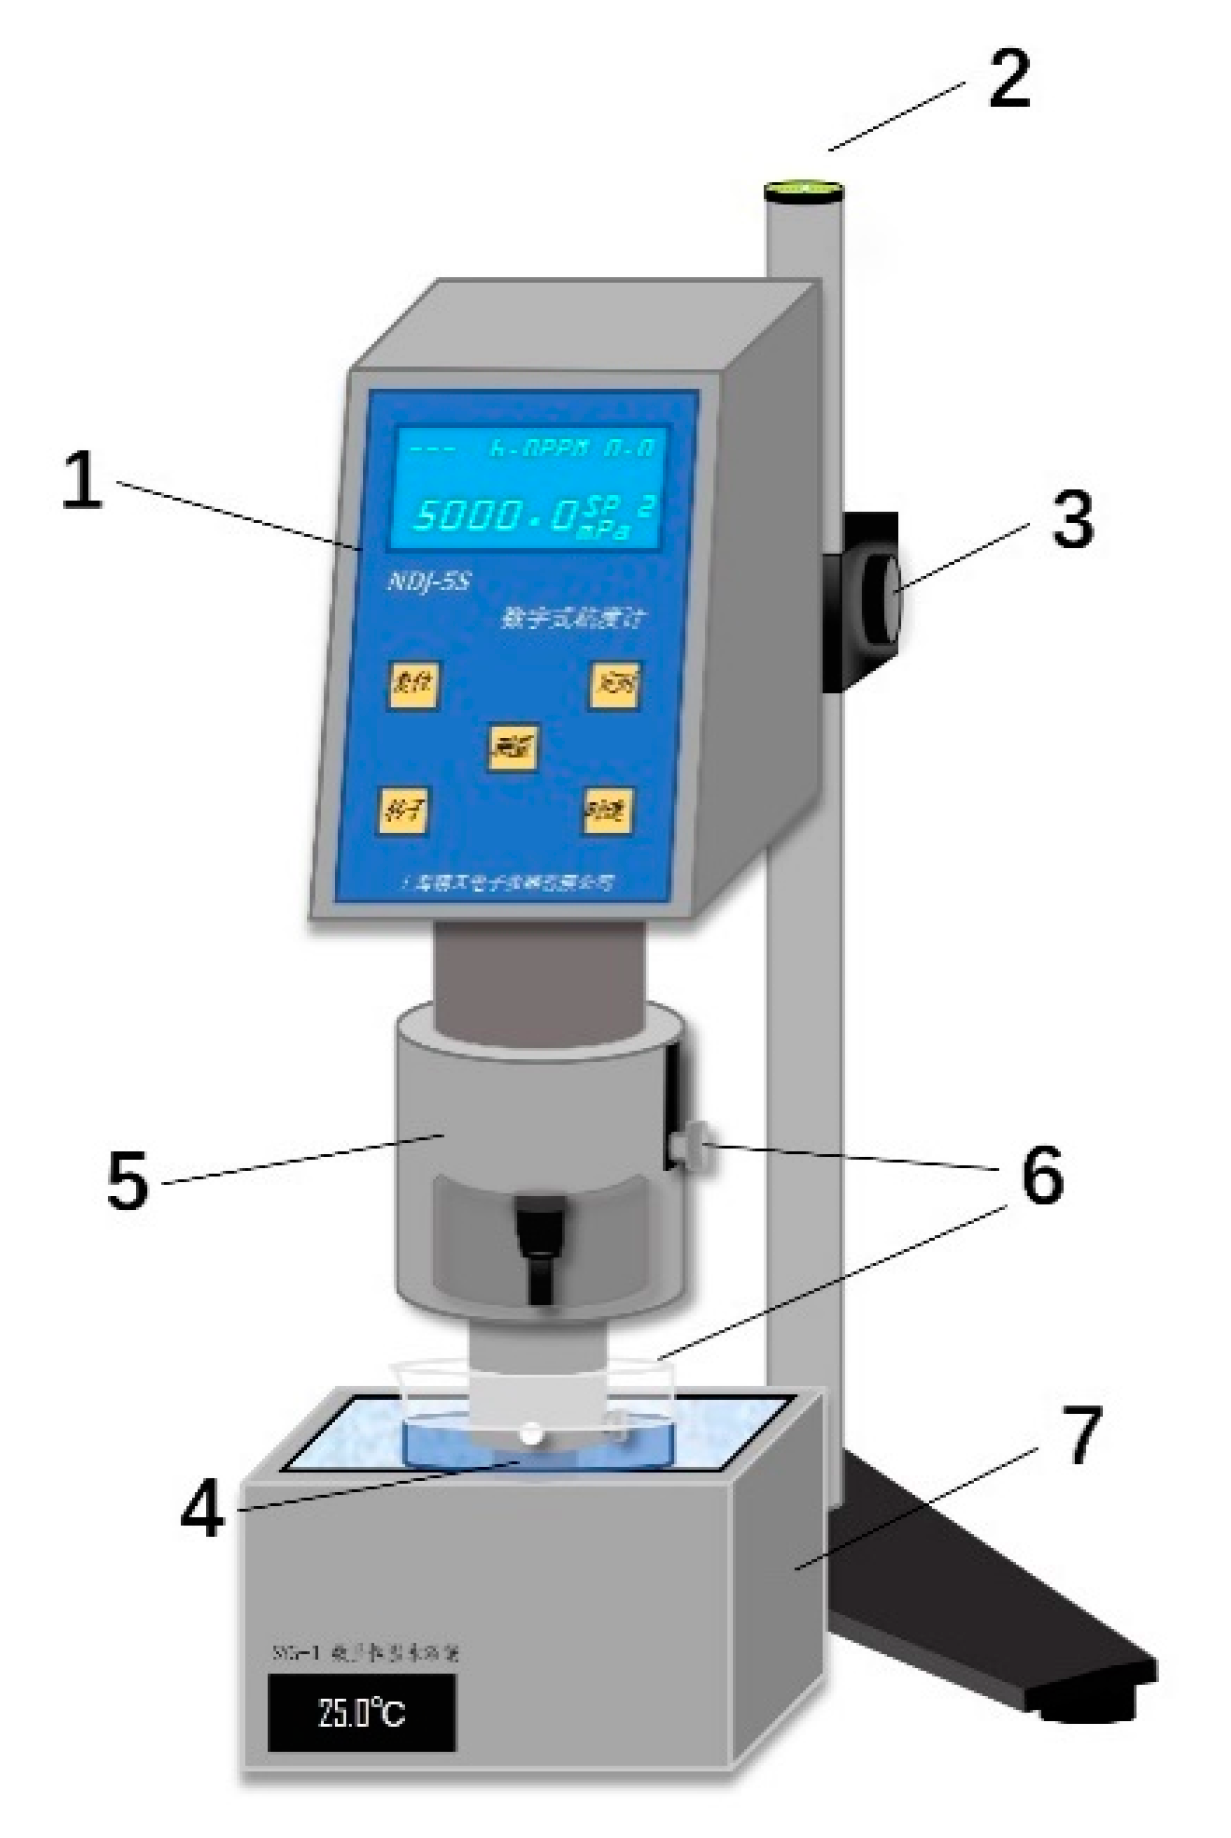
2.3. Viscosity Measurement Test

Dynamic viscosity describes a fluid’s resistance to deformation by tensile or shear action. As density increases, the liquid precipitation in the liquid film must overcome more and more intermolecular forces. On the other hand, increased density also increases surface viscosity and elasticity, reducing the surface tension of the liquid and consequently benefiting foam system stability [25,26].
The constant-temperature viscosity measurement test device comprises a DNJ-5S digital display viscometer and constant-temperature water bath, as shown in Figure 2. First, adjust the DNJ-5S to the horizontal position and mount the rotor No. 0 on the connecting rod. Then, the outer test cylinder is filled with 25 mL of the measured solution, set into the fixed sleeve, and fixed with a screw. Then, place the outer test cylinder with the fixed sleeve in the water bath so that the liquid level of the water bath is flush with the sleeve’s lower surface. Then, slowly adjust the lift knob to adjust the vertical height of the rotor No. 0 so that the upper groove of the rotor and the outer test tube to be measured in the liquid surface flush. Finally, turn on the instrument switch, set the number of rotors to 0, set the speed to 30 r/min, press the measurement button, wait for stability, and read the viscosity value.

2.4. Molecular Dynamics Numerical Simulation

Molecular dynamics simulation describes the interaction forces between particles in the system through the empirical force field, solves the Newtonian equations of motion for all particles, realizes the mapping from the mathematical area to the mechanical area, and then obtains the numerical solution of statistical thermodynamics by iterative solution. Materials Studio (MS) software simulates the behavior of molecules from the microscopic point of view by constructing corresponding models and algorithms, obtains the movement track of molecules in the system, and then investigates the structure, energy, and other properties of the system. The amount of energy change per unit in the foam wall interface system after the adsorption of a single surfactant is called interface formation energy (IFE) [27,28,29]. The self-diffusion coefficient of water molecules (Dwater) is a physical property used to measure the degree of deviation of water molecules from the initial position. Both IFE and Dwater are important parameters used in the investigation of interface stability after the foam interface system reaches equilibrium, which can be calculated by molecular dynamics simulation. This paper uses MS software to build a foam wall interface model, calculate IFE and Dwater under different temperature conditions, and explore the effect of temperature on the stability of different types of surfactant foams.
The CTAB, LAS-30, HSB1214, TX-10, and H2O molecular models were constructed using the Visualizer module, as shown in Figure 3.
The CTAB, LAS-30, HSB1214, and TX-10 foam interface models were generated by placing 5 of each respective surfactant molecule in their respective rectangular boxes, with bottom side lengths of 30 Å, using the Amorphous Cell module. Afterward, the lower face of each surfactant box was combined with the top face of another rectangular box filled with 100 H2O molecules using Build Layers, which completes the generation of the interface models. Then, Geometry Optimization was used to optimize the model structure. Quench was then used to allow the internal stress fields to reach equilibrium to relax the structures and ensure the rationality of the random layouts of molecules, as shown in Figure 4.
In this case, select NVT ensemble, pressure as 101.33 kPa, and temperature as experimental temperature, force field is selected as COMPASS II, and Algorithm is set as Smart; both electrostatic potential and van der Waals force are processed by Atom Based. The simulation time is 5.0 ps, the time interval is 1 ps, and there are 5000 steps. At the end of optimization, the system reaches the energy minimum, and its stable structure is obtained. Finally, the Dynamic of the Forcite module is selected for the simulation, and select NVT ensemble and initial velocities as Random. Set the truncation radius as 1.2 nm, pressure as 101.33 kPa, temperature as experimental temperature, kinetic trajectory information recorded every 1 ps, simulation time as 1 ns, and step size as 1.0 × 10⁶.

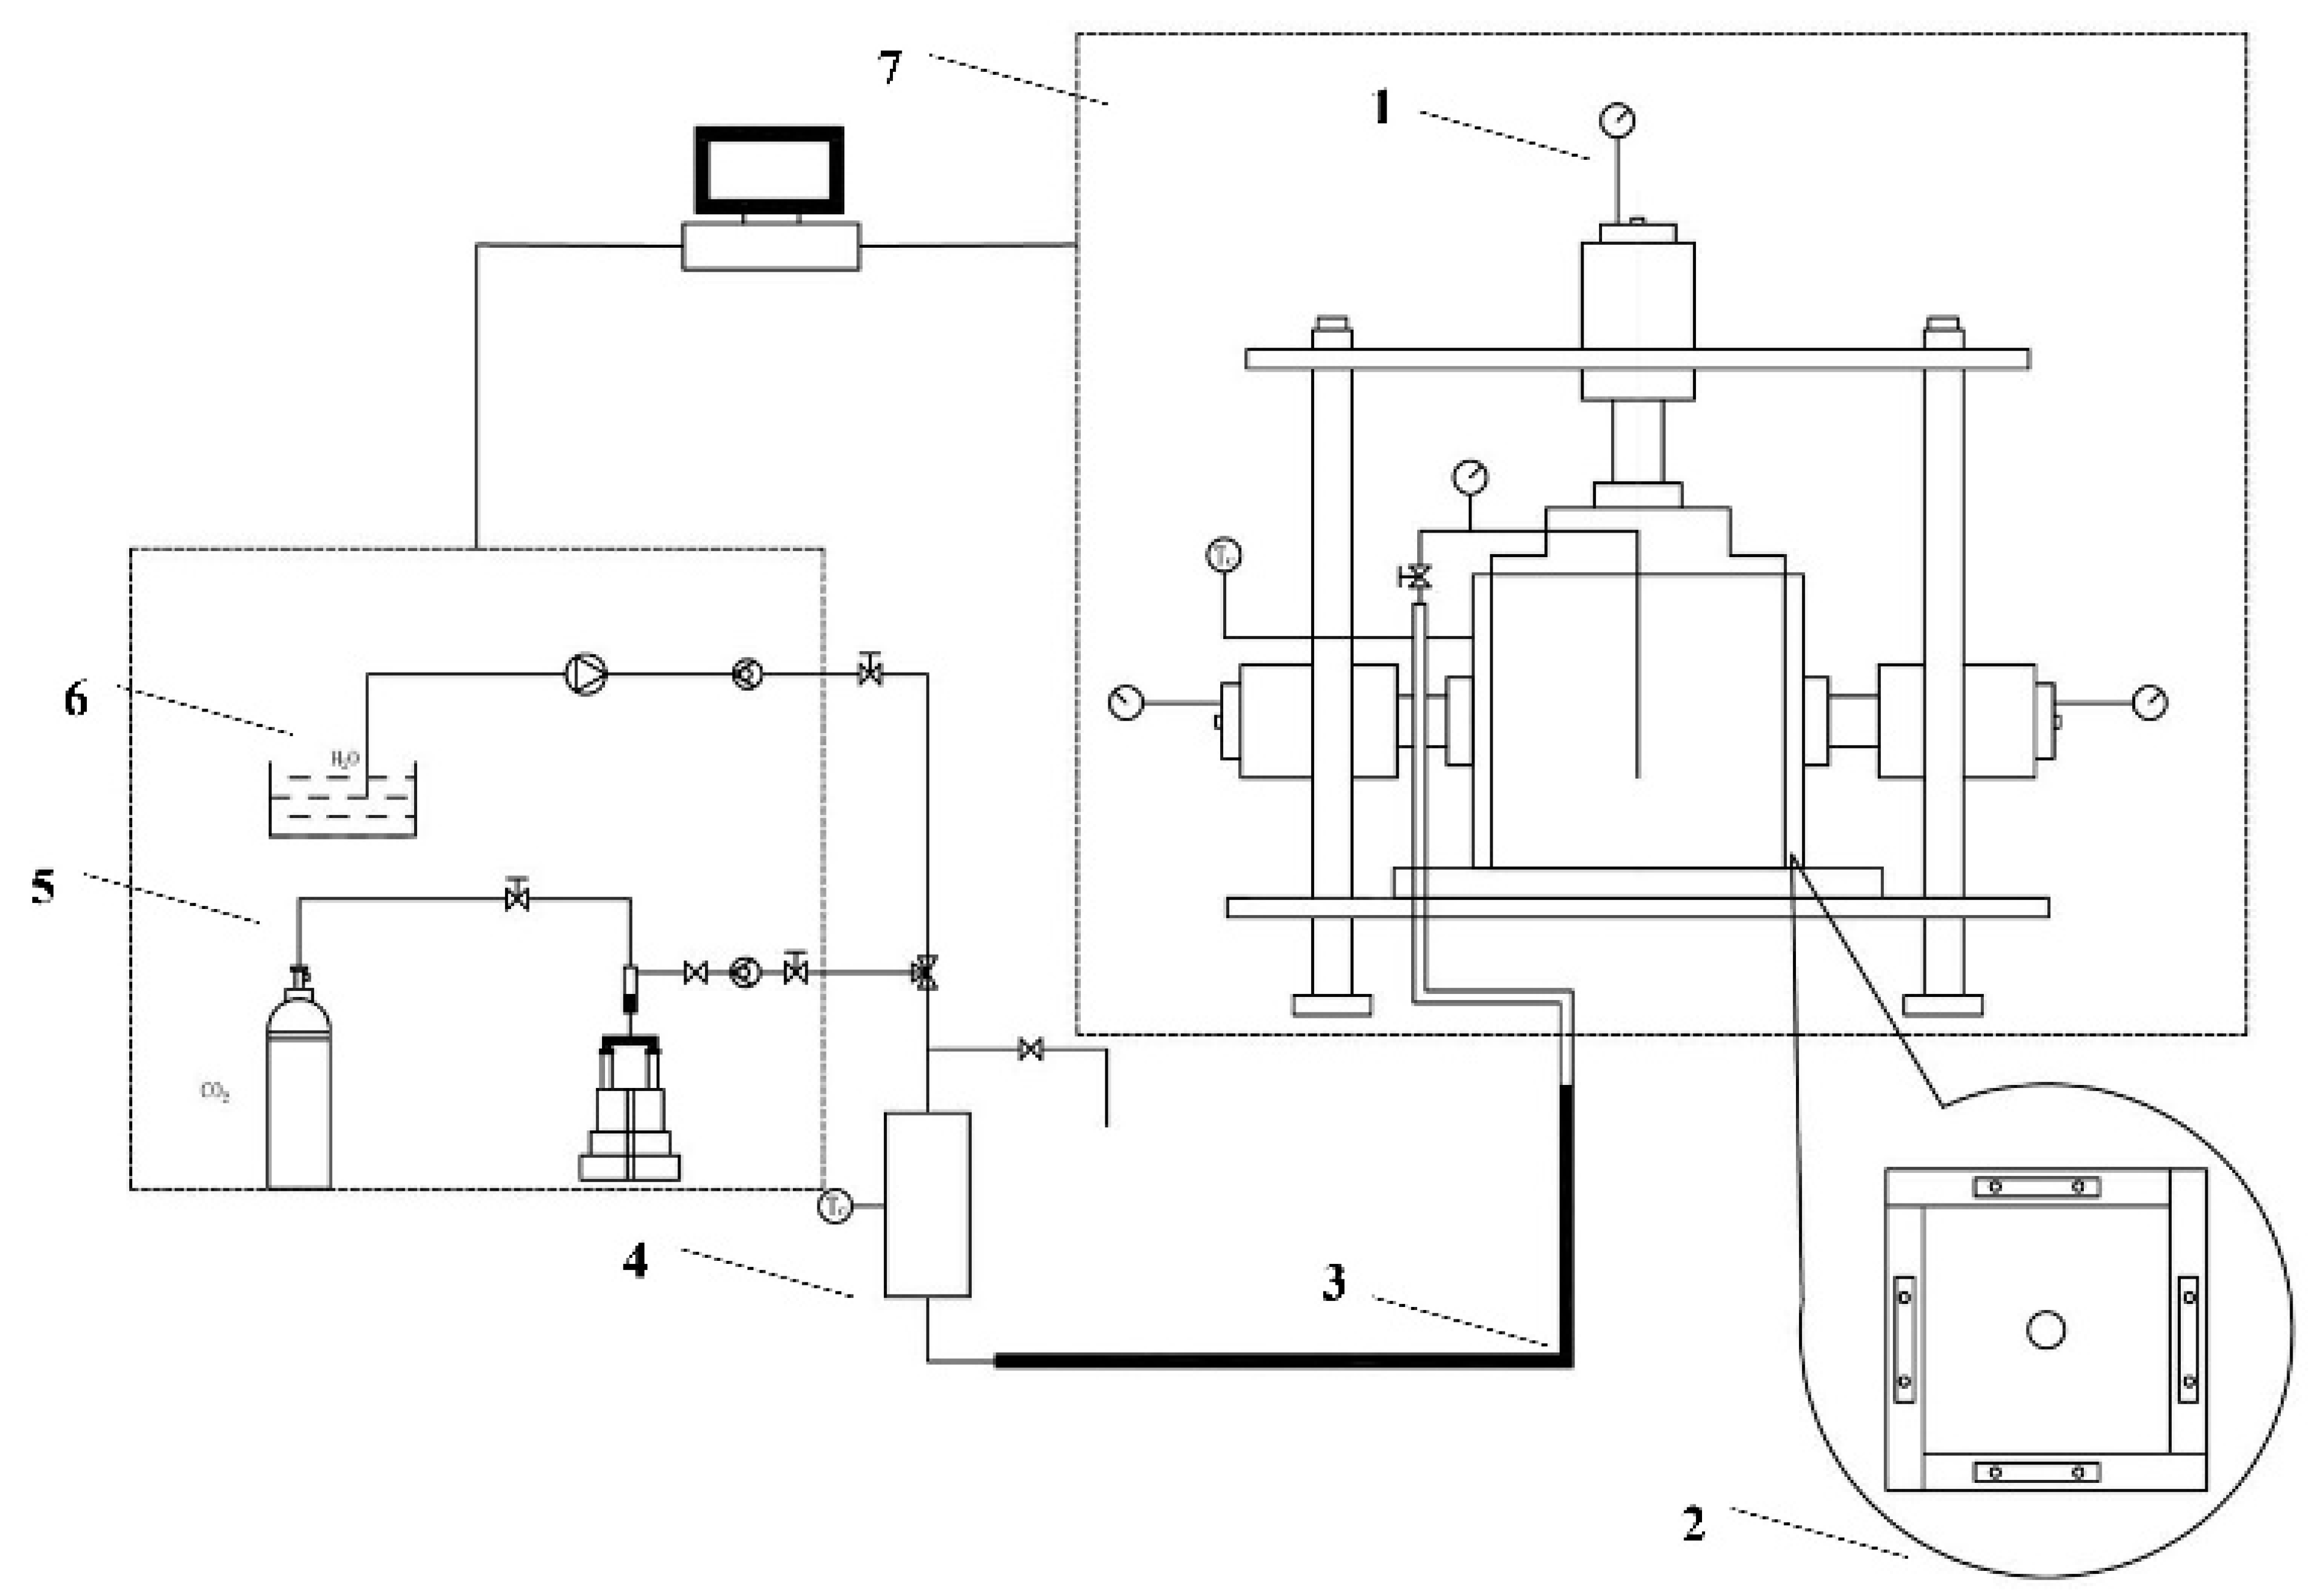
2.5. Foam Fracturing Similar Simulation Experiment

Rock MCP is a key parameter that can be used to evaluate the effect of surfactant properties on overall fracturing efficiency. This study intends to determine the necessity of foam stability studies under stress conditions simulating CBM fracturing operations. Under the same stress state, lower MCPs result in more complex fracture networks, which increases the productivity of the CBM fracturing and production.
The specimens were extracted from a sandstone formation in Jining, Shandong. The specimen size was 200 × 200 × 200 mm, and the specimen was processed in a cutting workshop in Jining City, Shandong Province, with the dimensional error ≤ 0.1 mm in each direction and the deviation of each diamond angle ≤ 0.1 rad, which were measured before the test, and all met the required standards for the experiment. A 6 mm wide hole was drilled into the center of the specimens with a depth of 150 mm. A vertical stress of 10 Mpa, maximum horizontal stress of 9 Mpa, and minimum horizontal stress of 5 Mpa were set for this experiment, and water is pumped at a rate of 5 mL·min−1, the gas injection rate was 29.75 mL·min−1, and the gas pumping pressure is 1 Mpa, as shown in Figure 5.

3. Results and Analysis

3.1. CMC Value Range Analysis

Both Chen [30] and Tennouga [31] found that the CMC values of surfactants increased and then decreased with increasing temperature. Fracturing construction gives full play to the role of the surfactant, and the concentration ratio is generally greater than the CMC. The foam volume of the four surfactants at an ambient temperature of 15 °C and 45 °C was measured by a foam performance measurement device to determine the range of CMC values based on the relationship between concentration and foam volume, and the experimental results are shown in Figure 6.
As seen in Figure 6, the concentrations of the four types of surfactants, CTAB, LAS-30, HSB1214, and TX-10, all exceeded their CMC values at both 15 °C (0.30%, 0.20%, 0.25%, 0.25%, respectively) and 45 °C (0.35%, 0.25%, 0.25%, 0.30%, respectively), which induces the reduction in foam volume. Thus, this study elected to set the experimental concentrations of the four surfactants to 0.35% to ensure that the concentration is always greater than the CMC value in the temperature range of 15–45 °C.

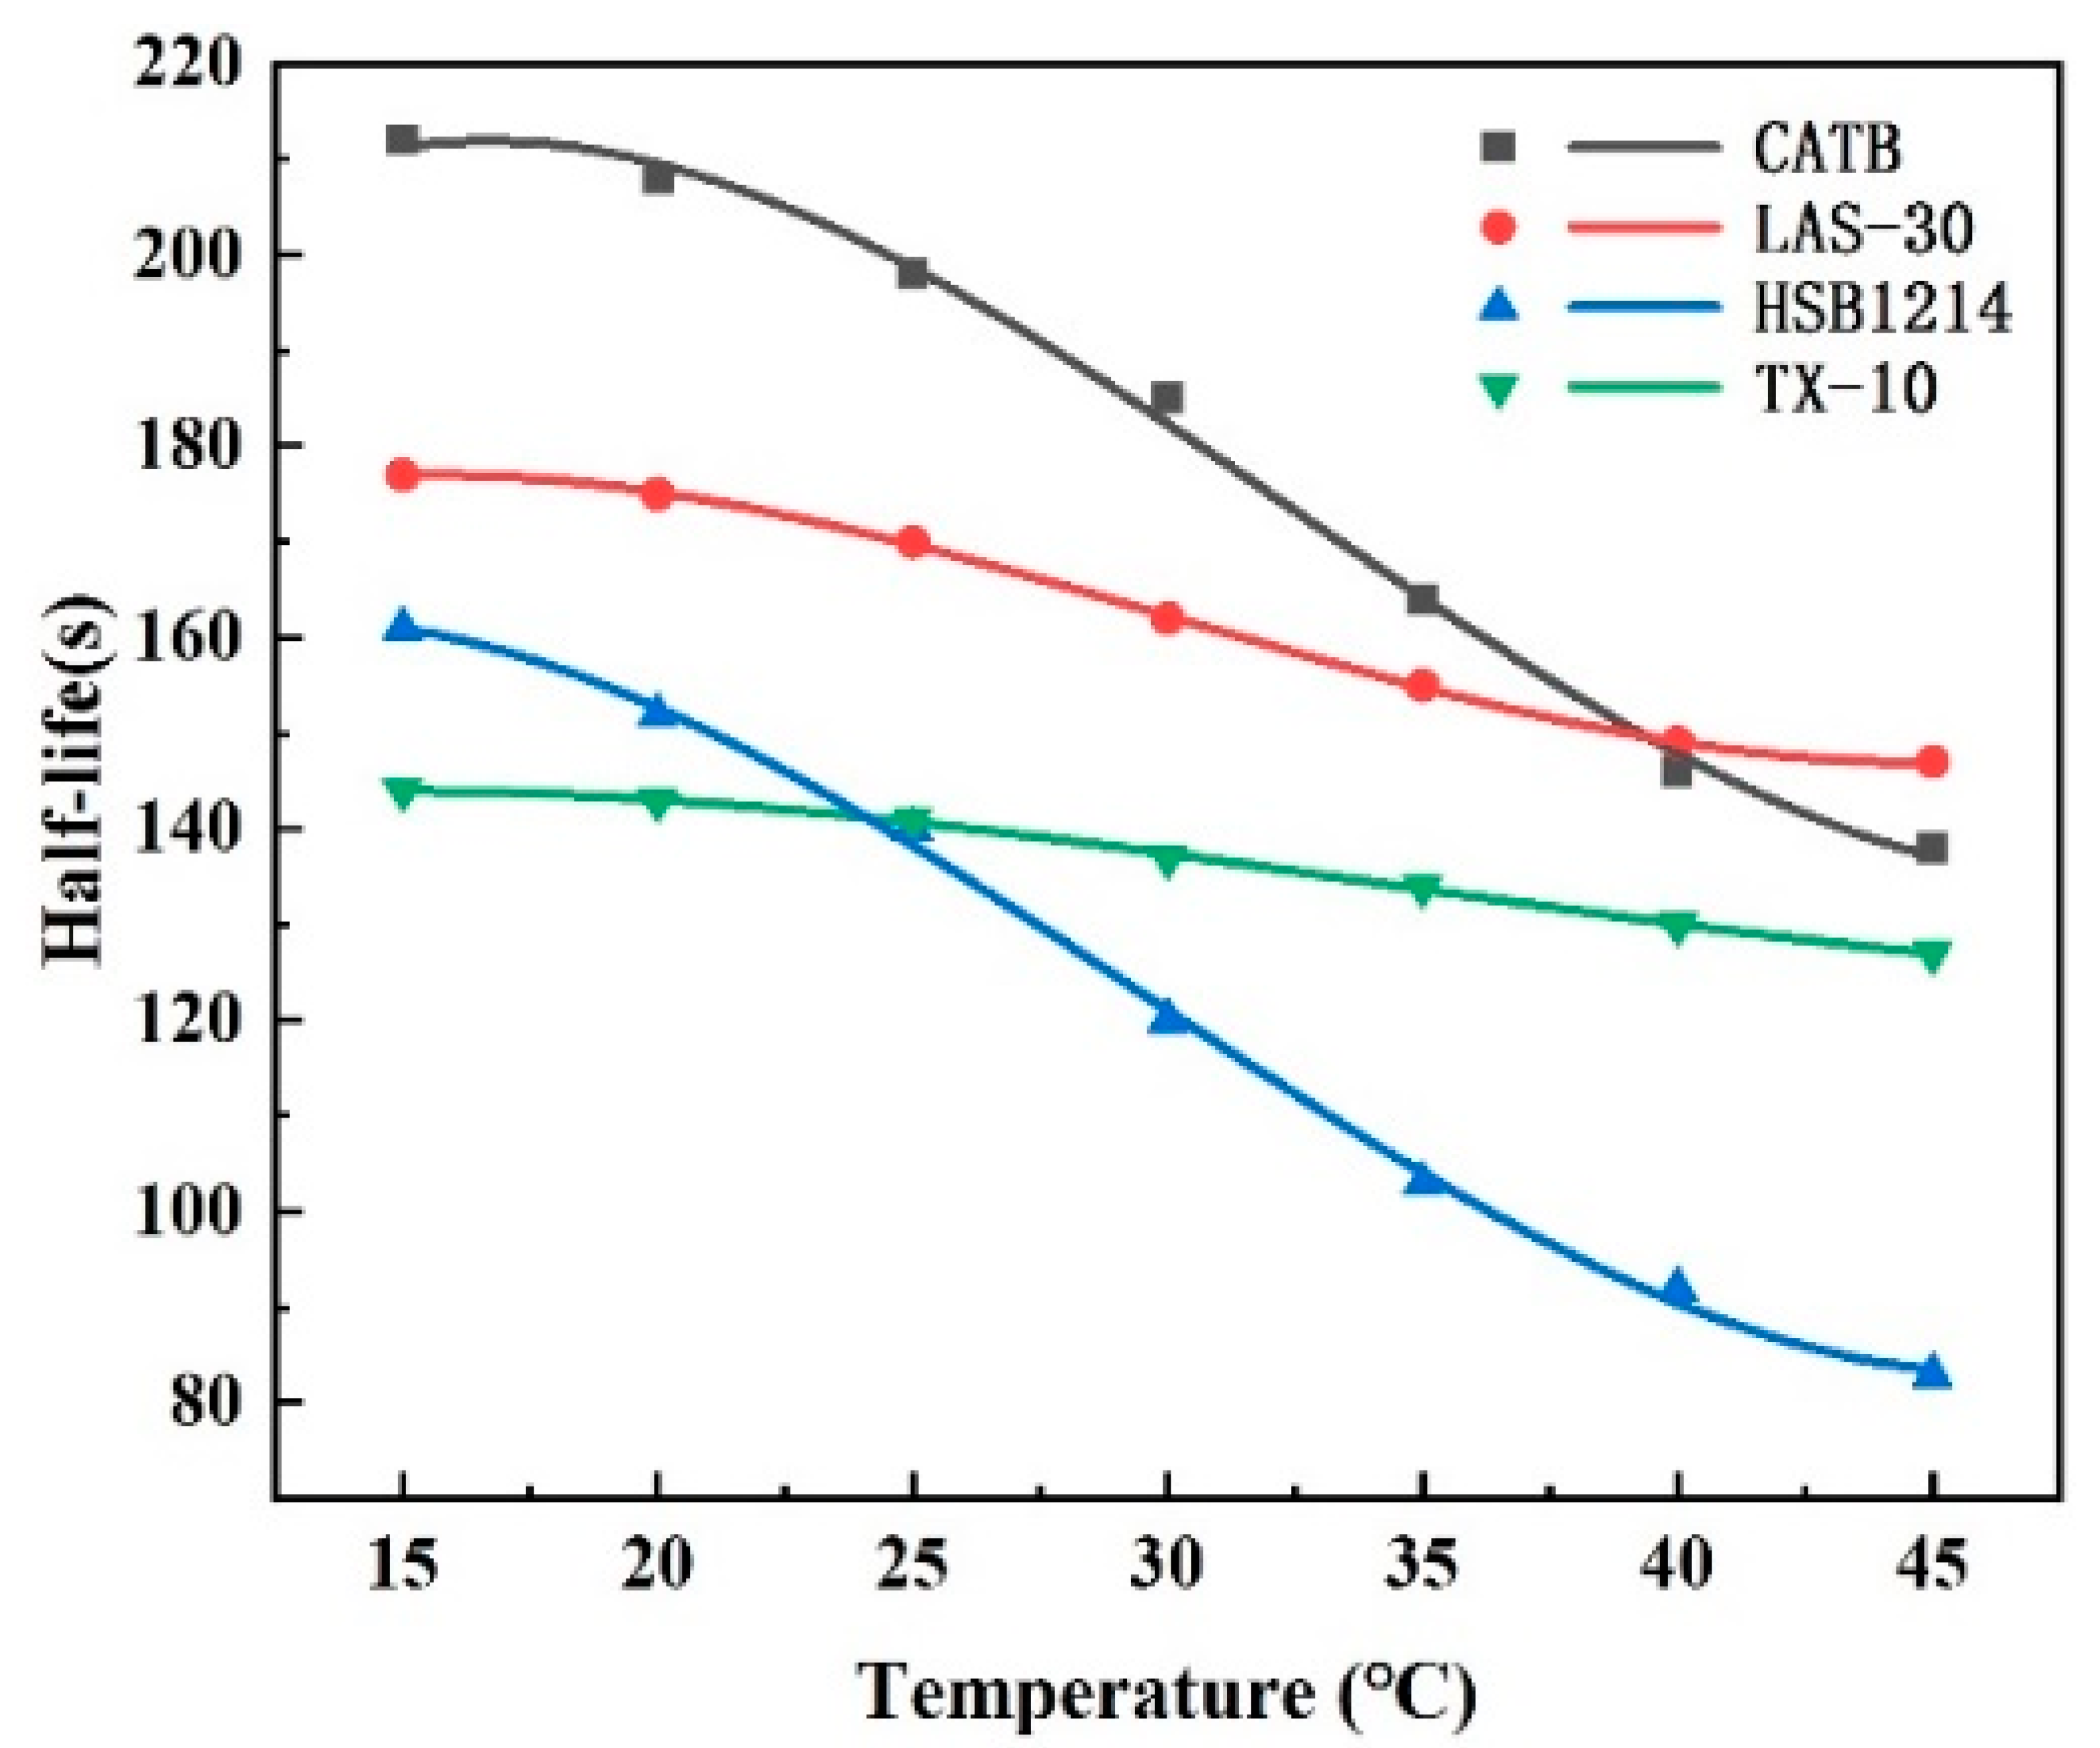
3.2. Foam Half-Life Experimental Results and Analysis

Surfactant foam stability is evaluated by half-life. By measuring the foam half-life of the four surfactant solutions with a concentration of 0.35% at different temperatures and analyzing the relationship between half-life and temperature, the experimental results are shown in Figure 7.
Figure 7 shows that the size of foam half-life decay is ranked as HSB1214 > CTAB > LAS-30 > TX-10. With the increase in temperature, the overall half-life of the foam decreases; the half-life of HSB1214 foam is the most affected by temperature, with a decrease of 48.45%, and the half-life of TX-10 is the least affected by temperature, with a decrease of only 11.81%. Temperature-increase-induced surfactant half-life decay is due to the reduction in CO2 solubility, which accelerates the evolution of CO2 from the liquid film. Temperature accelerates foam coalescence, which induces foam growth. Under gravity, the liquid flows along the liquid film faster from top to bottom, which causes the upper liquid film to become thinner and eventually rupture. The rupture of the liquid film also produces a mechanical shock, which leads to the rupture of the surrounding liquid film and the consequent decrease in foam stability. The experimental results showed that the temperature was negatively correlated with the half-life, and as the temperature increased, the half-life decreased, and the foam became less stable.

3.3. Viscosity Test Results and Analysis

Dynamic viscosity, the measure of the molecular internal friction of a moving liquid, is a parameter that characterizes the flow of a liquid. The viscosity values of four surfactant solutions with a concentration of 0.35% at different temperatures were measured with DNJ-5S, and the relationship between viscosity and temperature was investigated. The experimental results are shown in Figure 8.
Figure 8 shows that the viscosity reduction magnitude ranked as follows: LAS-30 > CTAB > HSB1214 > TX-10. With the increase in temperature, viscosity as a whole showed a decreasing trend, the temperature increased from 15 °C to 45 °C, the density of LAS-30 was the most affected by temperature, and its viscosity value decreased by 60.99%; TX-10 was the least affected by temperature, and its viscosity value decreased by 49.58%. Temperature-increase-induced viscosity reduction is due to the reduction in internal friction in the flowing liquid, which reduces both mechanical strength and elastic modulus. As internal friction decreases, liquid flow accelerates, and liquid discharge from the liquid film becomes easier due to the internal friction’s inability to counteract the forces of pressure difference and gravity. When any bubble in the foam film bursts, adjacent bubbles are affected, which induces local thinning and local reduction in mechanical strength, consequently reducing the foam film’s ability to resist deformation and may cause the eventual rupture of the film. This local thinning requires recovery time as surfactant molecules in other portions of the film need to diffuse to this area, making it difficult to maintain liquid film uniformity, and decreasing overall liquid film elasticity. The weaker the repairing effect of the foam, the more difficult it is to repair local thinning, which negatively affects overall foam stability. The experimental results show that the temperature and viscosity are negatively correlated, liquid-phase viscosity decreases, and foam stability decreases when the temperature increases.

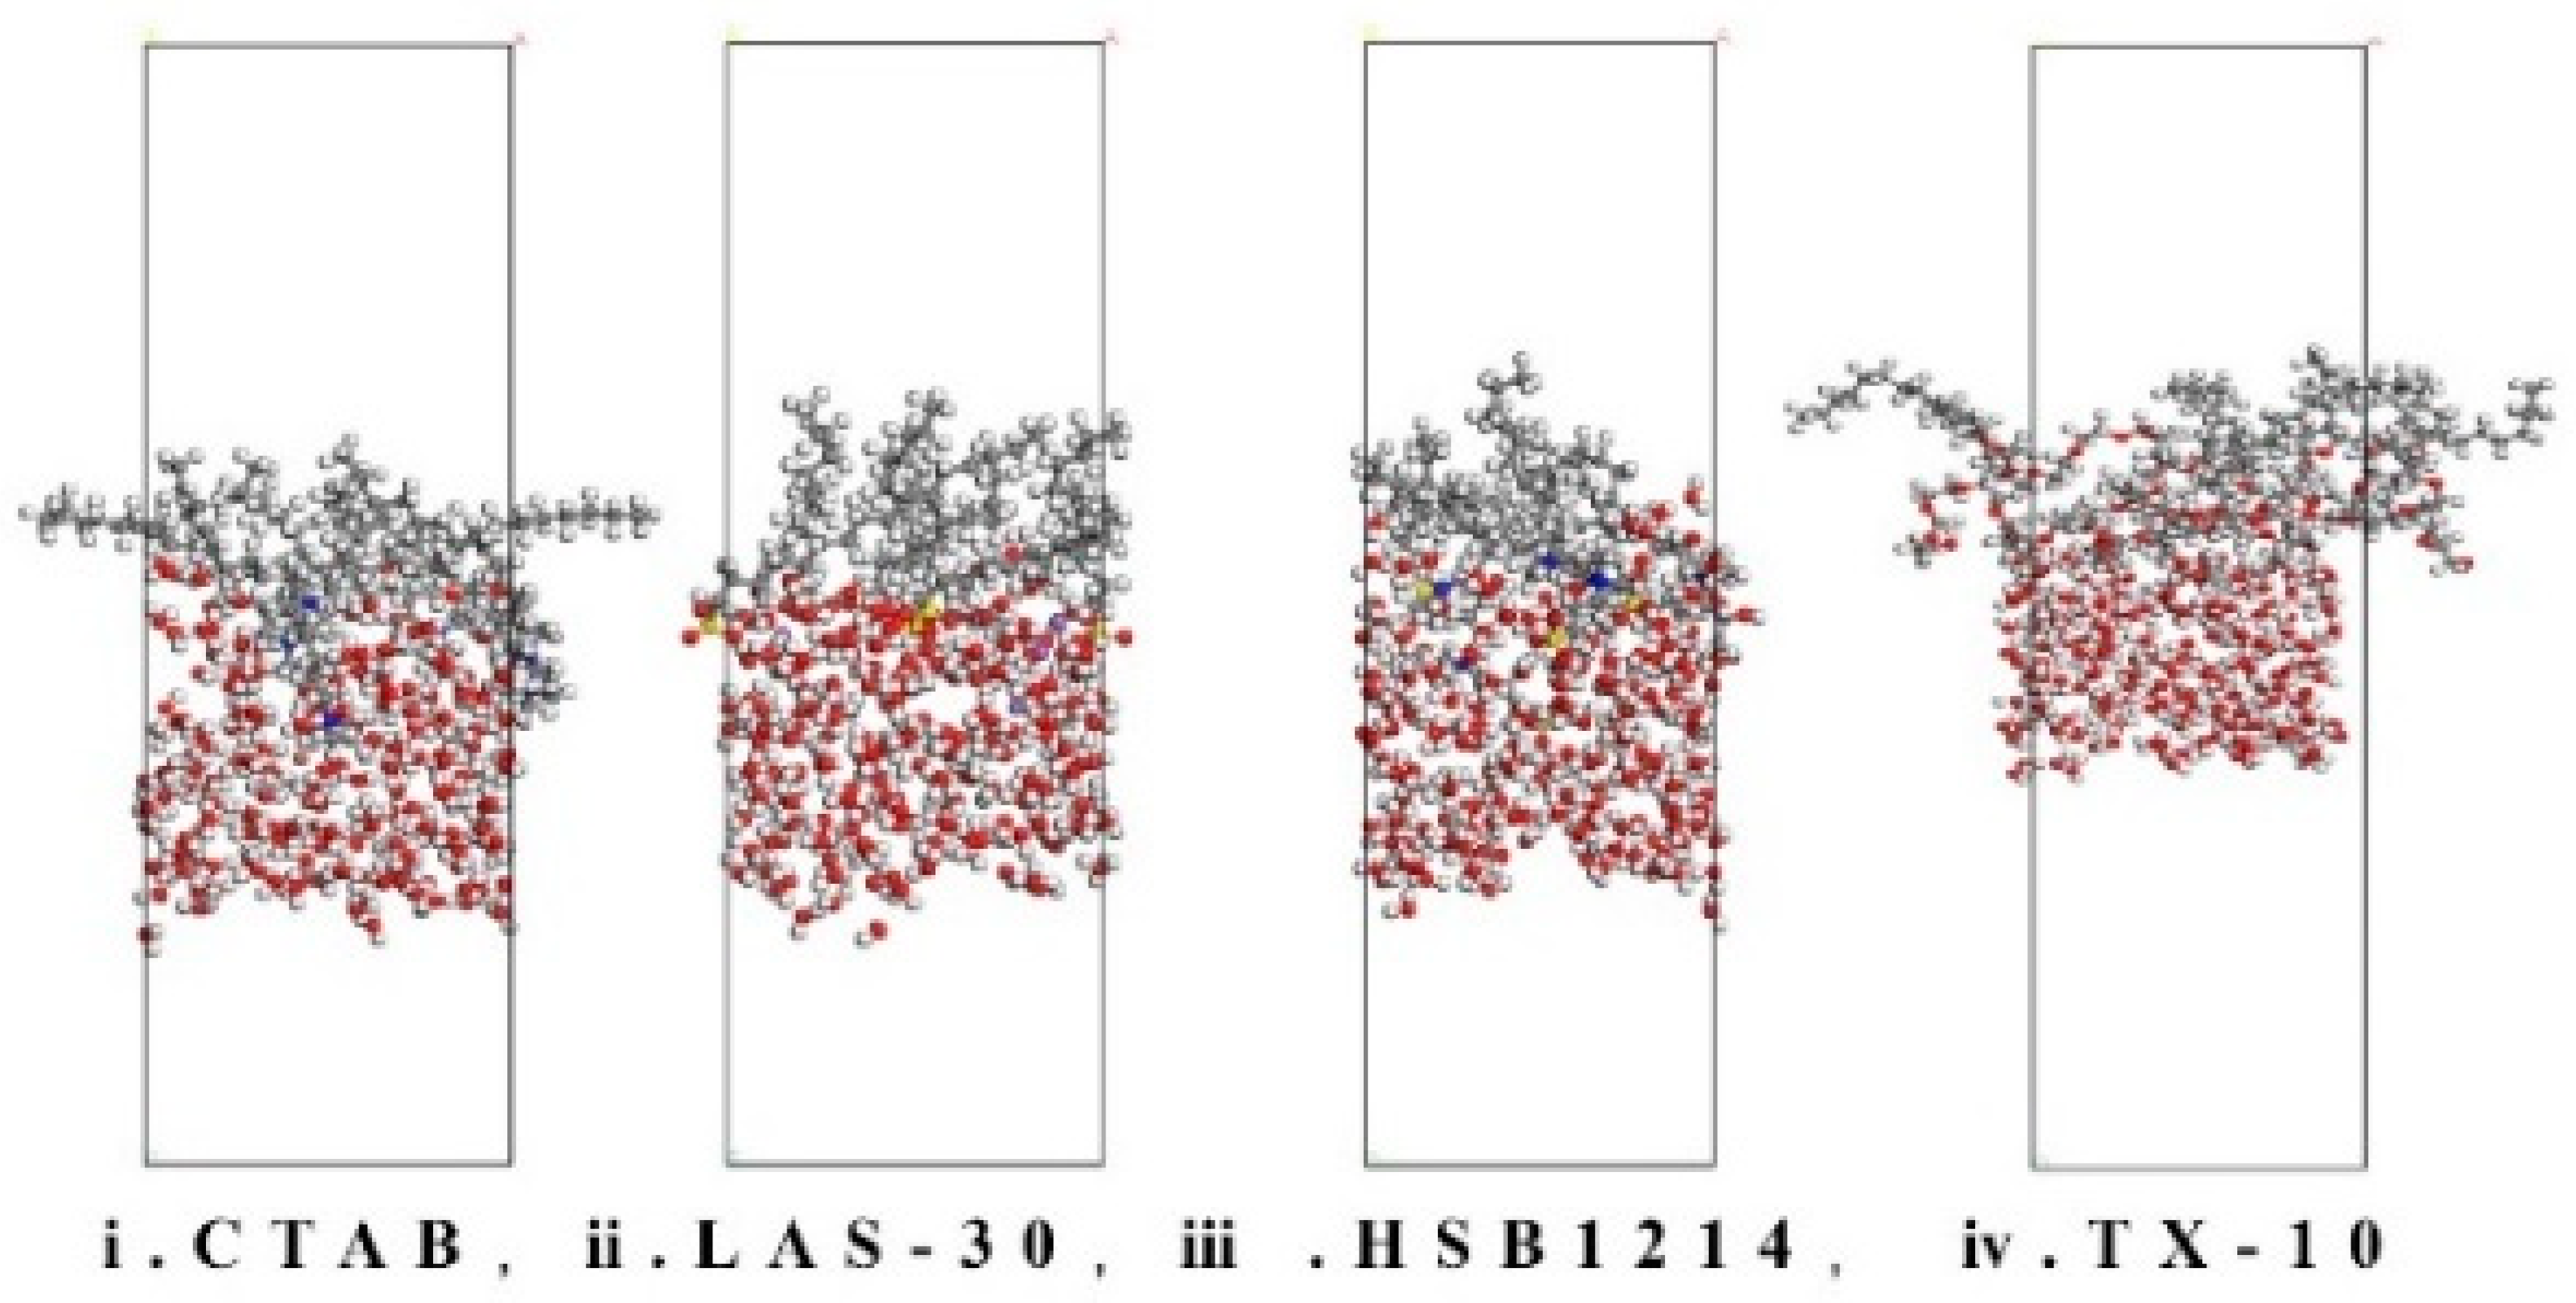
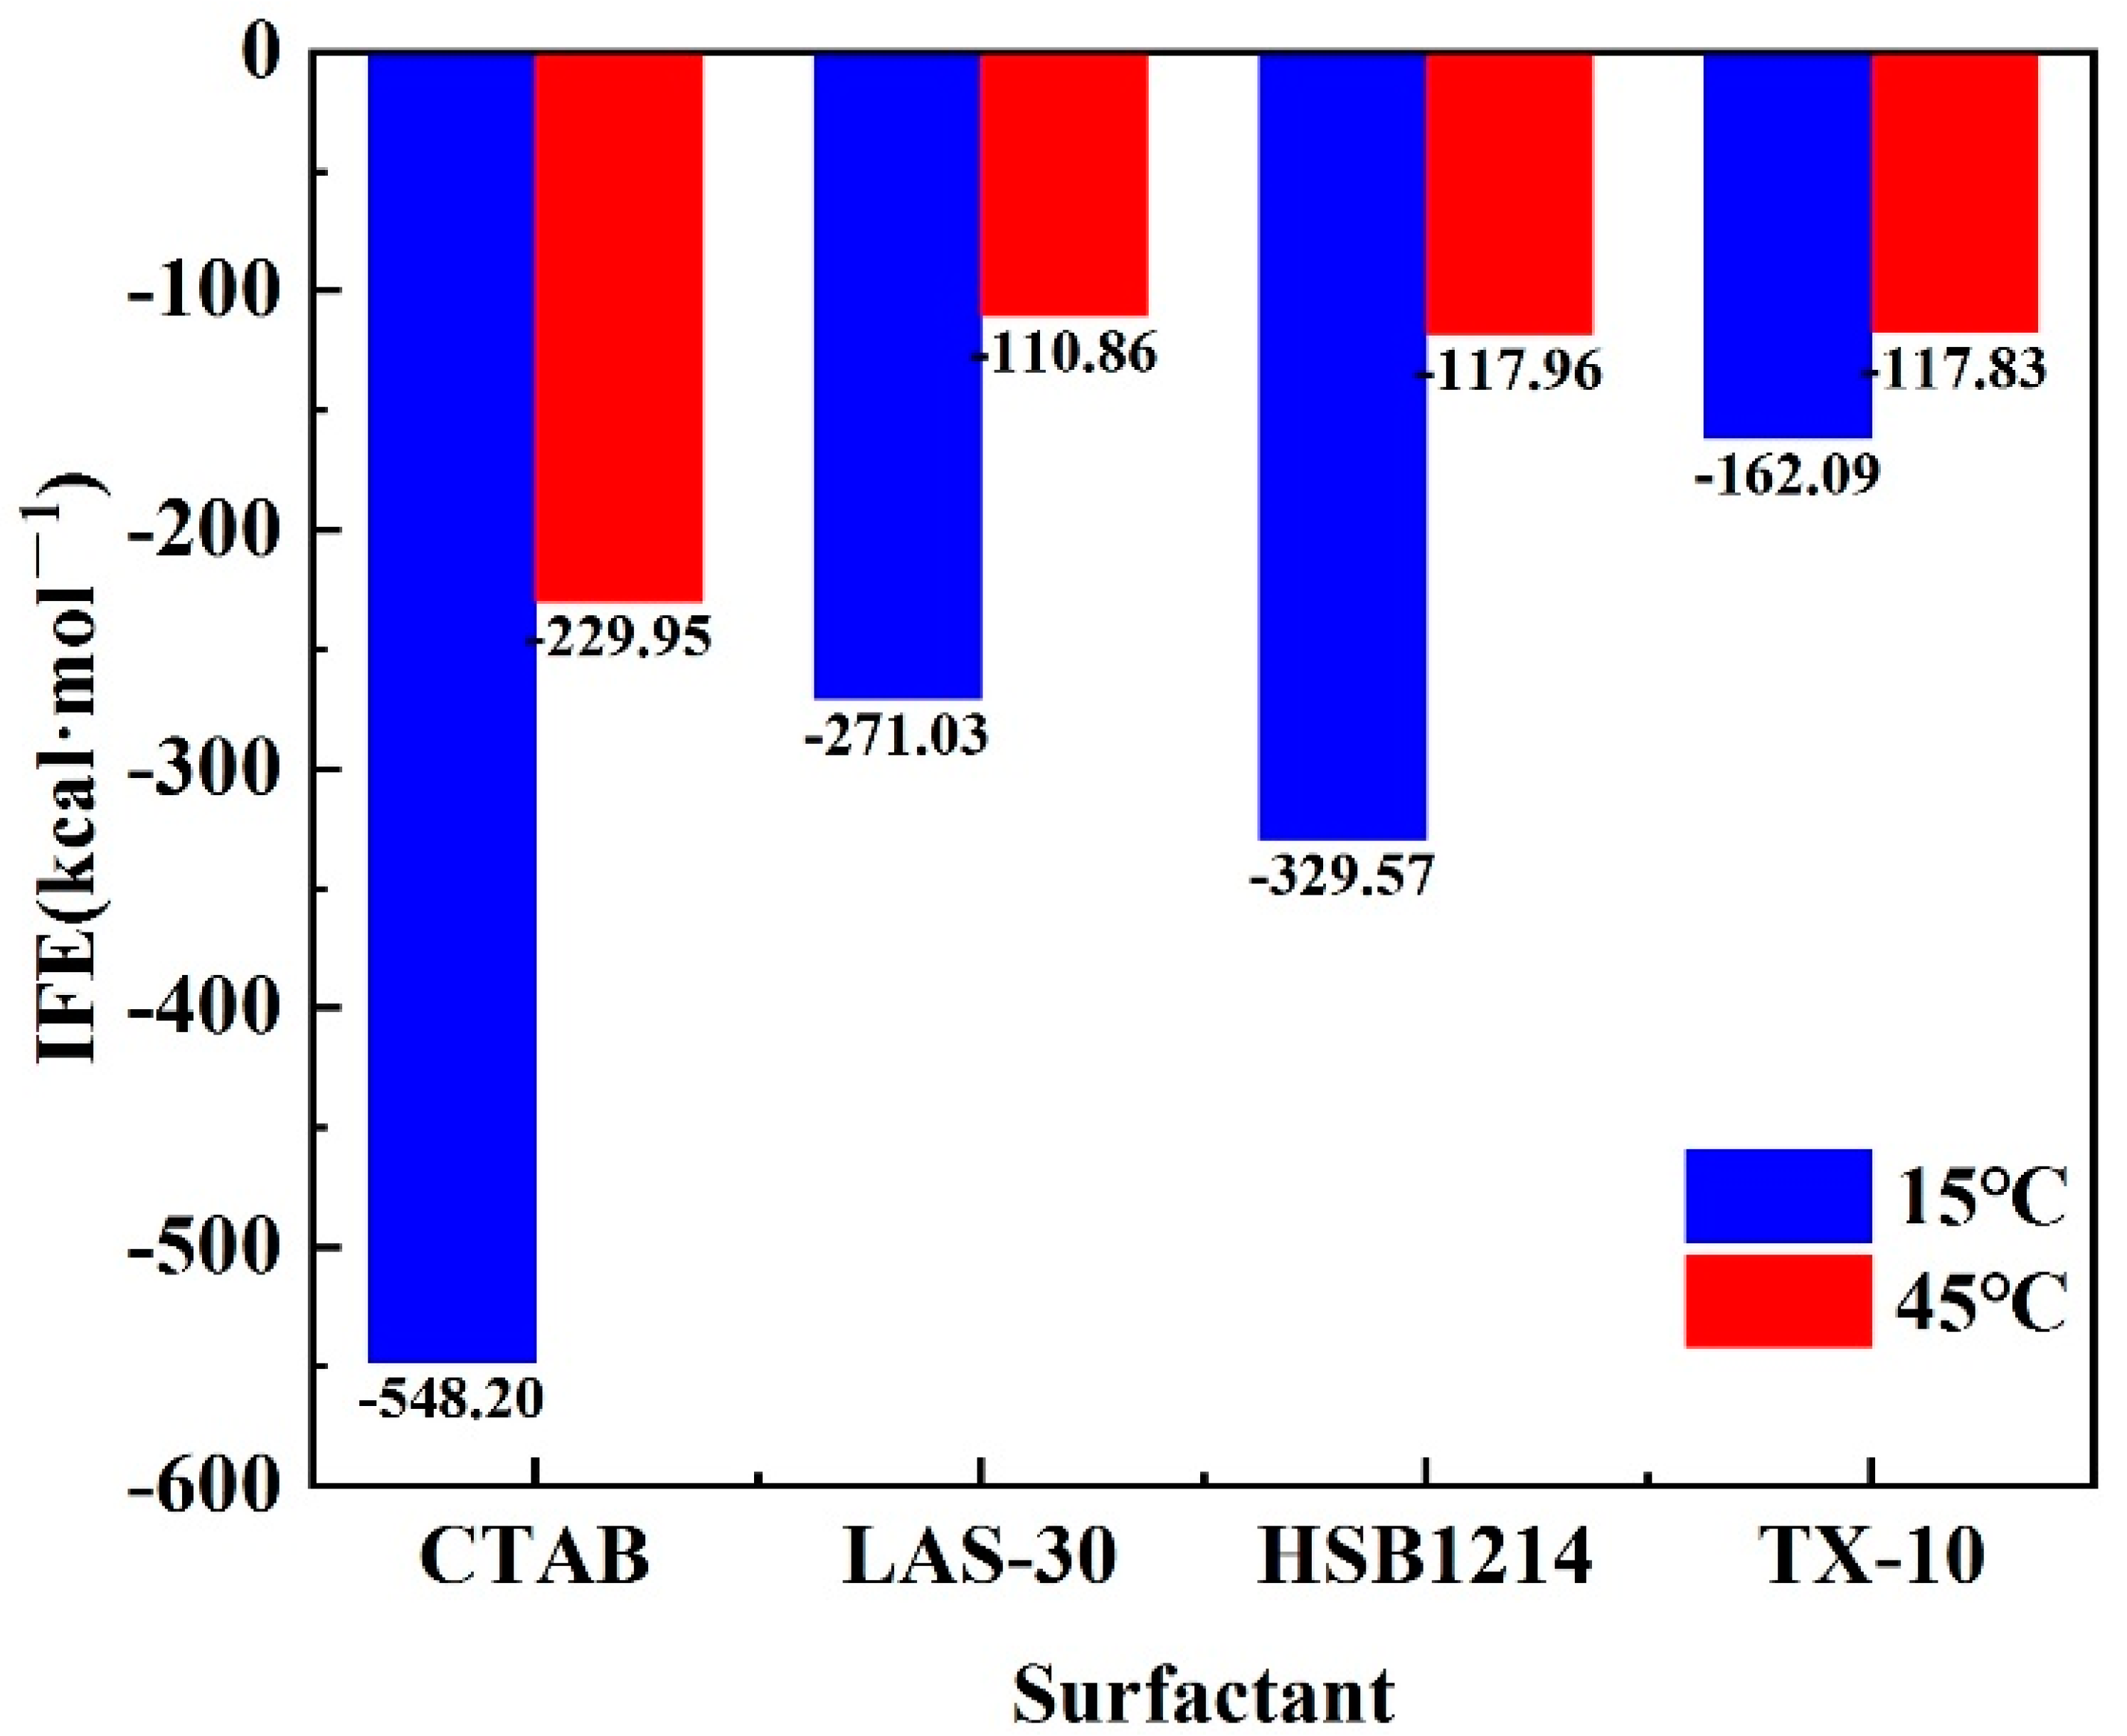
3.4. Analysis of Interface Formation Energy Characteristics

The lower the IFE, the smaller the interfacial tension, the higher the interfacial stability, the more stable the foam wall, and the higher the foam stability. The interface models were constructed using MS software, and the Etotal, Ewater, and Esurfactant values of the four surfactants were calculated for 300 ps (Figure 9) after the equilibration of the foam system at different temperatures, as shown in Table 3.
Substituting the data in Table 3 into Formula (1) to calculate the interface energy, the result is shown in Figure 10.
I F E = E t o t a l n E s u r f a c t a n t + E w a t e r n
where Etotal is the overall energy after system equilibrium; Ewater is the energy at the water–gas interface; Esurfactant is the energy of a single surfactant molecule; and n is the number of surfactant molecules.
By calculating the IFE of the foam system at 300 ps after reaching equilibrium, it is found that the IFE of four surfactants, CTAB, LAS-30, HSB1214, and TX-10, is less than 45 °C at 15 °C. When the temperature was dropped from 45 °C to 15 °C, HSB1214 was the most affected by temperature, with an IFE increase of −64.21%, and TX-10 was the least affected by temperature, with an IFE increase of −44.26%. This increase in IFE results in increased free energy in the system, decreased interfacial tension, and a changed foam interface energy state. Elevated system energy induces the generation of foam and interface enlargement, surfactant internal energy increase, and the acceleration of the rate of motion. Surfactant macromolecules are loosely arranged at the foam interface, which makes it easy to form water molecule transport channels, which results in an accelerated liquid film thinning rate and accelerated destabilization of the foam wall interface system. There is a tendency for the free energy of the system to decrease under equilibrium conditions. In equilibrium conditions, the interfacial tension is equal to interfacial free energy; however, as interfacial free energy increases, interfacial tension decreases, which causes the foam interface to shrink faster and disturb the stability of the interface. As temperature increases, the energy state of the foam interfaces shifts from low to high energy, which necessitates more energy to generate a unit foam wall interface. Furthermore, with the same energy introduced, the same volume of foam is generated, and the size of the foam is larger. The results show that the temperature and IFE are positively correlated, and the higher the temperature, the larger the IFE and the less stable the foam wall interface.

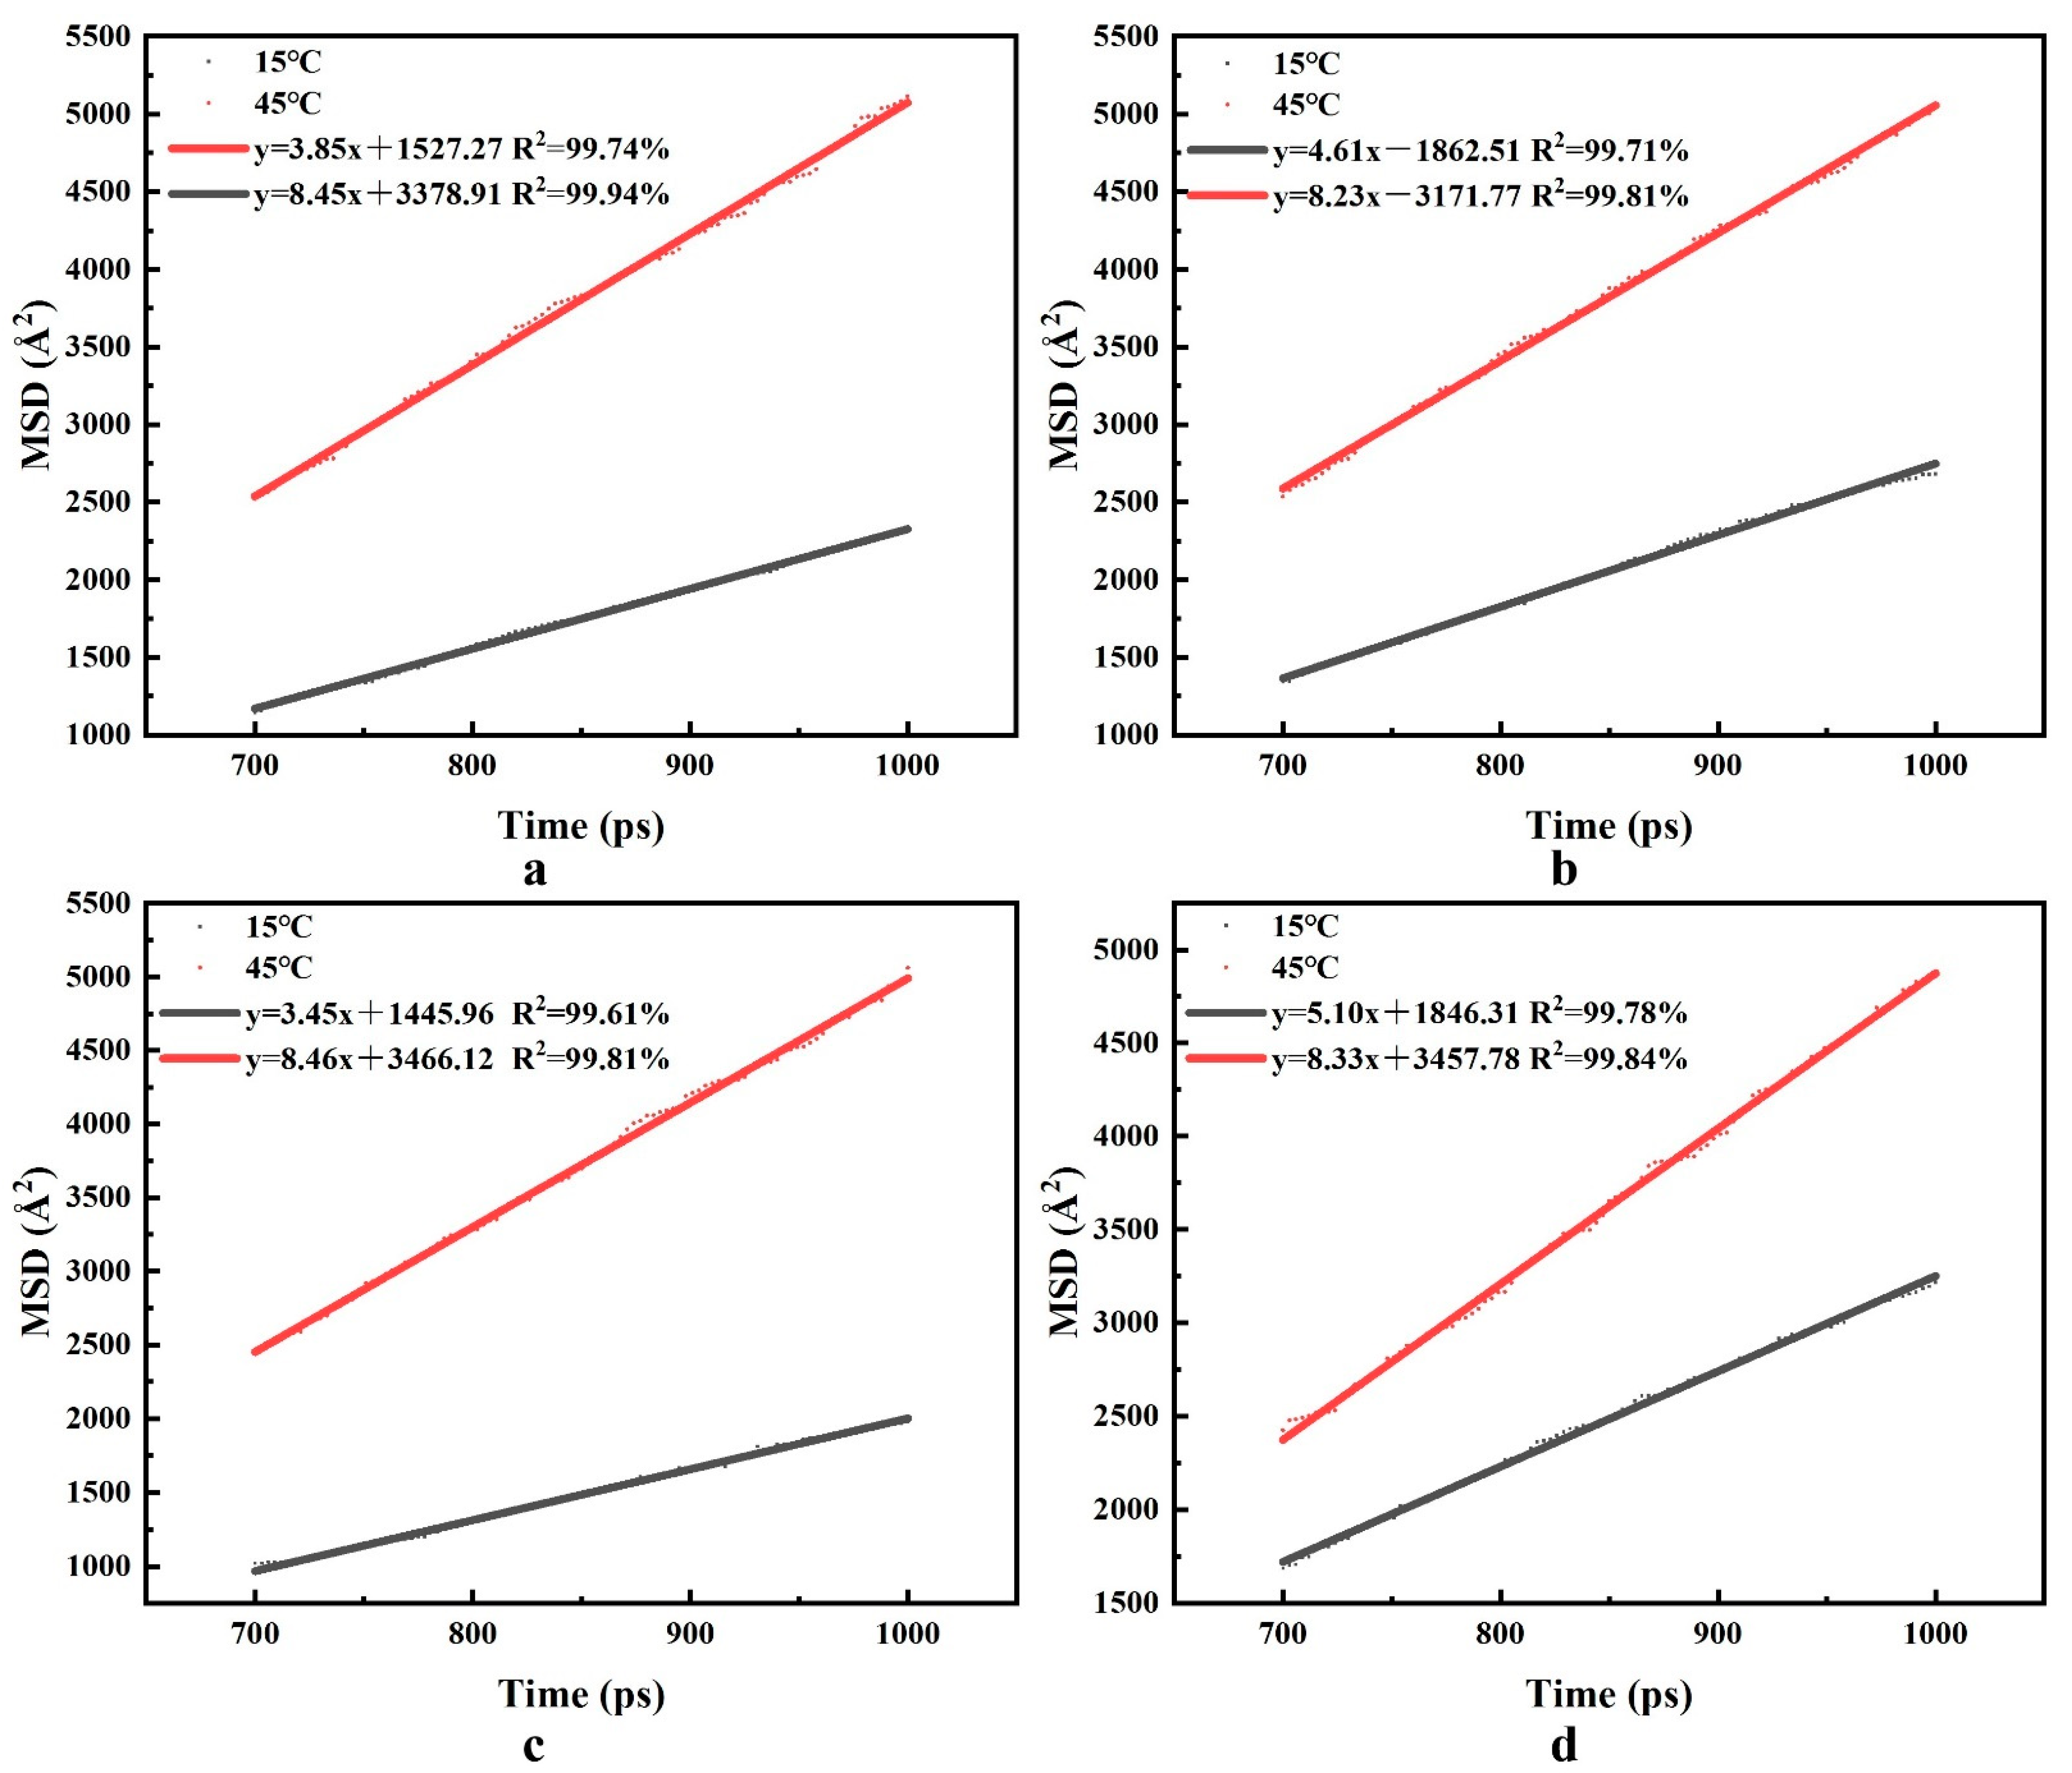
3.5. Analysis of Diffusion Characteristics of Water Molecules

The self-diffusion coefficient of water is a physical property that reflects the diffusion and transference of water molecules in the foam-wall interface system. There is a corresponding relationship between the root mean square displacement (MSD) and water molecules’ self-diffusion coefficient (Dwater). The trajectory information MSD of water molecules is recorded every 1 ps, and linear fitting is performed. According to the fitted results, the diffusion factors α of four surfactants at different temperatures are obtained. The results are shown in Figure 11.
Formula (2) is substituted into Formula (3) to calculate Dwater, and the result is shown in Figure 12. The calculation equation of the diffusion factor of water molecules is
α = M S D t
The self-diffusion coefficient calculation equation of water molecules is
D w a t e r = α 6
where Dwater is the self-diffusion coefficient of water molecules, MSD is the root means square displacement, and t is the time.
As seen from Figure 12, the Dwater of all four surfactants in the foam systems of CTAB, LAS-30, HSB1214, and TX-10 was greater than 15 °C at 45 °C. When the temperature was increased from 15 °C to 45 °C, HSB1214 was the most affected by temperature, with a 1.43-fold increase in Dwater, and TX-10 was the least affected by temperature, with only a 0.64-fold increase in Dwater. A temperature-increase-induced water molecule self-diffusion increase results in an increase in the diffusion migration of water molecules and a weakening of intermolecular forces. The increase in the system’s internal energy makes the water molecules move faster at irregular rates, and the molecular spacing increases. As molecular spacing increases, the attraction and binding ability of the liquid film interface to water molecules becomes weaker, and the hydrogen bonds between water molecules are more easily broken, which results in more conversion of bound water to free water in the liquid film interface, an increase in the portion of free water, and a decrease in the water holding capacity of foam film. Free water molecules and CO2 are more likely to migrate and diffuse to the periphery through the transport channels formed between surfactant macromolecules, which results in accelerated foam aggregation and rapid rupture under the action of gravity and reduced foam stability. The results show that there is a positive correlation between temperature and Dwater. The higher the temperature, the bigger the Dwater and the worse the foam stability.

3.6. Cracking Pressure Results and Analysis

The results showing a comparison between the MCPs of the four surfactant solutions with concentrations of 0.35% at 15 °C and 45 °C are shown in Figure 13.
As can be seen in Figure 13, increases in temperature lead to decreases in MCP and a consequent decrease in the ability of the surfactant foam to create cracks. The increase of test temperatures from 15 to 45 °C for CTAB, LAS-30, HSB1214, and TX-10 led to foam volumes increasing by 30.26%, 41.53%, 40.60%, and 44.78%, respectively, as shown in Figure 6; and half-life decreasing by 34.91%, 16.95%, 48.45%, and 11.81%, respectively, as shown in Figure 7. Under the same stress conditions, foam stability (characterized by half-life) decreases as temperature increases, and MCP increases as foam volume increases. The increase in MCP leads to a decrease in the ability of surfactant foam to create fractures, a simple fracture network, and a deceleration of the CO2-CBM sequestration process, which in turn will reduce the efficiency of CBM extraction. The experimental results again verify the necessity of foam stability research, the higher the foam stability, the smaller the MCP, and the higher the CBM extraction efficiency.

4. Conclusions

In this study, the effects of temperature on the foam stability of CTAB, LAS-30, HSB1214, and TX-10 were studied via physical experimentation and molecular simulation, and the following conclusions were obtained:
  • Temperature is negatively correlated with half-life and liquid viscosity. With the increase in temperature, the foam half-life of CTAB, LAS-30, HSB1214, and TX-10 decreased by 74 s, 30 s, 78 s, and 17 s, respectively, and the liquid viscosity of CTAB, LAS-30, HSB1214, and TX-10, decreased by 6.45 mPa·s, 7.24 mPa·s, 5.39 mPa·s, and 5.59 mPa·s, respectively. With the increase in temperature, the film’s liquid separation speed becomes faster, the water-holding capacity becomes weaker, the foam bursts faster, and the half-life is shortened. At the same time, viscosity decreases, elasticity decreases, strength decreases, and foam stability decreases.
  • There is a positive correlation between temperature and interface energy. With the temperature rise, the IFE of CTAB, LAS-30, HSB1214, and TX-10 increases by 318.25 kcal·mol−1, 160.17 kcal·mol−1, 211.61 kcal·mol−1, and 44.26 kcal·mol−1, respectively. With the increase in temperature, the interface state changes from low to high energy, IFE increases, liquid film-forming ability weakens, interface thinning rate increases, and the foam system accelerates instability.
  • There is a positive correlation between temperature and the self-diffusion coefficient of water molecules. With the temperature increase, Dwater of CTAB, LAS-30, HSB1214, and TX-10 increased by 0.77 × 10⁻⁵ cm2·s−1, 0.60 × 10⁻⁵ cm2·s−1, 0.83 × 10⁻⁵ cm2·s−1, and 0.54 × 10⁻⁵ cm2·s−1, respectively. With the increase in temperature, the thermal movement rate of water molecules becomes faster, hydrogen bonds break faster, the attraction and binding capacity of the liquid membrane interface to bound water molecules become weaker, the water holding capacity of the foam liquid membrane decreases, and the foam system becomes unstable.
  • There is a positive correlation between temperature and MCP. With a temperature increase from 15 to 45 °C, MCP of CTAB, LAS-30, HSB1214, and TX-10 increases by 0.89 Mpa, 2.33 Mpa, 1.88 Mpa, and 0.85 Mpa, respectively. Under same stress conditions, temperature increase results in a reduction of foam stability, while enhancement of MCP weakens the seam-making ability of surfactant foam, which in turn affects the efficiency CO2 foam fracturing construction.
  • In future field applications, considerations should be made towards the effects of ground temperature on fracturing operations and attention should also be paid towards lowering the pipe temperature which is especially the case for high-temperature CBM reservoirs. For low-temperature CBM reservoirs, the coal seam should be heated to ensure optimal fracturing conditions, maximize the sequestration of CH4 by CO2, and optimize the production of CBM. Furthermore, of the four surfactants, TX-10(nonionic) has the best resistance to temperature, therefore it should be selected for use (and possibly in unision with other Ionic surfactants) in CBM fracturing operations with large temperature ranges as it helps operations in terms of resistance to temperature effects and improves fracturing efficacy.

Author Contributions

Conceptualization, X.N. and J.W.; methodology, S.L.; software, X.N.; validation, X.N. and Y.Z.; formal analysis, X.N.; investigation, Z.D.; resources, K.D.; data curation, X.N.; writing—original draft preparation, X.N.; writing—review and editing, X.N. and J.W.; visualization, X.N. and J.W.; supervision, Y.Z.; project administration, K.D.; funding acquisition, Z.D. All authors have read and agreed to the published version of the manuscript.

Funding

This research was supported by the National Natural Science Foundation of China (grant number 52074188).

Data Availability Statement

All data included in this study are available upon request by contacting the corresponding author.

Conflicts of Interest

The authors declare no conflict of interest.

References

  1. Mallick, N.; Prabu, V. Energy analysis on Coalbed Methane (CBM) coupled power systems. J. CO2 Util. 2017, 19, 16–27. [Google Scholar] [CrossRef]
  2. Dong, P.; Puerto, M.; Jian, G.; Ma, K.; Mateen, K.; Ren, G. Exploring Low-IFT Foam EOR in Fractured Carbonates: Success and Particular Challenges of Sub-10-md Limestone. SPE J. 2020, 25, 867–882. [Google Scholar] [CrossRef]
  3. Alexander, S.; Barron, A.R.; Denkov, N.; Grassia, P.; Kiani, S.; Sagisaka, M. Foam generation and stability: Role of the surfactant structure and asphaltene aggregates. Ind. Eng. Chem. Res. 2021, 61, 372–381. [Google Scholar] [CrossRef]
  4. Dong, Z.; Liu, S.; Nie, X.; Zhang, Y.; Dong, K.; Wang, J. Experimental and Molecular Simulation Research on the Effect of Metal Ions on the Stability of SDS Foam. Energy Fuels 2022, 36, 521–526. [Google Scholar] [CrossRef]
  5. Abdelaal, A.; Aljawad, M.S.; Alyousef, Z.; Almajid, M.M.A. review of foam-based fracturing fluids applications: From lab studies to field implementations. J. Nat. Gas Sci. Eng. 2021, 95, 104236. [Google Scholar] [CrossRef]
  6. Ju, S.; Huang, Q.; Wang, G.; Li, J.; Wang, E.; Qin, C.; Qiao, J. Rheological and morphological characteristics of foam fluid using hydroxypropyl guar and surfactant. J. Pet. Sci. Eng. 2022, 211, 110124. [Google Scholar] [CrossRef]
  7. Ahmed, S.; Elraies, K.A.; Hashmet, M.R.; Alnarabiji, M.S. Empirical modeling of the viscosity of supercritical carbon dioxide foam fracturing fluid under different downhole conditions. Energies 2018, 11, 782. [Google Scholar] [CrossRef] [Green Version]
  8. Feng, Y.; Zhaolong, G.; Jinlong, Z.; Zhiyu, T. Viscoelastic surfactant fracturing fluid for underground hydraulic fracturing in soft coal seams. J. Pet. Sci. Eng. 2018, 169, 646–653. [Google Scholar] [CrossRef]
  9. Chandra, M.S.; Horvath-Szabo, G.; Bulova, M. Influence of temperature, concentration, and gas/liquid ratios on the gas-mobility reduction of foams in porous media. J. Dispers. Sci. Technol. 2012, 33, 1560–1568. [Google Scholar] [CrossRef]
  10. Ivanova, A.A.; Cheremisin, A.N.; Barifcani, A.; Iglauer, S.; Phan, C. Molecular insights in the temperature effect on adsorption of cationic surfactants at liquid/liquid interfaces. J. Mol. Liq. 2020, 299, 112104. [Google Scholar] [CrossRef]
  11. Wang, S.; Xu, Y.; Yan, M.; Zhang, L.; Liu, Z. The effect of surfactants on carbon xerogel structure and CO2 capture. J. Non-Cryst. Solids 2018, 499, 101–106. [Google Scholar] [CrossRef]
  12. Wang, X.C.; Zhang, L.; Gong, Q.T.; Zhang, L.; Luo, L.; Li, Z.Q.; Yu, J.Y. Study on foaming properties and dynamic surface tension of sodium branched-alkyl benzene sulfonates. J. Dispers. Sci. Technol. 2009, 30, 137–143. [Google Scholar] [CrossRef]
  13. Smith, G.A.; Huggett, A.; Jones, C.; Ortego, G. Surface activity and performance properties of gemini salts of linear alkylbenzene sulfonate in aqueous solution. J. Surfactants Deterg. 2012, 24, 563–574. [Google Scholar] [CrossRef]
  14. Ranjani, I.S.; Ramamurthy, K. Relative assessment of density and stability of foam produced with four synthetic surfactants. Mater. Struct. 2010, 43, 1317–1325. [Google Scholar] [CrossRef]
  15. Wang, H.; Guo, W.; Zheng, C.; Wang, D.; Zhan, H. Effect of temperature on foaming ability and foam stability of typical surfactants used for foaming agent. J. Surfactants Deterg. 2017, 20, 615–622. [Google Scholar] [CrossRef]
  16. Cong, Z.; Li, Y.; Pan, Y.; Liu, B.; Shi, Y.; Wei, J.; Li, W. Study on CO2 foam fracturing model and fracture propagation simulation. Energy 2022, 238, 121778. [Google Scholar] [CrossRef]
  17. Xu, Z.; Wu, K.; Song, X.; Li, G.; Zhu, Z.; Sun, B. A unified model to predict flowing pressure and temperature distributions in horizontal wellbores for different energized fracturing fluids. SPE J. 2019, 24, 834–856. [Google Scholar] [CrossRef]
  18. Wang, J.; Sun, B.; Chen, W.; Xu, J.; Wang, Z. Calculation model of unsteady temperature–pressure fields in wellbores and fractures of supercritical CO2 fracturing. Fuel 2019, 253, 1168–1183. [Google Scholar] [CrossRef]
  19. Wang, J.; Liu, F.; Zhao, W.; Cai, H.; Zhao, J.; Liu, Y. Study on coal spontaneous combustion at low-medium temperature in the same coal seam with different buried depths and protolith temperatures. Int. J. Coal Prep. Util. 2021, 42, 3451–3463. [Google Scholar] [CrossRef]
  20. Fuguet, E.; Ràfols, C.; Rosés, M.; Bosch, E. Critical micelle concentration of surfactants in aqueous buffered and unbuffered systems. Anal. Chim. Acta 2005, 548, 95–100. [Google Scholar] [CrossRef]
  21. Wasan, D.T.; Gupta, L.; Vora, M.K. Interfacial shear viscosity at fluid-fluid interfaces. AIChE J. 1971, 17, 1287–1295. [Google Scholar] [CrossRef]
  22. Wereszczynski, J.; McCammon, J.A. Statistical mechanics and molecular dynamics in evaluating thermodynamic properties of biomolecular recognition. Q. Rev. Biophys. 2012, 45, 1–25. [Google Scholar] [CrossRef] [PubMed]
  23. Crooks, R.; Cooper-White, J.; Boger, D.V. The role of dynamic surface tension and elasticity on the dynamics of drop impact. Chem. Eng. Sci. 2001, 56, 5575–5592. [Google Scholar] [CrossRef]
  24. Xu, J.; Zhang, Y.; Chen, H.; Wang, P.; Xie, Z.; Yao, Y.; Zhang, J. Effect of surfactant headgroups on the oil/water interface: An interfacial tension measurement and simulation study. J. Mol. Struct. 2003, 1052, 50–56. [Google Scholar] [CrossRef]
  25. Varshney, V.; Patnaik, S.S.; Roy, A.K.; Farmer, B.L. A molecular dynamics study of epoxy-based networks: Cross-linking procedure and prediction of molecular and material properties. Macromolecules 2008, 41, 6837–6842. [Google Scholar] [CrossRef]
  26. Jalali-Heravi, M.; Konouz, E. Prediction of critical micelle concentration of some anionic surfactants using multiple regression techniques: A quantitative structure-activity relationship study. J. Surfactants Deterg. 2000, 3, 47–52. [Google Scholar] [CrossRef]
  27. Gao, S.; Kang, Z.; Yuan, R.; Liu, N.; Zhu, P.; Wang, B. Molecular dynamics study of nonylphenol-substituted dodecyl sulfonate at air/water interface: Role of steric effect of surfactant headgroups. J. Mol. Struct. 2019, 1192, 35–41. [Google Scholar] [CrossRef]
  28. Grebenkov, D.S. Probability distribution of the time-averaged mean-square displacement of a Gaussian process. Phys. Rev. E 2011, 84, 031124. [Google Scholar] [CrossRef] [PubMed] [Green Version]
  29. Symeonidis, V.; Karniadakis, G.E.; Caswell, B. A Seamless Approach to Multiscale Complex Fluid Simulation. Comput. Sci. Eng. 2005, 7, 39–46. [Google Scholar] [CrossRef]
  30. Chen, L.J.; Lin, S.Y.; Huang, C.C.; Chen, E.M. Temperature dependence of critical micelle concentration of polyoxyethylenated non-ionic surfactants. Colloids Surf. A Physicochem. Eng. Asp. 1998, 135, 175–181. [Google Scholar] [CrossRef]
  31. Tennouga, L.; Mansri, A.; Medjahed, K.; Chetouani, A.; Warad, I. The micelle formation of cationic and anionic surfactants in aqueous medium: Determination of CMC and thermodynamic parameters at different temperatures. J. Mater. Environ. Sci. 2015, 6, 2711–2716. [Google Scholar]
Figure 1. Experimental Device. 1, CO2 Gas Cylinder; 2, Centralized Console; 3, Infrared Emitter; 4, Infrared Receiver; 5, Thermal Insulation Material of Thermostat Chamber; 6, Thermostat; 7, CO2 Foam Meter Tube; 8, Foaming Screen.
Processes 11 00801 g001
Figure 2. Viscosity test device diagram. 1-DNJ-5S; 2, Level Instrument; 3, Lifting Knob; 4, External Test Cylinder; 5, Fixed Sleeve; 6, Fixed Screw; 7, Water Bath Pot.
Processes 11 00801 g002
Figure 3. Molecular Structure Model. C: Gray, H: White, O: Red, N: blue, Br-: Brown, S: Yellow, Na+: Purple.
Processes 11 00801 g003
Figure 4. Initial Structure of Surfactant Interface Model. (a) CTAB, (b) LAS-30, (c) HSB1214, (d) TX-10.
Processes 11 00801 g004
Figure 5. Experimental setup diagram. 1, Pressure gauge; 2, Heat insulation pressing plate; 3, Thermal insulation system; 4, Preheating system; 5, Gas pressurization system; 6, Water servo system; 7, True three-axis servo loading system.
Processes 11 00801 g005
Figure 6. Four surfactant foam volumes. (a) CTAB, (b) LAS-30, (c) HSB1214, (d) TX-10.
Processes 11 00801 g006
Figure 7. Foam half-life of four surfactants.
Processes 11 00801 g007
Figure 8. Viscosity of four surfactant solutions.
Processes 11 00801 g008
Figure 9. System interface after 300 ps balance.
Processes 11 00801 g009
Figure 10. IFE of four surfactant foams.
Processes 11 00801 g010
Figure 11. MSD for four surfactants. (a) CTAB, (b) LAS-30, (c) HSB1214, (d) TX-10.
Processes 11 00801 g011
Figure 12. Dwater of four surfactant foams.
Processes 11 00801 g012
Figure 13. Cracking pressure for four gas–liquid two-phase media.
Processes 11 00801 g013
Table 1. Basic information of surfactants.
SurfactantChemical NameIon Type
CTABCetyl Trimethyl Ammonium BromideCationic
LAS-30Sodium Lauryl Benzene SulfonateAnionic
HSB1214Alkyl C12–14Hydroxypropyl SulfobetaineAmphoteric
TX-10Polyoxy Ethylene Nonyl Phenyl EtherNonionic
Table 2. Basic properties of surfactants.
SurfactantChemical FormulaBasic PropertiesManufacturer InformationPurities
CTABC19H42NBrWhite to Light Yellow, Solid or Gelatinous Liquid. Easily Soluble in Water, Ethanol, Slightly Soluble in Acetone, Almost Insoluble in Ether and Benzene.China Shanghai Aladdin Biochemical Technology Co., Ltd.99.00%
LAS-30C18H29O3SNaEasily Soluble in Water, Non-toxic, Excellent Foaming, Good Detergency, Emulsification, and Certain Permeability.Candace Chemical (Hubei, China) Co., LTD60.00%
HSB1214C18H12O4NS
C20H12O4NS
Good Emulsification, Dispersion, and Antistatic Properties, with Sterilization, Mold Inhibition, and Viscoelasticity, etc.China Shandong Urso Chemical Technology Co.45.00%
TX-10C33H60O10Excellent Penetration, Emulsification, Dispersion, and Washing Properties.99.00%
Table 3. Energy of each part of the foam system.
SurfactantTemperature
(°C)
Etotal
(kcal·mol−1)
Ewater
(kcal·mol−1)
Esurfactant
(kcal·mol−1)
CTAB15−7643.91−5543.63128.14
45−4431.82−4388.55221.29
LAS-3015−12,540.53−6345.55−967.97
45−10,620.41−5824.65−848.29
HSB121415−9769.82−6357.82−352.83
45−7788.23−5526.05−334.48
TX-1015−7289.55−7628.31229.84
45−4972.55−6792.55481.83
Disclaimer/Publisher’s Note: The statements, opinions and data contained in all publications are solely those of the individual author(s) and contributor(s) and not of MDPI and/or the editor(s). MDPI and/or the editor(s) disclaim responsibility for any injury to people or property resulting from any ideas, methods, instructions or products referred to in the content.

