Article

Life Cycle Assessment and Cumulative Energy Demand Analyses of a Photovoltaic/Thermal System with MWCNT/Water and GNP/Water Nanofluids

by
Gülşah Karaca Dolgun
1,
Meltem Koşan
2,
Muhammet Kayfeci
3,
Aleksandar G. Georgiev
4,* and
Ali Keçebaş
1
1
Department of Energy Systems Engineering, Technology Faculty, Muğla Sıtkı Koçman University, 48000 Muğla, Turkey
2
Department of Energy Systems Engineering, Elbistan Engineering Faculty, Kahramanmaras Istiklal University, 46100 Kahramanmaras, Turkey
3
Department of Energy Systems Engineering, Technology Faculty, Karabük University, 78100 Karabük, Turkey
4
Department of General engineering, University of Telecommunications and Posts, 1 Akad. Stefan Mladenov str., 1700 Sofia, Bulgaria
*
Author to whom correspondence should be addressed.
Processes 2023, 11(3), 832; https://doi.org/10.3390/pr11030832
Submission received: 3 February 2023 / Revised: 2 March 2023 / Accepted: 7 March 2023 / Published: 10 March 2023
(This article belongs to the Special Issue Advances in Renewable Energy Systems)

Abstract

:
The global climate crisis has led society toward cleaner energy sources. Another reason is the limited reserves of fossil energy resources. Efforts to increase the efficiency of photovoltaic modules (PVs) have gained momentum. The high temperature is the biggest factor causing a decrease in the efficiency of PVs. In this study, a commercial PV was cooled with distilled water, a multiwalled carbon nanotubes (MWCNT)/water mixture, and a graphene nanoplatelets (GNP)/water mixture. The environmental impact of electricity, total energetic efficiency, energy payback time, energy return on investment, and embodied energy of the PV/thermal (PV/T) system were compared using life cycle assessment and cumulative energy demand. The electrical efficiency of the PV/T changed between 13.5% and 14.4%. The total efficiency of PV/T changed between 39.5% and 45.7%. The energy returns on investment were 1.76, 1.80, and 1.85 for PV/T-distilled water, the PV/T-MWCNT/water mixture, and the PV/T-GNP/water mixture, respectively. Moreover, the embodied energy evaluation values were 3975.88 MJ for PV/T-distilled water, 4081.06 MJ for the PV/T-MWCNT/water mixture, and 4077.86 MJ for the PV/T-GNP/water mixture. The main objective of this research was to study the energy and environmental performances of PVs cooled with different nanofluids and draw general conclusions about the applicability of these systems.

1. Introduction

In recent years, the use of alternative energy sources has become more important than using fossil-based fuels due to environmental problems, such as climate change and global warming. With the advancement of technology, electricity consumption is also increasing rapidly. Solar photovoltaic (PV) technologies are considered the cleanest alternative source for electricity generation because their greenhouse gas emissions into the atmosphere are lower than those of other sources [1,2]. However, a certain amount of energy is consumed in the production, installation, processing, and maintenance stages of PV technologies. Life cycle assessment (LCA) is considered an index by which the environmental impacts of PVs can be calculated throughout the entire life cycle, starting from the acquisition of raw materials to processing, production, use, end-of-life, and disposal. The environmental sustainability of PV and its systems can be determined using LCA methodology [3,4]. LCA study is applied in terms of the environment and energy profiles. While different LCA methodologies are used for environmental profiling, energy profiling is performed using the cumulative energy demand (CED). Likewise, embedded energy evaluation is essential to understanding this energy profile assessment and is determined by the CED methodology [5].
In the literature, the emission reduction and environmental impact have been examined for the environmental profiles of PVs, concentrated PVs, PV/thermal (PV/T) systems, and conventional solar systems. Carnevale et al. [6] compared the environmental profile of PV modules with solar hot water systems using LCA analysis. The energy payback times of silicon-based PV modules, thin-film PV modules, and hot water systems are 2.6, 1.0, and 1.2 years, respectively. Ehtiwesh et al. [7] performed an exergetic LCA analysis of a concentrated solar power plant (50 MWe capacity) from cradle to grave using with the CED and Eco-indicator 99 methods. The percentages of the Human Health, Resource, and Ecosystem Quality damage categories were 69% (14.4 MPoints), 24% (5 MPoints), and 7% (1.4 MPoints), respectively. The highest impact between materials was seen in steel, at 9.77 MPoints (46.9%), followed by molten salt at 5.19 MPoints (24.9%) and synthetic oil at 4.27 MPoints (21%). Santoyo-Castelazo et al. [8] carried out an LCA study of a PV system with an installed power of 3 kWp connected to the grid. The carbon footprint was calculated to be 47.156 g CO2.eq/kWh and the estimated normalized greenhouse gas emissions were between 20 and 90 g CO2.eq/kWh. It was observed that most of the environmental loads arose from the manufacture of the materials required for the PV module. Krebs-Moberg et al. [9] analyzed the effects on the lifetimes of multi-crystalline silicon, organic thin-film, and perovskite thin-film PV modules. They reported that the manufacture and use of multi-crystalline silicon PV modules had the greatest impacts across all hazard categories. The recycling process reduced the environmental impacts of all module types. Li et al. [10] designed and tested a semi-transparent PV window. An LCA analysis was performed by investigating the energy and environmental benefits of the system. The energy payback period and greenhouse gas payback period of this system were 13.8 years and 10.4 years, respectively. Rao et al. [11] investigated multi-crystalline PV/T systems installed at open-field and rooftop locations. The energy payback time was between 6.53 and 11.38 years, with a positive energy yield. For a 2 m2 single-crystalline PV/T system at 1200 W/m2, the energy payback times were 6.93 and 7.59 years for the rooftop and open field locations, respectively. The embodied energy values for a single-crystalline PV/T system were 3178 kWh/m2 on a rooftop and 3478 kWh/m2 in an open field for a 25-year lifetime period with a 5-year battery-replacement cycle. Li et al. [12] used a multi-index life cycle assessment (LCA) technique that included economic, energy, and environmental variables for bifacial photovoltaic (BPV) modules installed on buildings. Compared with the mono-facial PV modules, the BPV module increased the power generation performance by 10.7–12.7%. The EPBT of the BPV solar house and inclined roof decreased by 5.7% and 7.4%, respectively, and the GPBT of the BPV solar house and inclined roof decreased (2.3 and 1.7 years) according to the mono-facial PV module. BPV modules produced more power and had a higher return on investment (ROI) of more than 10.7%, despite costing 5% more than a mono-facial PV module. Goel et al. [13] installed a 3.4 kW rooftop stand-alone photovoltaic system (SAPV) in India and performed life cycle cost and energy analysis of the system by the present value method and embodied energy basis, respectively. The internal rate of return (IRR), life cycle cost of energy (LCOE), benefit–cost ratio (BCR), and energy payback time (EPBT) of the SAPV were 2.02, INR 5.40/kWh, 0.57, and 4.61 years, respectively. The IRR, LCOE, BCR, and EPBT of the grid-connected PV system were 13.42%, INR 3.17 per kWh, 1.11, and 3.78 years, respectively. Jurcevic et al. [14] investigated the performance of a photovoltaic-thermal (PVT) collector. Water was used to cool the PV, and hot water was stored in a phase-change material (PCM) container, where pork fat was used as the PCM. In August, cooling increased the PV’s electrical efficiency from 11.7–12.0% to 12.0–12.4%. The increase in the PVT’s electrical efficiency was negligible. The total energy generated by the PVT collector would have a levelized cost of between EUR 0.056 and 0.083 per kWh.
The embodied energy of the solar thermal collectors and PVs and/or PV/T systems for energy profiling has been investigated in the literature. Lamnatou et al. [15] performed the LCA analysis of building-integrated solar thermal collectors according to the embodied energy and embodied carbon methodologies. By recycling, the embodied energy values of the collectors were reduced to around 0.4–0.5 GJ/m2 from 3 GJ/m2 (without recycling). With recycling, the embodied carbon values were reduced to around 0.02–0.03 t CO2.eq/m2 from 0.16 t CO2.eq/m2. It was seen that recycling led to remarkable reductions in all parameters. Hassani et al. [16] modeled a PV/T system, theoretically calculated the life cycle exergy of the nanofluid-based system, and compared it with standard PV and PV/T systems. The embodied emissions of the PV/T system were between 691 and 896 kg CO2.eq/m2, and the amount of CO2 emissions prevented was 448 kg CO2.eq/m2/year in a nanofluid-based PV/T system. The exergy payback time of the PV/T system changed between 2.0 and 2.58 years. Ren et al. [17] assessed the dynamic life cycle cost and environmental impact of residential PV systems in a real prototype house in Boston. Two systems, such as grid-connected (GC) and standalone (SA) solar PV systems, were compared according to their life cycle cost, LCA, and CED. The LCC savings for the SA were $754.9 in 2018 with 18.5 years of investment payback time when 40 panels and 40 batteries were used, and the LCC savings for the GC were $1739.4 with 16.8 years of investment payback time. The life cycle reductions in the SA and GC were 2.1 TJ and 2.3 TJ of CED, respectively. Bahlawan et al. [18] performed the LCA analysis of energy systems for residential applications. The CEDs of the PV, solar thermal collector, and hot water storage (100 L capacity) were calculated. Their CED values were 1.53 GJ/m2, 4.69 GJ/m2, and 1.27 GJ, respectively. The above studies indicate that, despite the advanced development of PV technology, there has not been much focus on the energy and environmental profiles of PV and PV-related systems. Herrando et al. [19] performed a life cycle assessment (LCA) of a solar combined cooling, heating, and power (S-CCHP) system that provides electricity, domestic hot water, space heating, and cooling. An S-CCHP system, PV system, and grid-based system were compared. The environmental impact of the S-CCHP system was 4.48 kPts and 82.4 tons of CO2.eq, which is equal to half that of the grid-based system, according to the ReCiPe 2016 Endpoint (H/A) and the IPCC GWP 100a methods. The environmental impact of the PV system was 30% lower than that of the grid-based system. Morini et al. [20] investigated the carbon footprint (CF) and embodied energy (EE) of photovoltaic and wind power plants. The CF and EE of the photovoltaic plant (monocrystalline silicon cell) were 16.21 gCO2/kWh and 0.0638 kWh/kWh, respectively.
The electrical performance of PV systems can be improved by using nanofluids with high thermal conductivity for PV module cooling [21]. The nanoparticles dispersed in the base fluid increase the contact surface area and thermal conductivity of the fluid [22]. According to the literature studies, it can be seen that the use of carbon- and metal-based nanoparticles in solar collectors and the cooling of PV modules and/or PV/T systems is common. The effects of cooling on the electrical and thermal efficiencies of PV with various working fluids have been sought. Fayaz et al. [23] numerically and experimentally investigated the performance of a PV/T panel using multiwalled carbon nanotubes (MWCNT)/water nanofluid to increase its overall efficiency. An improvement in the electrical efficiency of 10.72% was observed in the PV/T panel using a 0.75% MWCNT/water mixture with a flow rate of 120 L/h. The thermal efficiency was also calculated to be 79.1%. In another similar study, Abdallah et al. [24] conducted an experiment in a PV/T system using MWCNT/water nanofluid. The best system efficiency was obtained at a 0.075% volume concentration, and a temperature drop of 12 °C was achieved in the PV module. As a result, the total system efficiency was found to be 83.26%. Alous et al. [25] experimentally investigated the effects of using MWCNT/water and graphene nanoplatelets (GNP)/water at a 0.5 wt.% concentration on the performance of a PV/T system. They reported that the overall energy efficiency of PV/T systems increased by 53.4% for distilled water, 57.2% for MWCNT/water, and 63.1% for GNP/water. Sangeetha et al. [26] experimentally tested the effects of three different nanofluids, MWCNT/water, Al2O3/water, and TiO2/water, on the PV/T system. It was found that the MWCNT/water nanofluid exhibited superior thermal conductivity and better physical properties than the Al2O3/water and TiO2/water nanofluids. In the PV/T systems using MWCNT/water, Al2O3/water, and TiO2/water nanofluids, 47%, 33%, and 27% increases in electrical efficiency and 48%, 37%, and 36% decreases in PV temperature, respectively, were obtained. In addition to the positive physical, thermal, and flow properties of nanofluids, negative effects, such as precipitation, surface erosion, clogging in narrow passages, and increased pressure drop, make them important in the design of a PV/T system. Therefore, many studies have been carried out for each nanoparticle and its concentration.
This study aimed to submit a detailed experimental and environmental study of the entire lifetime of an energy system consisting of PV modules, the cooling unit behind the PV module (PV/T), the nanofluid and water storage tanks, and the pump. To the authors’ knowledge, this is the first study to combine experimental work with energy and environmental profiles for LCA and CED methodologies for a PV/T system using nanofluids, such as MWCNT/water and GNP/water. Thus, the gaps in the literature are filled with the following scientific research innovations:
  • A comprehensive LCA analysis from cradle to grave of the PV and PV/T systems was conducted;
  • PV and PV/T experiments were conducted under the same environmental conditions to understand the differences in total energy efficiency;
  • The use of three different working fluids: distilled water, MWCNT/water mixture, and GNP/water mixture;
  • Important indicators, such as the efficiency, energy return factor, energy payback time, and the environmental impact of electricity generation were presented;
  • How energy systems whose environmental impact is thought to be close to zero increase their environmental impact was demonstrated.

2. Experimental Setup and Experimental Procedure

To achieve the purpose of this study, an experimental setup was developed in the energy labs of Karabük University, Karabük, Turkey. A schematic representation of the experimental setup is shown in Figure 1. As can be seen in these figures, the considered experimental setup consisted of a PV module (reference), a PV/T system, a storage tank with a spiral-coil heat exchanger (30 L of water), a nanofluid tank (6 L), a pump, a support system, and other parts.
The PV/T system consisted of a mono-crystalline silicon module with 41.2 × 33.6 cm dimensions and a heat extraction unit laminated with the back surface of the PV module to provide thermal contact; two types of experimental setup were investigated accordingly: a PV/T system (see Figure 1 right) and an only PV module (same features as in the PV/T system; see Figure 1 left). The flat plate PV modules had the following technical features: a maximum power of 40 W, an open circuit voltage of 22.1 V, a maximum power voltage of 18 V, a short circuit current of 2.58 A, a maximum power current of 2.22 A, and a thermal absorptivity of 0.7. In the PV/T system, the heat extraction unit consisted of a serpentine heat exchanger, which was produced by soldering a serpentine copper tube of 1.0 cm and 0.8 cm outer and inner diameter, respectively, to a copper absorber plate of 67.5 × 38 × 0.07 cm. The total length of the copper tube needed was about 302 cm. To investigate the PV’s electrical performance, the heat extraction unit was assembled on the back surface of the PV panel.
In the spiral-coil heat exchanger and the heat extraction unit, distilled water, a multi-walled carbon nanotubes (MWCNT)/water mixture, and a graphene nanoplatelets (GNP)/water mixture were used as carrying fluids. The selected carrier fluids could work with a closed circuit flow in forced (pumped) operation, as illustrated in Figure 1. For this reason, a pump (model: RS25/4G-130, Nova Company) was used for the circulation of the fluids from the 6 L nanofluid tank to the heat extraction unit of the PV/T system and then the spiral-coil heat exchanger of the storage tank. The experimental setup requires approximately 3.5 L of fluid to operate.
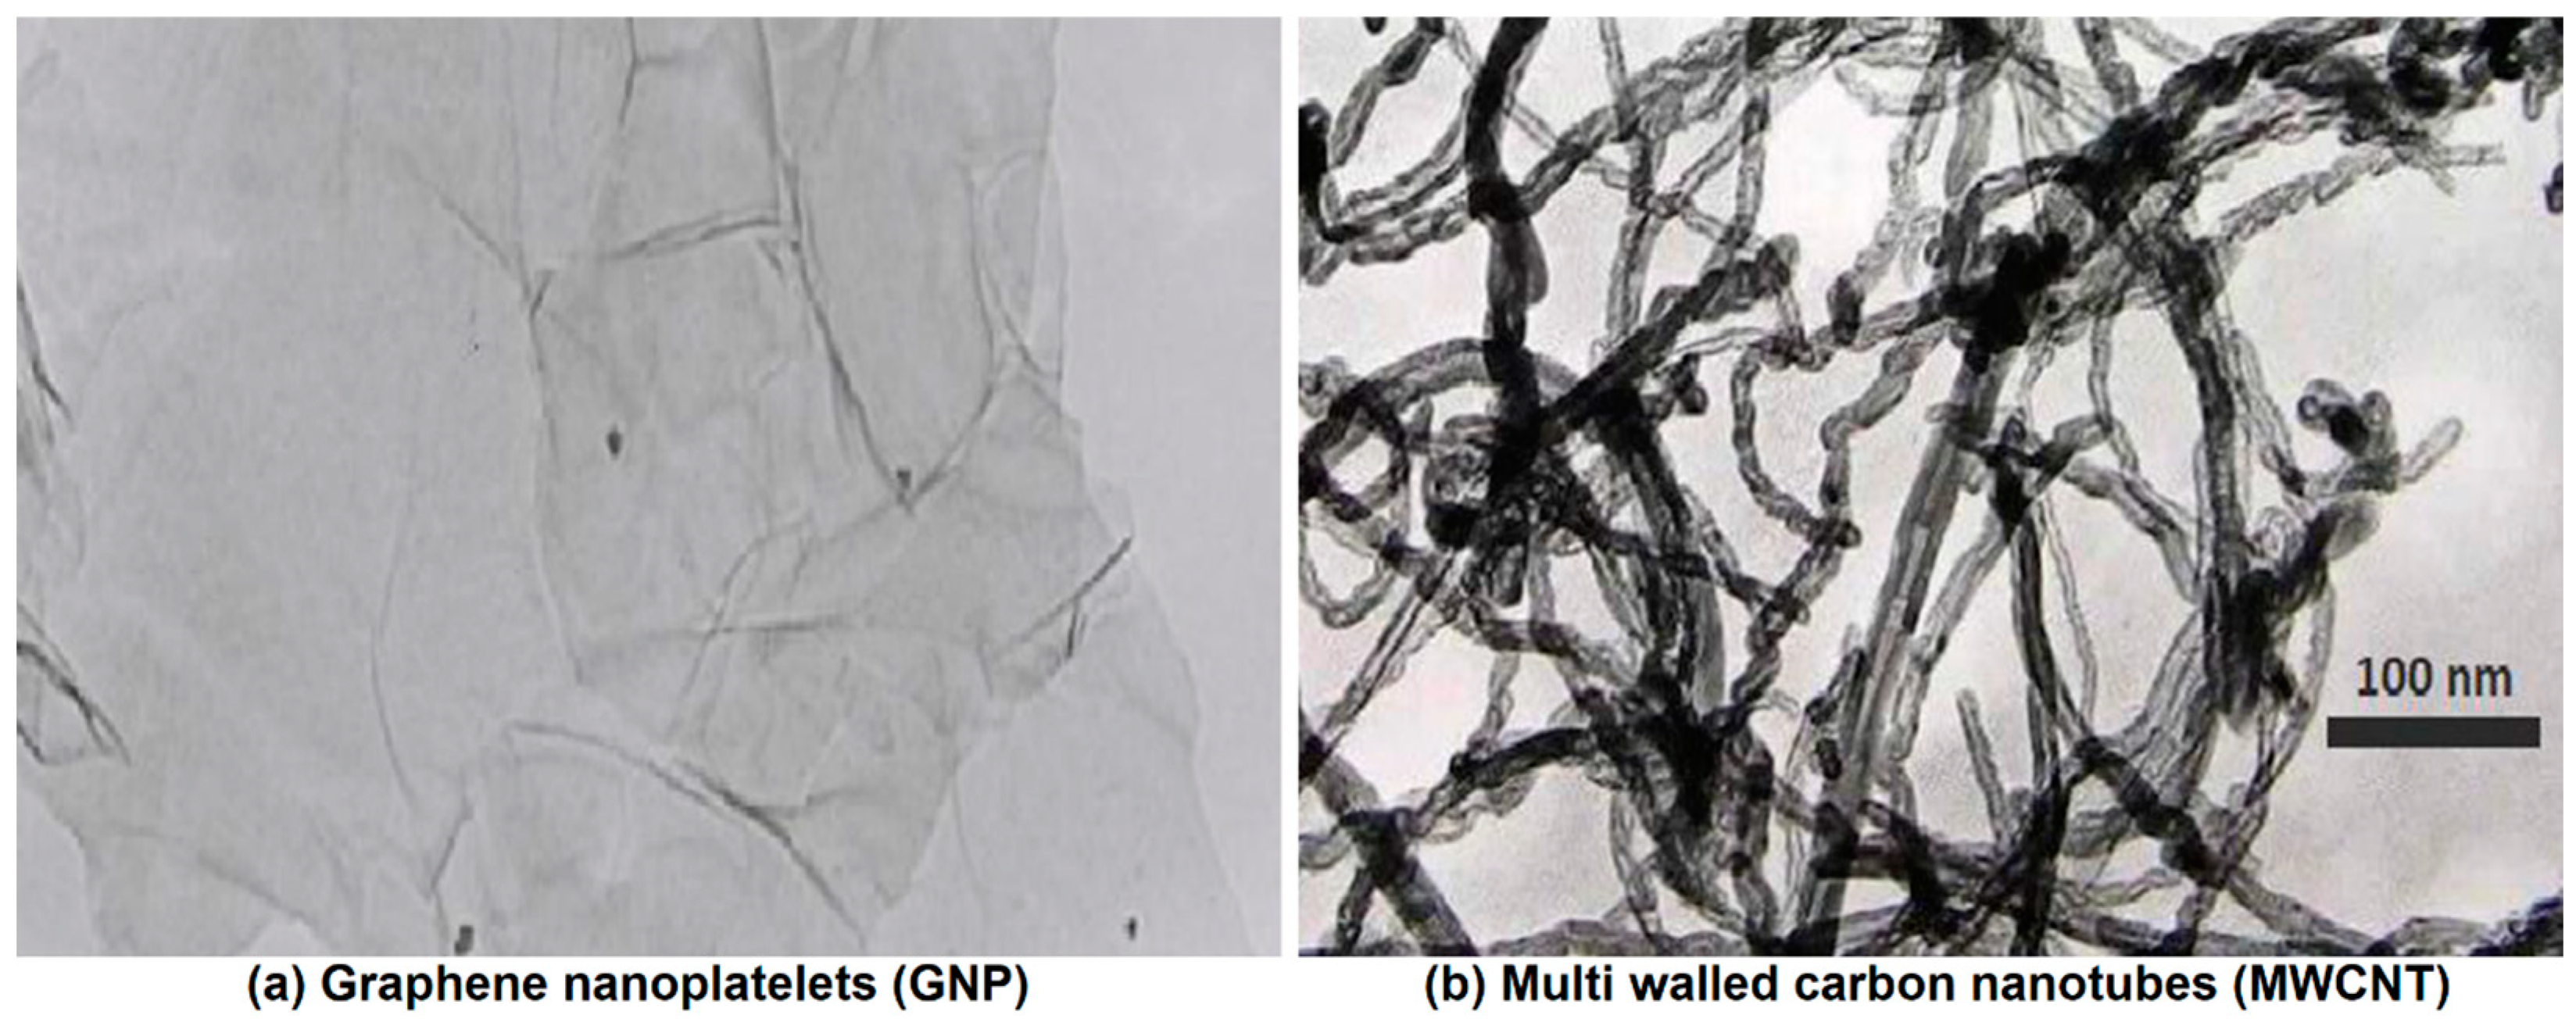
GNP and MWCNT nanoparticles were purchased from Nanografi Co., Ltd. and prepared at 0.5% wt. concentrations. The aqueous dispersion of the single-layer graphene nanoplatelets had more than 99.3% wt. purity, 500–1200 m2/g specific surface area, 1–12 μm diameter, and 0.55–1.2 nm thickness. MWCNTs’ aqueous dispersion had more than 96% purity and was 8–35 μm in length and 18–28 nm in outside diameter. Transmission electron microscopy (TEM) images of the GNP and MWCNTs are displayed in Figure 2. No sedimentation was visually observed throughout and after the experimentation.
The experimental setup, consisting of a PV module and PV/T system, was equipped with measuring devices and was prepared for the separate use of water and nanofluids to cool the PV/T system. The experiments were conducted at Karabük University, Karabük, Turkey (41.19° N latitude and 32.62° E longitude) in August and September, daily, from 9:00 a.m. to 5:00 p.m. For the fixed-position PV module and PV/T system, the tilt angle was determined to be 30° in the south direction. Preliminary studies were carried out using water for both the stable regime behaviors of the system and the calibration/accuracy of the measurements. The mass flow rates of water as a carrying fluid were 0.5, 1.0, and 2.0 L/min. In the experimental procedure, the experimental days were also extended as both water and nanofluids could not be run at the same time. To replace the carrying fluid, the heat extraction unit of the PV/T system, the nanofluid tank, spiral-coil heat exchanger, and pipeline were cleaned using water and air. In the process of cleaning with water, the color of the water was observed. The experiments under similar environmental conditions were taken care of. As experiments were repeated, the average values were used for this study.

3. Analysis Methodology

3.1. Thermal Analysis

The incident current, I in A, and voltage, V in V, values were measured on the system; multiplying these values equaled the electrical power, P in W, thus, the electrical powers of the PV module and PV/T system were calculated with Equation (1).
P ˙ = I × V
The thermal cooling power, Q ˙ in W, taken from the PV/T system was determined by:
Q ˙ = m ˙ C p T o T i
where Cp is the coolant-specific heat in J/kgK, m ˙ is the mass flow rate of the coolant in kg/s, and To and Ti are outlet and inlet temperatures of the coolant, respectively.
A PV/T’s energy efficiency indicates the amount of thermal and electrical energy that the PV/T takes from solar radiation. Thus, the electrical ( η e l ) and thermal ( η t h ) efficiencies are calculated as:
η e l = P ˙ I R × A P V
η t h = Q ˙ I R × A t h
where A P V and A t h are the surface areas of the PV module and PV/T module in m2, respectively, and IR denotes the total incident solar radiation in W/m2. The total energy efficiency of the PV/T system can be calculated by Equation (5) [27].
η t o t = η t h + r η e l
where r is the packing factor and can be obtained by dividing the surface area of the PV module by the surface area of the PV/T system as A P V / A t h . In this study, r was assumed to be 1 (actually 0.999) as A P V = A t h .
The methodology proposed by Kline and McClintock [28] was used to evaluate the accuracy of the data collected in the experimental study. The uncertainties in the measured parameters over the range of experiments were calculated by using the uncertainty data listed in Table 1. The maximum uncertainties in the thermal and electrical efficiencies were 1.3% and 1.0%, respectively.

3.2. Life Cycle Assessment

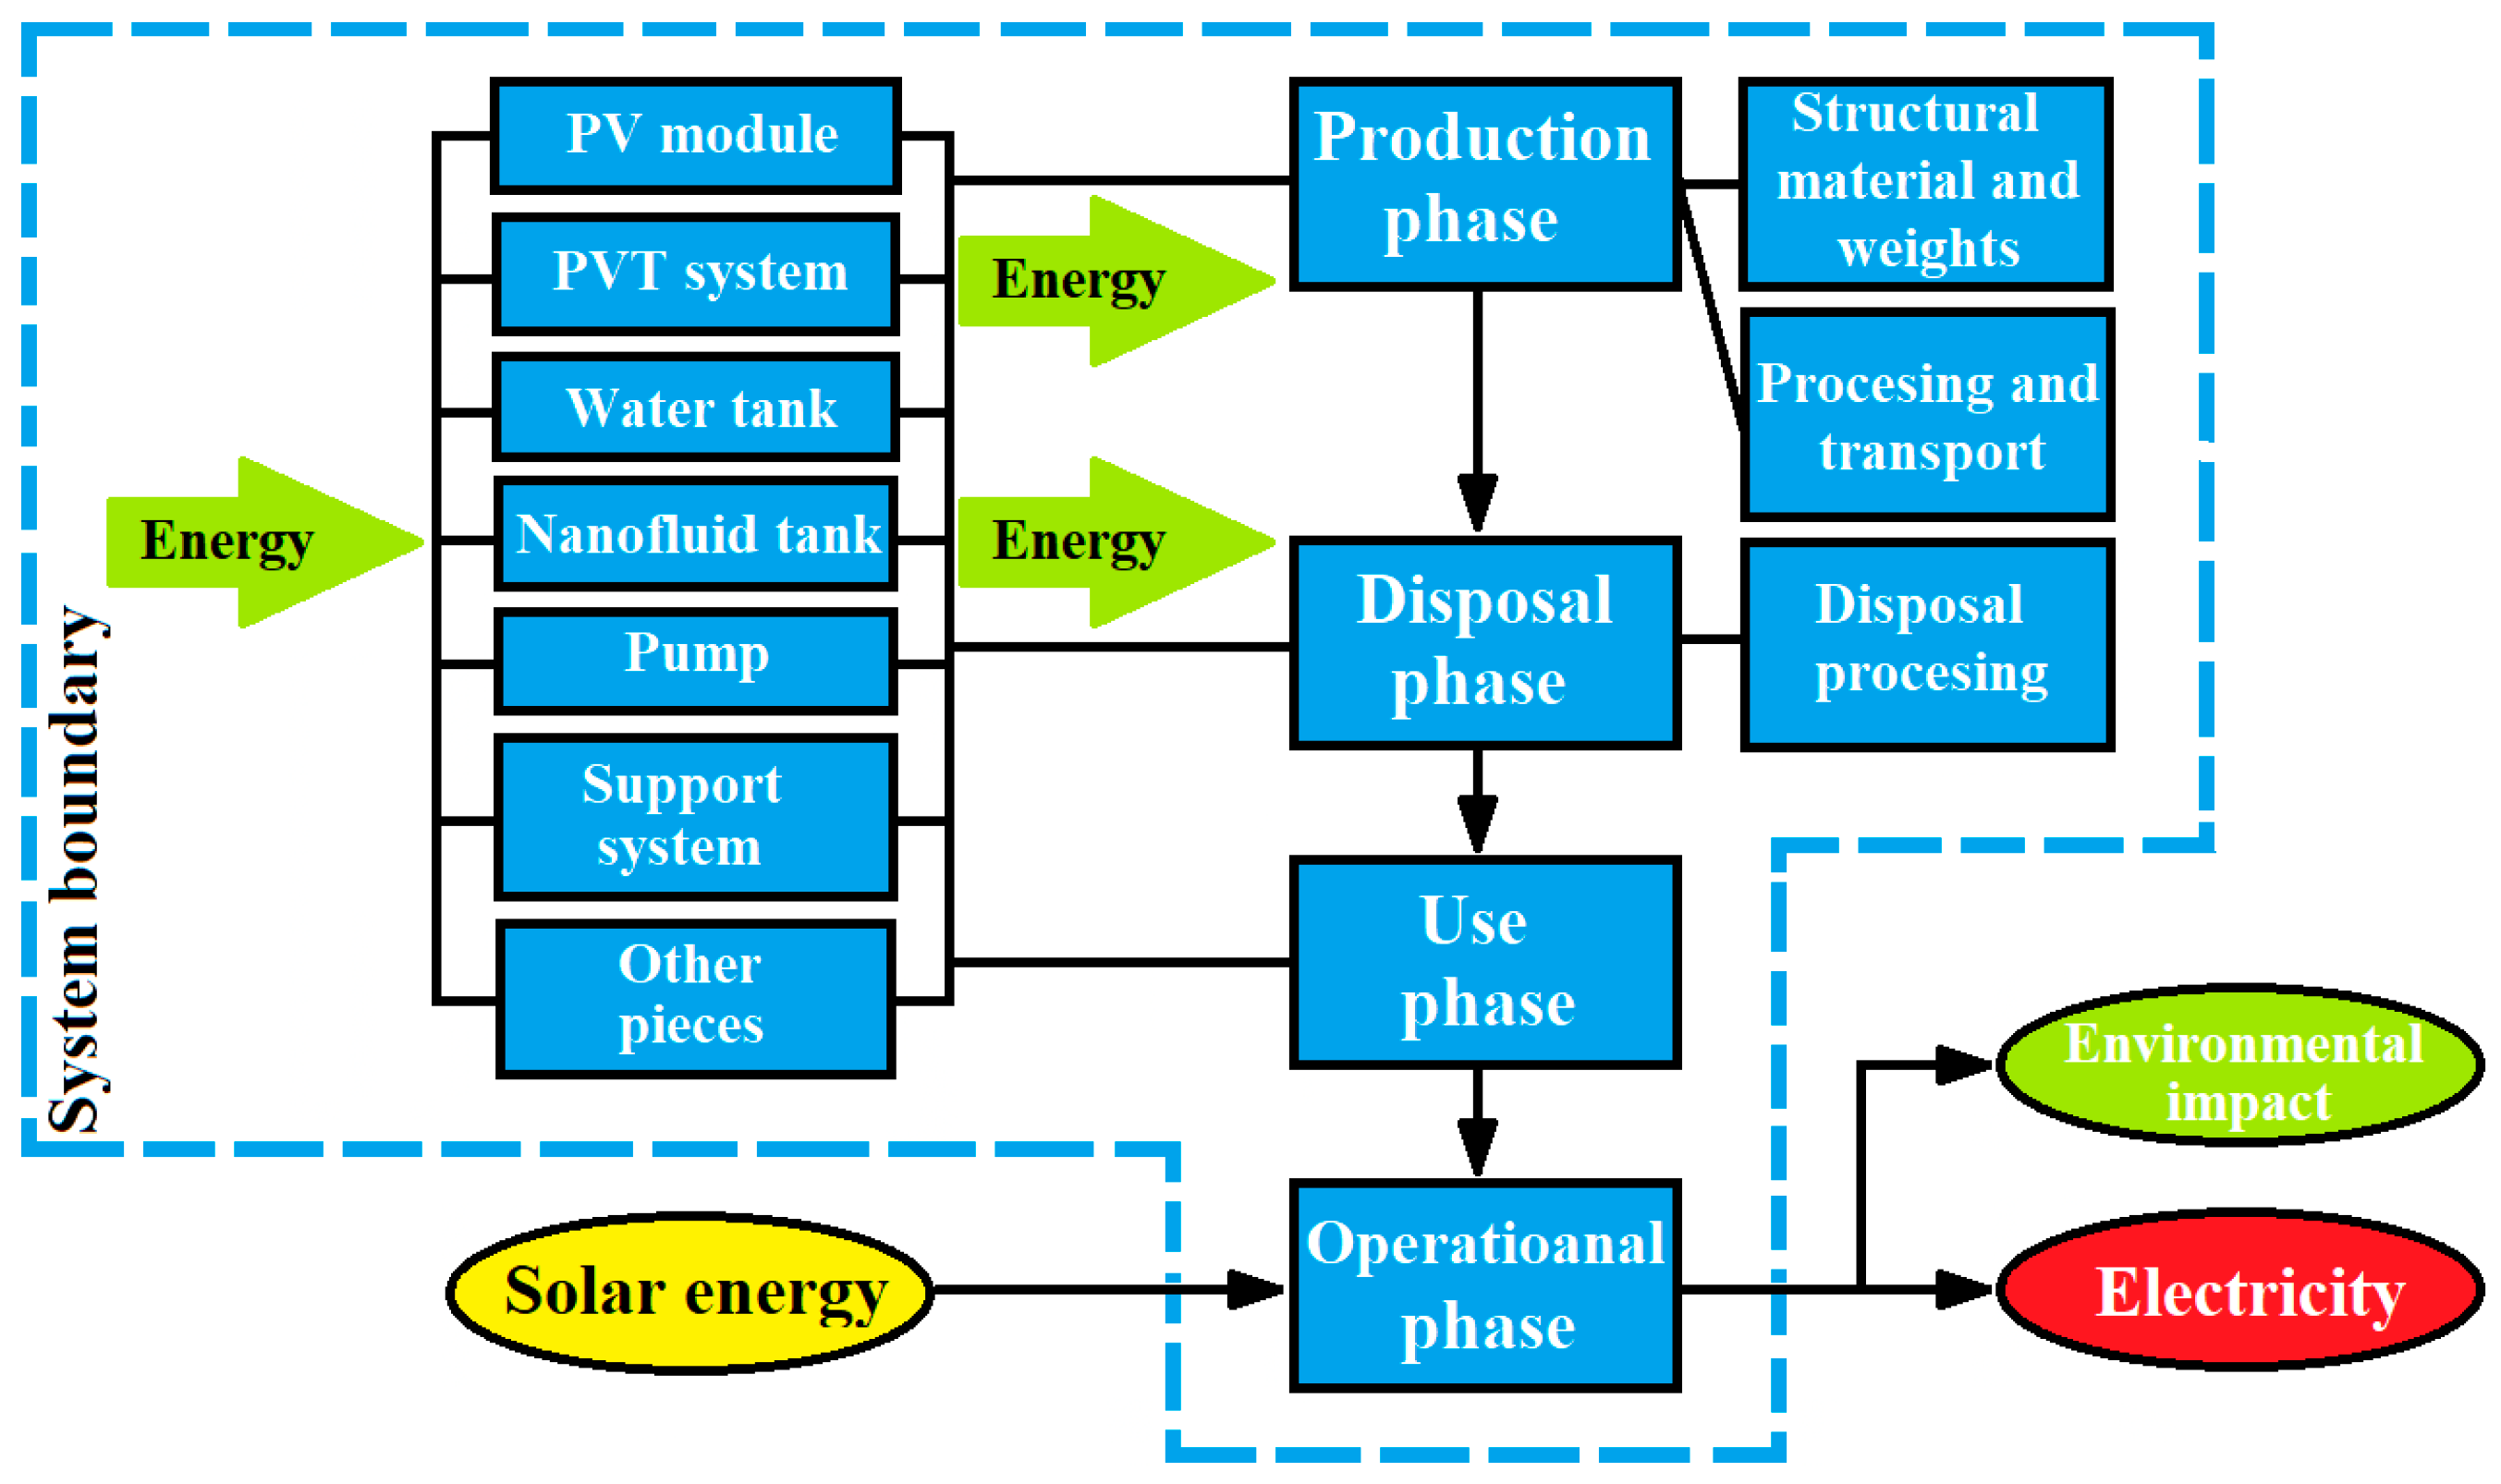
The main purpose of this study was to obtain a detailed energy and environmental profile of the solar-focused PV/T system and the use of nanofluids. Therefore, life cycle assessment (LCA) and cumulative energy demand (CED) analyses were performed to quantify the energy consumption and environmental impact from the production, use, disposal, and operational phases of various components of the PV/T system with and without nanofluid. The system boundaries used for the analyses are illustrated in Figure 3. This study took the “cradle-to-grave” approach by limiting the analyses to the sub-processes of construction materials, their weight, and disposal processing. All data sources used in the analysis were selected according to their reliability. Cutting-edge processes/technologies were considered for all intermediate production stages of the components of the experimental setup presented in Figure 1, as well as for the raw materials used.
The environmental impact of a product (production, processing, maintenance, disposal, etc.) is considered in LCA analysis, which is a useful tool for evaluating the environmental impact of a system [29,30]. Different LCA methodologies can be used for environmental impact assessment. For the environmental profile, in this study, Eco-indicator 99 was used because it was open to the literature. The data were cross-checked with the data accompanying the SimaPro software in addition to the tables of the Eco-indicator 99. For the energy profile, the energy return factor (ERF) and energy payback period (EPT) with the CED analysis were used.
LCA analysis consists of an inventory analysis in parts, including the scope, target, assessment of impacts, and interpretation. The collection of inventories of the main flows was carried out according to the international standard approach [31,32]. It included the collection of input–output data on material and energy streams about the experimental setup. It was necessary to collect information about the sizes, weights, core material, manufacturing process of the system and its components, and scrap output of all of the components needed to assemble the experimental setup. Thus, the experimental setup, consisting of a PV module and PV/T system, was basically divided into six components (e.g., the PV/T system, a water tank, a nanofluid tank, a pump, a support system, and other parts), as shown in Table 2. Detailed information about the structural materials and weights of six components is listed in Table 2. In this study, it was assumed that there was no chemical reaction between the components. For environmental impact evaluation, Eco-indicator 99 was chosen as a quantitative indicator. The indicator’s results were reported as eco-indicator points (pts). The points per unit and energies per unit values used in the LCA and CED analyses for the material, process, and disposal phases, respectively, are given in Table 3. Using Table 2 and Table 3, the environmental impact of the kth component, Ẏk, can be calculated by:
Y ˙ k = Y ˙ k C O + Y ˙ k O M + Y ˙ k D I
where the subscripts CO, OM, and DI denote construction, operation/maintenance, and disposal/dismantling, respectively.
The most important parts in the manufacture of the PV/T system are the production of the monocrystalline silicon module and the heat extraction unit. In the production of PV modules, silicon, glass, and polyethylene materials are mainly used. In addition, processes such as blow foil extrusion, injection molding, milling/turning/drilling, and pressure forming, are performed for silicon production, mono-Si wafer, cell production, and module assembly operations. The processes performed for other components are described in detail in Table 3.

3.3. Cumulative Energy Demand

The energy profile was evaluated using the cumulative energy demand (CED) methodology for the installation phase. Two indicators were used for energy profile assessment throughout the entire system’s life cycle: the energy return factor (ERF) and the energy payback time (EPT). CED is a methodology for measuring indirect and direct energy use in MJ units throughout the life cycle of a process or product, including the energy consumption during the disposal, production, and extraction of the materials. To evaluate the life cycle energy of a product, the sum of three energy terms is considered: embodied energy (consisting of the energy consumed during the production phase and energy used for maintenance and healing during the operation phase), operational energy, and destruction energy. The energies per unit for the material, process, and disposal phases in the CED analysis are provided in Table 3. The CED value for each component was determined by multiplying the weight of the component material presented in Table 2 and the relevant energy per unit listed in Table 3. The CED value of the overall system was then found by summing the CED values obtained for each component. The CED values obtained for the PV module and the PV/T system were compared with the results obtained from the SimaPro software. As a result, determining the CED for the whole life cycle energy assessment of a given system enabled the calculation of the ERF and EPT.
The ERF is defined as the ratio of the energy produced by a system during its entire life to the CED of the system (see Equation (7)). In other words, it shows how many times the energy required to produce a system is generated. In the case of electricity generation technologies, the ERF requires the comparison of the electricity produced with the amount of primary energy used at different life cycle stages. The ERF (dimensionless) is calculated as the ratio of supplied energy to the energy costs and is given as follows:
E R F = E G l o b a l C E D
where E G l o b a l and C E D denote the total amount of energy produced over the life of a system and the energy input (cumulative energy demand) of a system/total energy demand, respectively. If the ERF value is less than 1, it means that there will be no net energy output during the life of the system. Generally, it should be greater than 1.
The EPT is described as the duration necessary for a system to produce the same amount of energy as that used to produce the system itself. It is obtained by Equation (8), and its unit is years.
E P T = N E R F
where N denotes the lifetime in years. It was assumed to be 25 years at all stages of the analyses.

4. Results and Discussion

In this study, the performance, energy, and environmental profiles of a PV module and a PV/T system cooled by nanofluids were evaluated. Therefore, real-time data were collected from the experimental setup for heat carrier fluids, such as distilled water, multi-walled carbon nanotubes (MWCNT)/water mixture, and graphene nanoplatelets (GNP)/water mixture in the PV/T system. Thermal, LCA, and CED analyses were performed using validated data to compare performance from energetic and environmental perspectives.
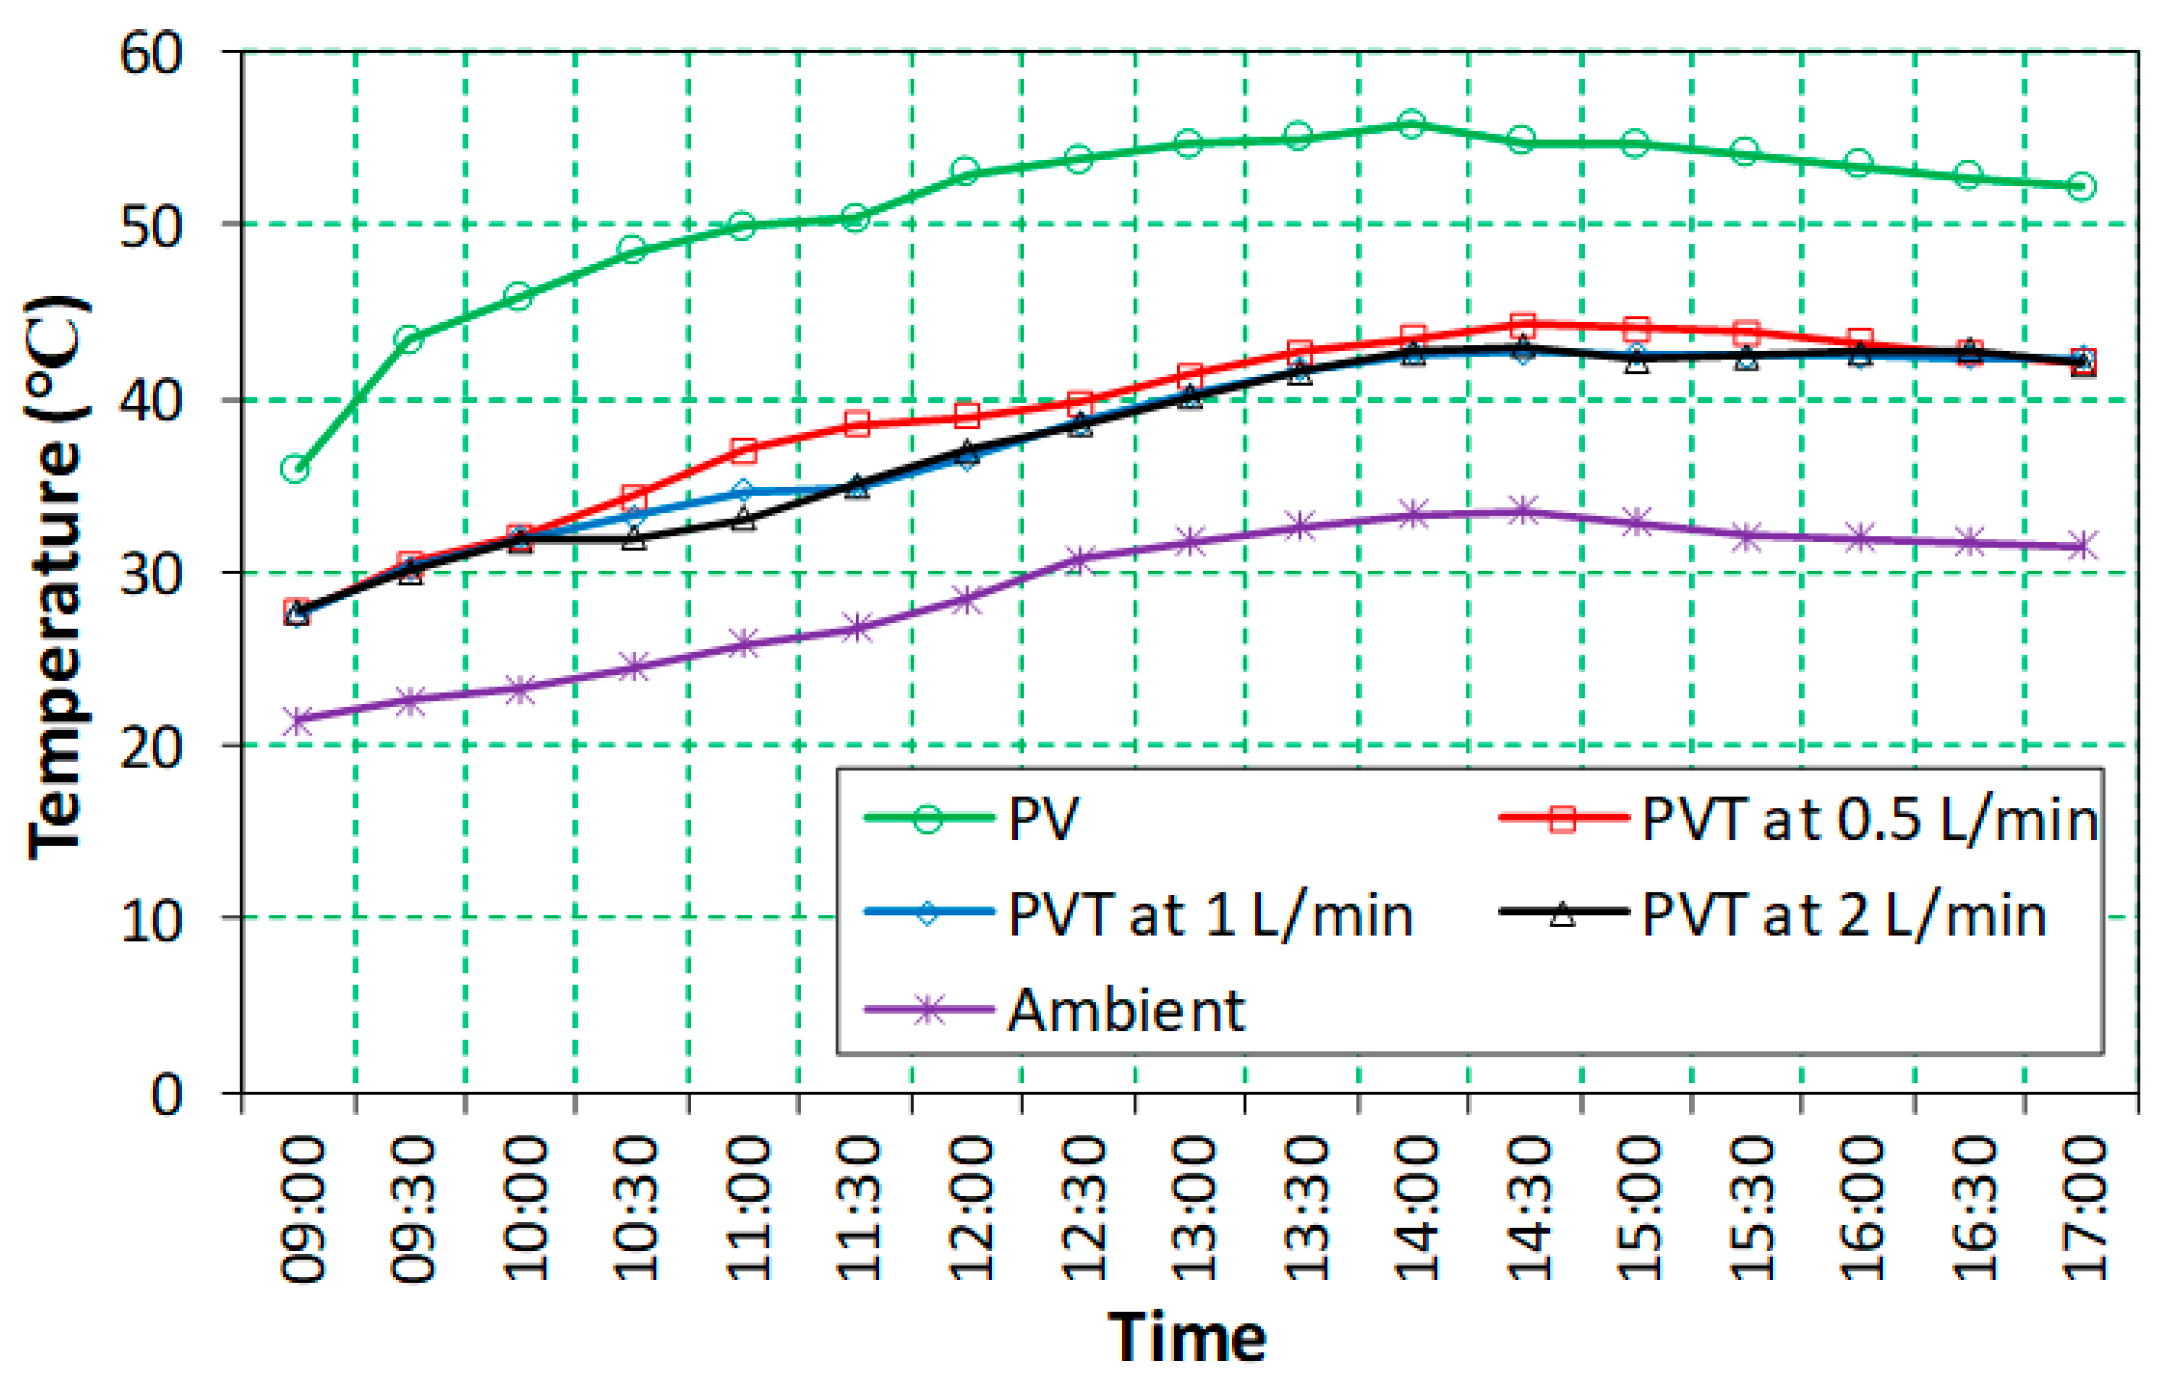
The temperature variations in the environment, PV, and PV/T according to different flow rates of distilled water are displayed in Figure 4. As shown in Figure 4, the temperature of the PV/T system with different flow rates was below the PV module temperature throughout the day. While the ambient temperature was 29.1 °C on a daily average, the temperature in the PV reached a maximum of 55.8 °C and an average of 51 °C. The difference between the PV and ambient temperatures was 21.9 °C on average. The lowest PV temperature in the PV/T system occurred at a flow rate of 2 L/min for an average of 37.9 °C. It was followed by the temperature at the flow rate of 1 L/min, which was almost as high as its temperature (about 38.1 °C). However, the highest PV temperature occurred at a flow rate of 0.5 L/min, with an average value of 39.2 °C. It can be seen from Figure 4 that passing the heat-carrying fluid (here, water) through the heat-extraction unit of the PV/T system caused the temperature of the PV module to decrease. In addition, Pantzali et al. [33] reported that the improvement in heat transfer with nanofluids was clearer at lower Reynolds numbers. Therefore, this article presents the results obtained at a flow rate of 0.5 L/min.
The experiment period was extended because different heat-carrying fluids were used in the experimental setup. In the experiments, the PV module and the PV/T system were placed side-by-side and at the same angle to conduct comparisons under the same conditions. To observe the performance of the PV/T system, it was very important that both were exposed to solar irradiance, especially at the same angle. Therefore, the instantaneous changes in ambient temperature and solar radiation for the most suitable days when different carrying fluids were used are presented in Figure 5. The average solar radiation and ambient temperature were, respectively, 727.35 W/m2 and 29.1 °C for the PV/T system with distilled water, 702.06 W/m2 and 28.6 °C for the system with the MWCNT/water mixture, and 693.82 W/m2 and 28.4 °C for the system with the graphene nanoplatelets/water mixture. According to Figure 5, all three experiments were carried out under similar environmental conditions, as their values were close to each other. The experiment day was selected when both values of the PV/T system with distilled water were higher compared with the other two systems. In addition, its radiation value showed a slight increase after 13:00 pm. In addition, the days when both the ambient temperature and solar radiation of the PV/T system with the graphene nanoplatelets/water mixture were lower than those of the system with the MWCNT/water mixture were selected.
The power rate changes generated by the PV module and the PV/T system throughout the experiments are presented in Figure 6. The average power rates for the PV and PV/T modules were, in the same order, 22.11 W and 24.33 W for the PV/T system with distilled water, 22.62 W and 24.84 W for the system with the MWCNT/water mixture, and 23.14 W and 25.32 W for the system with the graphene nanoplatelets/water mixture. As shown in Figure 6, the highest power generation rate occurred in the PV/T system with a graphene nanoplatelets/water mixture. It was followed by the system with the MWCNT/water mixture and the system with distilled water. In Figure 6, can be seen that the PV/T systems with solar radiation from the highest to the lowest were the systems with distilled water, with the MWCNT/water mixture, and with the graphene nanoplatelets/water mixture. However, it can be seen from Figure 6 that the reverse order of this situation occurred for the amount of power produced. The highest power generation rate occurred in the PV/T system with a graphene nanoplatelet/water mixture.
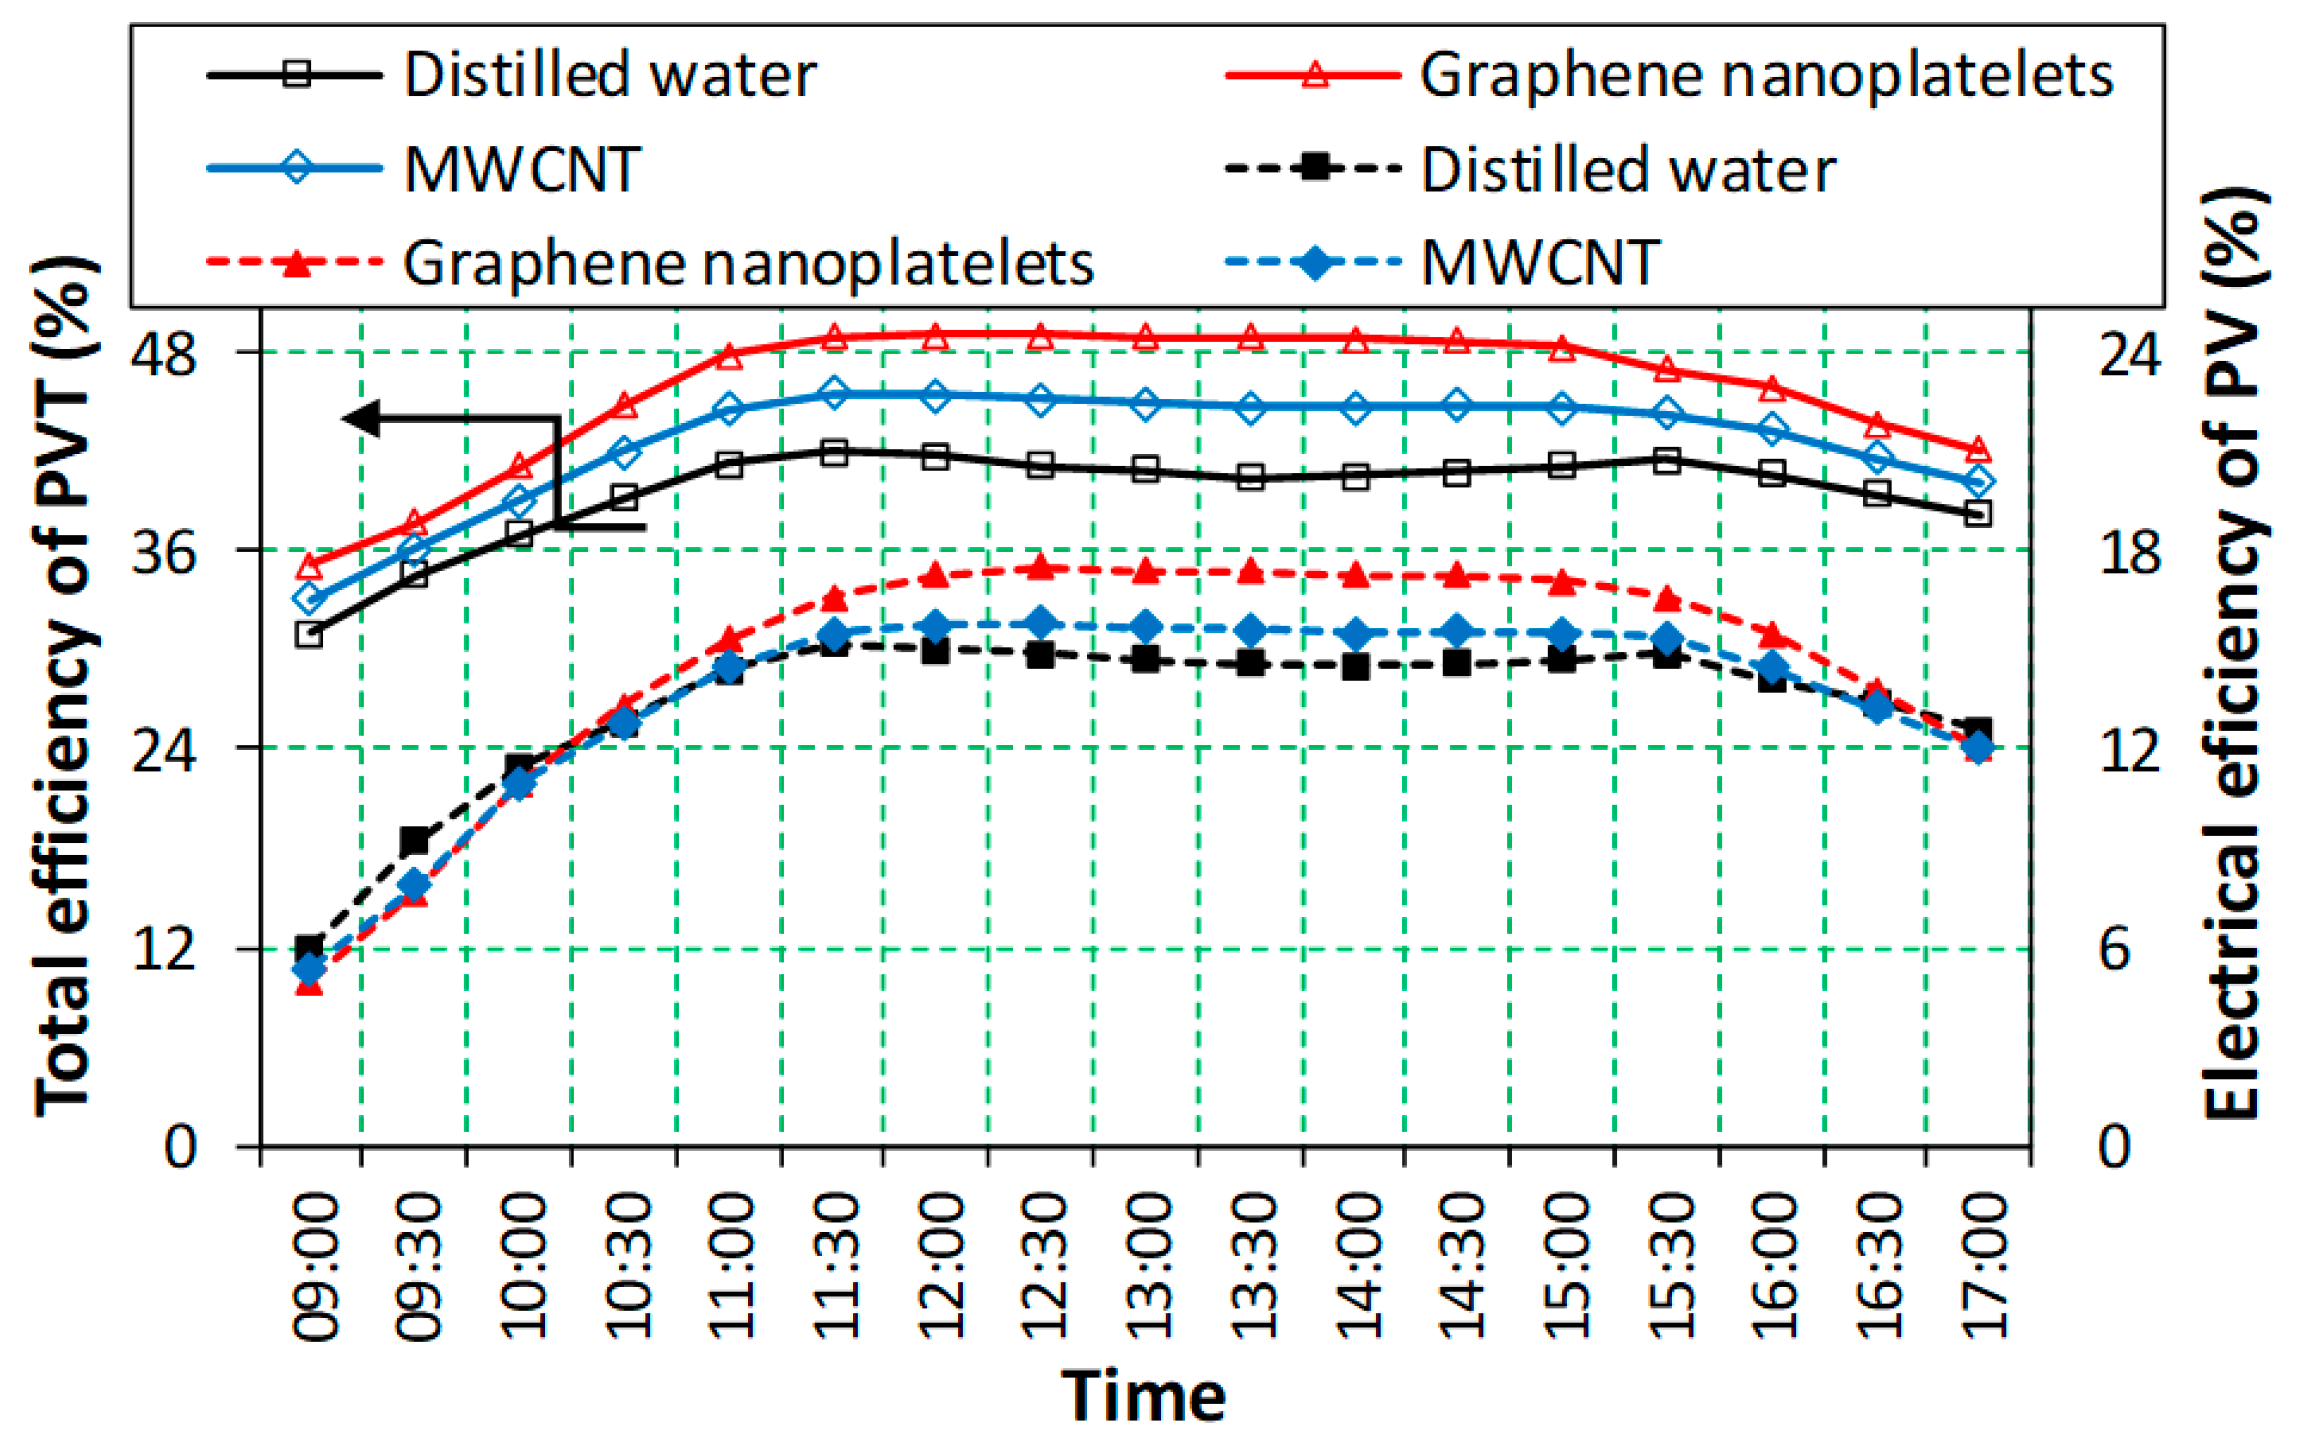
Figure 7 illustrates the efficiency changes in the PV module and PV/T system for different nanofluids. As seen in Figure 7, the highest electrical efficiency of a PV module according to Equation (8) was obtained in the system with a graphene nanoplatelets/water mixture (14.6% in the daily average). For the PV/T systems with a MWCNT/water mixture and distilled water, the average electrical efficiencies of PV were 13.6% and 13.4%, respectively. However, until 10:20 a.m., the PV electrical efficiency of the PV/T system with distilled water was higher than that of the others. This was a result of the use of different carrier fluids in the experimental setup, prolonging the experiment day. Regarding Figure 7, the carrier fluid order did not change with the total efficiency changes in the PV/T system according to Equation (5), and it was similar to the change in the electrical efficiency of the PV module. For example, the overall efficiency values were 45.7%, 42.6%, and 39.5% as daily averages for the PV/T systems with the graphene nanoplatelets/water mixture, with the MWCNT/water mixture, and with distilled water, respectively. It can be reported that the electrical efficiency of the PV module was increased by 2–9% with the use of PV/T systems and especially nanofluids. In addition, small decreases in electrical efficiency were observed due to increases in the temperature of the PV module during the periods of maximum solar radiation (between 11:40 and 15:40). Consequently, the best performance was obtained by cooling the PV module with a graphene nanoplatelets/water mixture (Figure 7), despite the special choices made for the environmental conditions of the experimental days (see Figure 4 and Figure 5).
In a study conducted by Shalaby et al. [34], the electrical efficiency of the PV panel was found to be 13.8% on average by cooling it with water. Additionally, in another similar study, Zilli et al. [35] obtained an electrical efficiency of 9.09% for a PV/T. Nasrin et al. [36] attained an increase in electrical efficiency of 9.2% for MWCNT nanofluid. Naghdbishi et al. [37] reported that MWCNT nanoparticles in PV/T systems increased the electrical efficiency by 4.21% compared with pure water. Gundala et al. [38] used 0.05% by-weight graphene nanoplatelets to cool the PV/T and observed that the electrical performance of the PV/T increased by 8.5%. Hassan et al. [39] obtained a maximum electrical efficiency of 14% by using graphene nanoparticles and phase change material together in the PV/T system. The results of this study showed that it was comparable with similar studies in the literature.
The performance evaluation of the above-mentioned PV/T system and nanofluid usage were discussed in detail. However, there were two major aspects to consider when evaluating a PV/T system: environmental and energy. The LCA and CED methods were applied to the experimental setup, which consisted of a PV module and a PV/T system, to determine the environmental impact of the electricity produced. The analyses were performed using the Eco-indicator 99 and SimaPro software according to the international standard approach [31,32]. Thus, Figure 8 depicts the changes in the environmental impact and embodied energy based on the system’s components for the experimental setup. The total environmental impact of the experimental setup was determined to be 178.7 mPts/h (31.3 Pts for lifetime). As can be seen in Figure 8, the component with the highest environmental impact was the PV/T system, accounting for 51.5% of the total, followed by the water tank (19.5%), the support system (11%), and the other components (9.6%). The reason why the PV/T system had such a high environmental impact percentage was the presence of a copper tube and absorber plate in the heat-extraction unit (shown as “only thermal” in Figure 8). Similarly, the spiral-coil heat exchanger in the water tank was made of copper. The PV module accounted for 0.7% of the total (1.3 mPts/h). The largest percentage of it belonged to solar glass as a sub-component. The most striking issue in Figure 8 was that the environmental effect of nanofluids could not be observed. In the experimental setup, there was approximately 7.85 L of water in the nanofluid tank and its closed-loop line. Approximately 0.5% (by wt.) of water contained nanoparticles. Therefore, even if the production, use, transport, and disposal phases were taken into account for very small amounts in the system, the environmental impact could not be shown here.
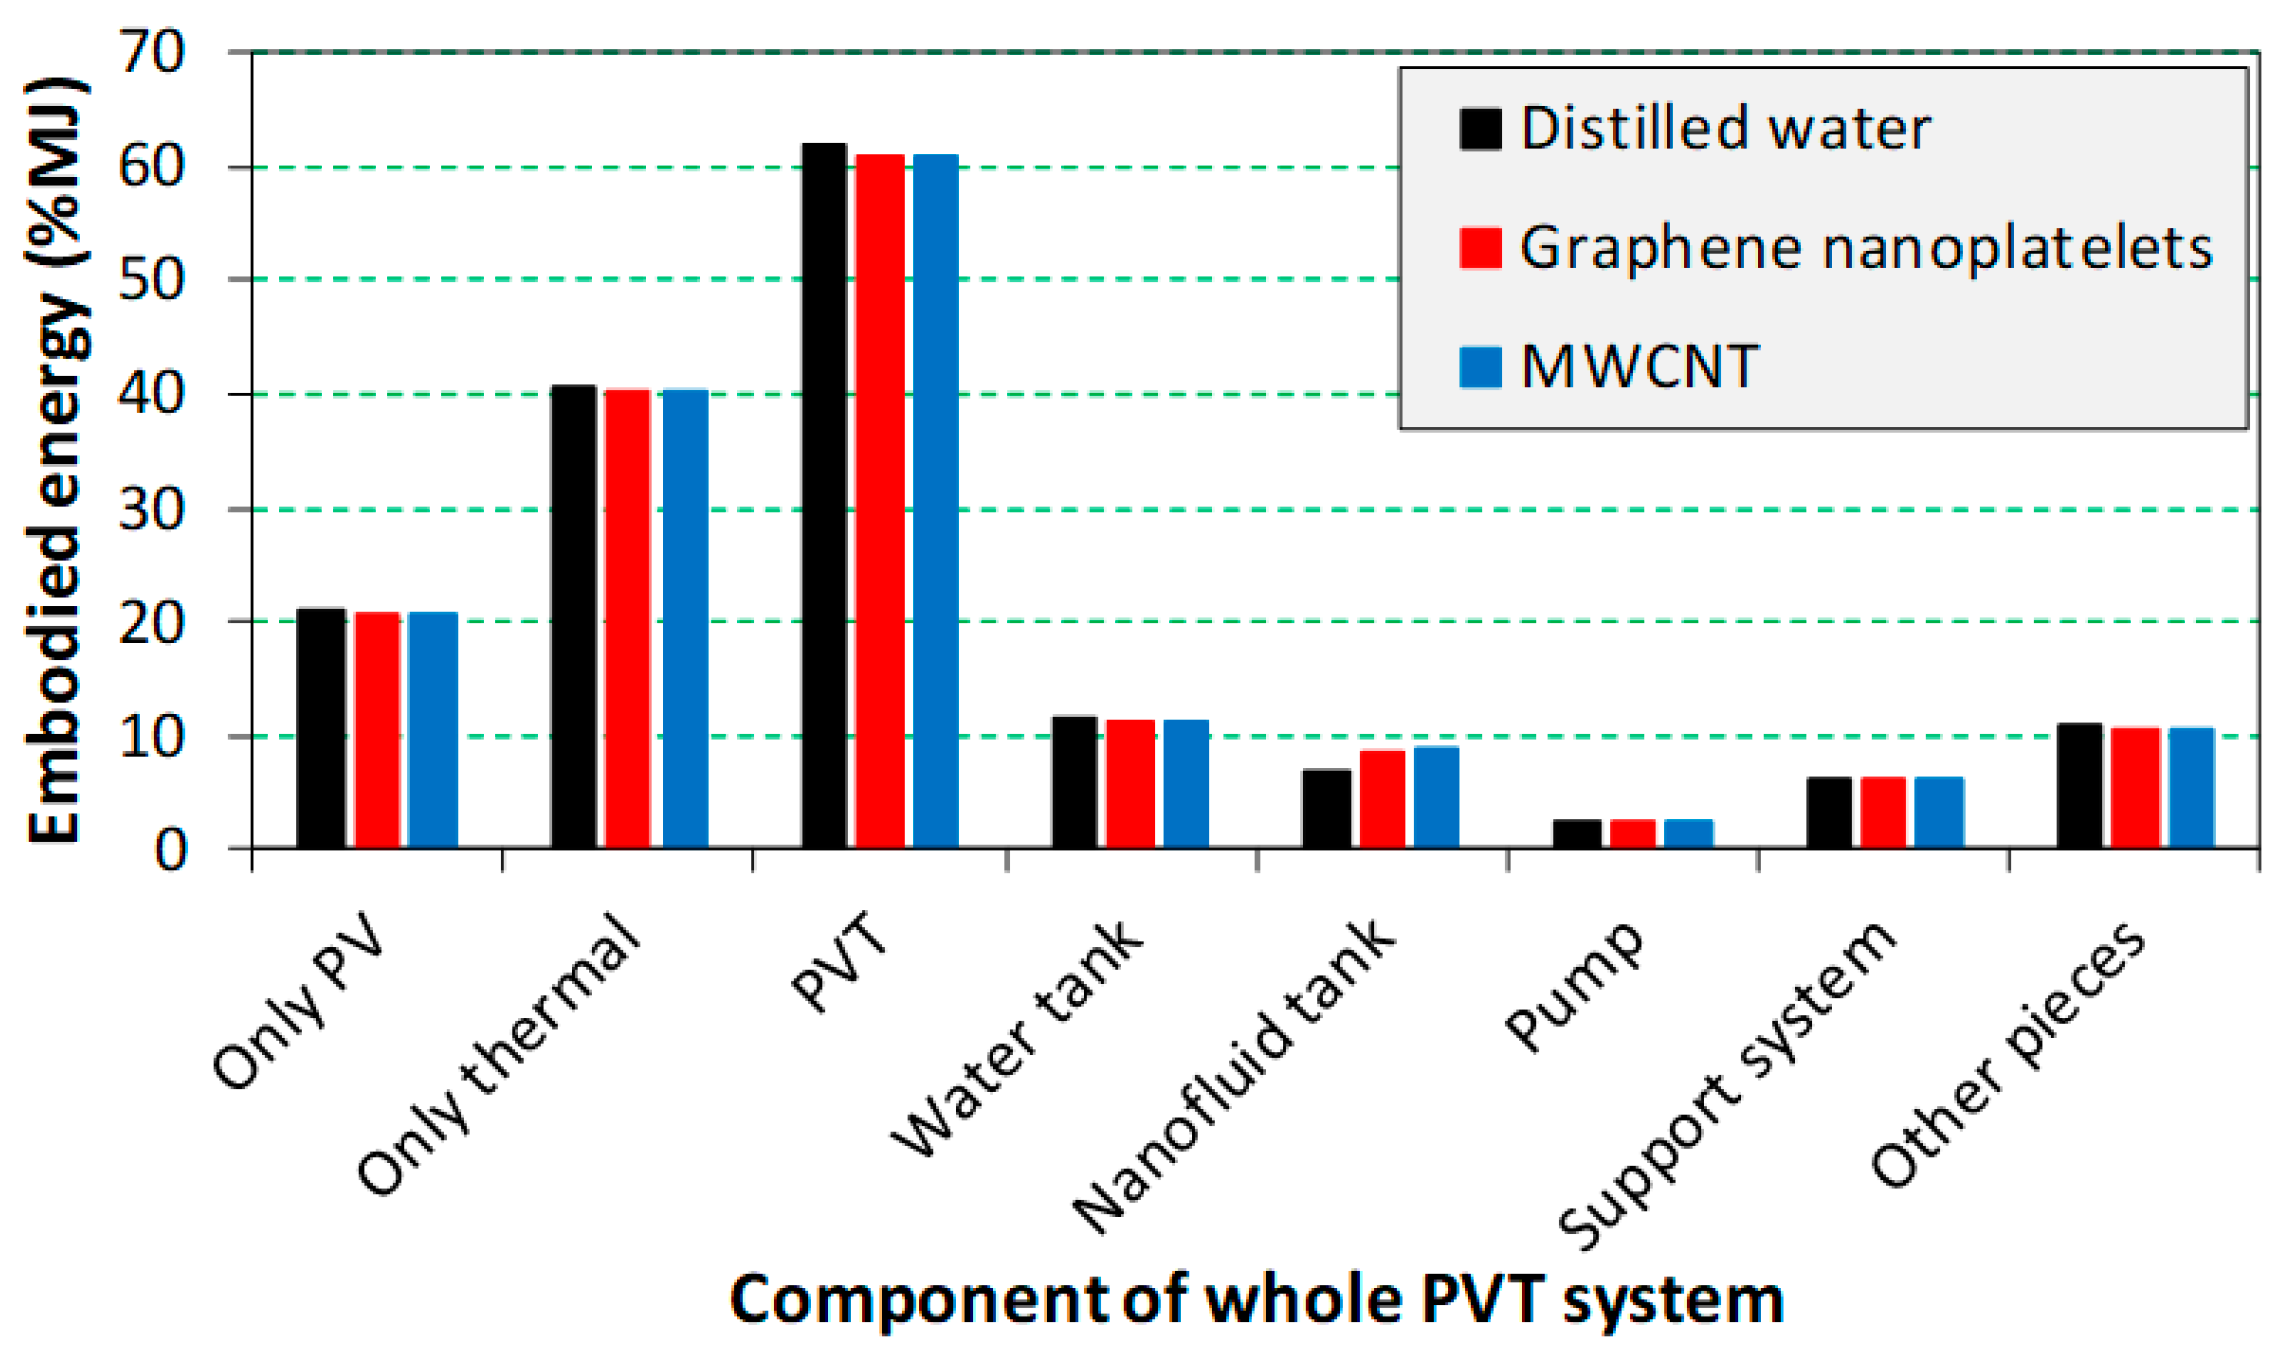
However, in terms of embodied energy, the embodied energies of the experimental setup were calculated to be 3975.9 MJ, 4077.9 MJ, and 4081.1 MJ, respectively, for the PV/T systems with distilled water, the graphene nanoplatelets/water mixture, and the MWCNT/water mixture. In Figure 8, for the PV/T system with distilled water, the highest embodied energy occurred in the heat extraction unit, with 40.7% of 3975.9 MJ. It was followed by the PV module (21.2%), water tank (11.7%), other components (10.5%), and nanofluid tank (6.9%). The high embodied energy of the PV/T system was due to the following reason: the use of an aluminum frame in the heat extraction unit resulted in increased embodied energy. In addition, the embodied energy of the PV module had a very high value of 794.3 MJ. The lowest embodied energy was in the pump (about 2.5%).
The embodied energy percentage of the system components for different nanoparticles is indicated in Figure 9. The PV/T system with the highest embodied energy was that with a MWCNT/water mixture. After that came the PV/T systems with distilled water and a graphene nanoplatelets/water mixture. Similar to Figure 9, for different nanoparticle/water mixtures, the PV/T system was the most energy-intensive component of the experimental setup and was followed only by the thermal part (heat-extraction unit), PV module, water tank, other pieces, nanofluid tank, and support system (see Figure 9). As shown in Figure 9, there was a difference in the percentage of embodied energy between different heat-carrying fluids in the nanofluid tank, only the thermal part (heat-extraction unit) and water tank (spiral-coil heat exchanger), as the heat-carrying fluid of the experimental setup was circulated in a closed loop between the nanofluid tank, pump, heat extraction unit, and spiral-coil heat exchanger components. From Figure 9, the lowest and highest percentages of embodied energy in the nanofluid tank occurred in the distilled water, with 6.9%, and the MWCNT/water mixture, with 8.9%. In the water tank, the percentage of embodied energy from smallest to largest was ranked as follows: MWCNT/water mixture (11.3%), graphene nanoplatelets/water mixture (11.4%), and distilled water (11.7%). For the heat-extraction unit (only thermal), they were ranked following the same order as that for the water tank, as 40.2%, 40.3%, and 40.7%.
The general results of the overall analyses conducted for the PV module and PV/T system are summarized in Table 4. As seen in Table 4, the superiority of the PV/T system with the graphene nanoplatelets/water mixture for performance, energy, and environmental profiles was reached in all parameters compared with the other two systems. The average daily electricity production of the PV module was determined to be about 19.7 W. As a result of the experimental study, it was observed that the daily instantaneous power and the electrical efficiency increased up to 23.88 W and 14.4%, respectively, when the PV modules were cooled with a graphene nanoplatelets/water mixture. Similarly, the total efficiency of the PV/T system scaled up (to 45.7%). For example, the daily average overall efficiency values were 45.7%, 42.6%, and 39.5% for the PV/T systems with a graphene nanoplatelets/water mixture, a MWCNT/water mixture, and distilled water, respectively.
As shown in Table 4, the total embodied energies of the PV/T systems were calculated to be 3975.88 MJ, 4081.06 MJ, and 4077.86 MJ for distilled water, the graphene nanoplatelets/water mixture, and the MWCNT/water mixture, respectively. The PV/T system with graphene nanoplatelets/water mixture needed the most energy during installation. As described in Equations (7) and (8), the energy return factor (ERF) and the energy payback time (EPT) were 1.76 and 11.39 years for a PV/T system with distilled water, 1.80 and 11.13 years for a system with a MWCNT/water mixture, and 1.85 and 10.83 years for a system with a graphene nanoplatelets/water mixture, respectively. The highest ERF value was 1.85 for the PV/T system with a graphene nanoplatelets/water mixture. This means that 1.85 times the energy (electricity generation) can be produced from the energy required in the installation phase. In addition, the PV/T system with a graphene nanoplatelets/water mixture had the lowest EPT value of 10.8 years. This means that approximately 10.8 years are necessary to recover the energy used to produce the system. While the embodied energy of the PV/T system with a graphene nanoplatelets/water mixture during the assembly phase was higher than that of other PV/T systems, its EPT value was lower. This was due to the higher energy output produced by the PV/T system with a graphene nanoplatelets/water mixture, which compensated for the embedded energy invested in the assembly phase.
In addition, the environmental impact per unit of electricity generated was calculated for different PV/T systems, and given in Table 4. From the table, the environmental impact of electricity produced (EIE) was 0.046, 0.044, and 0.043 Pts/kWh for the PV/T systems with distilled water, with a MWCNT/water mixture, and with a graphene nanoplatelets/water mixture, respectively. According to the Eco-Indicator 99 [40], the environmental impact on electricity generation of the experimental setup in this study was 4.7 times higher (for the system with distilled water) compared with the environmental impact of electricity generation at 0.0097 and 0.0072 Pts/kWh for small installations (3 kWp) with mono-crystalline cells on a building facade and on a building roof, respectively. Using nanofluid instead of distilled water, especially a graphene nanoplatelets/water mixture, reduced the EIE value. Consequently, the results of this study show that the use of nanofluids could both increase the electrical efficiency of PV/T systems and decrease their environmental effects.
In Table 5, the results of some studies conducted in the literature are compared for the LCA analysis of the PV module and PV/T systems. The results of this study appear to be consistent with the results of the studies listed in Table 5.

5. Conclusions

This paper presents a detailed experimental study and a complete environmental assessment using LCA and CED analyses for the entire lifetime of a PV/T system cooled with nanofluids, such as a MWCNT/water mixture and a GNP/water mixture. The LCA and CED analyses enabled detailed evaluations of the energy and environmental profiles of the PV/T system and its components throughout the manufacturing, installation, and operation phases. The results of the study yield the general conclusions listed below:
  • According to the PV module, electrical efficiency increased in the PV/T system. The electrical and total efficiencies changed between 13.5–14.4% and 39.5–45.7%, respectively, in the PV/T system. Among the three working fluids, the PV/T system with the graphene nanoplatelets/water mixture had the highest efficiency values.
  • The embodied energy values were 3975.08 MJ for the PV/T with distilled water, 4081.06 MJ for the PV/T with a MWCNT/water mixture, and 4077.86 MJ for the PV/T system with a graphene nanoplatelets/water mixture. This result relates to the large amount of silicon, galvanized iron, and aluminum used in the manufacture of the PV module and PV/T system, respectively.
  • The energy payback time was changed between 10.83 and 11.39 years and had the lowest value in the PV/T system with graphene nanoplatelets/water mixture. The use of nanoparticles could shorten the energy return time.
  • The environmental impact of the produced electricity was 0.046, 0.044, and 0.043 Pts/kWh for the PV/T systems with distilled water, MWCNT/water, and graphene nanoplatelets/water, respectively. These values were 0.0097 and 0.0072 Pts/kWh for small installations with monocrystalline cells on a façade and on a building roof, respectively. Thus, although the values of the PV/T system were very high, the use of nanoparticles decreased the environmental impact somewhat compared with the use of distilled water.
  • Based on the LCA results, it was evident that the PV/T systems were less environmentally friendly compared with PV modules due to the increased amount of copper and aluminum used during their fabrication.
  • The installation and operation of the PV/T systems require less energy-intensive materials (nanoparticles), resulting in lower environmental impacts during their processing compared with the PV/T system with distilled water.
  • The energy consumed and environmental impacts of all manufacturing, installation, and operation processes to be followed were increased when the electrical efficiency of the PV module was increased. Therefore, for even the smallest improvement in the PV module and/or PV/T system, its energy and environmental impact should be considered.
  • Nanofluids should be used in the cooling of PV/T systems, increasing their electrical efficiency and decreasing their environmental impact.

Author Contributions

Conceptualization, G.K.D.; methodology, A.K.; validation, A.G.G., M.K. (Muhammet Kayfeci) and A.K.; investigation, M.K. (Meltem Koşan); data curation, M.K. (Meltem Koşan) and A.G.G.; writing—original draft preparation, G.K.D. and A.K.; writing—review and editing, G.K.D., M.K. (Meltem Koşan), M.K. (Muhammet Kayfeci), A.G.G., and A.K.; visualization, A.K.; supervision, A.G.G. and M.K. (Muhammet Kayfeci); project administration, M.K. (Muhammet Kayfeci). All authors have read and agreed to the published version of the manuscript.

Funding

This research was funded by the Karabük University Scientific Research Projects Coordination Unit, grant number KBÜ-BAP-17-DR-262.

Data Availability Statement

Not applicable.

Acknowledgments

The authors would like to kindly express their thankfulness and gratitude to the Karabük University Scientific Research Projects Coordination Unit for the financial support provided under the project number of KBÜ-BAP-17-DR-262.

Conflicts of Interest

The authors declare no conflict of interest.

References

  1. Hossain, F.; Karim, M.R.; Bhuiyan, A.A. A review on recent advancements of the usage of nano fluid in hybrid photovoltaic/thermal (PV/T) solar systems. Renew. Energy 2022, 188, 114–131. [Google Scholar] [CrossRef]
  2. Todde, G.; Murgia, L.; Carrelo, I.; Hogan, R.; Pazzona, A.; Ledda, L.; Narvarte, L. Embodied energy and environmental impact of large-power stand-alone photovoltaic irrigation systems. Energies 2018, 11, 2110. [Google Scholar] [CrossRef] [Green Version]
  3. Arnaoutakis, N.; Souliotis, M.; Papaefthimiou, S. Comparative experimental Life Cycle Assessment of two commercial solar thermal devices for domestic applications. Renew. Energy 2017, 111, 187–200. [Google Scholar] [CrossRef]
  4. Souliotis, M.; Arnaoutakis, N.; Panaras, G.; Kavga, A.; Papaefthimiou, S. Experimental study and Life Cycle Assessment (LCA) of Hybrid Photovoltaic/Thermal (PV/T) solar systems for domestic applications. Renew. Energy 2018, 126, 708–723. [Google Scholar] [CrossRef]
  5. Wong, J.H.; Royapoor, M.; Chan, C.W. Review of life cycle analyses and embodied energy requirements of single-crystalline and multi-crystalline silicon photovoltaic systems. Renew. Sustain. Energy Rev. 2016, 58, 608–618. [Google Scholar] [CrossRef]
  6. Carnevale, E.; Lombardi, L.; Zanchi, L. Life cycle assessment of solar energy systems: Comparison of photovoltaic and water thermal heater at domestic scale. Energy 2014, 77, 434–446. [Google Scholar] [CrossRef]
  7. Ehtiwesh, I.A.S.; Coelho, M.C.; Sousa, A.C.M. Exergetic and environmental life cycle assessment analysis of concentrated solar power plants. Renew. Sustain. Energy Rev. 2016, 56, 145–155. [Google Scholar] [CrossRef]
  8. Santoyo-Castelazo, E.; Solano-Olivares, K.; Martínez, E.; García, E.O.; Santoyo, E. Life cycle assessment for a grid-connected multi-crystalline silicon photovoltaic system of 3 kWp: A case study for Mexico. J. Clean. Prod. 2021, 316, 128314. [Google Scholar] [CrossRef]
  9. Krebs-Moberg, M.; Pitz, M.; Dorsette, T.L.; Gheewala, S.H. Third generation of photovoltaic panels: A life cycle assessment. Renew. Energy 2021, 164, 556–565. [Google Scholar] [CrossRef]
  10. Li, Z.; Zhang, W.; Xie, L.; Wang, W.; Tian, H.; Chen, M.; Li, J. Life cycle assessment of semi-transparent photovoltaic window applied on building. J. Clean. Prod. 2021, 295, 126403. [Google Scholar] [CrossRef]
  11. Tirupati Rao, V.; Sekhar, Y.R. Comparative analysis on embodied energy and CO2 emissions for stand-alone crystalline silicon photovoltaic thermal (PVT) systems for tropical climatic regions of India. Sustain. Cities Soc. 2022, 78, 103650. [Google Scholar] [CrossRef]
  12. Li, Z.; Zhang, W.; He, B.; Xie, L.; Chen, M.; Li, J.; Zhao, O.; Wu, X. A Comprehensive life cycle assessment study of innovative bifacial photovoltaic applied on building. Energy 2022, 245, 123212. [Google Scholar] [CrossRef]
  13. Goel, S.; Sharma, R.; Jena, B. Life cycle cost and energy assessment of a 3.4 kWp rooftop solar photovoltaic system in India. Int. J. Amb. Energy 2022, 43, 1913221. [Google Scholar] [CrossRef]
  14. Jurčević, M.; Nižetić, S.; Čoko, D.; Arıcı, M.; Hoang, A.T.; Giama, E.; Papadopoulos, A. Techno-economic and environmental evaluation of photovoltaic-thermal collector design with pork fat as phase change material. Energy 2022, 254, 124284. [Google Scholar] [CrossRef]
  15. Lamnatou, C.; Notton, G.; Chemisana, D.; Cristofari, C. Life cycle analysis of a building-integrated solar thermal collector, based on embodied energy and embodied carbon methodologies. Energy Build. 2014, 84, 378–387. [Google Scholar] [CrossRef]
  16. Hassani, S.; Saidur, R.; Mekhilef, S.; Taylor, R.A. Environmental and exergy benefit of nanofluid-based hybrid PV/T systems. Energy Convers. Manag. 2016, 123, 431–444. [Google Scholar] [CrossRef]
  17. Ren, M.; Mitchell, C.R.; Mo, W. Dynamic life cycle economic and environmental assessment of residential solar photovoltaic systems. Sci. Total Environ. 2020, 722, 137932. [Google Scholar] [CrossRef]
  18. Bahlawan, H.; Poganietz, W.R.; Spina, P.R.; Venturini, M. Cradle-to-gate life cycle assessment of energy systems for residential applications by accounting for scaling effects. Appl. Therm. Eng. 2020, 171, 115062. [Google Scholar] [CrossRef]
  19. Herrando, M.; Elduque, D.; Javierre, C.; Fueyo, N. Life cycle assessment of solar energy systems for the provision of heating, cooling and electricity in buildings: A comparative analysis. Energy Convers. Manag. 2022, 257, 115402. [Google Scholar] [CrossRef]
  20. Morini, A.A.; Hotza, D.; Ribeiro, M.J. Embodied energy and carbon footprint comparison in wind and photovoltaic power plants. Int. J. Energy Environ. Eng. 2022, 13, 457–467. [Google Scholar] [CrossRef]
  21. Khanjari, Y.; Pourfayaz, F.; Kasaeian, A.B. Numerical investigation on using of nanofluid in a water-cooled photovoltaic thermal system. Energy Convers. Manag. 2016, 122, 263–278. [Google Scholar] [CrossRef]
  22. Yazdanifard, F.; Ameri, M.; Ebrahimnia-Bajestan, E. Performance of nanofluid-based photovoltaic/thermal systems: A review. Renew. Sustain. Energy Rev. 2017, 76, 323–352. [Google Scholar] [CrossRef]
  23. Fayaz, H.; Nasrin, R.; Rahim, N.A.; Hasanuzzaman, M. Energy and exergy analysis of the PVT system: Effect of nanofluid flow rate. Sol. Energy 2018, 169, 217–230. [Google Scholar] [CrossRef]
  24. Abdallah, S.R.; Saidani-Scott, H.; Abdellatif, O.E. Performance analysis for hybrid PV/T system using low concentration MWCNT (water-based) nanofluid. Sol. Energy 2019, 181, 108–115. [Google Scholar] [CrossRef]
  25. Alous, S.; Kayfeci, M.; Uysal, A. Experimental investigations of using MWCNTs and graphene nanoplatelets water-based nanofluids as coolants in PVT systems. Appl. Therm. Eng. 2019, 162, 114265. [Google Scholar] [CrossRef]
  26. Sangeetha, M.; Manigandan, S.; Ashok, B.; Brindhadevi, K.; Pugazhendhi, A. Experimental investigation of nanofluid based photovoltaic thermal (PV/T) system for superior electrical efficiency and hydrogen production. Fuel 2021, 286, 119422. [Google Scholar] [CrossRef]
  27. Chow, T.T.; Pei, G.; Fong, K.F.; Lin, Z.; Chan, A.L.S.; Ji, J. Energy and exergy analysis of photovoltaic-thermal collector with and without glass cover. Appl. Energy 2009, 86, 310–316. [Google Scholar] [CrossRef]
  28. Kline, S.J.; McClintock, F.A. Describing uncertainties in single-sample experiments. Mech. Eng. 1953, 75, 3–8. [Google Scholar]
  29. SimaPro. User’s Manual; Pre Consultants BV: Amersfoort, The Netherlands, 2007. [Google Scholar]
  30. Meyer, L.; Tsatsaronis, G.; Buchgeister, J.; Schebek, L. Exergoenvironmental analysis for evaluation of the environmental impact of energy conversion systems. Energy 2009, 34, 75–89. [Google Scholar] [CrossRef]
  31. ISO 14040; Environmental Management-Life Cycle Assessment-Principles and Framework. ISO (International Organization for Standardization): Geneva, Switzerland, 2006.
  32. ISO 14044; Environmental Management-Life Cycle Assessment-Requirements and Guidelines. ISO (International Organization for Standardization): Geneva, Switzerland, 2006.
  33. Pantzali, M.N.; Kanaris, A.G.; Antoniadis, K.D.; Mouza, A.A.; Paras, S.V. Effect of nanofluids on the performance of a miniature plate heat exchanger with modulated surface. Int. J. Heat Fluid Flow 2009, 30, 691–699. [Google Scholar] [CrossRef]
  34. Shalaby, S.M.; Elfakharany, M.K.; Moharram, B.M.; Abosheiasha, H.F. Experimental study on the performance of PV with water cooling. Energy Rep. 2022, 8, 957–961. [Google Scholar] [CrossRef]
  35. Zilli, B.M.; Lenz, A.M.; de Souza, S.N.M.; Secco, D.; Nogueira, C.E.C.; Junior, O.H.A.; Nadaleti, W.C.; Siqueira, J.A.C.; Gurgacz, F. Performance and effect of water-cooling on a microgeneration system of photovoltaic solar energy in Paraná Brazil. J. Clean. Prod. 2018, 192, 477–485. [Google Scholar] [CrossRef]
  36. Nasrin, R.; Rahim, N.A.; Fayaz, H.; Hasanuzzaman, M. Water/MWCNT nanofluid based cooling system of PVT: Experimental and numerical research. Renew. Energy 2018, 121, 286–300. [Google Scholar] [CrossRef]
  37. Naghdbishi, A.; Yazdi, M.E.; Akbari, G. Experimental investigation of the effect of multi-wall carbon nanotube–Water/glycol based nanofluids on a PVT system integrated with PCM-covered collector. Appl. Therm. Eng. 2020, 178, 115556. [Google Scholar] [CrossRef]
  38. Gundala, S.; Basha, M.M.; Madhurima, V.; Praveena, N.; Kumar, S.V. An experimental performance on solar photovoltaic thermal collector with nanofluids for sustainable development. J. Nanomater. 2021, 2021, 6946540. [Google Scholar] [CrossRef]
  39. Hassan, A.; Wahab, A.; Qasim, M.A.; Janjua, M.M.; Ali, M.A.; Ali, H.M.; Jadoon, T.R.; Ali, E.; Raza, A.; Javaid, N. Thermal management and uniform temperature regulation of photovoltaic modules using hybrid phase change materials-nanofluids system. Renew. Energy 2020, 145, 282–293. [Google Scholar] [CrossRef]
  40. Goedkoop, M.; Spriensma, R. The Eco-Indicator 99: A Damage Oriented Method for Life Cycle Impact Assessment. 2000. Available online: www.pre.nl (accessed on 31 October 2022).
  41. Tiwari, A.; Raman, V.; Tiwari, G.N. Embodied energy analysis of hybrid photovoltaic thermal (PV/T) water collector. Int. J. Ambien. Energy 2007, 28, 181–188. [Google Scholar] [CrossRef]
  42. Chow, T.T.; Ji, J. Environmental life-cycle analysis of hybrid solar photovoltaic/thermal systems for use in Hong Kong. Int. J. Photoenergy 2012, 2012, 101968. [Google Scholar] [CrossRef]
  43. Kim, B.J.; Lee, J.Y.; Kim, K.H.; Hur, T. Evaluation of the environmental performance of sc-Si and mc-Si PV systems in Korea. Sol. Energy 2014, 99, 100–114. [Google Scholar] [CrossRef]
  44. Chen, W.; Hong, J.; Yuan, X.; Liu, J. Environmental impact assessment of monocrystalline silicon solar photovoltaic cell production: A case study in China. J. Clean. Prod. 2016, 112, 1025–1032. [Google Scholar] [CrossRef]
  45. Hou, G.; Sun, H.; Jiang, Z.; Pan, Z.; Wang, Y.; Zhang, X.; Zhao, Y.; Yao, Q. Life cycle assessment of grid-connected photovoltaic power generation from crystalline silicon solar modules in China. Appl. Energy 2016, 164, 882–890. [Google Scholar] [CrossRef]
  46. Sagani, A.; Mihelis, J.; Dedoussis, V. Techno-economic analysis and life-cycle environmental impacts of small-scale building-integrated PV systems in Greece. Energy Build. 2017, 139, 277–290. [Google Scholar] [CrossRef]
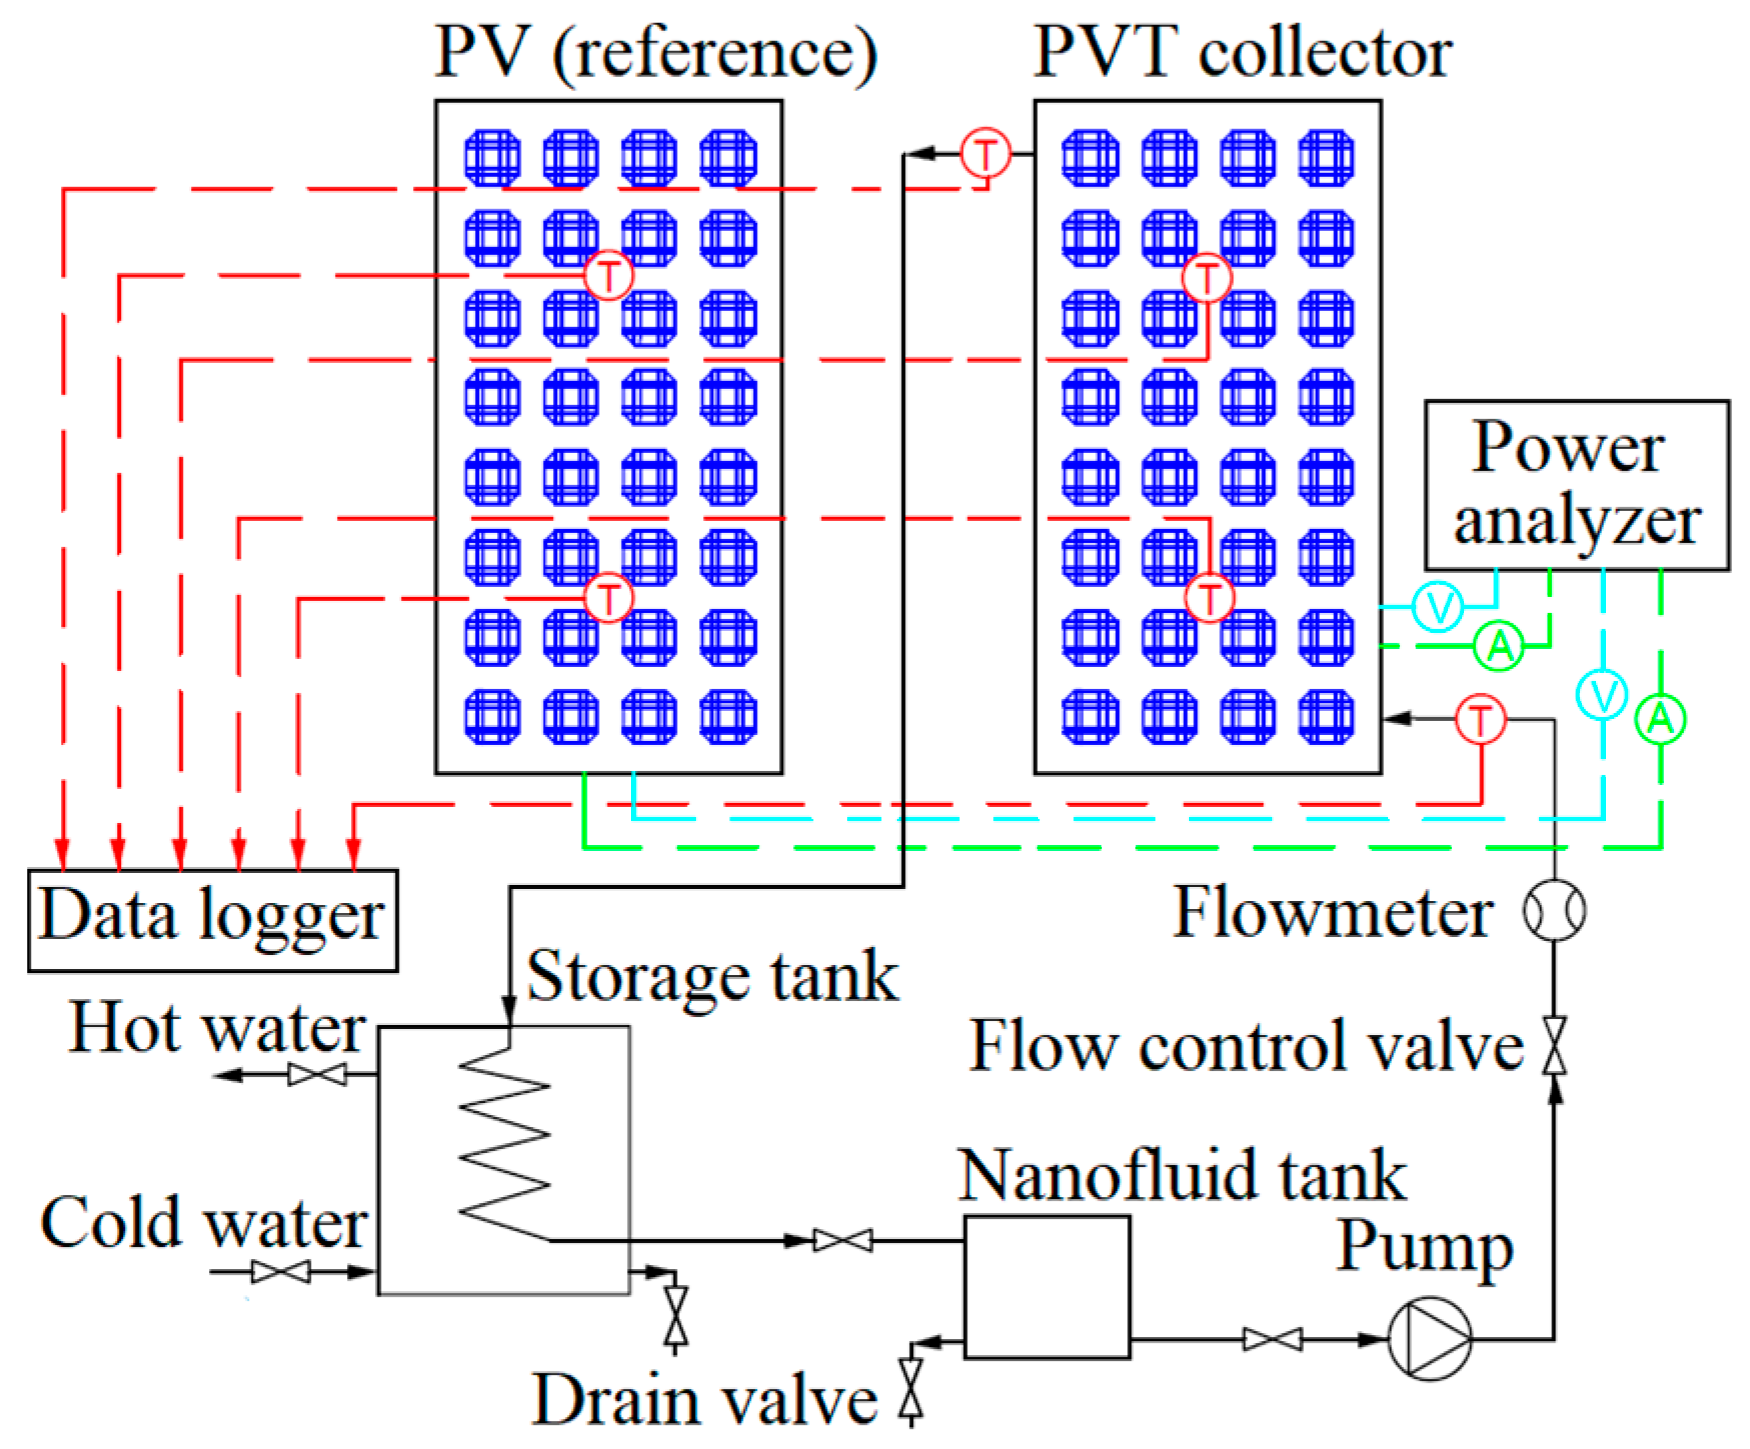
Figure 1. Flow chart of the experimental setup for the PV module and PV/T collector.
Processes 11 00832 g001
Figure 2. TEM images of nanoparticles and the nanofluids: (a) GNP and (b) MWCNT [25].
Processes 11 00832 g002
Figure 3. Flow chart of the experimental setup for the PV module and PV/T collector.
Processes 11 00832 g003
Figure 4. Changes in temperature at different flow rates for distilled water.
Processes 11 00832 g004
Figure 5. Changes in solar radiation and ambient temperature in the experiments selected with the same conditions at a flow rate of 0.5 L/min.
Processes 11 00832 g005
Figure 6. Change in the electrical power rate produced by PV as a module and a system.
Processes 11 00832 g006
Figure 7. Changes in efficiency for the PV module and PV/T systems with different nanofluids.
Processes 11 00832 g007
Figure 8. Percentage changes in the environmental impact vs. embodied energy in the components of the experimental setup.
Processes 11 00832 g008
Figure 9. Percentage changes in environmental impact vs. embodied energy in the components of the experimental setup.
Processes 11 00832 g009
Table 1. Experimental uncertainty values of the measurement instruments [25].
EquipmentParameterMaximum Experimental Uncertainty
Pyranometer
(MS-602, EKO instruments)
Solar irradiance±5.2 W/m2
K-types thermocoupleTemperature±0.6 °C
Flowmeter
(YF-S201, Sea company)
Volumetric flow rate±0.003 L/min
Data collecting boardVoltage±0.06 V
(USB TC-08, Pico)Current±0.02 A
Table 2. Components and their material weights of the whole PV/T system.
PV/T System
(0.23146 m2)
Water (Storage) Tank
(30 L)
Nanofluid Tank
(6 L)
Pump
(2.55 kg)
Support SystemOther Parts
MaterialMass (kg)MaterialMass (kg)MaterialMass (kg)MaterialMass (kg)MaterialMass (kg)MaterialMass (kg)
Solar glass2.93Main frame (galvanized iron)2.35Main frame (galvanized iron)2.76Copper0.20Main frame (galvanized iron)7.15Copper1.25
PV cell0.02Insulation (PUR)1.03Insulation (PUR)1.23Steel0.68 Plastic tube2.55
Back sheet0.13Water30.17Water5.982Cast iron1.63 Insulation (PUR)0.97
Only PV module3.08 Aluminum0.03
PV frame (aluminum)4.32 Plastic cover0.01
Tube (copper)3.525
Sheet (copper)3.525
Main frame (galvanized iron)2.33
Insulation (PUR)1.73
Water1.85
Only thermal system17.28
Total weight20.36 33.55 9.97 2.55 7.15 4.77
Table 3. The points and energies per unit in kg used in the LCA and CED analyses.
ComponentsIndicators for the LCA AnalysisEnergy for the CED AnalysisProcessing Details
Material (mPts/kg)Process (mPts/kg)Disposal (mPts/kg)Energy per Unit
(MJ/kg)
PV module
Solar glass (40.4%)58.000.002.2015.00-
PV cell (2%)58.0010.002.2039714.50Electricity roof, packing glass
Backsheet (Polyethylene) (1.2%)360.0035.90−1.0032.88Blow foil extrusion, injection molding, milling/turning/drilling, and pressure forming
PV/T system
Tube (Copper) (23%)1400.0072.000.0057.00Extruction
Water (6%)0.030.000.009.20-
Insulation (PUR) (5.6%)420.0035.903.10101.50Blow foil extrusion, injection molding, milling/turning/drilling, and pressure forming
Frame (aluminum) (14.1%)780.0074.70−23.00218.00Extruction, bending, shearing/stamping, spot welding
Galvanized iron (%0.5 zinc coating steel) (7.6%)241.70243.50−5.6134.80Sheet production, shearing/stamping, bending, and band zinc coating
Water tank
Galvanized iron (%0.5 zinc coating steel)241.70243.50−5.6134.80Sheet production, shearing/stamping, bending, and band zinc coating
Insulation (PUR)420.0035.903.10101.50Blow foil extrusion, injection molding, milling/turning/drilling, and pressure forming
Water0.030.000.009.20
Nanofluid tank
Galvanized iron (%0.5 zinc coating steel)241.70243.50−5.6134.80Sheet production, shearing/stamping, bending, and band zinc coating
Insulation (PUR)420.0035.903.10101.50Blow foil extrusion, injection molding, milling/turning/drilling, and pressure forming
Water0.030.000.009.20
Pump
Copper (8%)1400.0072.00−23.0057.00Extruction
Steel (26.5%)86.0030.000.0035.40Sheet production, shearing/stamping, and bending
Cast iron (64%)240.005.300.0034.80Heat gas (industrial furnace)
Aluminum (1%)780.0074.70−23.00218.00Extruction, bending, shearing/stamping, and spot welding
Plastic cover (0.5%)380.0035.903.1077.70Blow foil extrusion, injection molding, milling/turning/drilling, and pressure forming
Support structure
Galvanized iron (%0.5 zinc coating steel)241.70243.50−5.6134.80Sheet production, shearing/stamping, bending, and band zinc coating
Other pieces
Plastic tube (53.5%)240.0035.903.10101.50Blow foil extrusion, injection molding, milling/turning/drilling, and pressure forming
Copper (26.2%)1400.0072.000.0057.00Extruction
Insulation (PUR) (20.3%)420.0035.903.10101.50Blow foil extrusion, injection molding, milling/turning/drilling, and pressure forming
Note: The energies per unit for the graphene nanoplatelets and MCWNT are 260.41 and 295 MJ/kg, respectively.
Table 4. General results of the thermal, LCA, and CED analyses for the experimental setup.
Parameters\NanofluidsDistilled WaterMWCNT/Water MixtureGraphene Nanoplatelets/Water Mixture
Electrical efficiency of PV, %13.513.614.4
Total efficiency of PV/T, %39.542.645.7
Daily instant power, W22.1323.2523.88
Total embodied energy, MJ3975.884081.064077.86
Energy return factor (ERF)1.761.801.85
Energy payback time (EPT), year11.3911.1310.83
Environmental impact of electricity produced (EIE), Pts/kWh0.0460.0440.043
Table 5. A comparison of the LCA analysis results of the presented study with those of studies in the literature.
AuthorsLocationPV Type—SystemEfficiency
%
System Lifetime
(Year)
Embodied Energy
CED
Energy Payback Time (Years)Other Results
Tiwari et al. [41]New Delhi and Leh, IndiaMonocrystalline silicon PV–PV/T system with and without glazed11-4968–7480.8 MJ/m211.4–14.33Energy return on investment (dimensionless) 2.4–6.6
Chow and Ji [42]Hong Kongbuilding-integrated PV/T system13-4690.8–6220.8 MJ/m22.8- 3.8Energy return on investment (dimensionless) 5.9–8
Embodied emissions 297 g CO2.eq/m2
Kim et al. [43]South KoreaMulti-crystalline silicon PV14.91250.44 MJ/kWh3.68Global warming potential 31.5 g CO2.eq/kWh
Monocrystalline silicon PV15.96300.56 MJ/kWh4.65Global warming potential 41.8 g CO2.eq/kWh
Chen et al. [44]ChinaMonocrystalline silicon PV15.725-0.42–0.91GHG 5.60–12.07 g CO2/kWh
Hou et al. [45]Northwest China and East ChinaMonocrystalline silicon PV15251123–1186 MJ/m21.7–2.3GHG 65.2–87.3 g CO2/kWh
Multi-crystalline silicon PV17.5251034–1094
MJ/m2
1.6–2.1GHG 60.1–80.5 g CO2/kWh
Sagani et al. [46]Athens, GreecePolycrystalline silicon PV14.425-1.8–4.1CO2 payback time 1.5–3.5 years
Environmental benefits of PV are between 3.85–19.55 tons CO2.eq/year compared with the conventional technology
This studyTurkeyMonocrystalline silicon PV–PV/T system13.5–14.4253975 MJ, 4077 MJ, and 4081 MJ for water, graphene, and MWCNT, respectively11.39, 10.83, and 11.13 for water, graphene, and MWCNT, respectively.Energy return on investment values were 1.76, 1.85, and 1.80; environmental impacts of electricity produced were 0.046, 0.043, and 0.044 Pts/kWh; and total efficiencies were 39.5%, 45.7%, and 42.6%, for water, graphene, and MWCNT, respectively
Disclaimer/Publisher’s Note: The statements, opinions and data contained in all publications are solely those of the individual author(s) and contributor(s) and not of MDPI and/or the editor(s). MDPI and/or the editor(s) disclaim responsibility for any injury to people or property resulting from any ideas, methods, instructions or products referred to in the content.