Article

Evaluation of Resource Utilization Efficiency in the Machining Process Based on the SBM-DEA Model with Non-Expected Output

1
School of Information Management, Wuhan University, Wuhan 430072, China
2
School of Mechanical and Electrical Engineering, Wuhan University of Technology, Wuhan 430070, China
*
Author to whom correspondence should be addressed.
Processes 2023, 11(3), 916; https://doi.org/10.3390/pr11030916
Submission received: 22 February 2023 / Revised: 10 March 2023 / Accepted: 14 March 2023 / Published: 17 March 2023
(This article belongs to the Special Issue Waste-to-Energy Challenges for the Valorization of Industrial Wastes)

Abstract

:
As one of the basic industries in the manufacturing industry, the modeling and evaluation of resource utilization efficiency in the machining process is the premise of energy conservation and consumption reduction in the manufacturing industry. Mechanical processing is the process of using resources to change the shape and performance of the blank to form the workpiece and generate emissions. However, the current research on the utilization of machining process resources, whether focusing on energy efficiency or emissions, cannot provide a comprehensive solution to this problem. Therefore, this paper proposes a Data Envelopment Analysis (DEA) model with a slacks-based measure (SBM) to evaluate the resource utilization efficiency of a machining process with non-expected output. Through the relative effectiveness of DEA, the resource utilization efficiency of each processing process can be compared, which can provide a feasible and specific method for enterprises to evaluate their existing processing processes from the perspective of reducing unexpected output. In this case, the input-output model of the machining process is used to analyze the processed resource list. Then the mathematical model of each process in the processing process is established, and the dynamic resources are determined quantitatively. Finally, the accuracy of the method is verified by combining the resource utilization efficiency of each working procedure in the shaft gear machining process of an enterprise.

1. Introduction

The process of machining is the use of resources to change the size, shape, or performance of the blank to form the workpiece and generate emissions. It is composed of a series of technological processes, including turning, drilling, boring, planning, grinding, finishing, and thread processing. There are many kinds of resources involved in the mechanical manufacturing process: complex processes, large dynamic changes, and many random factors. Under the severe situation of global resource depletion, rising energy prices, and climate warming, it is of great significance to analyze the resource allocation of machining processes and improve the resource utilization efficiency of machining processes [1].
According to the characteristics of energy consumption in machining processes, the mathematical models of energy consumption in machining processes can be divided into three types: the linear cutting energy consumption model based on material removal rate (MRR), the parametric cutting energy consumption model, and the process-oriented energy consumption model [2]. Among them, the linear cutting energy consumption model based on MRR is relatively more widely used [3]. However, one of the problems is that the parameters for calculating MRR include cutting speed, feed speed, and cutting depth; therefore, even different processing parameters may get the same MRR. The parameter-based cutting energy consumption model can be further divided into four mathematical models: metal deformation [4], tool wear [5], cutting force [6], and cutting parameters [7]. Compared with the previous two models, the process-oriented machining energy consumption model can better reflect the higher reference value of the actual machining process. Lin Shenlong [8] decomposed the energy consumption according to the running process of the machine tool, modeled and estimated the energy consumption of each process of the machine tool, improved the processing plan according to the estimation result, and finally improved the energy utilization rate by 10%. Seow [9] lists and compares various existing energy consumption simulation software on the market in this paper, which can be directly referred to the literature. The method of quantitative analysis can accurately simulate and calculate the energy consumption of the machining process. However, there are many kinds of resources involved in the machining process. Besides energy, other resources such as the output, quality, working hours, and emission of the workpiece should also be taken into account. Therefore, based on the characteristics of machining and the deficiencies of existing research, this paper adopts a Slacks-Based Measure-Data Envelopment Analysis (SBM-DEA) model with non-expected output to evaluate the resource utilization efficiency of the machining process.
DEA is an efficiency evaluation method proposed by American operations research scientists Charnes et al. [10]. Its characteristics and advantages of multi-input and multi-output make it an important analysis method in the field of management. It measures the relative efficiency of decision-making units (DMUs) with a plurality of inputs and outputs by a mathematical programming method; the relative efficiency of the same kind of decision making units can be evaluated by determining whether a DMU is on the frontier of efficiency. The basic principle of the DEA method is to take the weight of all inputs and outputs of DMU as the variable to determine the effective production frontier. Whether each DMU is DEA efficient depends on its relative efficiency value, which can be determined according to its distance to the frontier as well as its needed improvement degree. Because the DEA method is based on the concept of relative efficiency and takes the input and output parameters of each DMU as the object to calculate the maximum possible efficiency for each DMU, it does not require the dimensionless parameter and does not have to pre-determine the weight of parameters. Meanwhile, it sets a goal of maximizing the efficiency of DMU and is adaptive to determine weight value by DMU input and output data and certain constraint conditions, so it can be used to evaluate the state of a complex system. Moreover, the DEA method can also avoid subjective factors and simplify the process [11]. The DEA method does not focus on the specific operation within the system; it mainly focuses on the input and output of DMU. It analyzes the efficiency change through the relative comparison, so it is appropriate for the condition evaluation of complex systems with multiple inputs and outputs. It has been proven that DEA is an effective analytic tool for complex systems, and its corresponding CCR, BCC, and other models are widely used in the performance evaluation of complex systems. At present, DEA technology has been applied in many industries, including cost efficiency analysis of bank branch performance [12], machine factory performance [13], environmental efficiency analysis [14], and green degree evaluation of machining processes [15]. For solving the system evaluation problem of multi-input and multi-output, the advantages of the DEA method mainly include: (1) the efficiency of Decision Making Units (DMU) can be measured by considering any number of input and output, which can be asymmetric (that is, input and output do not need to be in corresponding units); (2) there is no need to determine the weight between indicators, so this method avoids the influence of subjective factors to a large extent and is suitable for evaluating the relative effectiveness of multiple inputs, especially multiple outputs; (3) DEA generates a single efficiency value for each DMU, making the analysis results easy to understand and communicate; (4) DEA includes non-discretionary inputs, which are not controlled by DMU but affect its ability to create output. There are many kinds of resources involved in the machining process, and the process is complex, which just belongs to the process of multi-input and multi-output. Therefore, the machining process is decomposed into multiple DMUs according to the process, and the multiple resources involved in the processing are used as the input and output of DEA to evaluate the relative efficiency of resource utilization in the machining process [16].
The following content of the paper is arranged as follows: the DEA method is briefly introduced in Section 2, Section 3 includes an analysis of the dynamic change of the processing process and described the corresponding quantitative model. The resource efficiency analysis case of shaft gear processing is introduced in Section 4, and the conclusion is given in Section 5.

2. Resource Utilization Efficiency Evaluation Method

2.1. Traditional DEA Model—CCR Model

Assume that there are n-types of products to be analyzed and that they correspond to n-DMUs. Each DMUj (j = 1, 2,… n) has m input indexes and s output indexes. For a specific product (DMUj), then input and output are:
x j = ( x 1 j , x 2 j , , x m j ) T ,   x i j > 0 y j = ( y 1 j , y 2 j , , y s j ) T ,   y r j > 0 i = 1 , 2 , , m ; r = 1 , 2 , , s ; j = 1 , 2 , , n
Accordingly, based on the convexity, cone, invalidity, minimal axiom hypothesis, and infinitesimal ( ε ) , the CCR model of reliability of DMUs is established as:
( D C 2 R ) { min [ θ ϵ ( e T s + e + T s + ) ] , s . t . j = 1 n x j λ j + s = θ x j 0 , j = 1 n y j λ j s + = y j 0 , λ j 0 , j = 1 , 2 , , n , s + 0 , s 0
where s and s+ are slack variables representing the input redundancy and output deficiency, respectively, the infinitesimal ε can be set as 10−6, and θ (0 < θ ≤ 1) is the evaluation result of DEA effectiveness for a specific DMU under given input and output parameters [17].

2.2. DEA Model with Unexpected Output

When using the DEA method to evaluate the production or operation efficiency of an economic system, it is generally believed that the greater the system’s output, the better its efficiency. However, the actual production process will not only produce the expected effective output but also produce some unexpected pollutants, such as waste gas and waste scrap. If these pollutants are regarded as outputs, it means that additional human, material, and financial resources need to be spent to deal with the negative impact of these pollutants. Therefore, some researchers proposed to use these unexpected pollutants as inputs and raw materials and profits as outputs to evaluate the efficiency of DMU. Although it is meaningful to use waste as input from the perspective of the model, waste is actually a by-product of the system. In this case, a DEA model with unexpected output can solve this contradiction [18].
Suppose there are n decision units and n ¯ sample units, or criteria, in a system. Among them, the characteristics of each unit can be characterized by m kinds of input indicators, s kinds of expected output indicators (indicators of expected growth), and k kinds of non-expected output indicators (indicators reflecting negative effects). For a specific product (DMUj), the input, expected output, and unexpected output are [16]:
x j ¯ = ( x 1 j ¯ , x 2 j ¯ , , x m j ¯ ) T ,   x ¯ i j > 0 y j ¯ = ( y 1 j ¯ , y 2 j ¯ , , y s j ¯ ) T ,   y ¯ r j > 0 z j ¯ = ( z 1 j ¯ , z 2 j ¯ , , z k j ¯ ) T ,   z ¯ q j > 0 i = 1 , 2 , , m ; r = 1 , 2 , , s ; q = 1 , 2 , , k ; j = 1 , 2 , , n
Accordingly, the CCR model with unexpected output of reliability of DMUs is established as:
D , { m i n θ , s . t .   x p ( θ λ 0 ) j = 1 n ¯ x ¯ j λ j s = 0 , y p ( λ 0 1 ) + j = 1 n ¯ d y j ¯ λ j s + = 0 , z p ( 1 λ 0 ) j = 1 n ¯ z j ¯ λ j t = 0 , λ j 0 , j = 0 , 1 , , n ¯ + 1 , s + 0 , s 0 , t 0 .
where s, s+, and t are slack variables representing the input redundancy, expected output deficiency, and unexpected output redundancy, respectively. λ 0 is introduced in order to prevent possible cases of no solution. Θ (0 < θ1) is the evaluation result of DEA effectiveness for a specific DMU under given input, expected output, and unexpected output parameters. The larger θ is, the higher the resource utilization efficiency and the more green the process will be [19].

2.3. SBM—DEA with Unexpected Output

The basic DEA model is a type of radial measure, and the characteristic of the radial model is that when the input and output expand or shrink, they all change in the same proportion. If there is non-zero slack, the target value will be overestimated. In order to overcome the above shortcomings, Zhou [20] proposed a general form of a directional distance function that allows input and output to expand or reduce in different proportions. That is, non-expected output is included in the generalized directional distance function. The non-radial distance function containing non-expected output is finally defined as:
D U , { min [ θ ϵ ( e T s + e + T s + ) ] , s . t .   x p ( θ λ 0 ) j = 1 n ¯ x j ¯ λ x 0 , y p ( λ 0 1 ) + j = 1 n ¯ y j ¯ λ y 0 , z p ( 1 λ 0 ) j = 1 n ¯ z j ¯ λ z 0 , λ x , λ y , λ z 0 , x , y , z = 0 , 1 , , n ¯ + 1
By contrast, Equations (4) and (5) reveal the intuitive difference between unradial distance functions and the traditional λ distance functions, which are λo,   λ x , λ y ,   λ z . According to the characteristics of this paper, this non-radial distance function model is used to evaluate resource utilization efficiency [21].

3. Resource Utilization Efficiency of the Machining Process

3.1. Evaluation Model of Resource Utilization in the Machining Process

The machining process is composed of a series of processes, and, taking the cutting process as an example, its process is shown in Figure 1.
The input resources of mechanical processing mainly include raw materials, personnel, machine tools, cutting tools, and the energy needed to start the machine tools. The output includes products or semi-finished products, waste gases, cutting fluids, sewage, other waste liquids, scraps, and noise. From the perspective of green production, it is expected to produce the most products with the fewest resources and produce the fewest emissions, that is, to maximize the utilization efficiency of resources [22].
According to the above analysis, it can be found that the machining process is a process with multiple inputs and outputs. DEA can be used to evaluate the resource utilization efficiency of each process. The mechanical processing process of product generation is regarded as a system that consists of n processes. The input and output of each process are the same, which can be regarded as the DMU of the system. The input index is: people Cr (measured by personnel cost/yuan), raw materials Qm (measured by weight/g), machine consumption Cm (here mainly considering the tool and tool cost to measure/yuan), and energy E (this is mostly electricity/kw·h). The output index is: expected output profit of qualified product or semi-finished product Q (measured in amount/yuan), undesired exhaust gas S (mainly CO2 eq), waste liquid L (mainly cutting fluid/L here), and waste chip Qd (/g), as shown in Table 1.

3.2. Quantitative Model of Input and Output

According to the characteristics of multi-equipment, multi-process, resource and energy consumption, and environmental emission in the machining process and the data characteristics involved in the analysis object of resource and environment list in the evaluation index system, a scientific and reasonable collection and calculation method is developed.
(1)
Process basic information, process conditions, and procedure acquisition methods
① Basic process information: the field record is combined with the processing process card of the enterprise.
② Process conditions and procedures: record the basic information, such as model and specification, of the main equipment and auxiliary equipment used in the processing process on site; main processing parameter information is recorded on site.
(2)
Quantification of input indicators
① Consumption of personnel: using the product of process processing time and personnel cost rate [23].
C r = t × K j = t × C T ,   j = 1 , 2 , , n
t: processing time of step j, unit: min; Kj: personnel cost rate of the step j, unit: yuan/min; C: a worker’s monthly wage, unit: yuan; T: the effective working time of a worker in a month, unit: min.
② Consumption of raw resources: before processing, use the electronic scale to weigh the workpiece.
③ Consumption of the tool: using the ratio of the machining time of each process to the tool’s life and the cost of the tool to measure.
C m = C 2 × t T k
C2: the cost of the tool, unit: yuan; t: the machining time of the step j, unit: s; Tk: the tool life.
④ Power consumption: the power consumption of mechanical processing mainly comes from machine tool work. Therefore, the energy consumed by each process can be calculated by using the energy consumed by the machine during the processing time.
E = P j × t 60
Pj: the machine tool spindle cutting power, unit: kw; t: the processing time of step j, unit: min.
(3)
Quantification of output indicators
① Quantification of profit of semi-finished products: The profit of each process can be multiplied by the ratio of each process to the total working hours and the profit of the workpiece.
M j = M × t T
M: the profit of the workpiece; t: time of the process j; T: the total working hours.
② CO2 emissions: There are many carbon emission sources in mechanical processing. According to the literature [24], based on the life cycle assessment (LCA) of machine tools, the carbon emission sources in machine tools’ processing processes are divided into material carbon emissions, energy carbon emissions, and process carbon emissions. According to the research content of this paper, only the carbon emissions generated by the processing of raw materials should be determined. Gutowski [25] proposed a functional relationship between energy consumption and removal rate in the processing process and established a SEC (remove energy consumed per unit volume of material, unit: J/mm3) model as Equation (10). According to the SEC model, the carbon emission generated by each process can be obtained by combining the material removal amount Vj of each process and with carbon emission coefficient of electricity (the carbon emission coefficient of electric energy adopted in this paper is 1.072 kg.CO2eq/kw·h [26]).
SEC = P M R R
P: cutting power of the machining process, unit: kw; MRR: volume of material removed per unit time [27], unit: m 3 / s , related to the turning back ap, feed f, and the speed of cutting VC.
The carbon emission of each process is calculated as shown in Equation (11).
S = 1.072 × 1000 × S E C j × V j
(4)
Quantification of cutting fluid: Obtained by multiplying the jet flow rate of the cutting fluid with the processing time, as shown in Equation (12).
L = V j 60 × t j
V j : the jet flow rate of the cutting fluid, unit: m 3 / h ; t j : the time of the process j, unit: min.
(5)
Quantification of waste: used an electronic scale to measure the weight before and after the process started, and then the two values were subtracted.
Q d = Q d j Q d j + 1 , j = 1 , 2 , , n
Qdj: the quality before the process j, unit: g; Qdj+1: the quality before the process j + 1 weighed by the electronic scale, unit: g.

4. Case Study

4.1. Basic Information about the Case

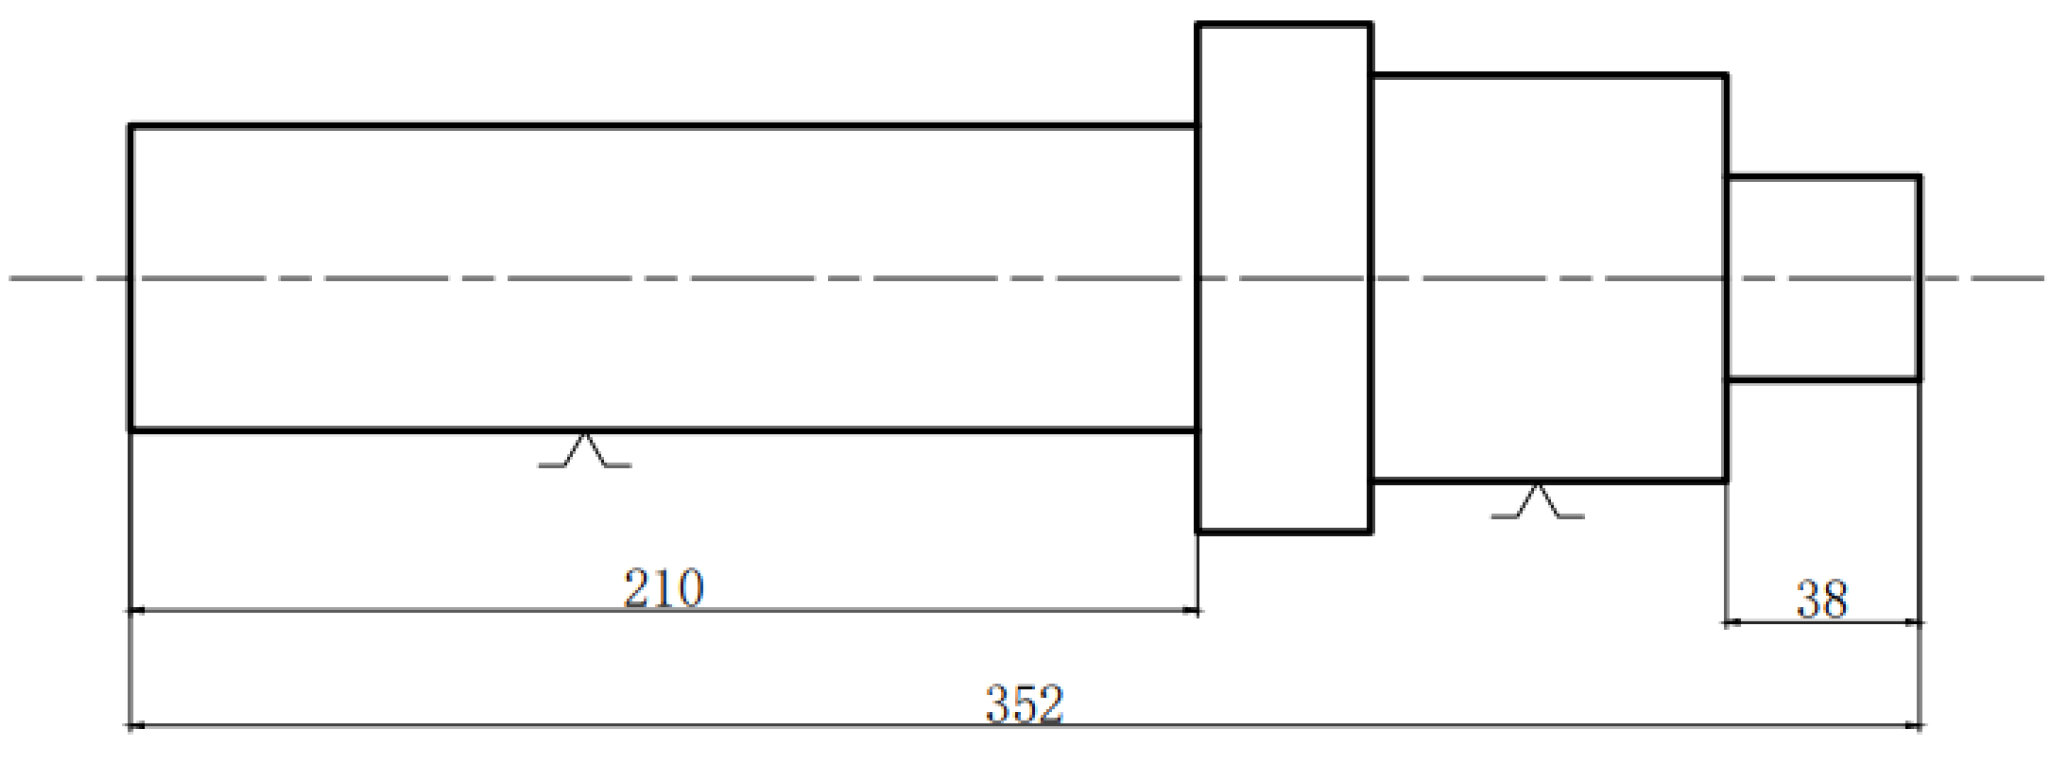
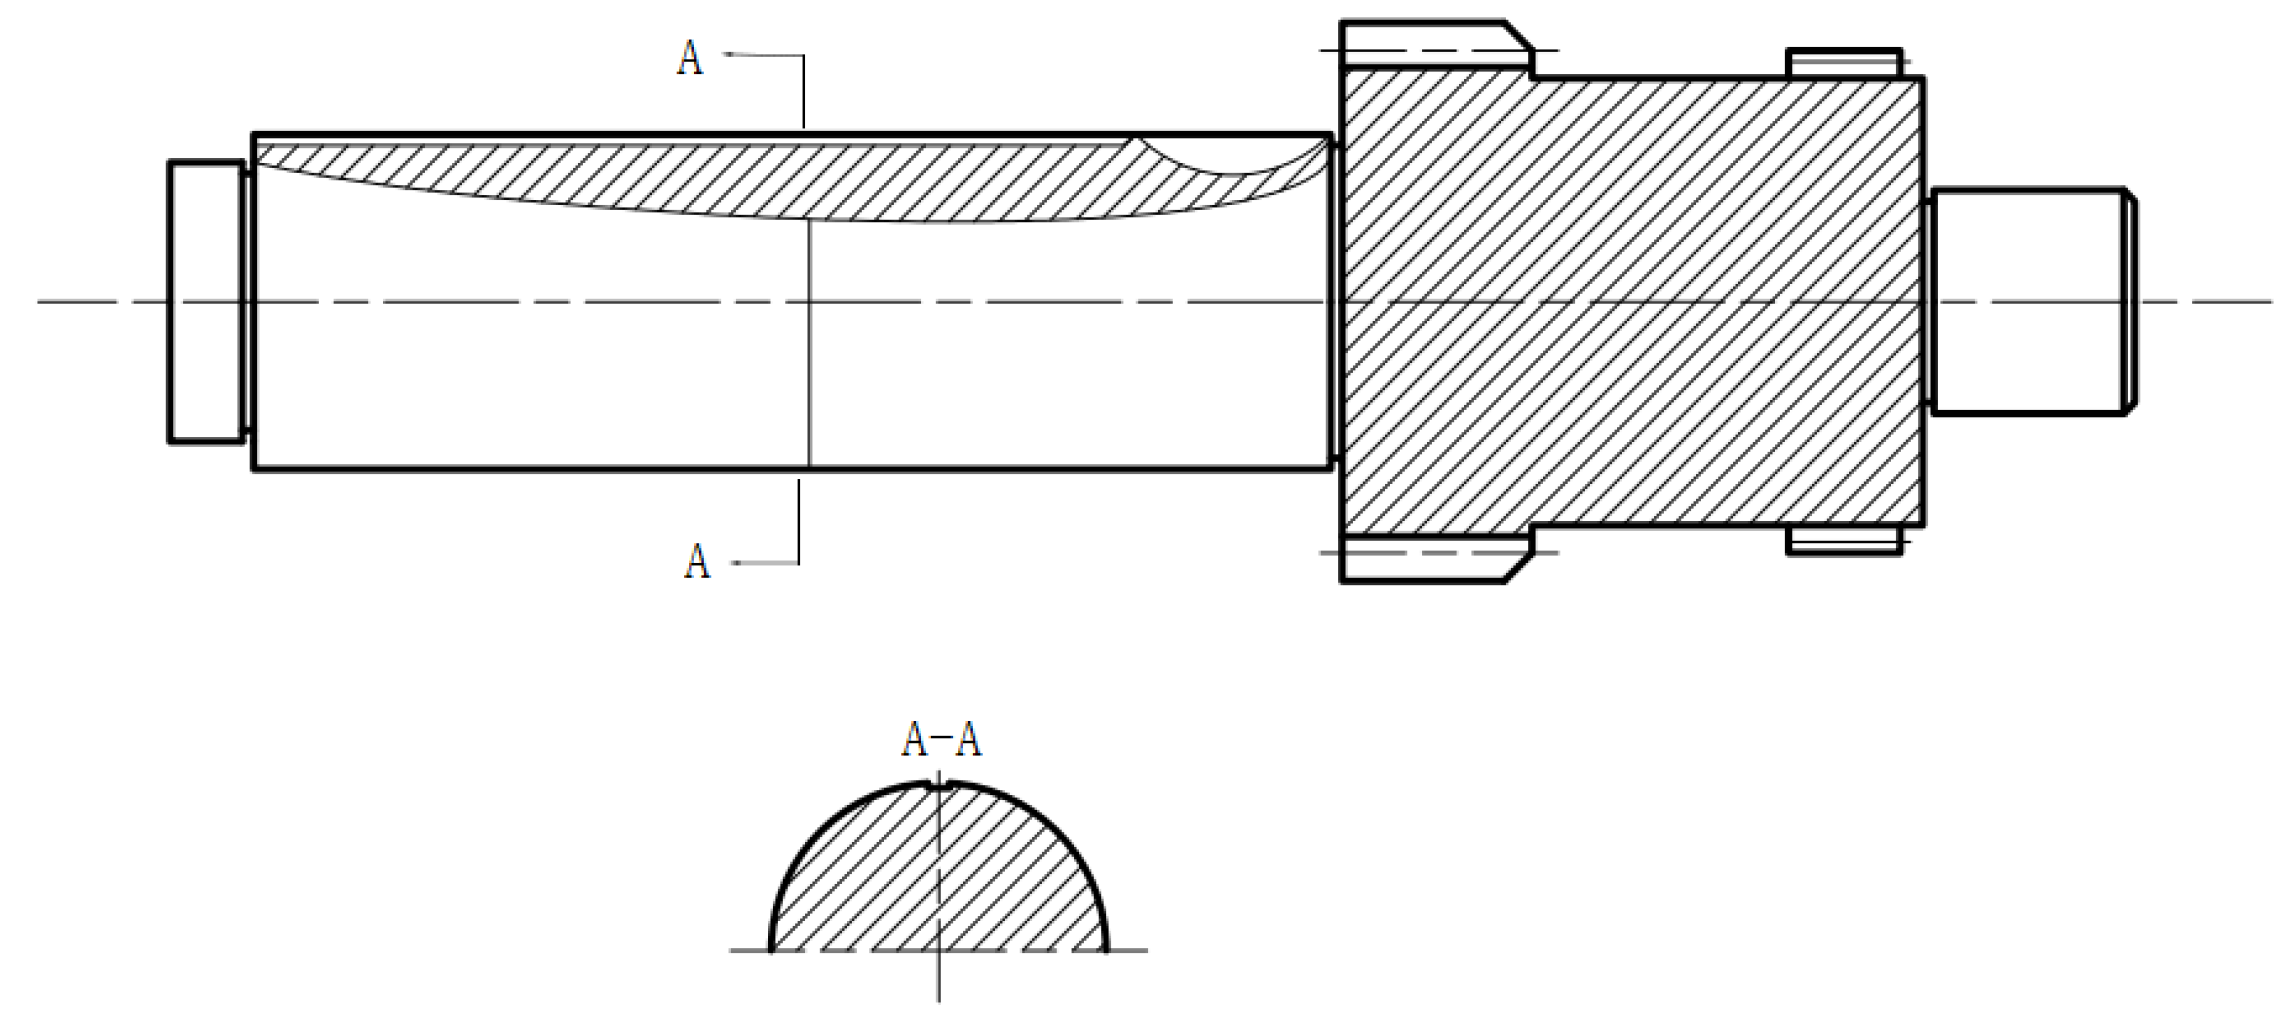
The accuracy of the proposed method is analyzed by taking the manufacturing process of the intermediate shaft of a gear factory as an example. The material of the intermediate shaft is ETN22, and the blank size adopted is shown in Figure 2, the final engineering drawing style of the parts is shown in Figure 3, and the specific processing information is shown in Table 2.

4.2. Data Processing and Analysis

According to the quantitative method of input index and output index discussed in 2.3, the input and output of each process are collected and sorted, as shown in Table 3.
During data processing of the DMUs, some indexes may have a small value, but other indexes might have a large value, resulting in a large difference between various indexes for the same DMU. This condition affects the relative effectiveness analysis of the DMUs. Therefore, it is necessary to normalize the corresponding input and output indexes of each DMU. In this study, tangent function conversion is used for the normalization process [28]:
x * = atan ( x ) 2 / π
where x is the index value of the DMU before normalization, x * is the index value after normalization, and x * [ 0.1 ] .
Then input and output index values are normalized according to Equation (14), and using Matlab to find solutions, the normalized indexes and the solutions for the 17 sample DMUs via the SBM-DEA with an unexpected output model are shown in Table 4.
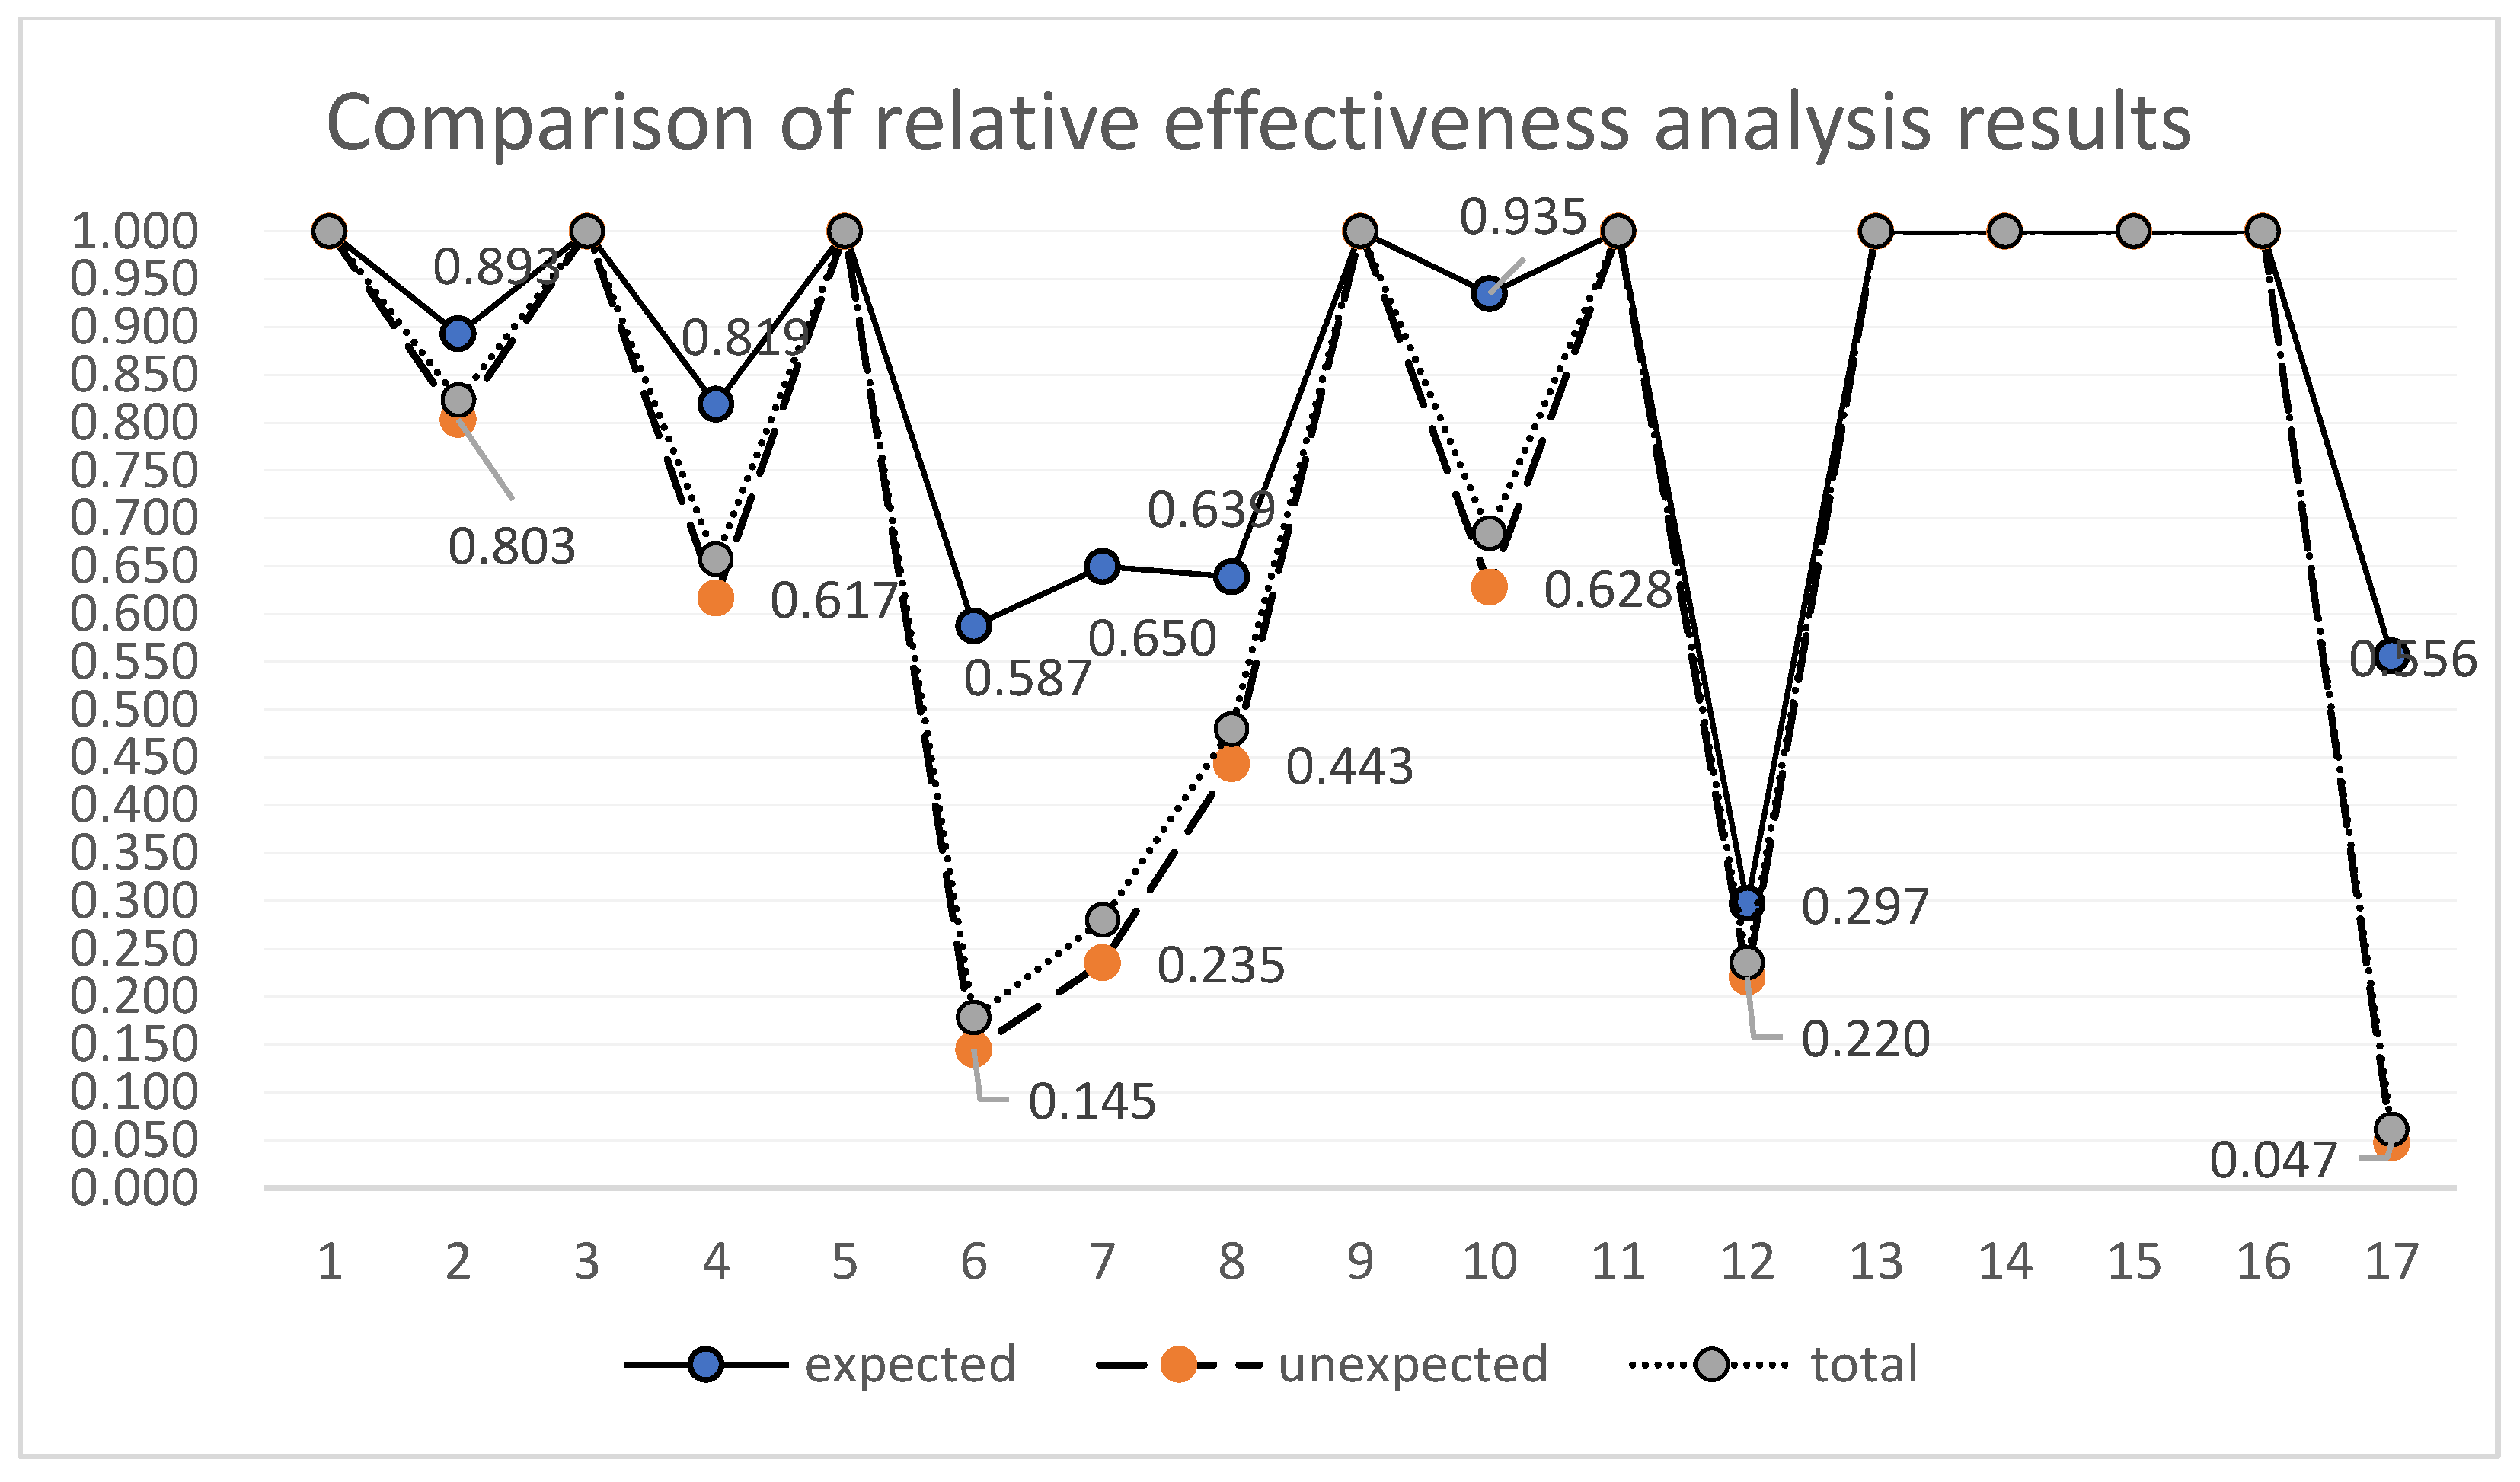
In Table 4, the expected output θ is the DEA efficiency evaluation based on expected output, the unexpected output, θ is the DEA efficiency evaluation based on unexpected output and the Total   θ is the DEA efficiency evaluation based on all output. The comparison between these three values is shown in Figure 4. The comparison aims to determine the efficiency based on these three.

4.3. Results and Discussion

It can be seen from Table 4 that DMU1 (rough milling face), DMU2 (turning2), DMU4 (drilling), DMU9 (roll teeth 1), DMU11 (keyseat), DMU13 (shaving teeth1), DMU14 (shaving teeth2), DMU15 (cylindrical grinding on face 1), and DMU16 (cylindrical grinding on face 2) have a comprehensive efficiency of 1, but this does not mean that the resource utilization efficiency of these processes is 100% and does not need to be improved. It just meant that these processes, relative to other processes achieve the optimal level of reference set. DMU2 (coarse car 1), DMU3 (coarse car 2) and DMU (coarse car 3) are processed on the same equipment. However, the DEA efficiency value of DMU2 (turning 1) based on total output is 0.824, and that of DMU4 (turning3) based on total output is 0.657, for the reason that these two processes cut a large amount of non-expected output scrap. This is processed according to the technological requirements and cannot be improved. The three processes of DMU6 (semi-precision turning), DMU7 (precision turning1), and DMU (precision turning2) are also processed on the same equipment, but their efficiency values are relatively low. Through practical observation in the workshop, it is found that the equipment for the three processes is more advanced than that of the rough rolling equipment. However, in the process of machining, the cutting speed set by the fine rolling machine is higher, the cutting fluid flow is greater, more waste liquid is generated, and the consumption of cutting tools is particularly fast. As a result, the resource utilization efficiency of the process is lower. In the future, cutting parameters can be optimized to reduce tool consumption and waste liquid. The efficiency of DMU10 (hobbing 2) based on total output is 0.684. Compared with DMU9 (hobbing 1) processed on the same equipment, the efficiency of resource utilization is low. Through observation, it is found that in the actual machining process, a tool change operation needs to be carried out between the two processes. During the tool change process, the equipment is still running, which leads to a waste of resources. It can improve the efficiency of resource utilization by improving the machining sequence, avoiding changing tools, or using advanced equipment to realize double tool rolling. DMU12 (drilling) inputs more raw materials but produces less output, resulting in low efficiency, but this is determined by the processing characteristics of the drilling process itself and cannot be improved. The efficiency of DMU17 (grinding long keyway) based on expected output is 0.556, while the efficiency based on non-expected output is 0.047, indicating low comprehensive utilization efficiency. Through analysis, it is found that the waste liquid and waste gas produced in the process of grinding long keyways are extremely large. The reason for this process is that in order to ensure that the roughness and errors of the workpiece meet the requirements, the processing time is long, the equipment consumes a lot of energy, and the output is small. In the later stage, the resource utilization efficiency can be improved by improving the processing method of the process.
Through the above case analysis, it can be found that the feasibility of applying the DEA model to the resource utilization efficiency evaluation of the machining process includes the following: (1) There is a complex relationship between the input and output parameters of the machining process, and the explicit representation of these interactions and constraints can be avoided through DEA. (2) The resource utilization efficiency of the machining process can be evaluated and compared using the relative effectiveness of DMUs. For those DMUs that do not have the best reliability and economy, the main influencing factors can be determined. (3) This method can provide DMU with corresponding improvement and adjustment feedback without achieving optimal resource utilization efficiency, including input and output parameters and specific adjustments in the relevant adjustment direction.

5. Conclusions

This study aims to evaluate and improve the resource utilization efficiency of the machining process, to help managers identify potential problems in terms of resource utilization efficiency, and to propose targeted solutions. The conclusions are as follows:
(1)
A DEA model can be used to comprehensively consider the input resources, expected output, and non-expected output that affect the machining process. To overcome the existing research, only single factors such as energy consumption ratios, raw material inputs, etc.
(2)
By using the SBM-DEA with unexpected output model, the efficiency value of this model can accurately reflect the resource utilization efficiency of each process, and provide managers with a breakthrough to improve the utilization efficiency of process resources and corresponding feasible plans.
(3)
Based on the DEA evaluation model, the resource utilization efficiency of each process can be quantitatively analyzed and compared. Reduce the interference of subjective factors and ensure the objectivity of efficiency evaluation and measurement. It provides a feasible way to improve the resource utilization efficiency of the machining process.
Although the model proposed in this study can evaluate the resource utilization rate of the processing process from the perspective of reducing unexpected output, how to further improve the resource utilization efficiency of the processing process still needs improvement in order to obtain more significant improvement effects. In the future study, other subtle factors, such as cutting parameters, could be considered. In addition, software to assess the resource utilization efficiency of the SBM-DEA with unexpected output can be invented.

Author Contributions

Conceptualization, Z.S. and X.Z.; methodology, X.Z.; software, Z.S.; validation, X.Z. and Z.S.; formal analysis, X.Z.; investigation, Z.S.; resources, X.Z.; data curation, X.Z.; writing—original draft preparation, Z.S.; writing—review and editing,; visualization, Z.S.; supervision, X.Z.; project administration, X.Z.; funding acquisition, X.Z. All authors have read and agreed to the published version of the manuscript.

Funding

This research is supported by Guangdong Provincial Science and Technology Innovation Strategy Special Fund Project of China (Grant No. 210907104531267).

Institutional Review Board Statement

Not applicable.

Informed Consent Statement

Not applicable.

Data Availability Statement

Data is unavailable due to privacy.

Conflicts of Interest

The authors declare no conflict of interest.

Abbreviations

x i j   input indexes, i = 1 , 2 , , m ; j = 1 , 2 , , n .
y r j output indexes, r = 1 , 2 , , s ; j = 1 , 2 , , n .
ε   infinitesimal.
sslack variables representing the input redundancy.
s+slack variables representing the output deficiency.
z ¯ q j unexpected output, q = 1 , 2 , , k ; j = 1 , 2 , , n .
tunexpected output redundancy.
θthe evaluation result of DEA effectiveness (0 < θ ≤ 1).

References

  1. Sun, H.; Liu, C.; Chen, J.; Gao, M.; Shen, X. A novel method of sustainability evaluation in machining processes. Processes 2019, 7, 275. [Google Scholar] [CrossRef] [Green Version]
  2. Zhou, L.; Li, J.; Li, F.; Meng, Q.; Li, J.; Xu, X. Energy consumption model and energy efficiency of machine tools: A comprehensive literature review. J. Clean. Prod. 2016, 112, 3721–3734. [Google Scholar] [CrossRef]
  3. Kara, S.; Li, W. An empirical model for predicting energy requirements for manufacturing processes: A case of turning process. Proc. Inst. Mech. Eng. B J. Eng. Manuf. 2011, 225, 1636–1646. [Google Scholar]
  4. Munoz, A.A.; Sheng, P. An analytical approach for determining the environmental impact of machining processes. Mater. Process. Technol. 1995, 53, 736–758. [Google Scholar] [CrossRef]
  5. Shao, H.; Wang, H.L.; Zhao, X.M. A cutting power model for tool wear monitoring in milling. Mach. Tools Manuf. 2004, 44, 1503–1509. [Google Scholar] [CrossRef]
  6. Mohammed, S.; Martin, P.; Hakan, H.; Julfikar, H. Measurement of specific cutting energy for evaluating the efficiency of bandsawing different workpiece materials. Mach. Tools Manuf. 2009, 49, 958–965. [Google Scholar]
  7. Guo, Y.S.; Loenders, J.; Duflou, J.; Lauwers, B. Optimization of energy consumption and surface quality in finish turning. Procedia CIRP 2012, 1, 512–517. [Google Scholar] [CrossRef]
  8. Lin, S. A Modeling and Simulation Method of Energy Consumption for the Dynamic Machining Process of Machine Tool; Chongqing University: Chongqing, China, 2015. [Google Scholar]
  9. Seow, Y.; Rahimifard, S.; Woolley, E. Simulation of energy consumption in the manufacture of a product. Int. J. Comput. Integr. Manuf. 2013, 26, 663–680. [Google Scholar] [CrossRef]
  10. Charnes, A.; Cooper, W.W.; Rhodes, E. Measuring the efficiency of decision making units. Eur. J. Oper. Res. 1978, 2, 429–444. [Google Scholar] [CrossRef]
  11. Qiao, Z. Summary and outlook of data envelopment analysis (DEA) method. Syst. Eng. Theory Methodol. Appl. 1994, 3, 1–8. [Google Scholar]
  12. Ouenniche, J.; Carrales, S. Assessing efficiency profiles of UK commercial banks: A DEA analysis with regression-based feedback. Ann. Oper. Res. 2018, 266, 551–587. [Google Scholar] [CrossRef] [Green Version]
  13. Lo Storto, C. The analysis of the cost-revenue production cycle efficiency of the Italian airports: A NSBM DEA approach. J. Air Transp. Manag. 2018, 72, 77–85. [Google Scholar] [CrossRef]
  14. Cecchini, L.; Venanzi, S.; Pierri, A.; Chiorri, M. Environmental efficiency analysis and estimation of CO2 abatement costs in dairy cattle farms in Umbria (Italy): A SBM-DEA model with undesirable output. J. Clean. Prod. 2018, 197, 895–907. [Google Scholar] [CrossRef]
  15. Chen, Z.M.; Zou, J.S.; Wang, W. Towards comprehensive digital evaluation of low-carbon machining process planning. AI EDAM 2022, 36, e21. [Google Scholar] [CrossRef]
  16. Cook, W.D.; Tone, K.; Zhu, J. Data envelopment analysis: Prior to choosing a model. Omega 2014, 44, 1–4. [Google Scholar] [CrossRef]
  17. Tsai, M.C.; Cheng, C.H.; Nguyen, V.T.; Tsai, M.I. The theoretical relationship between the CCR model and the two-stage DEA model with an application in the efficiency analysis of the financial industry. Symmetry 2020, 12, 712. [Google Scholar] [CrossRef]
  18. Wang, Z.; Jia, X. Analysis of energy consumption structure on CO2 emission and economic sustainable growth. Energy Rep. 2022, 8, 1667–1679. [Google Scholar] [CrossRef]
  19. Fang, T.; Fang, D.; Yu, B. Carbon emission efficiency of thermal power generation in China: Empirical evidence from the micro-perspective of power plants. Energy Policy 2022, 165, 112955. [Google Scholar] [CrossRef]
  20. Zhou, P.; Ang, B.W.; Wang, H. Energy and CO2 emission performance in electricity generation: A non-radial directional distance function approach. Eur. J. Oper. Res. 2012, 221, 625–635. [Google Scholar] [CrossRef]
  21. Zhang, R.L.; Liu, X.H. Evaluating ecological efficiency of Chinese industrial enterprise. Renew. Energy 2021, 178, 679–691. [Google Scholar] [CrossRef]
  22. Mardani, A.; Zavadskas, E.K.; Streimikiene, D.; Jusoh, A.; Khoshnoudi, M. A comprehensive review of data envelopment analysis (DEA) approach in energy efficiency. Renew. Sustain. Energy Rev. 2017, 70, 1298–1322. [Google Scholar] [CrossRef]
  23. Zonta, T.; da Costa, C.A.; Li, G.P. Predictive maintenance in the Industry 4.0: A systematic literature review. Comput. Ind. Eng. 2020, 150, 106889. [Google Scholar] [CrossRef]
  24. Wang, J.J.; Lu, Z.R.; Li, W.H. Energy, exergy, exergoeconomic and environmental (4E) analysis of a distributed generation solar-assisted CCHP (combined cooling, heating and power) gas turbine system. Energy 2019, 175, 1246–1258. [Google Scholar] [CrossRef]
  25. Gutowski, T.; Branham, M.; Dahmus, J. Thermodynamic analysis of resources used in manufacturing processes. Environ. Sci. Technol. 2009, 43, 1584–1590. [Google Scholar] [CrossRef] [PubMed]
  26. Kountanya, R.; Guo, C. Specific material removal rate calculation in five-axis grinding. J. Manuf. Sci. Eng. 2017, 139, 121010. [Google Scholar] [CrossRef]
  27. Srinivasan, S.; Pietrobon, S.S. Decoding of high rate convolutional codes using the dual trellis. IEEE Trans. Inf. Theory 2010, 56, 273–295. [Google Scholar] [CrossRef]
  28. Xia, X.I.; Li, P.W. A review of the life cycle assessment of electric vehicles: Considering the influence of batteries. Sci. Total Environ. 2022, 814, 152870. [Google Scholar] [CrossRef]
Figure 1. Mechanical processing input and output model.
Processes 11 00916 g001
Figure 2. The engineering drawing of the workpiece blank.
Processes 11 00916 g002
Figure 3. The engineering drawing of the workpiece.
Processes 11 00916 g003
Figure 4. Comparison of relative effectiveness analysis results.
Processes 11 00916 g004
Table 1. The DEA input and output indexes of resource utilization efficiency in the machining process.
DMUInputOutput
ExpectedUnexpected
Cr/$Qm/gCm/$E/kw·hM/$S/gCO2eqL/LQd/g
1X11X21X31X41Y11Z11Z21Z31
2X12X22X32X42Y12Z12Z22Z32
Table 2. Processing information.
No.ProcessMachine Tool Type
1Milling faceXZ28
2Rough turning1CE7120
3Rough turning2CE7120
4Rough turning3CE7120
5DrillingVH850
6Semi-extractive turningCK7820B
7Turning1CK7820B
8Turning2CK7820B
9Hobbing1YKX3132M
10Hobbing2YKX3132M
11KeyseatVH850
12DrillingZ5150A
13Shaving1YKAT4232
14Shaving2YKAT4232
15Grinding1G30A-80CNC
16Grinding2G30A-80CNC
17Grinding keyseatVH850
Table 3. The input and output indexes of each machining process DMUs.
Process No.People
/$
Tool
/$
Raw Resource/kgEnergy
/kw·h
Profit
/$
Solid Waste/gLiquid Waste/LWaste Steam/
kg·CO2/kw·h
Time
/min
11.370.088.8270.372.54 120.460.34 6.85
21.313.268.8151.001.49 380.171.08 5.02
31.403.508.7751.081.60 400.181.44 5.38
40.521.318.730.400.60 380.070.43 2.01
50.260.358.6870.170.31 780.010.15 2.61
60.704.158.6180.330.82 30.100.40 2.5
70.816.008.6160.391.12 40.120.39 2.9
80.566.008.6120.270.77 70.080.25 2.01
91.290.138.6040.432.69 430.650.65 6.47
101.260.168.5610.422.43 180.530.63 6.31
111.470.058.5450.491.30 950.610.46 7.33
120.040.058.4490.020.04 10.010.02 0.36
130.520.268.4460.220.96 190.110.21 2.16
140.520.218.4250.220.96 100.110.22 2.16
151.010.158.4181.151.20 10.461.24 4.61
160.320.148.4160.360.38 10.140.39 1.44
171.612.008.4160.491.39 10.610.46 7.33
Table 4. Solution for the 17 sample DMUs via the SBM-DEA with an unexpected output model.
X1X2X3X4Y1Z1Z2Z3Expected
Output θ
Unexpected
Output θ
Total
θ
DMU10.5990.0510.9280.2260.7610.0080.2740.2091.0001.0001.000
DMU20.5850.8110.9280.5000.6240.0240.1070.5240.8930.8030.824
DMU30.6050.8230.9280.5240.6440.0250.1130.6141.0001.0001.000
DMU40.3050.5850.9270.2420.3440.0240.0440.2590.8190.6170.657
DMU50.1620.2140.9270.1070.1910.0500.0060.0951.0001.0001.000
DMU60.3890.8490.9260.2030.4370.0020.0630.2420.5870.1450.178
DMU70.4330.8950.9260.2370.5360.0030.0760.2370.6500.2350.280
DMU80.3250.8950.9260.1680.4180.0040.0510.1560.6390.4430.480
DMU90.5800.0820.9260.2590.7730.0270.3670.3671.0001.0001.000
DMU100.5730.1010.9260.2530.7510.0110.3100.3580.9350.6280.684
DMU110.6200.0320.9260.2900.5830.0600.3490.2741.0001.0001.000
DMU120.0250.0320.9250.0130.0250.0010.0060.0130.2970.2200.235
DMU130.3050.1620.9250.1380.4870.0120.0700.1321.0001.0001.000
DMU140.3050.1320.9250.1380.4870.0060.0700.1381.0001.0001.000
DMU150.5190.0950.9250.5440.5580.0010.2740.5681.0001.0001.000
DMU160.1970.0890.9250.2200.2420.0010.0890.2371.0001.0001.000
DMU170.6460.7050.9250.2900.6030.0010.3490.2740.5560.0470.061
Disclaimer/Publisher’s Note: The statements, opinions and data contained in all publications are solely those of the individual author(s) and contributor(s) and not of MDPI and/or the editor(s). MDPI and/or the editor(s) disclaim responsibility for any injury to people or property resulting from any ideas, methods, instructions or products referred to in the content.