Article

Chemical Looping Enhanced Oil Shale-to-Liquid Fuels Process: Modeling, Parameter Optimization, and Performance Analysis

1
The 404 Company Limited, China National Nuclear Corporation, Jiayuguan 735100, China
2
College of Petrochemical Technology, Lanzhou University of Technology, Lanzhou 730050, China
*
Author to whom correspondence should be addressed.
Processes 2023, 11(3), 929; https://doi.org/10.3390/pr11030929
Submission received: 5 February 2023 / Revised: 7 March 2023 / Accepted: 11 March 2023 / Published: 18 March 2023
(This article belongs to the Special Issue Research on Process System Engineering)

Abstract

:
The solid heat carrier moving bed with internals is an advanced oil shale retorting technology. However, the retorting gas produced by pyrolysis is generally used as fuel gas. The content of CO, H2, and CH4 in the retorting gas is high, and direct combustion leads to resource waste and environmental pollution. In addition, heteroatomic sulfur and nitrogen, as well as unsaturated hydrocarbons, reduce the quality of shale oil. To solve these problems, this paper proposed a chemical looping enhanced oil shale-to-liquid fuels (CLeSTL) process. The chemical looping hydrogen production technology is applied to convert retorting gas to hydrogen, and the hydrogen produced is used for shale oil hydrogenation to improve the oil quality. In this paper, the new process is modeled and simulated; then technoeconomic analysis is carried out. Technical analysis shows that shale oil yield is increased from 65% to 95.7% and the yield of light fraction is increased from 20% to 64%–83%. Economic analysis shows that the CLeSTL process with ligh fraction hydrogenation has the highest investment profit rate and large profit space. In addition, when the oil price is lower than 50 USD/bbl, the investment profit is 5%, which shows strong anti-risk ability.

1. Introduction

The large-scale exploration and development of petroleum resources has promoted the rapid development of the entire petrochemical industry, such as in the large-scale production of liquid fuels and chemicals. However, the dependence on oil resources also leads to certain hidden dangers in social development, and the energy security in oil-deficient areas will be threatened [1]. The fluctuation of international crude oil price and the instability of supply directly threaten the regional economic development and social security. Therefore, a focus of current energy technology research is to find alternative energy to reduce dependence on oil.
Alternative energy mainly includes unconventional oil and gas resources, renewable energy, and nuclear energy. Unconventional oil and gas resources usually include unconventional gas fuel resources such as shale gas and natural gas hydrate, as well as shale oil, oil shale, and other unconventional fuel resources [2]. The United States has the largest reserve of shale oil, with 536.9 billion tons, and has made breakthroughs in deep shale oil production technology, with the features of hydraulic fracturing and horizontal well technology. In 2014, shale oil production reached 210 million tons, which is one-third of the 600 million tons of conventional oil production in the United States. This has completely changed the pattern of international oil and gas resources supply, which is called the “shale revolution” by the media [3]. China’s shale oil reserves are about 47.6 billion tons converted by oil shale, more than twice China’s recoverable oil reserves of 23.3 billion tons [4]. The development and utilization of oil shale will play an important role in supporting the development of strategic emerging industries to replace oil and gas and alleviating the shortage of oil and gas resources in China.
Shale oil is obtained from oil shale by retorting [5]. The retorting technology of oil shale includes aboveground retorting and underground retorting [6,7]. Only aboveground technology has been industrialized in China, mainly represented by Fushun-type technology [8]. Fushun-type technology can only use oil shale with a particle size of 10–75 mm, but cannot use small particles of less than 10 mm. The small particle produced during the crushing and screening of oil shale accounts for about 20% of the total oil shale raw materials [9]. Therefore, the raw material utilization rate of Fushun-type technology is low, i.e., only about 80%. The heat transfer efficiency between materials in Fushun-type retorting is low. As a result, the secondary reaction of pyrolysis products is serious and the oil yield is low. Therefore, the oil yield of Fushun-type technology is only 60%–65% [10]. In addition, the shale oil has a high content of heavy components, and the heavy components with boiling point above 350 °C reach more than 80% [9].
Professor Xu, from the Institute of Process Engineering of the Chinese Academy of Sciences, and his research team developed a solid heat carrier moving bed with internals, and established a pilot plant of this retort, with a processing capacity of 1000 tons/year of oil shale [11]. This new retort can make full use of the small particles of oil shale. The addition of internals can help strengthen the heat transfer between ash and oil shale particles, reduce the content of shale oil dust, improve oil yield (especially the content of light components), and improve the heating value of retorting gas. The schematic diagram of oil shale retorting using the solid heat carrier moving bed with internals (SHCOSR) is shown in Figure 1. The process mainly includes the oil shale retorting (OSR) unit, the oil–gas separation (OGS) unit, and the circulating fluidized bed combustion for power generation (CFB) unit. After the oil shale is ground and screened, shale particles smaller than 10 mm enter the retort to undergo the retorting reaction to generate an oil and gas mixture and semi-coke. The oil and gas mixture comes out from the top of the retort, and the dust in the oil and gas mixture is removed by the cyclone separator. Then, the oil–gas mixture enters the OGS to separate shale oil and retorting gas. Shale oil enters the oil tank, and retorting gas enters the gas tank. In addition, the semi-coke produced by pyrolysis is discharged from the bottom of the retort and transferred to the circulating fluidized bed for combustion to produce electricity and high-temperature ash. Most of the ash is recycled and mixed with the raw shale particles, and then enters the retort for pyrolysis reaction. The remaining ash can be used as a raw material for building materials.
In the SHCOSR process, the produced retorting gas has a large content of effective components, such as H2, CO, and CH4. However, the retorting gas is generally used as fuel gas for power generation by gas turbines to provide a part of the electricity for the SHCOSR process [8]. In addition, the obtained shale oil generally does not need to be further processed and is directly sold to the market as marine fuel. However, the shale oil contains a large number of sulfur and nitrogen heteroatomic components, which will emit a large quantity of sulfides and nitrides in use, causing environmental pollution [11]. Therefore, shale oil needs to be further processed to improve the quality of oil, thus improving the value of products. The removal of sulfur and nitrogen in shale oil and the fracture of the macromolecular compound chain need to consume hydrogen. Therefore, the source of hydrogen is key. If purchased hydrogen is used as the hydrogen source, it will increase the production cost of the whole process and reduce the economic benefits.
The retorting gas can produce hydrogen through methane steam reforming (MSR) technology, and the reactions involved mainly include methane reforming, the CO shift reaction, and pressure swing adsorption. In addition, considering that the retorting gas has good reducibility, it can be used as fuel gas to provide energy for chemical looping hydrogen (CLH) production technology. High purity hydrogen can be produced by the CLH technology, and high purity carbon dioxide can be obtained without capturing. Compared with the MSR technology, the CLH technology has many advantages, mainly including: (1) CLH is relatively simple because it does not require additional processing of the retorting gas (such as reforming and shift), and can generate high-purity hydrogen without additional separation processes (such as pressure swing adsorption) [12,13]. Therefore, CLH will significantly save investment. (2) CLH can achieve a self-heating equilibrium. However, the MSR reaction is a strong endothermic reaction, and the reaction temperature reaches about 900 °C, requiring a large amount of external heat. The oil shale retorting is carried out at low temperature, and the whole process does not have matching heat to provide for the MSR reaction. Therefore, in order to meet the heat required for MSR reaction, it is necessary to burn additional fuel for supply, such as oil shale or associated coal. Therefore, the MSR technology has a higher cost, regardless of the energy balance or the raw material source. To summarize, this paper examines the CLH technology to produce hydrogen, and the use of produced hydrogen for shale oil hydrogenation and upgrading.
The CLH technology has been successfully applied in the chemical process of coal-based and natural gas-based energy, as well as in the field of bioengineering [14,15]. Xiang and Chen [16] applied the CLH technology to the coal gasification hydrogen electricity cogeneration system. The energy efficiency of the new system can reach 58%. Chiesa et al. [12] studied the hydrogen–electric cogeneration system of three series reactors, using methane as fuel gas in the CLH process. The research group of Professor Fan from Ohio State University studied CLH from coal gasified gas, and used the hydrogen for power generation [17,18,19]. To date, their research group has successfully built and operated two sets of small demonstration pilot plant units of 25 and 250 kW [20,21].
The composition of the retorting gas is the same as that of the coal gasified gas, so the retorting gas can also be used as fuel gas for CLH. Aiming at the SHCOSR, a chemical looping enhanced oil shale-to-liquid fuels (CLeSTL) process is proposed. In this new process, the CLH technology is applied. The reducing gases of CO, H2, and CH4 in the retorting gas are used for hydrogen production, and the hydrogen is used for shale oil hydrogenation (SOH) and upgrading. In addition, the waste heat from the CLH is recycled to generate electricity. The advantages of the new process are mainly reflected in the efficient use of the retorting gas to produce hydrogen, reducing the cost of outsourcing hydrogen, and significantly improving the economic benefits of the oil shale integrated refining process.

2. Process Design and Modeling of CLeSTL
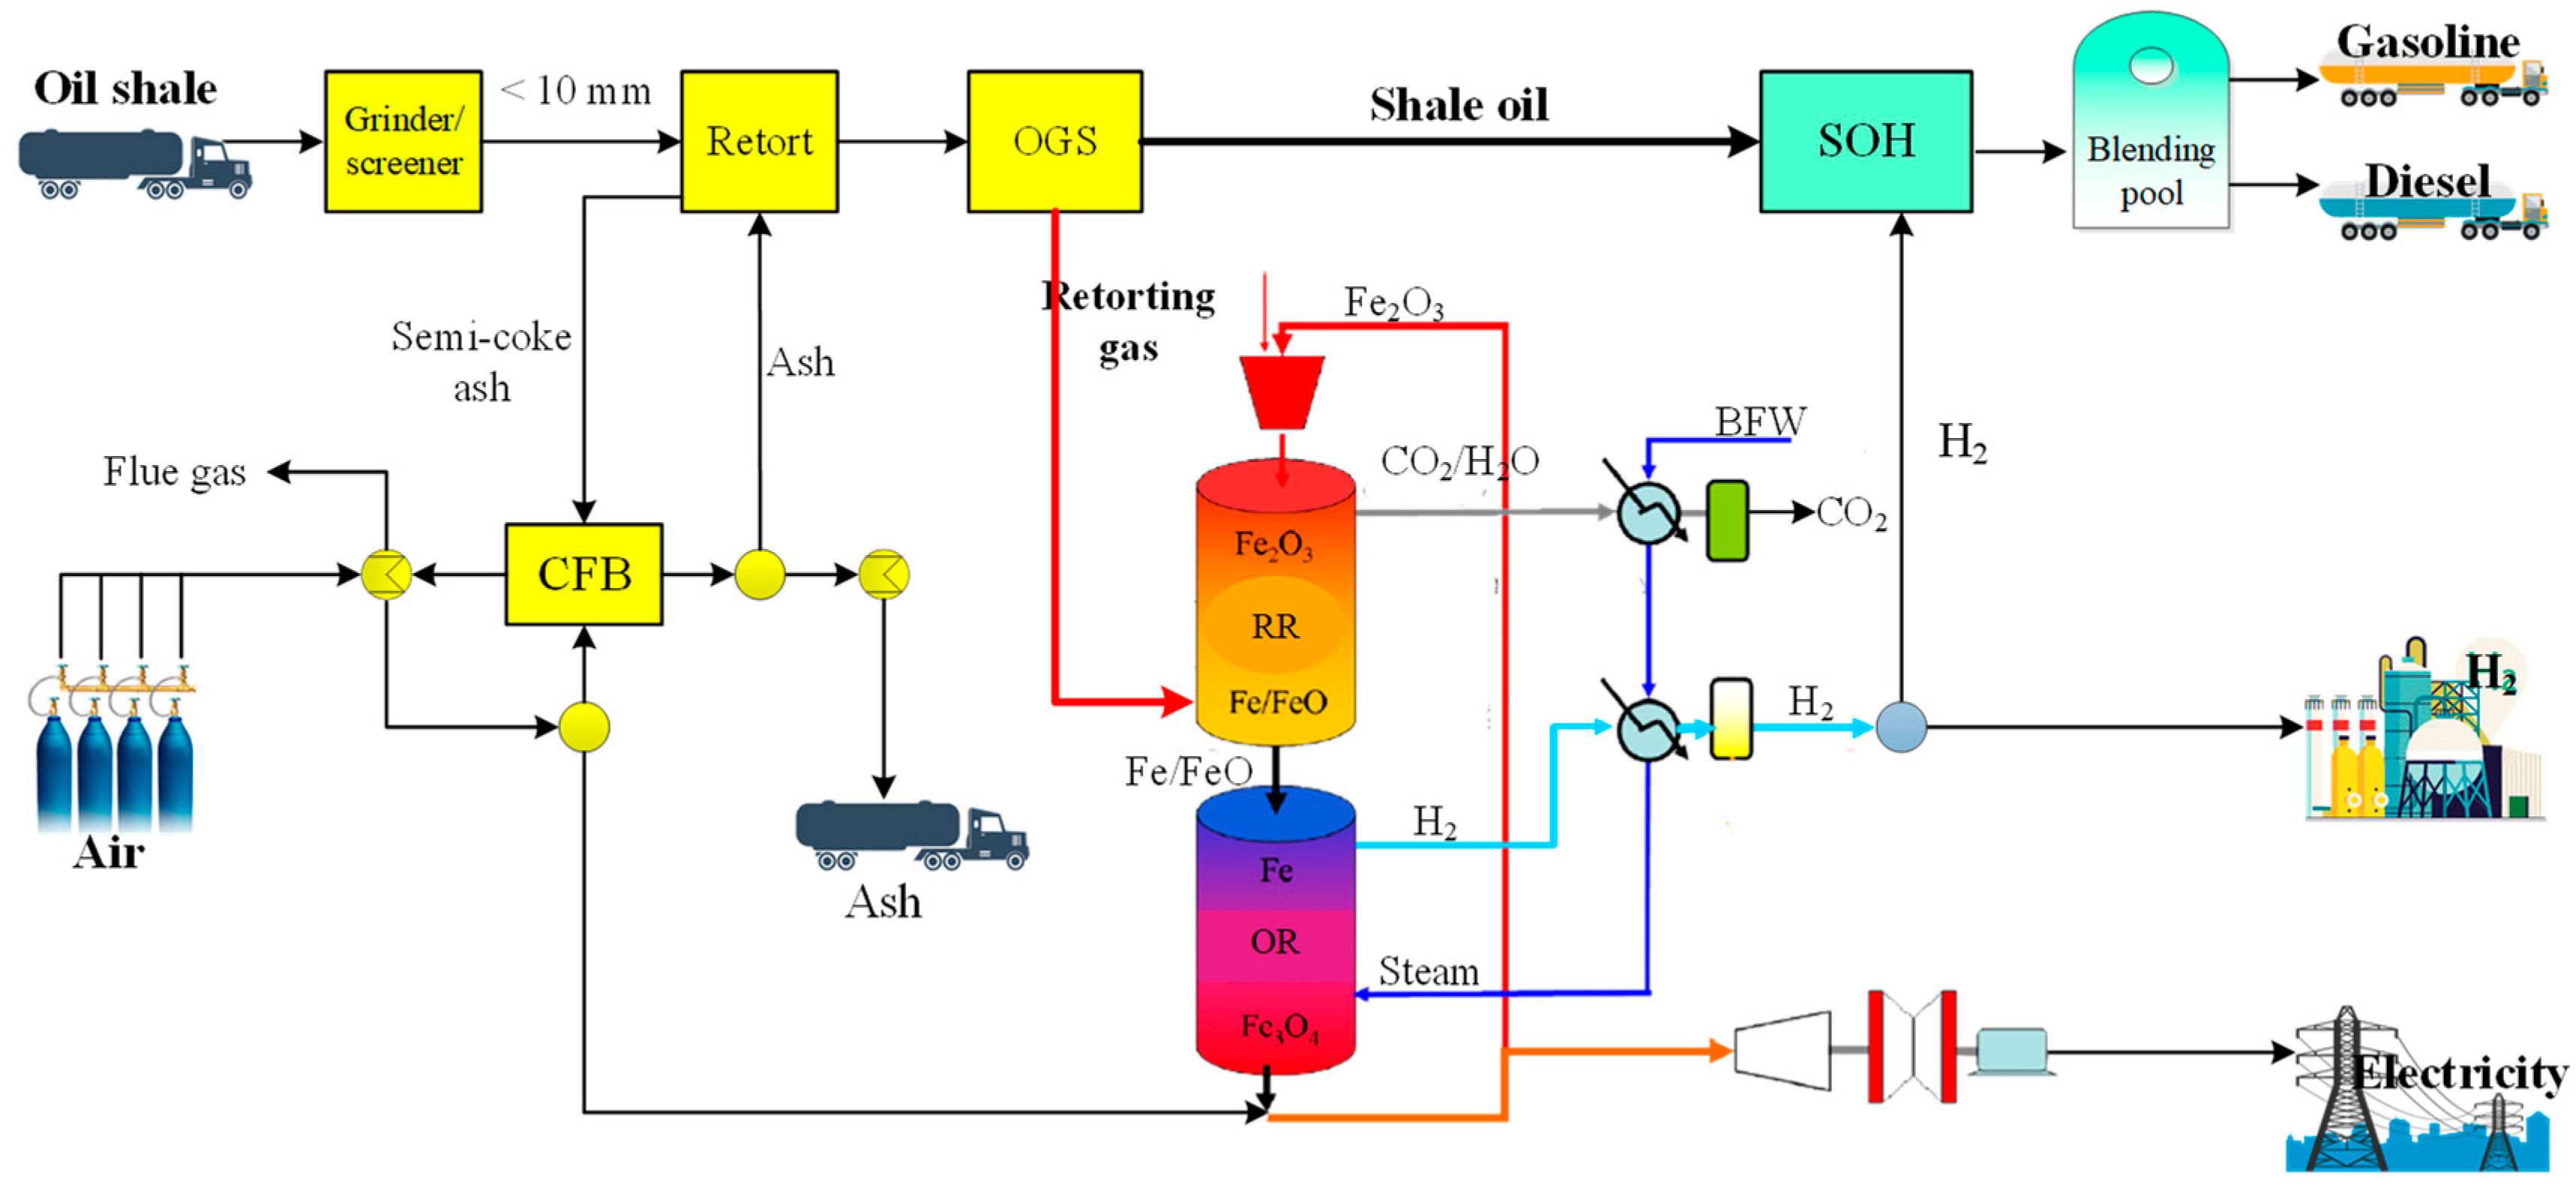
2.1. Process Design

The schematic diagram of the proposed CLeSTL process is shown in Figure 2. Based on the SHCOSR, the new process includes not only the OSR unit, OGS unit, and CFB unit, but also the CLH unit and SOH unit. Oil shale is ground and screened to obtain shale particles with a particle size less than 10 mm. Shale particles enter the retort to undergo the retorting reaction to produce semi-coke and an oil and gas mixture. The semi-coke is burned in a CFB, and the generated ash is recycled to provide heat for oil shale retorting. The oil and gas mixture is separated by the OGS unit to obtain shale oil and retorting gas. The retorting gas enters the CLH unit as fuel to produce hydrogen. Some hydrogen is used for shale oil hydrogenation and upgrading, and the rest is exported as chemical products.

2.2. Modeling and Simulation

In this study, Aspen Plus (Version 11) simulation software was used to model and simulate the CLeSTL process. The raw material was oil shale with an oil content of 9% in Huadian, Jilin Province. The proximate analysis and elemental analysis of the oil shale are shown in Table 1, where M, FC, V, and A represent water, fixed carbon, volatile, and ash, respectively; ar refers to the as-received basis of oil shale.
Referring to the processing scale of the traditional Fushun-type oil shale refining process, this paper assumes that the processing scale of raw oil shale in the new process is 3 million tons/year (375 t/h) [9]. The key operating parameters of each unit in the CLeSTL process are shown in Table 2.

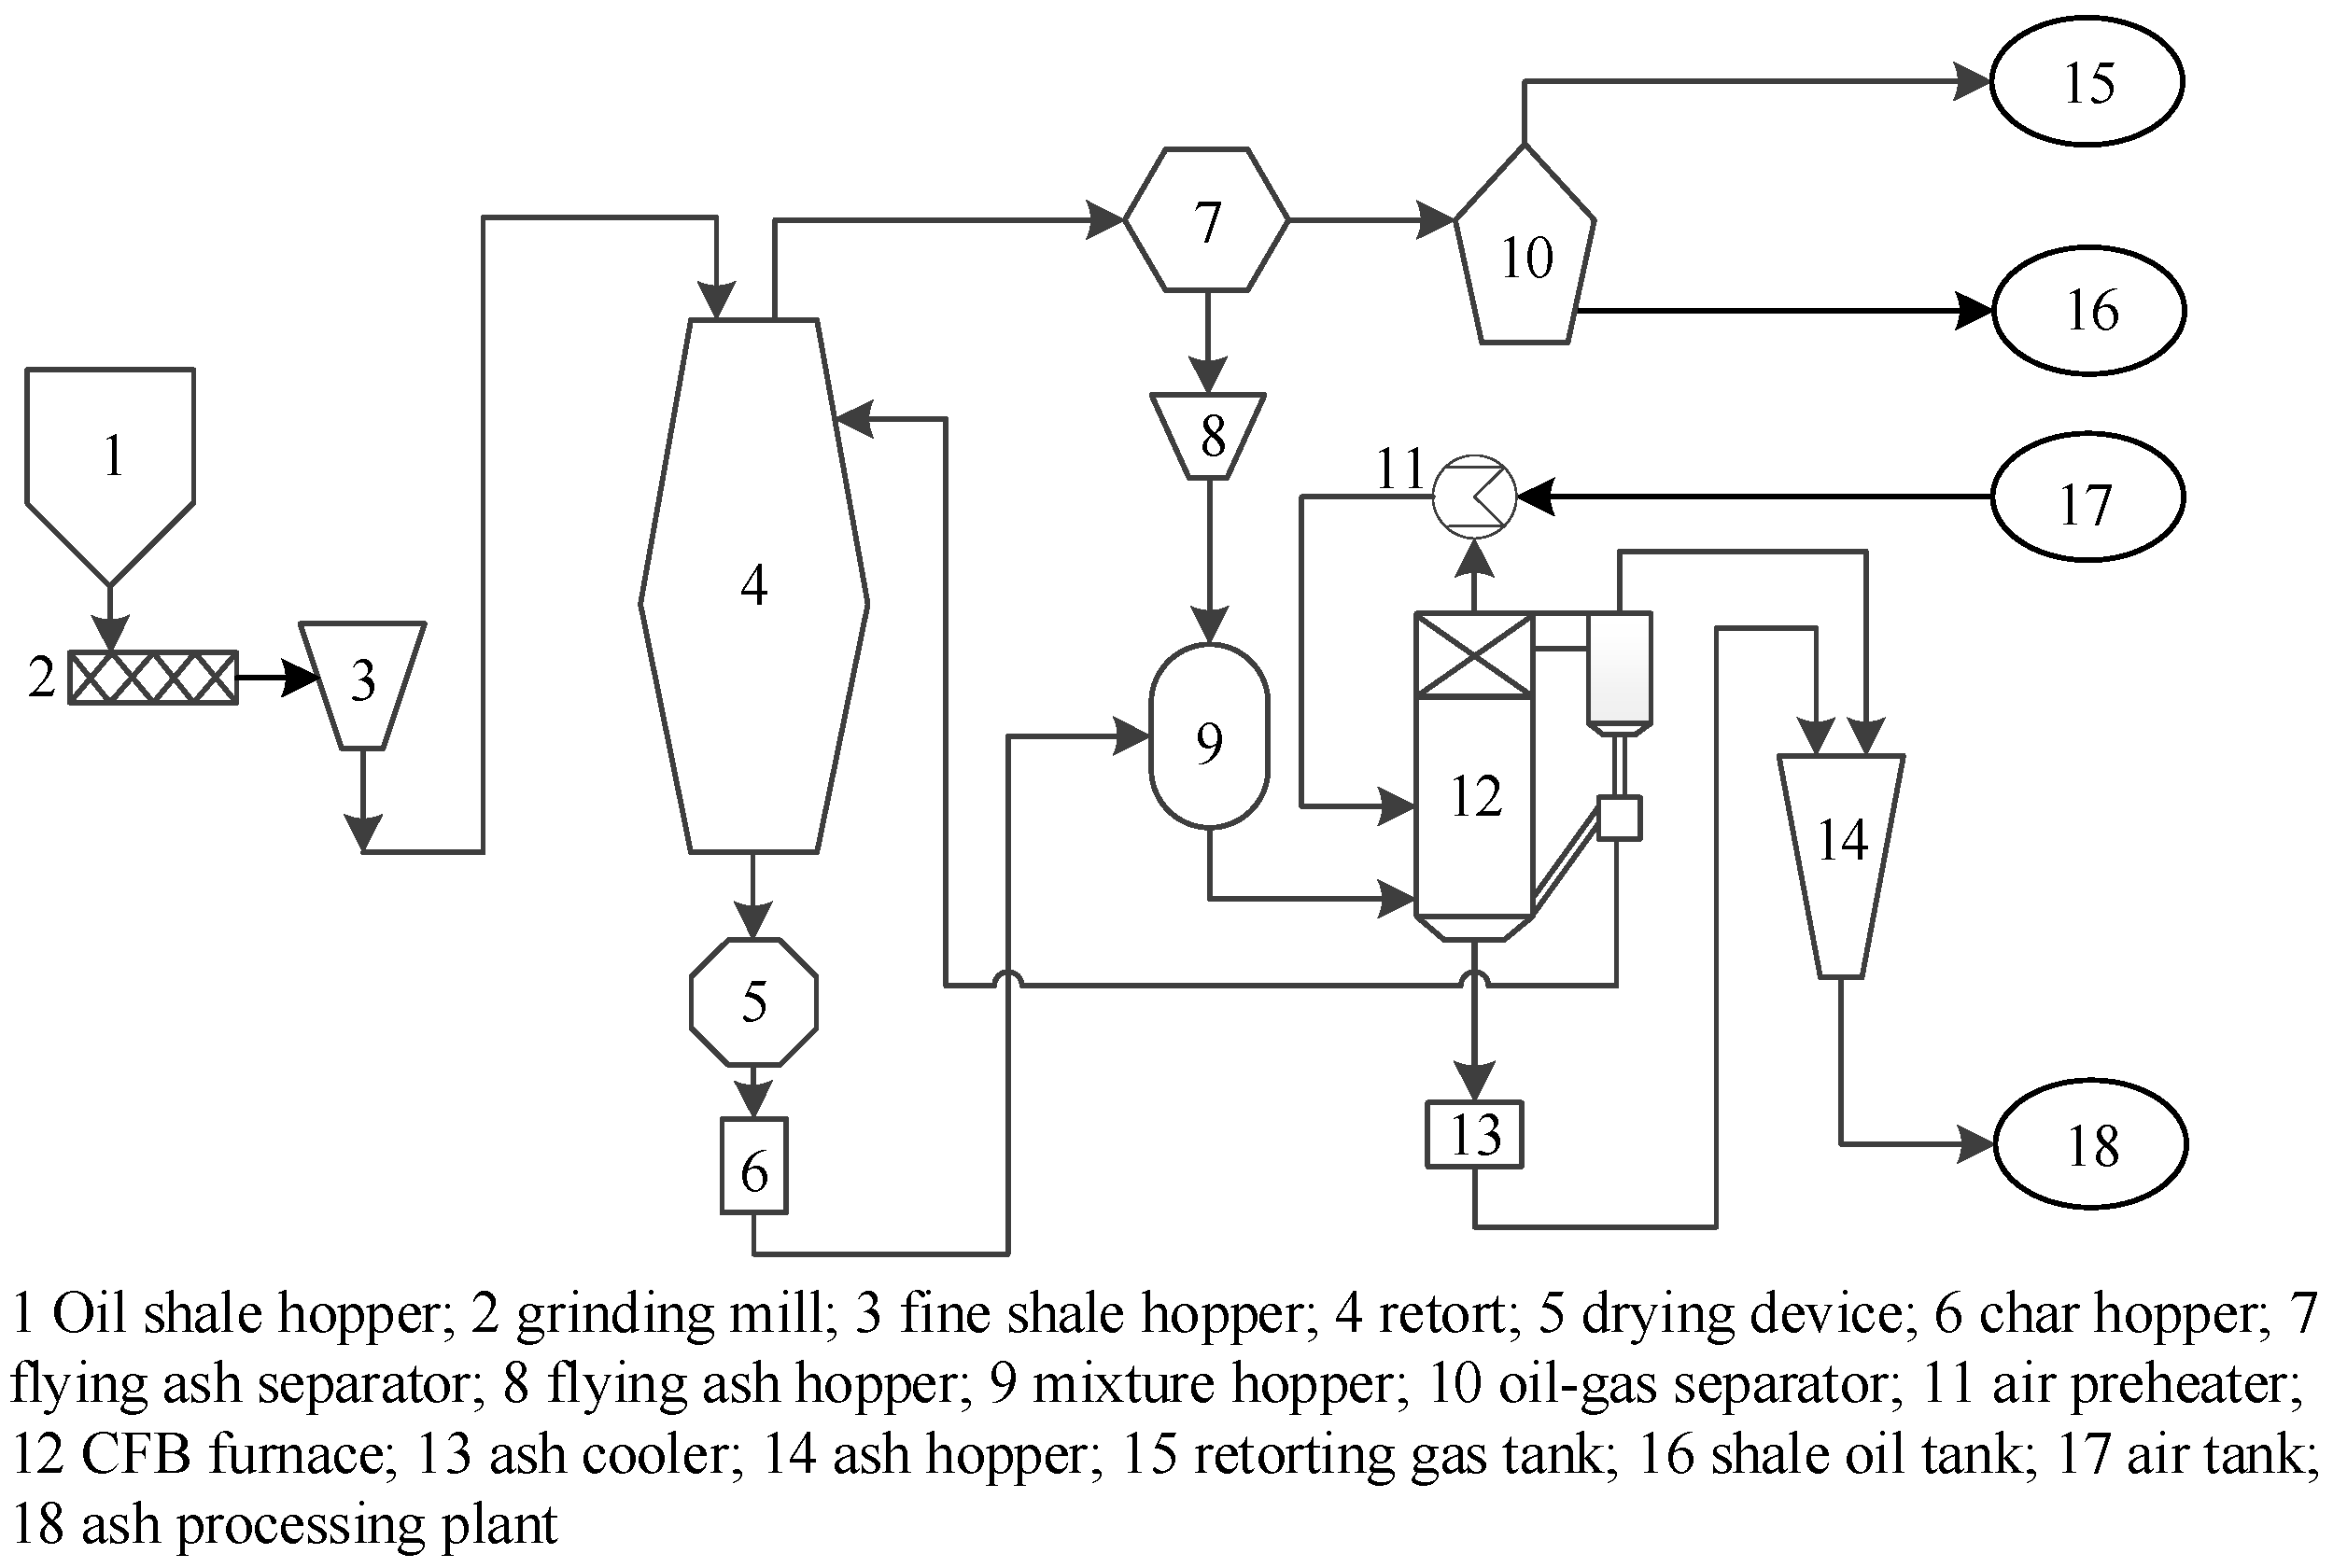
2.2.1. Oil Shale Retorting Unit

The elemental analyses of shale oil and semi-coke produced by the pyrolysis of oil shale refer to the work of relevant authors, and the results are shown in Table 3 [11]. Through elemental analysis, the molecular formula of shale oil is C15.32H11.90O0.14N0.94. Therefore, C15H12 is used instead of shale oil in this simulation. Although C15H12 cannot completely define the actual composition of shale oil, it can effectively simulate the mass and energy balance and evaluate the technical and economic performance of the CLeSTL process.
The calculation principle of the distribution of oil shale pyrolysis products of the solid heat carrier moving bed with internals refers to the previous work and other works [2,28]. The corresponding parameter values in the dynamic model are A = 5.26 × 10¹² S−1, E0 = 180 kJ/mol, E0 + 4 σ = 367 kJ/mol. According to Equations (1)–(4) in a previous work [2], the matrix for calculating the pyrolysis product yield is listed, as shown in Figure 3.
The product distribution of oil shale pyrolysis is obtained by solving with MATLAB, as shown in Table 4. Compared with the experimental data [11], the relative error is less than 6%.

2.2.2. Oil–Gas Separation Unit

The flow diagram of the OGS unit is shown in Figure 4. The oil and gas mixture produced by the OSR unit enters from the bottom of the water scrubber under normal pressure. The washing water is pumped to the top of the washing tower to wash the bottom-up oil and gas mixture in the tower. The washed washing water and shale oil enter the oil–water separation tank for oil–water separation. The unseparated oil and gas mixture enters the indirect cooling tower and electrostatic oil separator to obtain retorting gas and shale oil separately.
In this study, a RadFrac module was used to simulate the water washing tower, and 54 plates were set. The washing water enters from the first tray of the washing tower. The flow rate was set at 445.42 t/h, temperature was 66 °C, and pressure was 0.1 MPa. The oil and gas mixture enters from the bottom of the scrubber. The flow rate was set at 57.79 t/h, temperature was 500 °C, pressure was 0.1 MPa, and pressure drop of the scrubber was set at 0. Detailed modeling refers to the previous work [2], and the simulation data are shown in Table 5.

2.2.3. Thermal Balance Simulation of Retorting

The semi-coke from pyrolysis of oil shale is burned in a CFB boiler to produce high-temperature ash, and most of the ash is recycled to provide heat for oil shale retorting. The heat required for the oil shale retorting is mainly used in four parts: (1) the heat required for the water evaporation of shale particles; (2) the heat required to heat shale particles to the complete retorting temperature; (3) pyrolysis heat of shale particles; and (4) heat loss during particle pyrolysis. In this paper, the heat balance of a single solid heat carrier moving bed with internals is calculated. The shale particles and circulating ash are mixed into the retort. First, shale particles are dried and dehydrated. The calculation of heat Qvap required for water evaporation is shown in Equation (1).
Q vap = m H 2 O C p , H 2 O 1 100 25 + r H 2 O + C p , H 2 O g T ret 100
where Tret is the retorting temperature. According to the work of Xie [29], the specific heat capacity of liquid water is 4.19 kJ/(kg °C), gaseous water is 1.99 kJ/(kg °C), and the latent heat of vaporization of water is 2261 kJ/kg. It is known that the mass flow rate of evaporated water mH2O is 4.9 kg/h, the temperature of shale pyrolysis is 500 °C, and the Qvap is 49.5 × 10⁶ kJ/h according to Equation (1). The calculation of heat Qhet required for heating shale particles to complete retorting temperature is shown in Equation (2).
Q heat = m shale m H 2 O C p , shale T ret 25
where mshale is the mass flow rate of shale particles; Cp,shale is the specific heat capacity of shale. According to the literature [30], Cp,shale of Huadian shale is 1.05 kJ/(kg °C). According to Equation (2), Qhet is 18.0 × 10⁷ kJ/h. The calculation of pyrolysis heat Qpyr of shale particles is shown in Equation (3).
Q pyr = m shale m H 2 O Q pyr
where Q pyr is the unit shale pyrolysis heat, 235.7 kJ/kg [8]. Based on Equation (3), Qpyr is 84.9 × 10⁶ kJ/h. It is assumed that the heat loss Qloss accounts for 5% of the total heat of the retorting process. The heat Qret required for the retorting process is equal to the sum of the Qvap, Qhet, Qpyr, and Qloss, as shown in Equation (4).
Q ret = Q vap + Q het + Q pyr + Q loss
According to Equation (4), Qret is 33.0 × 10⁷ kJ/h. The heat required for unit oil shale retorting is 880 kJ/kg. Assuming that the temperature of ash is reduced from 730 to 500 °C, the calculation of the circulating amount of ash mrecy is shown in Equation (5).
m recy = Q ret / C p , ash 730 500
where Cp,ash is the specific heat capacity of the ash. Referring to a previous work [30], Cp,ash is set to 0.86 kJ/(kg °C), and mrecy is 4.5 kg/kg as calculated by Equation (5). The high-temperature sensible heat of ash mainly comes from the combustion of semi-coke in the CFB. The CFB can use fuel with a low calorific value and has high combustion efficiency. However, the combustion of semi-coke in a CFB must meet the requirements of the lowest stable combustion heating value.
In this paper, the heat balance of a single CFB is calculated. According to the simulation, the actual amount of air required for semi-coke combustion is 1702.2 km3/h, the amount of CO2 generated by semi-coke combustion is 110.1 t/h, the amount of SO2 is 4.8 t/h, the amount of N2 is 337.8 t/h, the amount of water vapor is 29.7 t/h, and the amount of residual oxygen after combustion is 20.4 t/h. The heat Qflue carried by flue gas at the outlet of the CFB is equal to 46.5 × 10⁷ kJ/h. The heat output from the outlet of the CFB also includes the heat Qash carried by the ash. The calculation formula is shown in Equation (6).
Q ash = m ash + m recy C p , ash T furn 25
The amount of ash produced by semi-coke combustion mash is 243 t/h, and Qash is 100.5 × 10⁷ kJ/h according to Equation (6). The heat output of the CFB is equal to the sum of the heat Qcarr brought in by the semi-coke and circulating ash and the heat Qcomb released by the semi-coke combustion, as shown in Equation (7).
Q flue + Q ash = Q carr + Q comb
The calculation of Qcarr is shown in Equation (8), as follow.
Q carr = m semi-coke C p , semi-coke + m recy C p , ash T ret 25
In Equation (8), the specific heat capacity of semi-coke Cp,semi-coke is 1.05 kJ/(kg °C) and Qcarr is 71.1 × 10⁷ kJ/h. The calculation of Qcomb is shown in Equation (9).
Q com = m semi-coke λ H L , semi-coke
where λ is the thermal efficiency of semi-coke combustion; HL,semi-coke is the combustion heating value of semi-coke. Assuming that the combustion efficiency is 95% and the thermal efficiency of boiler is 88%, the minimum stable combustion heating value of semi-coke is 2990 kJ/kg calculated from Equations (7)–(9). Lin et al. [31] determined that the low calorific value of the semi-coke from the pyrolysis of Huadian oil shale used in this paper was 2650 kJ/kg. It can be seen that the calorific value of semi-coke cannot meet the requirements of the minimum stable combustion heating value. The calorific value of semi-coke can meet the needs of combustion, but cannot provide enough heat for pyrolysis. In order to meet the minimum calorific value required by the process, it is necessary to consider optimizing other process conditions, such as blending oil shale or increasing air temperature.

2.2.4. Retorting Gas Chemical Looping for Hydrogen Production Unit

The flow diagram of the retorting gas chemical looping for hydrogen production (RGCLH) is shown in Figure 5. The retorting gas generated from pyrolysis of oil shale is pretreated to remove ash, and then preheated to enter the fuel reactor (FR) to reduce the oxygen carrier Fe2O3 to FeO and Fe. The components of CO, CH4, and H2 in the retorting gas are almost oxidized to CO2 and H2O. The main reactions are shown in Equations (10)–(12) [32]. FeO and Fe particles come out from the bottom of the FR and enter the steam reactor (SR) to react with high-temperature and high-pressure steam to generate hydrogen. The main reactions are as shown in Equations (13) and (14). Fe is oxidized to FeO and Fe3O4. FeO and Fe3O4 come out from the bottom of the SR and continue to enter the air reactor (AR) for combustion with air. FeO and Fe3O4 are completely oxidized to Fe2O3 and the main reactions are shown in Equations (15) and (16). After the gas–solid mixture at the outlet of the AR is separated, the high-temperature solid Fe2O3 particles continue to circulate into the FR to react with the retorting gas, and the high-temperature sensible heat of Fe2O3 particles provides the reaction heat for the reduction reaction. The separated gas enters the heat recovery steam generation (HRSG) to generate high-pressure steam for SR.
Fe2O3 (s) + 3 CO (g) → 2 Fe (s) + 3 CO2 (g)
Fe2O3 (s) + 3 H2 (g) → 2 Fe (s) + 3 H2O (g)
4 Fe2O3 (s) + 3 CH4 (g) → 8 Fe (s) + 3 CO2 (g) + 6 H2O (g)
Fe (s) + H2O (g) → FeO (s) + H2 (g)
3 FeO (s) + H2O (g) → Fe3O4 (s) + H2 (g)
4 Fe3O4 (s) + O2 (g) → 6 Fe2O3 (s)
4 FeO (s) + O2 (g) → Fe2O3 (s)
The gas outlet of the SR is recovered by the HRSG, and then cooled by multistage compression to obtain 6 MPa and 30 °C hydrogen with a purity of more than 99.9%. This study simulated HRSG with reference to a previous work [27]. In addition, the RGibbs model was used to calculate the chemical and phase equilibria of the reactions in the FR, SR, and AR reactors [33,34].

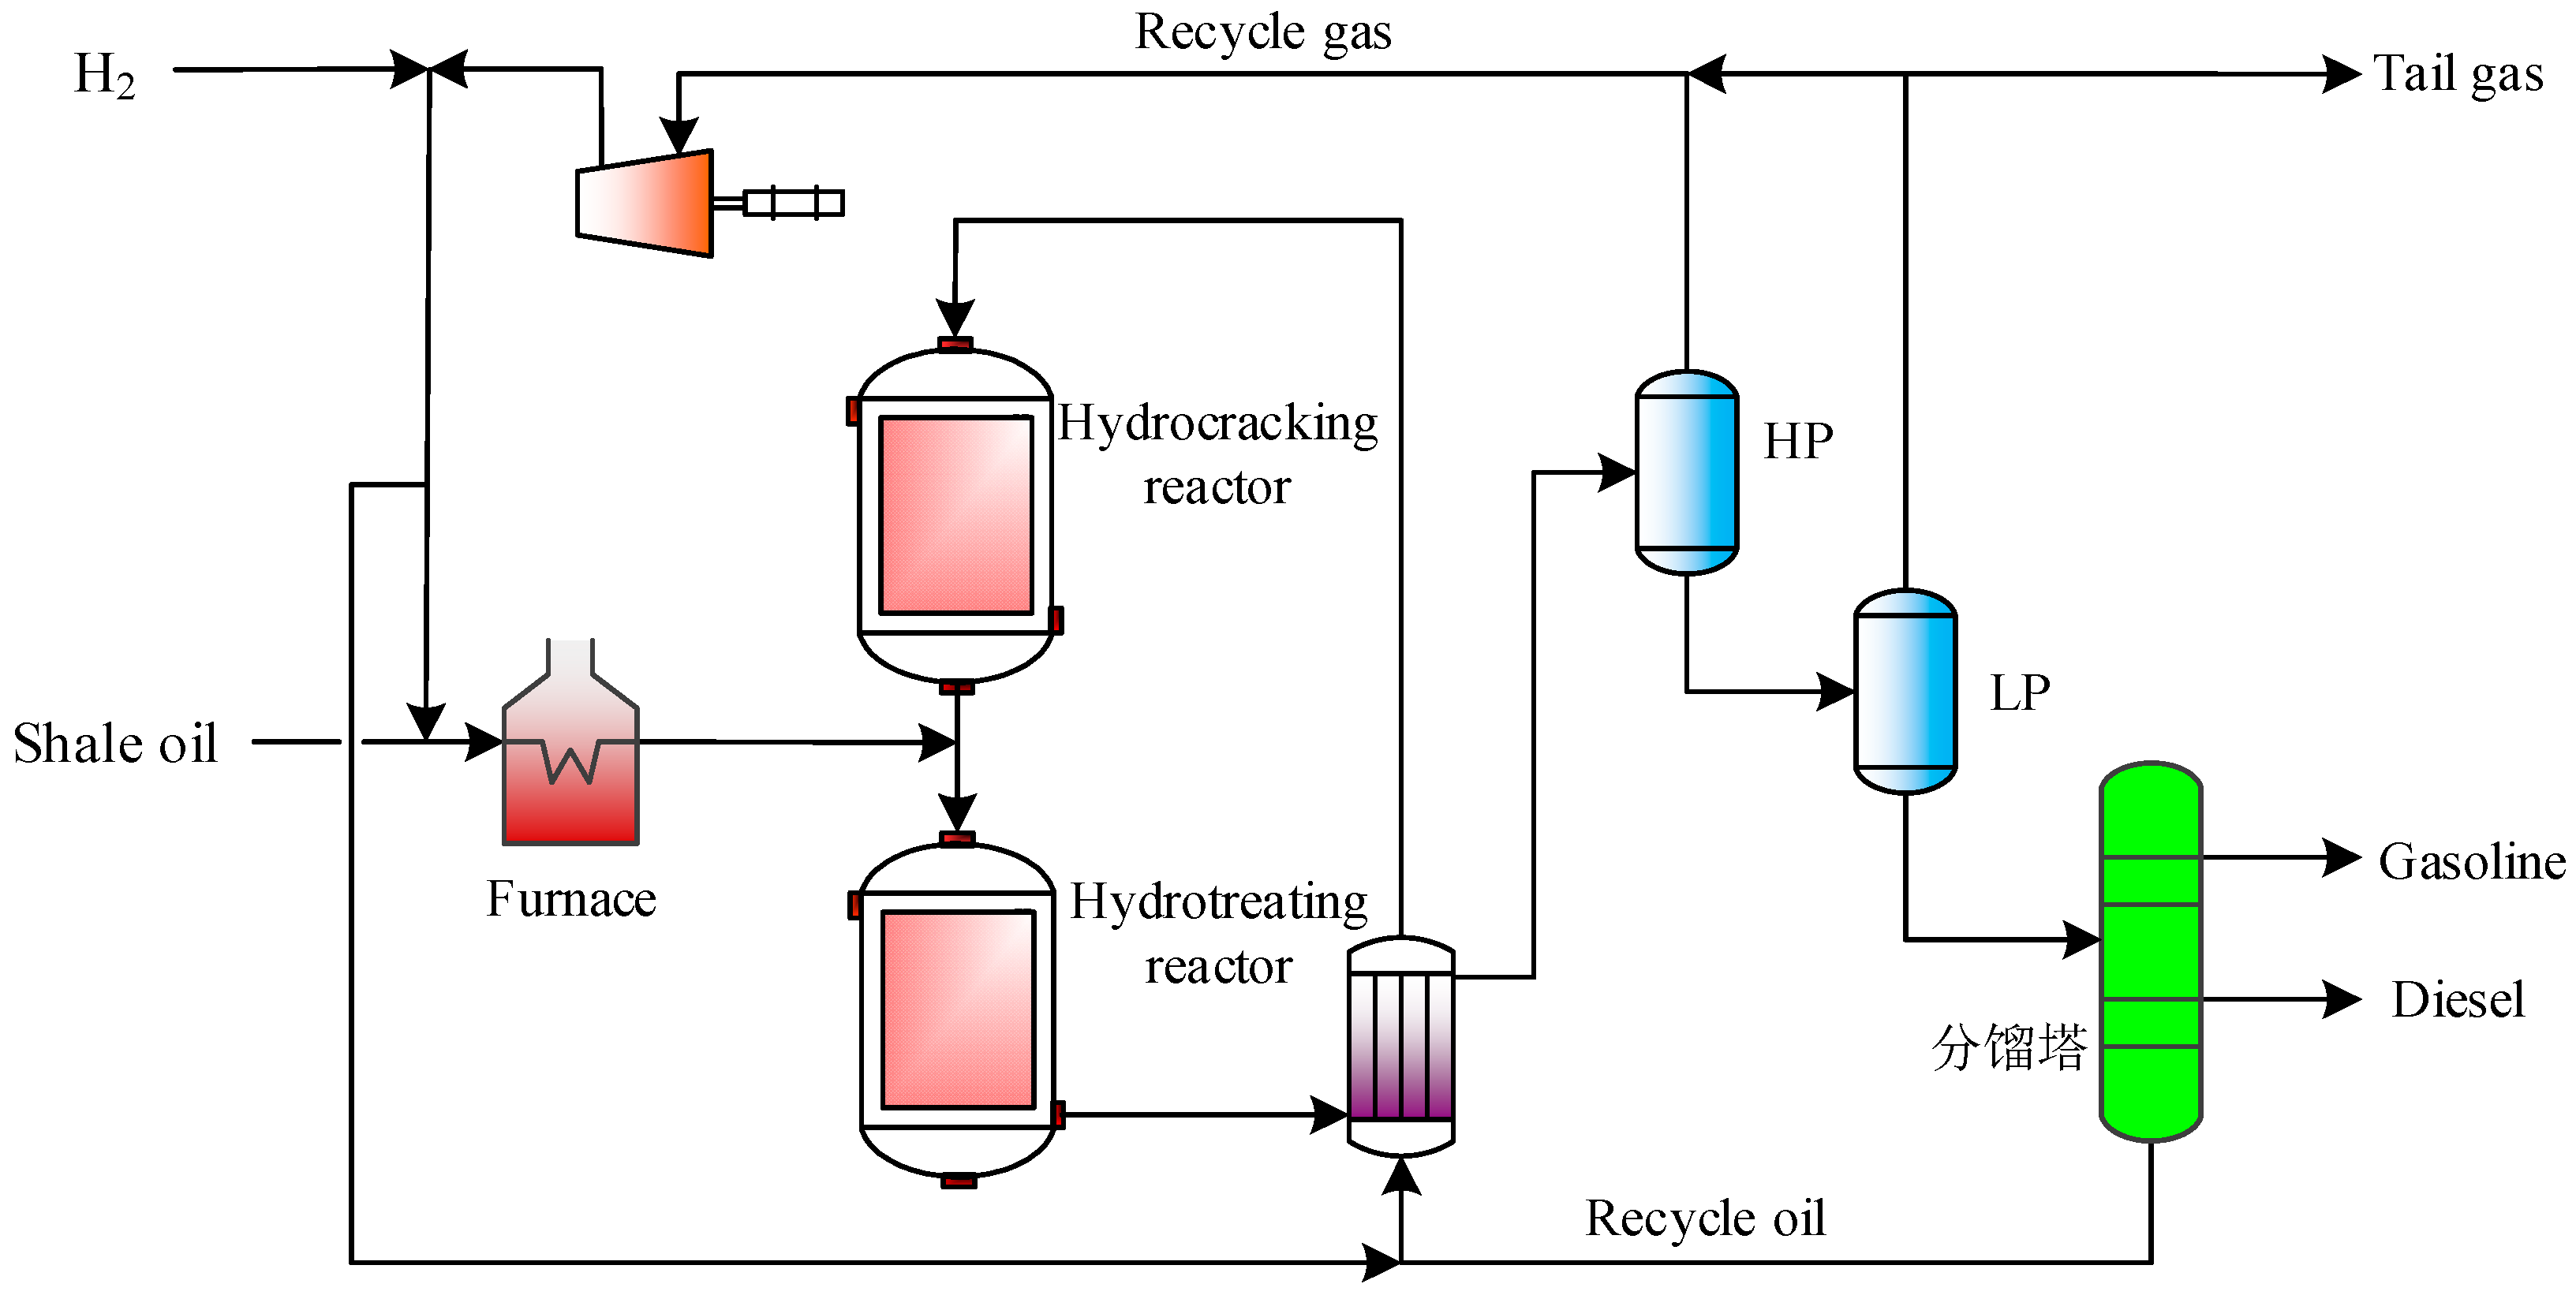
2.2.5. Shale Oil Hydrogenation Unit

The detailed modeling, simulation, and parameter optimization of shale oil hydrogenation can refer to previous work [2]. The flow diagram of shale oil light fraction hydrogenation is shown in Figure 6. The shale oil obtained from the OGS unit exchanges heat with the outlet flow of the hydrotreating reactor and is heated by the heating furnace, and then enters the atmospheric distillation tower for separation to obtain light components of <350 °C and heavy components of >350 °C. The light components enter the hydrotreating reactor and react with hydrogen for desulfurization, denitrification, and saturated ring-opening of naphthenic hydrocarbons. The flow outlet of the hydrotreating reactor enters the high-pressure separator and is divided into gas-phase and liquid-phase. Most of the gas-phase is recycled by the circulating compressor, and the liquid-phase enters the fractionator for fractionation to obtain high value-added products such as gasoline and diesel.
The flow diagram of shale oil full fraction hydrogenation is shown in Figure 7. Shale oil is mixed with hydrogen and enters the heating furnace for heating. The mixed material outlet of the heater enters the hydrotreating reactor, where desulfurization and denitrification reactions and partial cracking reactions occur. After heat exchange, the outlet stream of the hydrotreating reactor enters the high-pressure and low-pressure separator, which is divided into gas-phase and liquid-phase. Most of the gas-phase is recycled by the circulating compressor, and the liquid-phase enters the fractionator for fractionation to obtain high-value-added gasoline and diesel. The unconverted residual oil is extracted from the bottom of the fractionator and mixed with hydrogen for heat exchange before entering the hydrocracking reactor for the hydrocracking reaction. In the hydrocracking reaction, macromolecular hydrocarbons are hydrocracked to produce small-molecular hydrocarbons, which are recycled into the hydrotreating reactor for hydrogenation saturation.

3. Methodology

3.1. Technical Indicators

For technical indicators, the shale oil yield (Yshale oil) and the yield of light components of shale oil with a boiling point <350 °C (Ylight fraction) are mainly investigated. Their calculations are shown in Equations (17) and (18), respectively.
Y shale   oil = m shale   oil m oil   shale × w oil   content × 100 %
Y ligh   fraction = m gasoline + m diesel m shale   oil × 100 %
where moil shale, mshale oil, mgasoline, and mdiesel are mass flow rate of oil shale, shale oil, gasoline, and diesel, respectively; woil shale is the oil content in oil shale.

3.2. Economic Indicators

For economic indicators, the total capital investment (TCI), product cost (PC), and return on investment are studied. The calculation of the TCI is shown in Equation (19) [35,36].
TCI = TPEC ( 1 + R F i )
where TPEC is the equipment purchase cost; RFi is the proportion factor between other investment components in the TCI and TPEC. Detailed calculations can be found in the author’s previous work [2].
The calculation of PC is shown in Equation (19) [37,38].
PC = CR + CU + CO&M + CD + CPOC + CAC + CDSC
where CR is the cost of raw materials, CU is the cost of utilities, CO&M is the cost of maintenance and operation, CD is the depreciation cost, CPOC is the cost of plant management, CAC is the administrative cost, and CDSC is the sales cost. Detailed calculations can be found in the author’s previous work [2].

4. Results and Discussion

4.1. Parameter Analysis

(1)
Influence of blending oil shale/increasing air temperature on minimum stable burning calorific value
In Section 2.2.3, the heat balance shows that the combustion of semi-coke cannot completely provide the heat required for the pyrolysis of oil shale. Therefore, it is necessary to add additional oil shale for combustion. Burning of the semi-coke mixed with oil shale will increase the calorific value of fuel, increase the heat released by combustion, and decrease the minimum stable combustion calorific value. Figure 8 shows the changes in fuel heating value and its minimum steady burning calorific value with the oil shale mixing ratio. It can be seen that when the excess air coefficient is 1.2 and the air temperature is 25 °C, the fuel calorific value can meet the minimum stable combustion calorific value by blending with 3.2% oil shale. The processing capacity of oil shale is 375 t/h, and the capacity of semi-coke in the CFB is 302.51 t/h. The addition of 9.72 t/h oil shale in the CFB burned together with semi-coke can ensure the stable combustion of fuel and provide sufficient heat for the pyrolysis of oil shale.
Part of the hot ash and hot flue gas generated from semi-coke combustion is directly discharged, and this part of heat is not utilized. If a proper method is adopted to recover these heats, the minimum stable combustion calorific value can be further reduced. The direct way is to use hot ash or hot flue gas to heat the air to recover heat and increase the air temperature. However, the current process conditions for gas–solid heat transfer are limited. The heat of flue gas can be transferred to the air through the air preheater to improve the air temperature. According to the heat balance, the minimum stable combustion calorific value under different air temperatures can be obtained, as shown in Figure 9. The excess air coefficient is 1.2 and there is no burning of oil shale in the CFB. It can be obtained that, when the air temperature is increased to 220 °C, the fuel calorific value can meet the minimum stable combustion calorific value. The air temperature needs to be increased to 220 °C, which imposes certain requirements on the air preheater material and requires large additional investment. It is feasible to only use the method of recovering flue gas heat to heat the air, but it is not recommended to use it alone.
(2)
Molar flow ratio of MFe2O3/(MCO + MH2 + MCH4) and Msteam/MFe
For the RGCLH unit, the key parameters include the ratio of Fe2O3 at the inlet of the FR to the effective components (CO, H2, and CH4) in the retorting gas (MFe2O3/(MCO + MH2 + MCH4)), which reflects the conversion degree of the effective components in the retorting gas and the conversion rate of iron oxide. Another parameter is the ratio of the steam at the inlet of the RR to Fe (Msteam/MFe), to investigate the distribution of Fe Accompanied by the production of H2.
The influence of MFe2O3/(MCO + MH2 + MCH4) on gas compositions and conversion rate of iron oxide is shown in Figure 10. In theory, it is expected that the effective components of CO, H2, and CH4 in the FR will be completely oxidized to CO2 and H2O at a lower ratio. This means that the conversion rate of iron oxide is high at a lower ratio, and ultimately leads to a higher yield of hydrogen. It also means that the circulation rate of the oxygen carrier is low. It can be seen from Figure 10 that by increasing the ratio, the conversion rate of the effective component in the retorting gas increases, while the conversion rate of iron oxide decreases. In order to convert all the effective components into CO2 and H2O (conversion rate > 99.9%), the value of MFe2O3/(MCO + MH2 + MCH4) is determined as 1.2. At this time, the conversion rate of iron oxide is about 45%.
The influence of Msteam/MFe on the iron distribution and the steam conversion rate is shown in Figure 11. In theory, we hope that Fe can be completely oxidized to Fe3O4 at a lower ratio, so as to maximize the production of hydrogen. It can be seen that with the increase in Msteam/MFe, Fe is first oxidized to FeO. When the feed ratio reaches 1.5, almost all Fe is converted into FeO. At this time, the steam conversion rate is 70%. Continue to increase the feed ratio, and FeO begins to convert to Fe3O4. When the feed ratio reaches 3.5, almost all FeO is converted to Fe3O4. At this time, the steam conversion rate can reach 55%. The results show that when the feed ratio is 3.5 and the reaction conditions are 750 °C and 3.0 MPa, all Fe in the RR is converted into Fe3O4. In addition, the steam conversion rate in the reaction of hydrogen produce is relatively maintained at more than 55%.

4.2. System Simulation Analysis

In this study, the CLeSTL process was modeled and simulated. The semi-coke, retorting gas, and shale oil are produced from oil shale pyrolysis. The semi-coke is burned in a CFB, and the generated ash is recycled into the retort to provide heat for oil shale pyrolysis. The retorting gas generated from pyrolysis enters the CLH unit to produce hydrogen. The hydrogen is then used for light fraction hydrogenation and full fraction hydrogenation of shale oil. After simulation, the material flow of the CLeSTL process is obtained, as shown in Figure 12 and Figure 13.
In Figure 12, 375 t/h of oil shale mixed with 1370 t/h of ash enters the retort for pyrolysis, and 303 t/h of semi-coke, 27.2 t/h of retorting gas, and 32.3 t/h of shale oil are obtained through pyrolysis. Shale oil is first separated by atmospheric distillation to obtain 22.2 t/h of light component and 9.9 t/h of heavy component (heavy oil). After hydrotreating and fractionation of light components, 5.66 t/h of gasoline and 15.1 t/h of diesel oil are obtained. The hydrogen consumption in the hydrogenation process is 850 kg/h, and the hydrogen is produced by the retorting gas. A quantity of 27.2 t/h of retorting gas enters the CLH unit for reaction to obtain 1.22 t/h of hydrogen. In addition to the hydrogen consumed by the hydrogenation of light components of shale oil, 370 kg/h of hydrogen is left.
In contrast to Figure 12, in Figure 13, the shale oil produced by oil shale pyrolysis is mainly hydrogenated by the full fraction, so the consumption of hydrogen increases. However, 1.22 t/h of hydrogen produced by 27.2 t/h of retorting gas cannot meet the hydrogen consumption required for the hydrogenation of 32.3 t/h of shale oil full fraction, and an additional 1.36 t/h of hydrogen needs to be provided. At this time, 7.15 t/h of gasoline, 21.8 t/h of diesel oil, and 3.25 t/h of asphalt can be obtained from hydrotreating and hydrocracking.

4.3. Technical Performance Analysis

According to the simulation in Section 4.2 and Equations (17) and (18), the utilization ratio of oil shale, shale oil yield, and the yield of light components of shale oil with boiling point <350 °C in the CLeSTL process are calculated to be 100%, 95.7%, and 64%–83%, respectively, as shown in Figure 14. Compared with the traditional Fushun-type oil shale-to-liquid fuels process (FsSTL) [8,9], the utilization rate of oil shale has increased by 20 percentage points; shale oil yield increased from 65% to 95.7%; The yield of light components of shale oil increased from 20% to 64%–83%. The new CLeSTL process shows good superiority in terms of technical performance.

4.4. Economical Performance Analysis

For economic performance analysis, four different scenarios of the new process were considered, which were CLeSTL-1 (oil light fraction hydrogenation with outsourcing hydrogen), CLeSTL-2 (oil light fraction hydrogenation with produced hydrogen from the RGCLH), CLeSTL-3 (oil full fraction hydrogenation with outsourcing hydrogen), and CLeSTL-4 (oil full fraction hydrogenation with produced hydrogen from the RGCLH).
(1)
Total capital investment analysis
The TCI of the CLeSTL under the four different scenarios was calculated based on the SHCOSR, as shown in Figure 15. The TCI of the SHCOSR with the processing capacity of 3.0 Mt/y is 1843 × 106 CNY/y. The TCIs of the CLeSTL-1, CLeSTL-2, CLeSTL-3, and CLeSTL-4 with the same processing capacity are 2048 × 106, 2200 × 106, 2246 × 106, and 2398 × 106 CNY/y, respectively. The TCIs of the CLeSTL-1 and CLeSTL-3 are increased by 11% and 22% compared with the benchmark of SHCOSR. This is mainly because CLeSTL-1 and CLeSTL-3 add the SOH unit on the basis of the benchmark. However, the TCI of the CLeSTL-3 is increased by 10% compared with that of the CLeSTL-1 because the CLeSTL-1 is mainly aimed at light fraction hydrogenation of shale oil, whereas CLeSTL-3 is aimed at full fraction hydrogenation of shale oil. The treatment scale of hydrogenation in the CLeSTL-3 is larger, so the investment increases accordingly. The TCIs of the CLeSTL-2 and CLeSTL-4 are increased by 19% and 30%, respectively, compared with the benchmark. This is mainly because CLeSTL-2 and CLeSTL-4 add the RGCLH unit and SOH unit on the basis of the benchmark. However, the TCI of the CLeSTL-4 is increased by 9% compared with that of the CLeSTL-2. This is mainly because the CLeSTL-4 is full fraction hydrogenation of shale oil, and the hydrogen consumption is larger. Thus, the scale of the SOH unit increases accordingly, resulting in an increase in investment.
(2)
Production cost analysis
The PC of the CLeSTL under four different scenarios was calculated on the basis of the SHCOSR, as shown in Figure 16. The PCs of the CLeSTL-1, CLeSTL-2, CLeSTL-3, and CLeSTL-4 are 1018 × 106, 970 × 106, 1392 × 106, and 1240 × 106 CNY/y, respectively. The PCs of the CLeSTL-1 and CLeSTL-3 are increased by 44% and 96% compared with the benchmark because the cost of purchased hydrogen leads to the increase in raw material cost. The raw material costs of the CLeSTL-1 and CLeSTL-3 increase 42% and 128% compared with that of the baseline. In addition, as the SOH unit is added in the CLeSTL-1 and CLeSTL-3, the utilities cost and depreciation cost are increased. The PC of the CLeSTL-3 increases 60% compared with that of the CLeSTL-1 because the CLeSTL-3 is full fraction hydrogenation of shale oil, and the hydrogen consumption is about 3.0 times that of CLeSTL-1, resulting in a large increase in PC.
Compared with the benchmark, the PCs of the CLeSTL-2 and CLeSTL-4 are increased by 34% and 75%. This is mainly because the CLeSTL-2 and CLeSTL-4 change the high-cost purchased hydrogen into the hydrogen produced by the retorting gas through the RGCLH. The RGCLH consumes the Fe2O3 carrier, so the raw material cost of the CLeSTL-2 is increased by 30%. Compared with the CLeSTL-2, the CLeSTL-4 is full fraction hydrogenation of shale oil with large consumption of hydrogen. However, the hydrogen produced by the RGCLH cannot provide all the hydrogen required for shale oil hydrogenation in the CLeSTL-4. For the CLeSTL-4, it is also necessary to purchase hydrogen to meet the hydrogen consumption of the shale oil hydrogenation. Therefore, the cost of raw materials in PC of the CLeSTL-4 increases 97% compared with the baseline. In addition, due to the addition of the RGCLH unit and SOH unit in the CLeSTL-2 and CLeSTL-4, the utilities cost and depreciation cost are increased.
Both the CLeSTL-1 and CLeSTL-2 are light fraction hydrogenation of shale oil. The PC of the CLeSTL-2 is 5% lower than that of the CLeSTL-1. This is mainly because the CLeSTL-2 uses the RGCLH to replace the high-cost purchased hydrogen, which saves about 9% of the raw material cost. For the CLeSTL-2, in addition to the hydrogen consumption of hydrogenation of shale oil, there is still remaining hydrogen, which can be exported as hydrogen products. In the CLeSTL-4, beside the hydrogen supplied by the RGCLH unit, it is also necessary to purchase additional hydrogen to meet the demand of hydrogenation. Therefore, the raw material cost of the CLeSTL-4 is 52% higher than that of the CLeSTL-2. However, the raw material cost of the CLeSTL-4 is 14% lower than that of the CLeSTL-3, because the hydrogen consumption in the CLeSTL-3 is the same as that in the CLeSTL-4; the only difference is that all hydrogen in the CLeSTL-3 is purchased.
(3)
Return on investment analysis
The ROIs (returns on investment) of the CLeSTL-1, CLeSTL-2, CLeSTL-3, and CLeSTL-4 are 1323 × 106, 1391 × 106, 1608 × 106, and 1608 × 106 CNY/y, respectively. Detailed calculation data are shown in Table 6.
The sales profit is equal to the sales revenue minus the production cost. After calculation, the total profits of the CLeSTL-1, CLeSTL-2, CLeSTL-3, and CLeSTL-4 are 305 × 106, 421 × 106, 216 × 106, and 368 × 106 CNY/y, respectively. Net profit equals total profit minus sales tax and surcharges, which include urban construction tax, education surcharges, and resource tax. Through calculation, the total net profits of the CLeSTL-1, CLeSTL-2, CLeSTL-3, and CLeSTL-4 are 301 × 106, 415 × 106, 213 × 106, and 363 × 106 CNY/y, respectively. The ratio of net profit to TCI is the ROI. The ROIs under four different scenarios are calculated to be 14.7%, 19.0%, 9.6%, and 15.2% respectively, as shown in Figure 17. In addition, in Figure 17, we also consider the positive and negative error lines of each scenario under the sales price corresponding to the high crude oil price (100 USD/bbl) and low crude oil price (50 USD/bbl).
The ROIs of the CLeSTL−1 and CLeSTL−2 are increased by 0.7 and 5.0 percentage points, respectively, compared with that of the benchmark. The income increase of the CLeSTL−1 is small, mainly because the CLeSTL−1 uses purchased hydrogen for light fraction hydrogenation of shale oil. The higher cost of purchased hydrogen reduces the income of the CLeSTL−1 process. However, the CLeSTL−2 uses the RGCLH to produce hydrogen, which greatly reduces the cost of raw materials. In the CLeSTL−2, the produced hydrogen can be exported as hydrogen products in addition to the part of the hydrogen used for the light fraction hydrogenation of shale oil. Therefore, compared with the CLeSTL−1, the income of the whole process of the CLeSTL−2 increases significantly. The ROI of the CLeSTL−3 is 4.4 percentage points lower than that of the benchmark. The CLeSTL−3 is the same as the CLeSTL−1, using purchased hydrogen for shale oil hydrogenation. However, the CLeSTL−3 is the full fraction hydrogenation of shale oil. The hydrogen consumption is 3.0 times that of the CLeSTL−1. The cost of outsourcing hydrogen is greatly increased, thus greatly reducing the income of the CLeSTL−3. The CLeSTL−4 is the same as the CLeSTL−3, which is the full fraction hydrogenation of shale oil, and the consumption of hydrogen is large. However, the difference is that most of the hydrogen consumption in the CLeSTL−4 is provided by the RGCLH. Therefore, the ROI of the CLeSTL−4 is 5.5 percentage points higher than that of the CLeSTL−3. Compared with the CLeSTL−4, the ROI of the CLeSTL-2 increases 4 percentage points. The main reason for this is that the hydrogen consumption in the CLeSTL−4 is larger than that in the CLeSTL−2. Based on the above analysis, the CLeSTL−2 has higher benefits and is relatively promising from the perspective of economic benefits.
In addition, the ROIs of the four different scenarios in Figure 17 are marked with a positive and negative error line. The positive error line represents the ROI when the crude oil price reached a higher level of 100 USD/bbl. The negative error line represents the ROI when the crude oil price is at a low level of 50 USD/bbl. It can be seen that when the oil price is 50 USD/bbl, the ROI of the CLeSTL−3 is −5.8%, which is negative and not economically competitive. Although the ROIs of the CLeSTL−1 and CLeSTL−4 are positive, they have little profit space. The profit margin of the CLeSTL-2 is the largest, and its ROI is 4.6%, which is a promising solution.

5. Conclusions

In order to realize the resource utilization of retorting gas and shale oil hydrogenation of the solid heat carrier moving bed with internals technology, the chemical looping enhanced oil shale-to-liquid fuels (CLeSTL) process is proposed in this paper. The retorting gas from oil shale retorting is used to produce hydrogen by chemical looping hydrogen production technology, and then hydrogen is used for shale oil hydrogenation. Through technical and economic analyses, the following conclusions are obtained:
(1)
For the solid heat carrier moving bed with internals, in order to provide enough heat for 375 t/h of oil shale retorting, the combustion capacity of the semi-coke is 302.51 t/h and the addition of 9.72 t/h of oil shale in the circulating fluidized bed can ensure the stable combustion of fuel.
(2)
Compared with the traditional Fushun-type oil shale-to-liquid fuels process, the utilization rate of raw oil shale of the CLeSTL process is increased from 80% to 100%; the shale oil yield increased from 65% to 95.7%; and the yield of light components of shale oil increased from 20% to 64%–83%.
(3)
The ROIs of the CLeSTL-1, CLeSTL-2, CLeSTL-3, and CLeSTL-4 processes are 14.7%, 19.0%, 9.6%, and 15.2%, respectively. The ROI of the CLeSTL-2 process is the highest. Specifically, when the oil price is lower (50 USD/bbl), the ROI of the CLeSTL-2 process is 5%, which shows strong anti-risk ability.

Author Contributions

Conceptualization, Q.W. and H.Z.; methodology, H.Z.; software, H.Z. and Y.Y.; validation, Y.Y.; formal analysis, Q.W.; writing—original draft preparation, Q.W. and H.Z.; writing—review and editing, Q.W. and Y.Y.; supervision, H.Z. and Y.Y.; project administration, Y.Y. All authors have read and agreed to the published version of the manuscript.

Funding

This research was funded by the Joint Funds of the National Natural Science Foundation of China (No. U22A20415).

Data Availability Statement

The data presented in this study are available on request from the first author.

Conflicts of Interest

The authors declare no conflict of interest.

References

  1. IEA (International Energy Agency). BP Word Energy Outlook. 2022. Available online: https://www.bp.com/content/dam/bp/business-sites/en/global/corporate/pdfs/energy-economics/energy-outlook/bp-energy-outlook-2022.pdf (accessed on 1 October 2022).
  2. Zhou, H.; Li, H.; Duan, R.; Yang, Q. An integrated scheme of coal-assisted oil shale efficient pyrolysis and high-value conversion of pyrolysis oil. Energy 2020, 196, 117106. [Google Scholar] [CrossRef]
  3. Zuckerman, G. The Frackers: The Outrageous inside Story of the New Billionaire Wildcatters; Portfolio Publishing: New York, NY, USA, 2013. [Google Scholar]
  4. Li, X.; Zhou, H.; Wang, Y.; Qian, Y.; Yang, S. Thermoeconomic analysis of oil shale process with gas or solid heat carrier. Energy 2015, 113, 639–647. [Google Scholar]
  5. Kang, Z.; Zhao, Y.; Yang, D. Review of oil shale in-situ conversion technology. Appl. Energy 2020, 269, 115121. [Google Scholar] [CrossRef]
  6. Wang, S.; Jiang, X.; Han, X.; Tong, J. Effect of retorting temperature on product yield and characteristics of non-condensable gases and shale oil obtained by retorting Huadian oil shales. Fuel Process. Technol. 2014, 121, 9–15. [Google Scholar] [CrossRef]
  7. Zhao, J.; Wang, L.; Yang, D.; Kang, Z. Characteristics of oil and gas production of oil shale pyrolysis by water vapor injection. Oil Shale 2022, 39, 153–168. [Google Scholar] [CrossRef]
  8. Qian, J.; Li, S. Oil Shale Retorting Technologies; China Petrochemcal Press: Beijing, China, 2014. (In Chinese) [Google Scholar]
  9. Qian, J.; Yin, L.; Wang, J.; Li, S.; Han, F.; He, Y. Oil Shale-Complementary Energy of Petroleum; China Petrochemcal Press: Beijing, China, 2008. (In Chinese) [Google Scholar]
  10. Qian, Y.; Yang, Q.; Zhang, J.; Zhou, H.; Yang, S. Development of an integrated oil shale retorting process with coal gasification for hydrogen production. Ind. Eng. Chem. Res. 2014, 53, 19970–19978. [Google Scholar] [CrossRef]
  11. Lai, D.; Chen, Z.; Shi, Y.; Lin, L.; Zhan, J.; Gao, S.; Xu, G. Pyrolysis of oil shale by solid heat carrier in an innovative moving bed with internals. Fuel 2015, 159, 943–951. [Google Scholar] [CrossRef]
  12. Chiesa, P.; Giovanni, L.; Alberto, M.; Matteo, R.; Vincenzo, P. Three-reactors chemical looping process for hydrogen production. Int. J. Hydrogen Energy 2008, 33, 2233–2245. [Google Scholar] [CrossRef]
  13. Luberti, M.; Ahn, H. Review of polybed pressure swing adsorption for hydrogen ppurification. Int. J. Hydrogen Energy 2022, 61, 6106–6124. [Google Scholar]
  14. Zhou, H.; Meng, W.; Wang, D.; Li, G.; Li, H.; Liu, Z.; Yang, S. A novel coal chemical looping gasification scheme for synthetic natural gas with low energy consumption for CO2 capture: Modelling, parameters optimization, and performance analysis. Energy 2021, 225, 120249. [Google Scholar] [CrossRef]
  15. Anaya, K.; Oni, A.O.; Kumar, A. Investigation the techno-economic and environmental performance of chemical looping technology for hydrogen production. Sustain. Energy Technol. Assess. 2023, 56, 103008. [Google Scholar]
  16. Xiang, W.; Chen, Y. Hydrogen and electricity from coal with carbon dioxide separation using chemical looping reactors. Energy Fuels 2007, 21, 2272–2277. [Google Scholar] [CrossRef]
  17. Sridhar, D.; Tong, A.; Kim, H.; Zeng, L.; Li, F.; Fan, L. Syngas chemical looping process: Design and construction of a 25 kWth sub-pilot unit. Energy Fuels 2012, 26, 2292–2302. [Google Scholar] [CrossRef]
  18. Tong, A.; Sridhar, D.; Sun, Z.; Kim, H.; Zeng, L.; Wang, F.; Wang, D.; Kathe, M.V.; Luo, S.; Sun, Y.; et al. Continuous high purity hydrogen generation from a syngas chemical looping 25kWth sub-pilot unit with 100% carbon capture. Fuel 2012, 103, 495–505. [Google Scholar] [CrossRef]
  19. Kim, H.; Wang, D.; Zeng, L.; Bayham, S.; Tong, A.; Chung, E.; Kathe, M.V.; Luo, S.; McGiveron, O.; Wang, A.; et al. Coal direct chemical looping combustion process: Design and operation of a 25 kWth sub-pilot unit. Fuel 2013, 108, 370–384. [Google Scholar] [CrossRef]
  20. Tong, A.; Bayham, S.; Kathe, M.; Zeng, L.; Luo, S.; Fan, L. Iron-based syngas chemical looping process and coal-direct chemical looping process development at Ohio State University. Appl. Energy 2014, 113, 1836–1845. [Google Scholar] [CrossRef]
  21. Bayham, S.; Kim, H.; Wang, D.; Tong, A.; Zeng, L.; McGiveron, O.; Kathe, M.V.; Chung, E.; Wang, W.; Wang, A.; et al. Iron-based coal direct chemical looping combustion process: 200-h continuous operation of a 25 kWth sub-pilot unit. Energy Fuels 2013, 27, 1347–1356. [Google Scholar] [CrossRef]
  22. Li, F.; Fan, L. Clean coal conversion processes-progress and challenges. Energy Environ. Sci. 2008, 1, 248–267. [Google Scholar] [CrossRef]
  23. Zeng, L.; He, F.; Li, F.; Fan, L. Coal-direct chemical looping gasification for hydrogen production: Reactor modeling and process simulation. Energy Fuels 2012, 26, 3680–3690. [Google Scholar] [CrossRef]
  24. Zhao, G.; Su, C.; Quan, H. Study on shale oil processing by single-stage reverse sequencing combination hydrocracking-hydrotreating process (FHC-FHT). Pet. Refin. Eng. 2012, 42, 36–38. (In Chinese) [Google Scholar]
  25. Yu, H.; Li, S.; Jin, G.; Tang, X. Hydrotreating of the diesel distillate from Huadian shale oil for production of clean fuel. J. Fuel Chem. Technol. 2010, 38, 297–301. (In Chinese) [Google Scholar]
  26. Yu, H.; Li, S.; Jin, G. Hydrotreating of nitrides in diesel distillate in Huadian shale oil. Petrochem. Technol. 2011, 39, 162–166. (In Chinese) [Google Scholar]
  27. Edrisi, A.; Mansoori, Z.; Dabir, B.; Shahnazari, A. Hydrogen, nitrogen and carbon dioxide production through chemical looping using iron-based oxygen carrier—A green plant for H2 and N2 production. Int. J. Hydrog. Energy 2014, 39, 10380–10391. [Google Scholar] [CrossRef]
  28. Qing, W.; Xinmin, W.; Shuo, P. Study on the structure, pyrolysis kinetics, gas release, reaction mechanism, and pathways of Fushun oil shale and kerogen in China. Fuel Process. Technol. 2022, 225, 107058. [Google Scholar] [CrossRef]
  29. Xie, F. Fundamental Research on Oil Shale Pyrolysis Process; Institute of Process Engineering of Chinese Academy of Sciences: Beijing, China, 2011. (In Chinese) [Google Scholar]
  30. Wang, T.; Lu, S.; Zhu, Y. Study on the thermal properties of Chinese oil shale. II. The measurement of specific heat of oil shale, char, and spent shale. J. Fuel Chem. Technol. 1987, 15, 311–316. (In Chinese) [Google Scholar]
  31. Lin, L.; Lai, D.; Guo, E.; Zhang, C.; Xu, G. Oil shale pyrolysis in indirectly heated fixed bed with metallic plates of heating enhancement. Fuel 2016, 163, 48–55. [Google Scholar] [CrossRef]
  32. Cormos, C. Evaluation of iron based chemical looping for hydrogen and electricity co-production by gasification process with carbon capture and storage. Int. J. Hydrog. Energy 2010, 35, 2278–2289. [Google Scholar] [CrossRef]
  33. Rydén, M.; Arjmand, M. Continuous hydrogen production via the steam-iron reaction by chemical looping in a circulating fluidized-bed reactor. Int. J. Hydrog. Energy 2012, 37, 4843–4854. [Google Scholar] [CrossRef]
  34. Zhou, H.; Ma, Y.; Yang, Q.; Wang, D.; Li, H.; Li, G.; Yang, Y.; Fan, Z.; Ji, D.; Li, N.; et al. A new scheme for ammonia and fertilizer generation by coal direct chemical looping hydrogen process: Concept design, parameter optimization, and performance analysis. J. Clean. Prod. 2022, 363, 132445. [Google Scholar] [CrossRef]
  35. Yang, Q.; Zhu, S.; Yang, Q.; Huang, W.; Yu, P.; Zhang, D. Comparative techno-economic analysis of oil-based and coal-based ethylene glycol processes. Energy Convers. Manag. 2019, 198, 111814. [Google Scholar] [CrossRef]
  36. Zhou, Y.; Xu, Z.; Zhang, J.; Xing, J.; Jia, J.; Cui, P. Development and techno-economic evaluation of coal to ethylene glycol process and allam power cycle and carbon capture and storage and integration process. Fuel 2023, 332, 126121. [Google Scholar] [CrossRef]
  37. Zhang, J.; Yang, Q.; Fan, Y.; Zhang, D.; Yu, J. Conceptual design and techno-economic analysis of a coproduction system for ethylene glycol and LNG from steel mill off-gases. Fuel 2022, 318, 123693. [Google Scholar] [CrossRef]
  38. Zhou, H.; Wang, J.; Meng, W.; Wang, K.; Li, G.; Yang, Y.; Fan, Z.; Wang, D.; Ji, D. Comparative investigation of CO2-to-methanol process using different CO2 capture technologies. Fuel 2023, 338, 127359. [Google Scholar] [CrossRef]
Figure 1. Schematic diagram of oil shale retorting by a solid heat carrier moving bed with internals.
Processes 11 00929 g001
Figure 2. Schematic diagram of the proposed CLeSTL process.
Processes 11 00929 g002
Figure 3. Matrix for calculating the yields of oil shale pyrolysis products.
Processes 11 00929 g003
Figure 4. Flow diagram of oil-gas separation unit.
Processes 11 00929 g004
Figure 5. Flow diagram of the RGCLH process.
Processes 11 00929 g005
Figure 6. Flow diagram of shale oil light fraction hydrogenation.
Processes 11 00929 g006
Figure 7. Flow diagram of shale oil full fraction hydrogenation.
Processes 11 00929 g007
Figure 8. Changes in fuel heating value and its minimum steady burning calorific value with oil shale mixing ratio.
Processes 11 00929 g008
Figure 9. Changes in fuel heating value and its minimum steady burning calorific value with air temperature.
Processes 11 00929 g009
Figure 10. Influence of MFe2O3/(MCO + MH2 + MCH4) on gas compositions and conversion rate of iron oxide.
Processes 11 00929 g010
Figure 11. Influence of Msteam/MFe on iron distribution and steam conversion rate.
Processes 11 00929 g011
Figure 12. Material flow of the CLeSTL process (oil light fraction hydrogenation).
Processes 11 00929 g012
Figure 13. Material flow of the CLeSTL process (oil full fraction hydrogenation).
Processes 11 00929 g013
Figure 14. Technical performance comparison of the FsSTL and CLeSTL processes.
Processes 11 00929 g014
Figure 15. Distribution of capital investment for CLeSTL with different scenarios.
Processes 11 00929 g015
Figure 16. Distribution of production cost for CLeSTL with different scenarios.
Processes 11 00929 g016
Figure 17. ROIs for CLeSTL with different scenarios.
Processes 11 00929 g017
Table 1. Proximate and elemental analyses of oil shale.
Proximate Analysis (wt.%, ar)Elemental Analysis (wt.%, ar)
MFCVACHONS
Oil shale3.431.7722.8371.9750.166.3738.121.993.35
Table 2. Key unit operation parameters of the CLeSTL process.
Key ParametersValueKey ParametersValue
OSR unit a OGS unit c
Retorting temperature (°C)500Washing tower temperature (°C)118
Retorting pressure (MPa)0.1Cooling tower temperature (°C)51
Oil shale flow rate (t/h)375Electrostatic tower temperature (°C)58
Ash/Oil shale (t/t) SOH unit d
CLH unit b Temperature (°C)360 e/390 f
Fuel reactor’s temperature (°C)900Pressure (MPa)4.0 e/15.7 f
Fuel reactor’s pressure (MPa)3.0LHSV (h−1)1.0 e/0.8 f
Steam reactor’s temperature (°C)750V (H2)/V (Feed oil)430 e/800 f
Steam reactor’s pressure (MPa)3.0Catalyst WNi e/MoNi f
Air reactor’s temperature (°C)1170CFB unit g
Air reactor’s pressure (MPa)0.1Combustion temperature (°C)800
n (Fe2O3)/m (oil shale)1.5Adiabatic efficiency (%)95
n (H2O)/m (oil shale)5Isentropic efficiency (%)85
a [11]. b [22,23]. c [8]. d [24,25,26]. e Shale oil light fraction hydrogenation (OLFH). f Shale oil full fraction hydrogenation (OFFH). g [27].
Table 3. Elemental analyses of shale oil and semi-coke.
Elemental Analyses (wt.%)CHONS
Shale oil84.6011.162.731.140.37
Semi-coke49.425.4238.792.324.05
Table 4. Comparison between simulation and industrial data.
ComponentMass Fraction (%)
Simulation DataIndustrial Data
Semi-coke80.6781.01
CO0.400.38
CO23.933.91
CH40.570.56
C2H40.21-
C2H60.21-
C3H60.31-
C3H80.02-
H20.240.25
NH30.01-
H2S0.05-
H2O3.923.90
C15H129.459.28
Table 5. Simulation results of the oil–gas separation unit.
Stream123456789
Water (t/h)20.8176.84289.382.03174.81445.42873.262.030.00
Retorting gas (t/h)22.3521.950.4021.950.000.000.0021.950.00
Shale oil (t/h)35.4414.9820.466.428.560.000.003.1932.25
Total flow (t/h)78.59213.77310.2430.4183.37445.42873.2627.1732.25
Temperature (°C)500120116524966304570
Pressure (MPa)0.10.10.10.10.10.10.10.10.1
Table 6. Sales income for CLeSTL with different scenarios.
ItemPrice
(CNY)
OLFHOFFH
OutputIncome aOutputIncome a
Gasoline (t)81504.5 × 1043695.7 × 104466
Diesel (t)655312.1 × 10478917.5 × 1041142
Residual (t)20807.9 × 104165--
Hydrogen (t)23,0003.0 × 10368--
Electricity (kWh)0.58.7 × 107448.7 × 10744
Total income 1391 1608
a unit × 106 CNY.
Disclaimer/Publisher’s Note: The statements, opinions and data contained in all publications are solely those of the individual author(s) and contributor(s) and not of MDPI and/or the editor(s). MDPI and/or the editor(s) disclaim responsibility for any injury to people or property resulting from any ideas, methods, instructions or products referred to in the content.

