Article

Research on the Effect of Crucial Parameters on Ice Borehole Deformations Using a Proposed Computation Model

1
College of Construction Engineering, Jilin University, Changchun 130026, China
2
Key Laboratory of Drilling and Exploitation Technology in Complex Conditions, Ministry of Natural Resources, Changchun 130026, China
3
CNOOC Research Institute Ltd., Beijing 100010 , China
*
Author to whom correspondence should be addressed.
Processes 2023, 11(4), 1150; https://doi.org/10.3390/pr11041150
Submission received: 16 March 2023 / Revised: 3 April 2023 / Accepted: 7 April 2023 / Published: 9 April 2023
(This article belongs to the Section Advanced Digital and Other Processes)

Abstract

:
This paper proposes a model for determining deformation in the upper 50% of an ice borehole. Based on this model, the borehole deformation of DK-1 at Dome A was studied. Furthermore, the effects of surface temperature, temperature gradient, surface snow density, and drilling fluid density on borehole deformation were investigated. The results showed that borehole shrinking, expansion, and mixed existence occurred simultaneously in DK-1. Borehole deformation increased with increasing surface temperature, while temperature gradient had a minimal effect. Borehole deformation also increased with increasing surface snow density and decreasing drilling fluid density when the borehole shrank; however, the situation was reversed when the borehole expanded. The influence of ice temperature was dominant in deformation. However, when depth exceeded 1200 m, the sensitivity of ice borehole deformation in the direction of the minimum principal stress increased with an increase in drilling fluid density. This study provides meaningful guidance for polar-drilling engineering.

1. Introduction

Polar regions have abundant natural resources [1,2], and polar drilling is necessary for the exploration and exploitation of these polar resources. In addition, ice cores contain substantial information regarding geological changes, and interest in ice cores has increased dramatically over the past few decades. Currently, ice drilling is the most common method for obtaining ice cores. Safe and efficient ice drilling methods have become important for allowing scientists to obtain a complete ice core while maintaining the stability of the ice borehole wall.
Borehole wall instability has been widely studied in oil and gas development. However, owing to the properties of ice, the deformation of ice boreholes is different from that involved in oil and gas well drilling. Ice displays a wide range of mechanical properties under various stress conditions [3]. The rheological properties of ice result in deformation at low stress (which is more commonly observed) [4,5,6,7]. The deformation of the borehole wall is caused by the difference between the drilling fluid pressure and the ice pressure in the borehole. In practice, it is difficult to achieve pressure balance in a borehole because the properties of the ice and drilling fluid change with temperature and pressure. A negative pressure difference may cause borehole shrinking problems, and the drill may become stuck in the borehole. This was observed in 1991 in the 5G borehole, at a depth of 2250 m, and in 1996 in the Dome F deep ice drilling borehole, at a depth of 720 m [8,9]. The same situation was observed in the Dome A deep-ice drilling borehole at a depth of 120–150 m during the 2016–2017 working season. In contrast, a positive pressure difference can lead to a gradual expansion of the borehole. For example, in 1983, the lower parts of the Dye-3 hole expanded significantly, around 2037.63 m, and during 1993–1995, the GISP2 borehole expanded by 1.0–1.5 mm near the bottom of the hole [10]. This expansion caused a drop in the height of the drilling fluid column, creating the potential for at least partial closure at the higher levels of the borehole. Therefore, it is important to establish a model for calculating ice borehole deformations for safe ice drilling.
Researchers have studied borehole deformations and different failure mechanisms [11,12]. Talalay and Hooke [13] discussed a modified version of Glen’s flow law and recommended several flow parameter values based on changes in borehole diameter. Talalay et al. also provided a means to calculate the exact amount of deformation in a borehole and proposed a drilling fluid control scheme to prevent borehole closure [10]. Although the above works modeled ice borehole deformation, they did not consider the variation in borehole diameter with different stress directions or the critical condition of the borehole wall. The influence of internal factors, such as ice temperature, surface snow density, and ground temperature gradient, and external factors, such as drilling fluid density, on ice borehole deformation has not been explored. Furthermore, the sensitivity of various factors to ice borehole deformation has not been quantitatively evaluated.
Here, we propose a theoretical simulation of deformation in ice boreholes. This model considers ice temperature and density, drilling fluid temperature and density, in situ stress, ice creep, and ice fabric; thus, borehole deformation can be modeled. The model was used to calculate deformation in the Dome A ice borehole at the Chinese Antarctic Kunlun station. Considering the uncertainty of the ice layer impurities and particles in the lower part of the borehole, the basic deformation law in the upper 50% of the borehole wall was obtained. Finally, univariate and multifactor sensitivity analyzes were performed to investigate the factors that affect borehole deformations. This study can help guide the selection of drilling well locations and enable the evaluation of drilling fluid performance, potentially preventing drilling accidents.

2. Modelling

2.1. Basis and Assumption

In this study, the modeling process was mainly divided into three aspects, where the first step involved calculating the in situ ice stress. On a large scale, according to Hooke’s research [14], the ice body was assumed to be fluid and viscoelasticity was considered. The second step was to calculate the stress distribution in the ice borehole. On a small scale, according to previous research on oil wellbores [15,16,17], we assumed that the deformation of the ice hole was small and that the ice had elastic properties to simplify the model. The third step was to calculate the deformation of the ice borehole. From the perspective of time, it was assumed to be a long-term deformation under a constant force, which is more realistic from the perspective of the rheological properties.
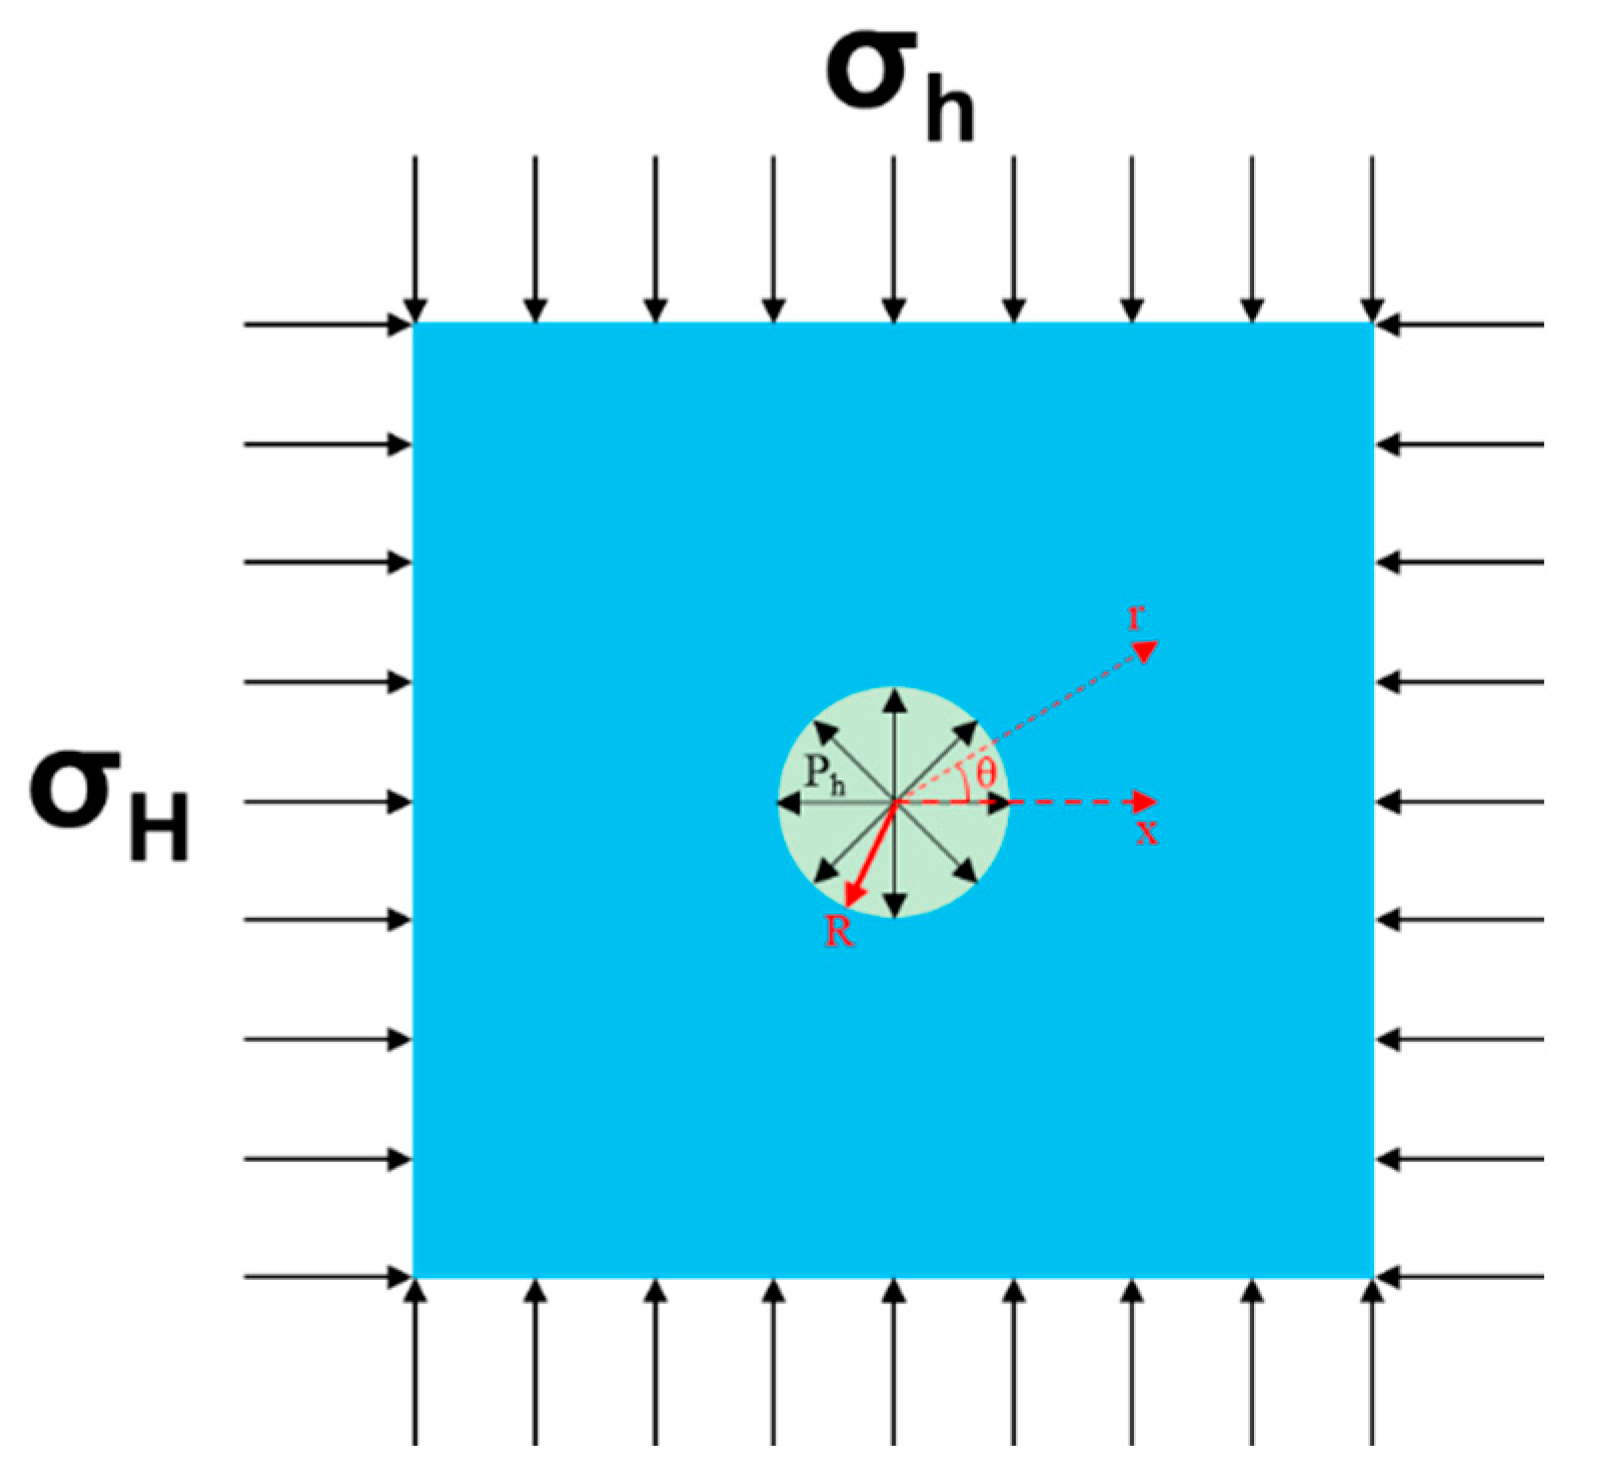
Figure 1 shows the stress distribution around the ice borehole, providing an illustration of these deformation behaviors in the ice. In our calculations, the in situ ice pressure at a certain depth in the glacier consists of vertical stress ( σ z ), maximum horizontal principal stress ( σ H ), and minimum horizontal principal stress ( σ h ). Vertical stress is mainly caused by the overburden pressure of the ice (depending on the depth). Hooke and co-workers [6,14] provided a model to obtain the maximum and minimum horizontal principal stresses. The hydrostatic pressure, Ph, is caused by the drilling fluid.

2.2. Ice Temperature and Density Variation

Determining the temperature distribution in glaciers and ice sheets is vital because it is closely related to the physical and mechanical properties of the ice. It also determines the temperature distribution of the drilling fluids in a borehole, which has a significant indirect impact on the fluid pressure. Hooke and Budd proposed the use of the following equations to estimate the temperature distribution in an ice sheet as a function of depth, provided that certain assumptions are met. These assumptions include the absence of horizontal ice flow, a symmetric temperature field near the boundary, and a small enough strain rate to neglect heat generation due to strain. [14,18].
T ( h ) = T s β 0 b n / 2 κ H [ erf ( H b n / 2 κ H ) erf ( h b n / 2 κ H ) ]
In the equation above, T s is the surface temperature (°C) at a certain glacier thickness H; β 0 is the temperature gradient at the bedrock (K/m) ;   b n is the accumulation rate (m/a) ;   κ is the thermal diffusivity (m2/a); erf(x) is the error function of x, where erf ( x ) = 0 x e t 2 d t ; and h is the distance from the base of the glacier (m).
In glaciers, the transformation from snow to ice becomes non-negligible with increasing depth. For more accurate calculations, an empirical density-depth relation is often used for the upper parts of glaciers [19].
ρ ice ( z ) = ρ i [ ρ i ρ s ] exp ( z z ρ )
Here,   ρ ice ( z ) denotes the density (kg/m3) at depth z, ρ i is the density of pure ice (916.8 kg/m3) at a temperature of 0 °C under atmospheric pressure, and ρ s is the density of surface snow (300–400 kg/m3). The parameter z p is a constant for each site and is related to the thickness of the firn [20].
As a result of the increasing pressure and the compression of air bubbles, the density of ice changes slightly with depth. Talalay calculated the change in density after a certain depth as a function of pressure and temperature [10]:
ρ ice T , p = 916.8 ( 1 1.53 × 10 4 T ) 1 11.94 × 10 11 ( 1 + 1.653 × 10 3 T + 3.12 × 10 6 T 2 ) ( P P 0 )
where T is the temperature (°C), P is the pressure (Pa), and P0 is the atmospheric pressure (1.013 × 10⁵ Pa).
Combining Equations (1)–(3), we can obtain the variation in ice density with depth.

2.3. In Situ Ice Pressure

As previously mentioned, the in situ ice pressure consists of vertical stress ( σ z ), maximum horizontal principal stress ( σ H ) and minimum horizontal principal stress ( σ h ). Vertical stress is usually caused by overburden pressure and can be calculated by integrating over the range of depths from 0 to H [21]:
σ z = g 0 H ρ ice ( z ) dz
where ρ ice ( z ) is the density profile of the ice over depth z.
The maximum and minimum horizontal principal stresses are relatively difficult to calculate but can be derived from Hooke’s calculation [14]. He calculated the stress tensor σ ij at a certain point in the glacier by assuming that the ice flow direction is along the x-axis, the thickness of the glacier is H, and ε yy = 0 ( ε yy ) is the normal strain in the y direction).
Based on the viscoplasticity of ice, he provided an expression for each stress component (for a uniform ice slab) as follows:
{ σ xx = ρ g z z + 2 σ 2 ( ρ g x z ) 2 σ yy = ρ g z z + σ 2 ( ρ g x z ) 2 σ zz = ρ g z z σ xy = 0 σ zy = 0 σ zx = ρ g x z
where  σ is the effective stress in plane strain and g x   and   g z are the components of gravitational acceleration along the x- and z-axes, respectively, which depend on the slope of the glacier.
The value of σ can be obtained by applying Glen’s flow law to glacier ice, as suggested based on uniaxial compression experiments [5] and Hooke’s formula [14]:
ε ˙ = ( σ B ) n
z = σ 2 n r e 2 B 2 n ρ g x σ n 1
where  ε ˙ is the strain rate at different depths, B is a measure of the viscosity (MPa·a1/n) of the ice, r e is the longitudinal strain rate (a−1), and n is an empirically derived value unique to the particular law (most studies have found that n ≈ 3).
Through the six components of the stress tensor σ ij (Equation (5)), we can obtain three principal stresses by solving the stress state equation:
( σ ij δ ij σ n ) l j = 0
where δ ij is the Kronecker delta, σ n is the principal stress, and l j is the cosine of the angle between the main-plane normal line and coordinate axis.
During deep ice-core drilling, scientists always choose the central dome area as a drilling site to minimize the impact of glacier flow on the ice core. Generally, in these areas of the ice sheets, the slope and deviatoric stress are very small and can even be ignored. Under these conditions, the maximum horizontal principal stress ( σ H ) and minimum horizontal principal stress ( σ h ) can be calculated using Equations (5) and (8), respectively:
σ H = | σ yy | = σ z σ 2 ( ρ g x z ) 2
σ h = | σ xx | = σ z 2 σ 2 ( ρ g x z ) 2
Ultimately, the in situ ice pressure at any point in the central dome area of the glacier or ice sheet can be expressed by Equations (4), (9), and (10).

2.4. Hydrostatic Pressure and Density Variation

The hydrostatic pressure in a borehole is caused by drilling fluids and is used to counteract ice pressure. The density of the drilling fluid in the borehole is not constant and changes with temperature and pressure. An efficient method for calculating the density curves ρ fl P , T ( z ) in a borehole is as follows [10]:
ρ fl P , T ( z ) = a t T + ρ 0 1 α P fl ( z )
where ρ 0 is the density (kg/m3) of the fluid at 0 °C, a t is the thermal coefficient (kg/(m3°C), α is the fluid compressibility, ρ fl P , T ( z ) is the final density (kg/m3) after considering the effects of temperature and pressure, and  P fl ( z ) is the hydrostatic pressure (Pa) at a certain depth. By assuming that the temperature change in the drilling fluid is consistent with the temperature change in the ice, we can obtain a temperature profile for the drilling fluid.
The hydrostatic pressure of the fluid at depth z can be calculated using numerical integration with the rectangular method, choosing the appropriate compressibility for the fluid α :
P fl ( z ) = { 0 0 < z < H 0 g H 0 H ρ fl P , T ( z ) dz H 0 < z < H  
or
P fl ( z ) = { 0 0 < z < H 0 g ρ fl P , T ( z i 1 ) ρ fl P , T ( z i ) 2 H i H 0 < z < H    
where g is gravitational acceleration, H0 is the fluid level below the surface, and H i is the depth interval, m.
The change in compressibility of n-butyl acetate versus temperature is given by [10]:
α nba = ( 4.72 T + 1091.7 ) 1 × 10 6
In addition, by combining Equations (1), (11), and (13), we can obtain the variation in drilling fluid density with depth.

2.5. Stress Distribution

The horizontal cross-section in Figure 2 is shown to aid in visualizing the stress distribution. We focused on the borehole wall (r = R), where stress at certain depths can be translated into circumferential stress ( σ θ θ ), radial stress ( σ rr ), and axial stress ( σ zz ) [22,23]:
σ θ θ = ( σ H + σ h ) 2 cos 2 θ ( σ H σ h ) P h
σ rr = P h
σ zz = σ z
In the equations above, R is the radius of the ice hole, r is the radius of the polar coordinates, θ is the polar angle, P h is the hydrostatic pressure caused by the drilling fluid, and  σ z is vertical stress.
When θ = 0° and 180°, that is, in the σ H direction, the value of σ θ θ is at a minimum, σ θ θ = 3 σ h σ H P h ; When θ = 90° and 270°, that is, in the σ h direction, the value of σ θ θ is at a maximum, σ θ θ = 3 σ H σ h P h .

2.6. Unbalanced Differential Pressure

In ice drilling engineering, drilling fluid is first used to achieve a balance of forces. However, some factors remain uncontrollable, and the unavoidable fluctuating pressure differences in the borehole wall can potentially lead to deformation. Any ice borehole deforms under unbalanced differential pressure because of the viscoelastic property of ice.
When the in situ ice pressure exceeds the drilling fluid column pressure (i.e., a negative pressure difference), the borehole shrinks; in the opposite scenario, which causes a positive pressure difference, the borehole expands. When calculating the stress on a borehole wall using polar coordinates, σ rr , σ θ θ , and σ zz are considered the three principal stresses. In this calculation, we focused on the stress and strain in the plane of the horizontal cross-section, and we established a deviatoric stress σ rr to express the value of the unbalanced pressure difference:
σ rr = σ rr σ θ θ
Typically, we ignore vertical deformation and focus instead on the creep deformation of the borehole wall and in-plane strain. Hooke provided the following equation to calculate the effective shear stress for in-plane strain [14]:
τ 2 = 1 2 × [ ( σ rr σ θ θ ) 2 ]
By combining Equations (15), (16), (18), and (19), we calculated the effective distribution of shear stress over the length of the hole in the σ H and σ h directions.
τ = { 1 2 ( 2 P h 3 σ h + σ H )     i n   t h e   σ H   d i r e c t i o n s 1 2 ( 2 P h σ h σ H )           i n   t h e   σ H   d i r e c t i o n s
The effective shear stress causes ice deformation, and a positive or negative value of τ means that the borehole expands or closes as time elapses. This deformation can be calculated accurately using the creep law of ice. The most frequently used relation between the ice deformation rate and applied stress is Glen’s flow law (Equation (6)), although equivalent and more specific formulations have also been proposed [13], such as:
ε ˙ = EA 0 τ n e Q RT
where A 0 is an ice stiffness parameter, independent of temperature (laboratory experiments give the value A 0 = 9.514 × 10¹² MPa−3a−1 for the secondary creep of ice [14]);   Q is the activation energy for creep; R is the universal gas constant; and T is the absolute temperature. The enhancement coefficient E has a wide range of values due to variations in the ice crystal structure, impurity content, and other factors.
According to Equation (21), Talalay developed an equation to calculate the change in radius of the borehole with time [10]:
r = r 0 exp [ EA 0 τ n e Q RT Δ t ]
where  r and r 0 are the current and initial radii of the borehole, respectively, and Δ t is the duration.

3. Borehole Deformation in Dome A

In this section, we use the actual parameters of Dome A to calculate and obtain a general law for borehole deformation. The Chinese Antarctic Kunlun station was established near the highest point on the East Antarctic Ice Sheet. Figure 3 shows a deep ice drilling project, DK-1, in the Dome A region. The project began in January 2012 and was expected to be completed in 2018. The elevation of Dome A is nearly 4100 m, the ice sheet thickness is approximately 3100 m, and the average annual temperature is −58 °C. An 800 m hole with an initial diameter of 135 mm was drilled during the recent working season of 2016–2017. The fluid level in the borehole was maintained at approximately 100 m below the surface using n-butyl acetate as a drilling fluid and a fiberglass casing [24].

3.1. Parameter Values

Several geological conditions were determined using multi-polarization-plane radio-echo sounding (RES) [25]. The thickness of the ice was estimated through a radar survey to be 3139 m. This suggests that at depths greater than 800 m, air bubbles change into clathrate hydrate crystals with increasing pressure, and the ice density tends to stabilize. Four depth regions were identified based on the reflection power changes: 0–800, 800–1400, 1400–2000, and below 2000 m.
To calculate the theoretical deformation, we assumed that the depth of the glacier was H = 3100 m and the slope of the glacier was 0.01. Table 1 lists the other parameter values according to the actual geological and drilling conditions at Dome A.
It is important to explain the reasoning behind the chosen value of E, as this parameter is very important for the calculation of deformations but varies widely in different situations. Currently, it is still difficult to determine the empirical relationship between E and the factors on which it depends, such as strain rate, temperature, and cumulative strain [29], and the appropriate choice of E value is largely subjective [14]. At present, laboratory experiments provide some basis for estimating E. Studies on natural ice have revealed that the deformation speed of ice in the fixed c-axis direction is four times faster than that in the random c-axis direction [30,31,32]. In addition, drilling experiments in the Barnes Ice Cap suggest that ice with two maximum fabrics deforms approximately 10% faster, whereas ice with three or four maximum fabrics deforms approximately 40% slower than ice with a single maximum fabric [29]. With respect to particles and impurities, the effect of particles on creep behavior is dependent on both concentration and size [33,34,35,36]. Owing to these uncertainties, we did not calculate the variation in borehole diameter below 2000 m.
Multi-polarization radar measurements have been proven to be feasible to reveal the ice fabric [37,38]. In this study, we combined the geologic information for the Dome A region obtained via multi-polarization-plane RES [25] and the formation mechanism of ice crystals, assuming four different crystal orientation fabric (COF) features in each depth region. At 0–800 m, the fabric exhibited a random c-axis orientation, becoming an elongated single-maximum fabric. We assumed that the value increased evenly with depth to four times the starting value owing to the change in COF from random c-axis orientations to a single-maximum fabric. At 800–1400 m, the fabric changed from an elongated single-maximum fabric to a multiple-maximum fabric. The value decreased uniformly by a factor of 0.6, which we assume was due to the COF changes associated with changing from a single-maximum fabric to a multiple-maximum fabric. At 1400–2000 m, the fabric changed to a multiple-maximum fabric owing to ice folding, mixing, faulting, a higher temperature, and other factors. We chose three or four maximum fabrics for the entire interval such that the strength of the ice at this depth was consistent, which means that E was equal to the value at 1400 m and was kept constant. Table 2 shows our choice of enhancement coefficient (E) for the deformation calculation above 2000 m.

3.2. Deformation at the Dome A Ice Borehole

3.2.1. Temperature and Density Distribution at Dome A

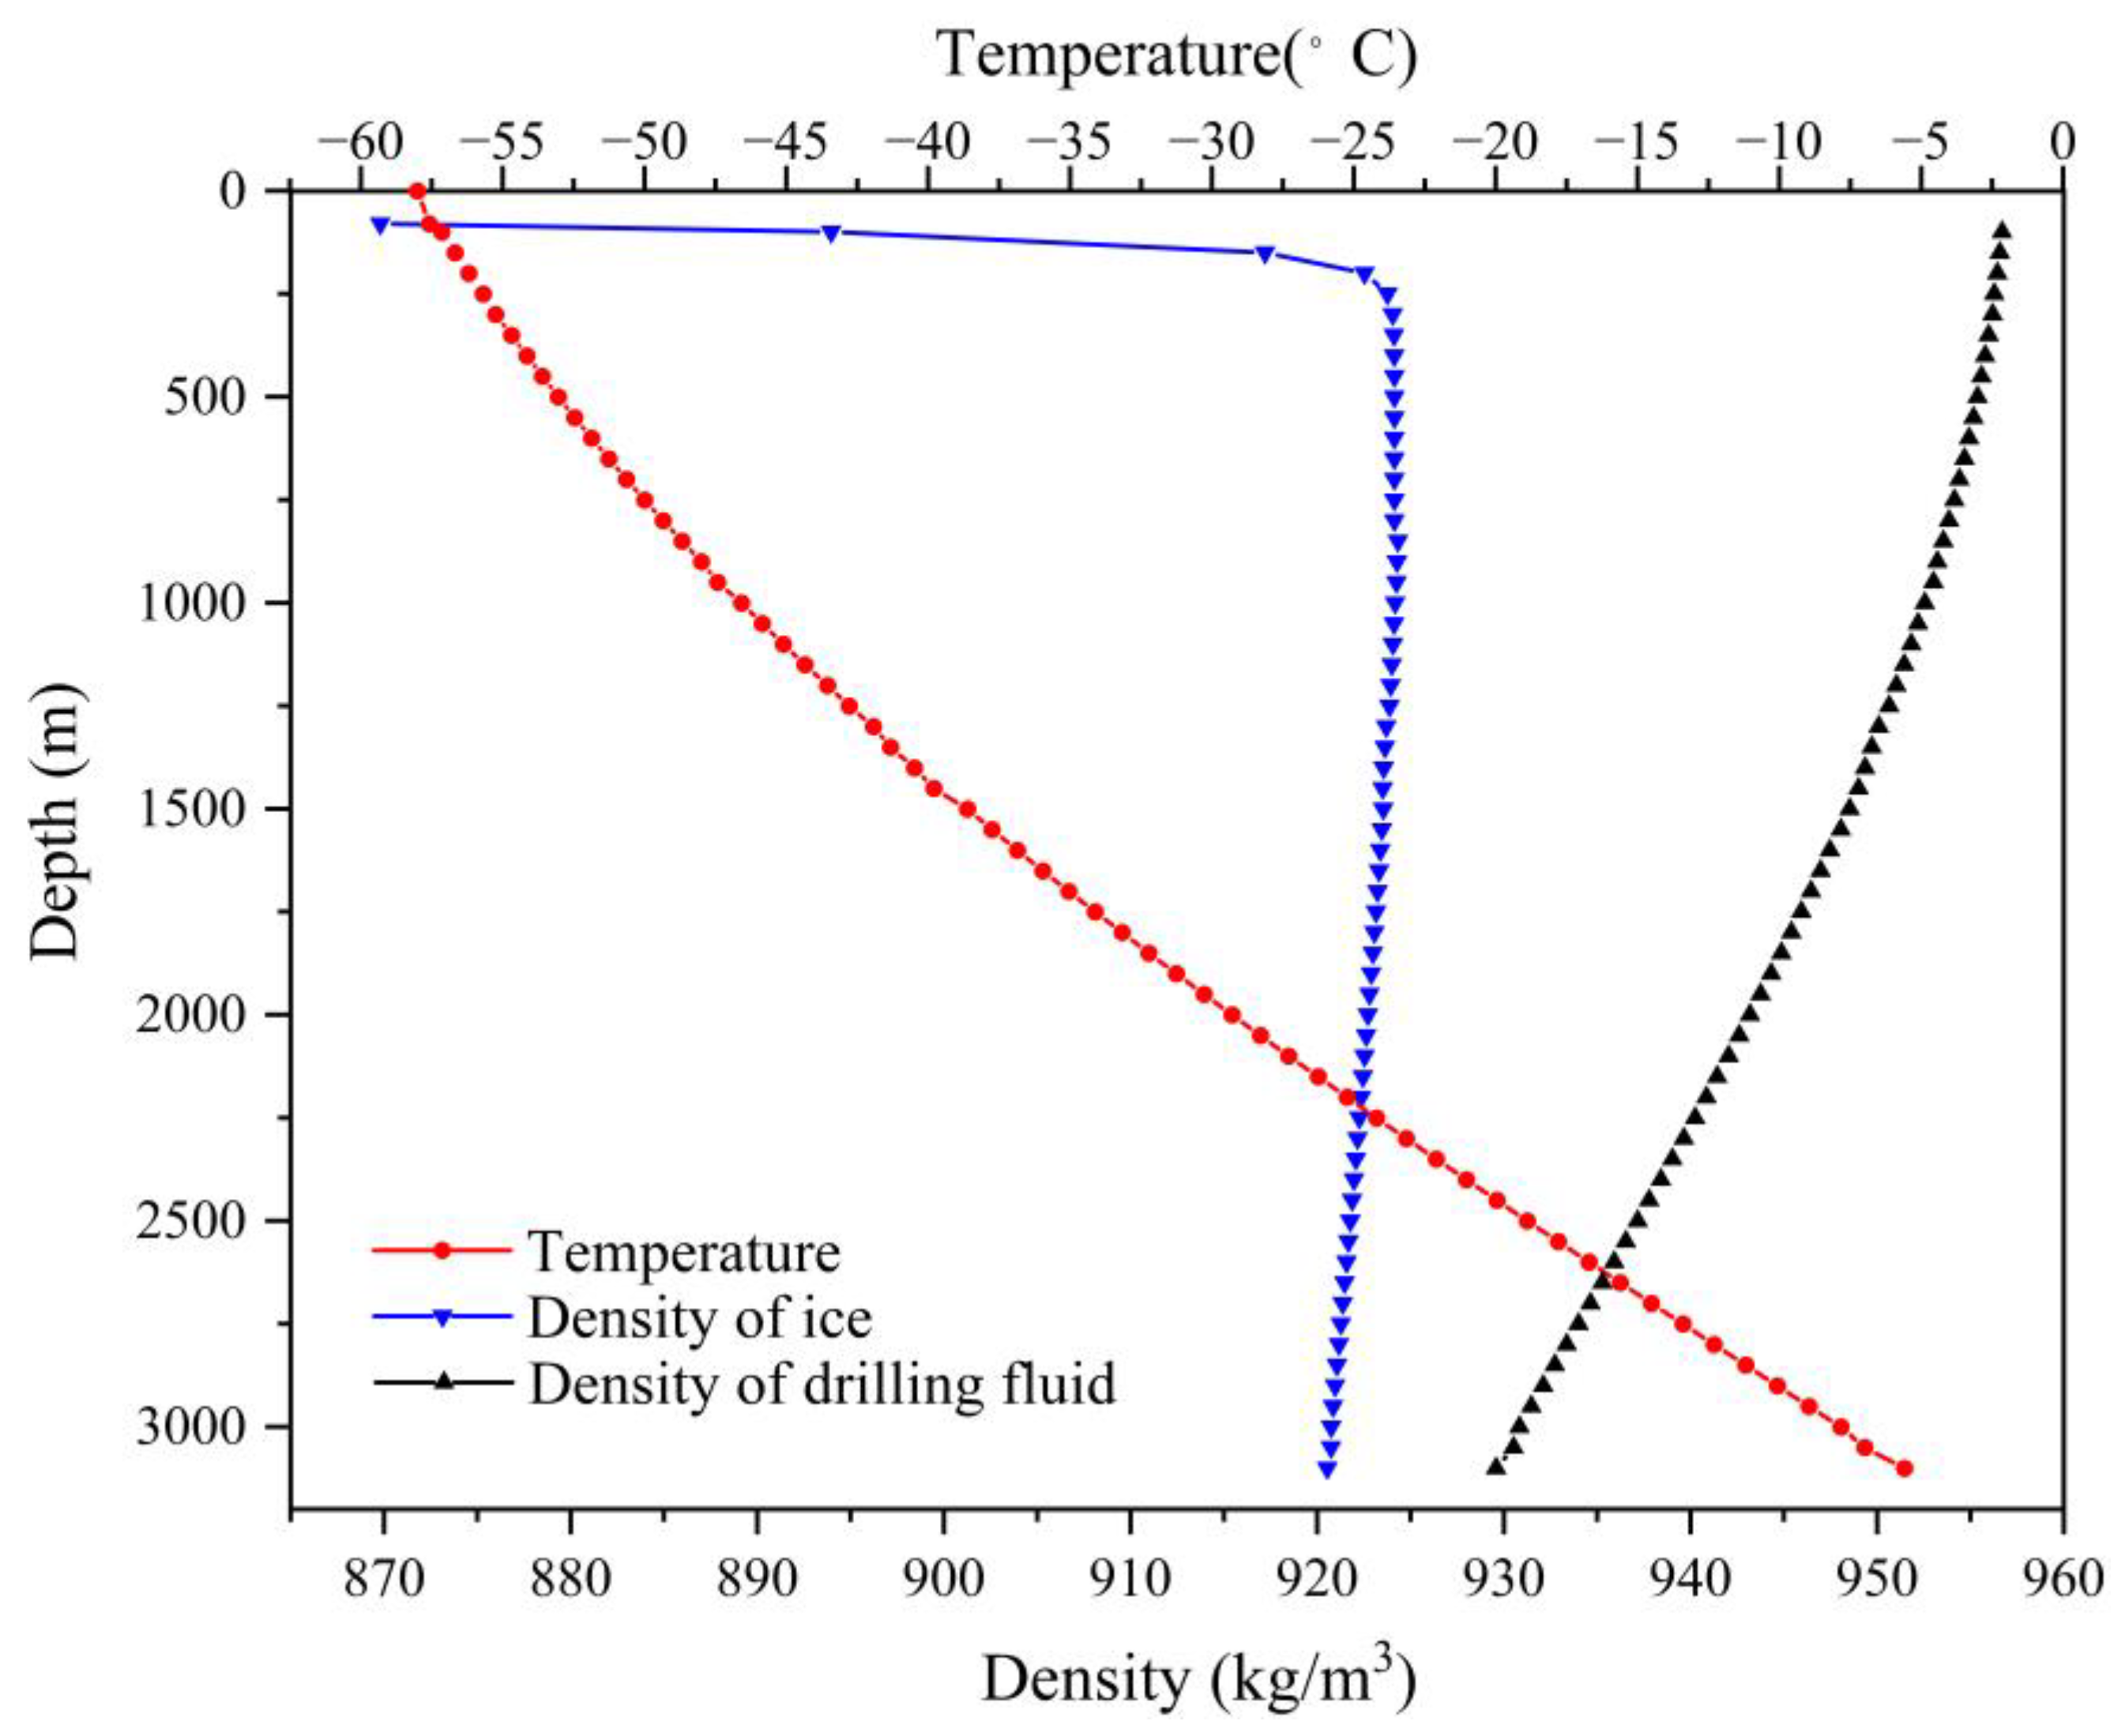
At present, there is no measured temperature profile for the DK-1 borehole in the Dome A area. In addition, the final depth of the borehole is 803.7 m, which does not involve a deeper area. Therefore, we did not use the measured temperature profiles. However, in Dome A, the ice flow is slow, and the slope is small [39,40,41]. This condition is consistent with the basic assumption of theoretical temperature calculation. Figure 4 shows the calculated ice temperature distribution and variation in density with depth at Dome A. We can see that the ice temperature gradually increased with increasing depth, and the temperature was close to −2 °C at the basal area. The density of the ice increased rapidly at surficial depths (200 m), which includes snow and the firn layer, and then remained mostly constant at 922 kg/m3. A small increase in density could be the result of the disappearance of air bubbles, and conversely, the rising temperature could be responsible for a small decrease. The density of the drilling fluid gradually decreased from 955 to 930 kg/m3, owing to the interaction between temperature and pressure changes.

3.2.2. Change in Borehole Diameter at the Dome A Ice Borehole

Before calculating the deformation in the borehole, it was necessary to determine the effective distribution of shear stress on the borehole wall. From Equation (15), it is evident that the circumferential stress varies in different directions, reaching a maximum value in the σ h direction and a minimum value in the σ H direction.
Figure 5 shows the variation in stress given by Equation (20) in the borehole wall with depth in the σ h and σ H directions. From the diagram, it can be seen that, in the σ H direction, borehole shrinking occurred above 1600 m (point A in Figure 5a), while a gradual expansion occurred at depths below 1600 m. Nevertheless, the critical depth was 1000 m (point B in Figure 5b) in the σ h direction.
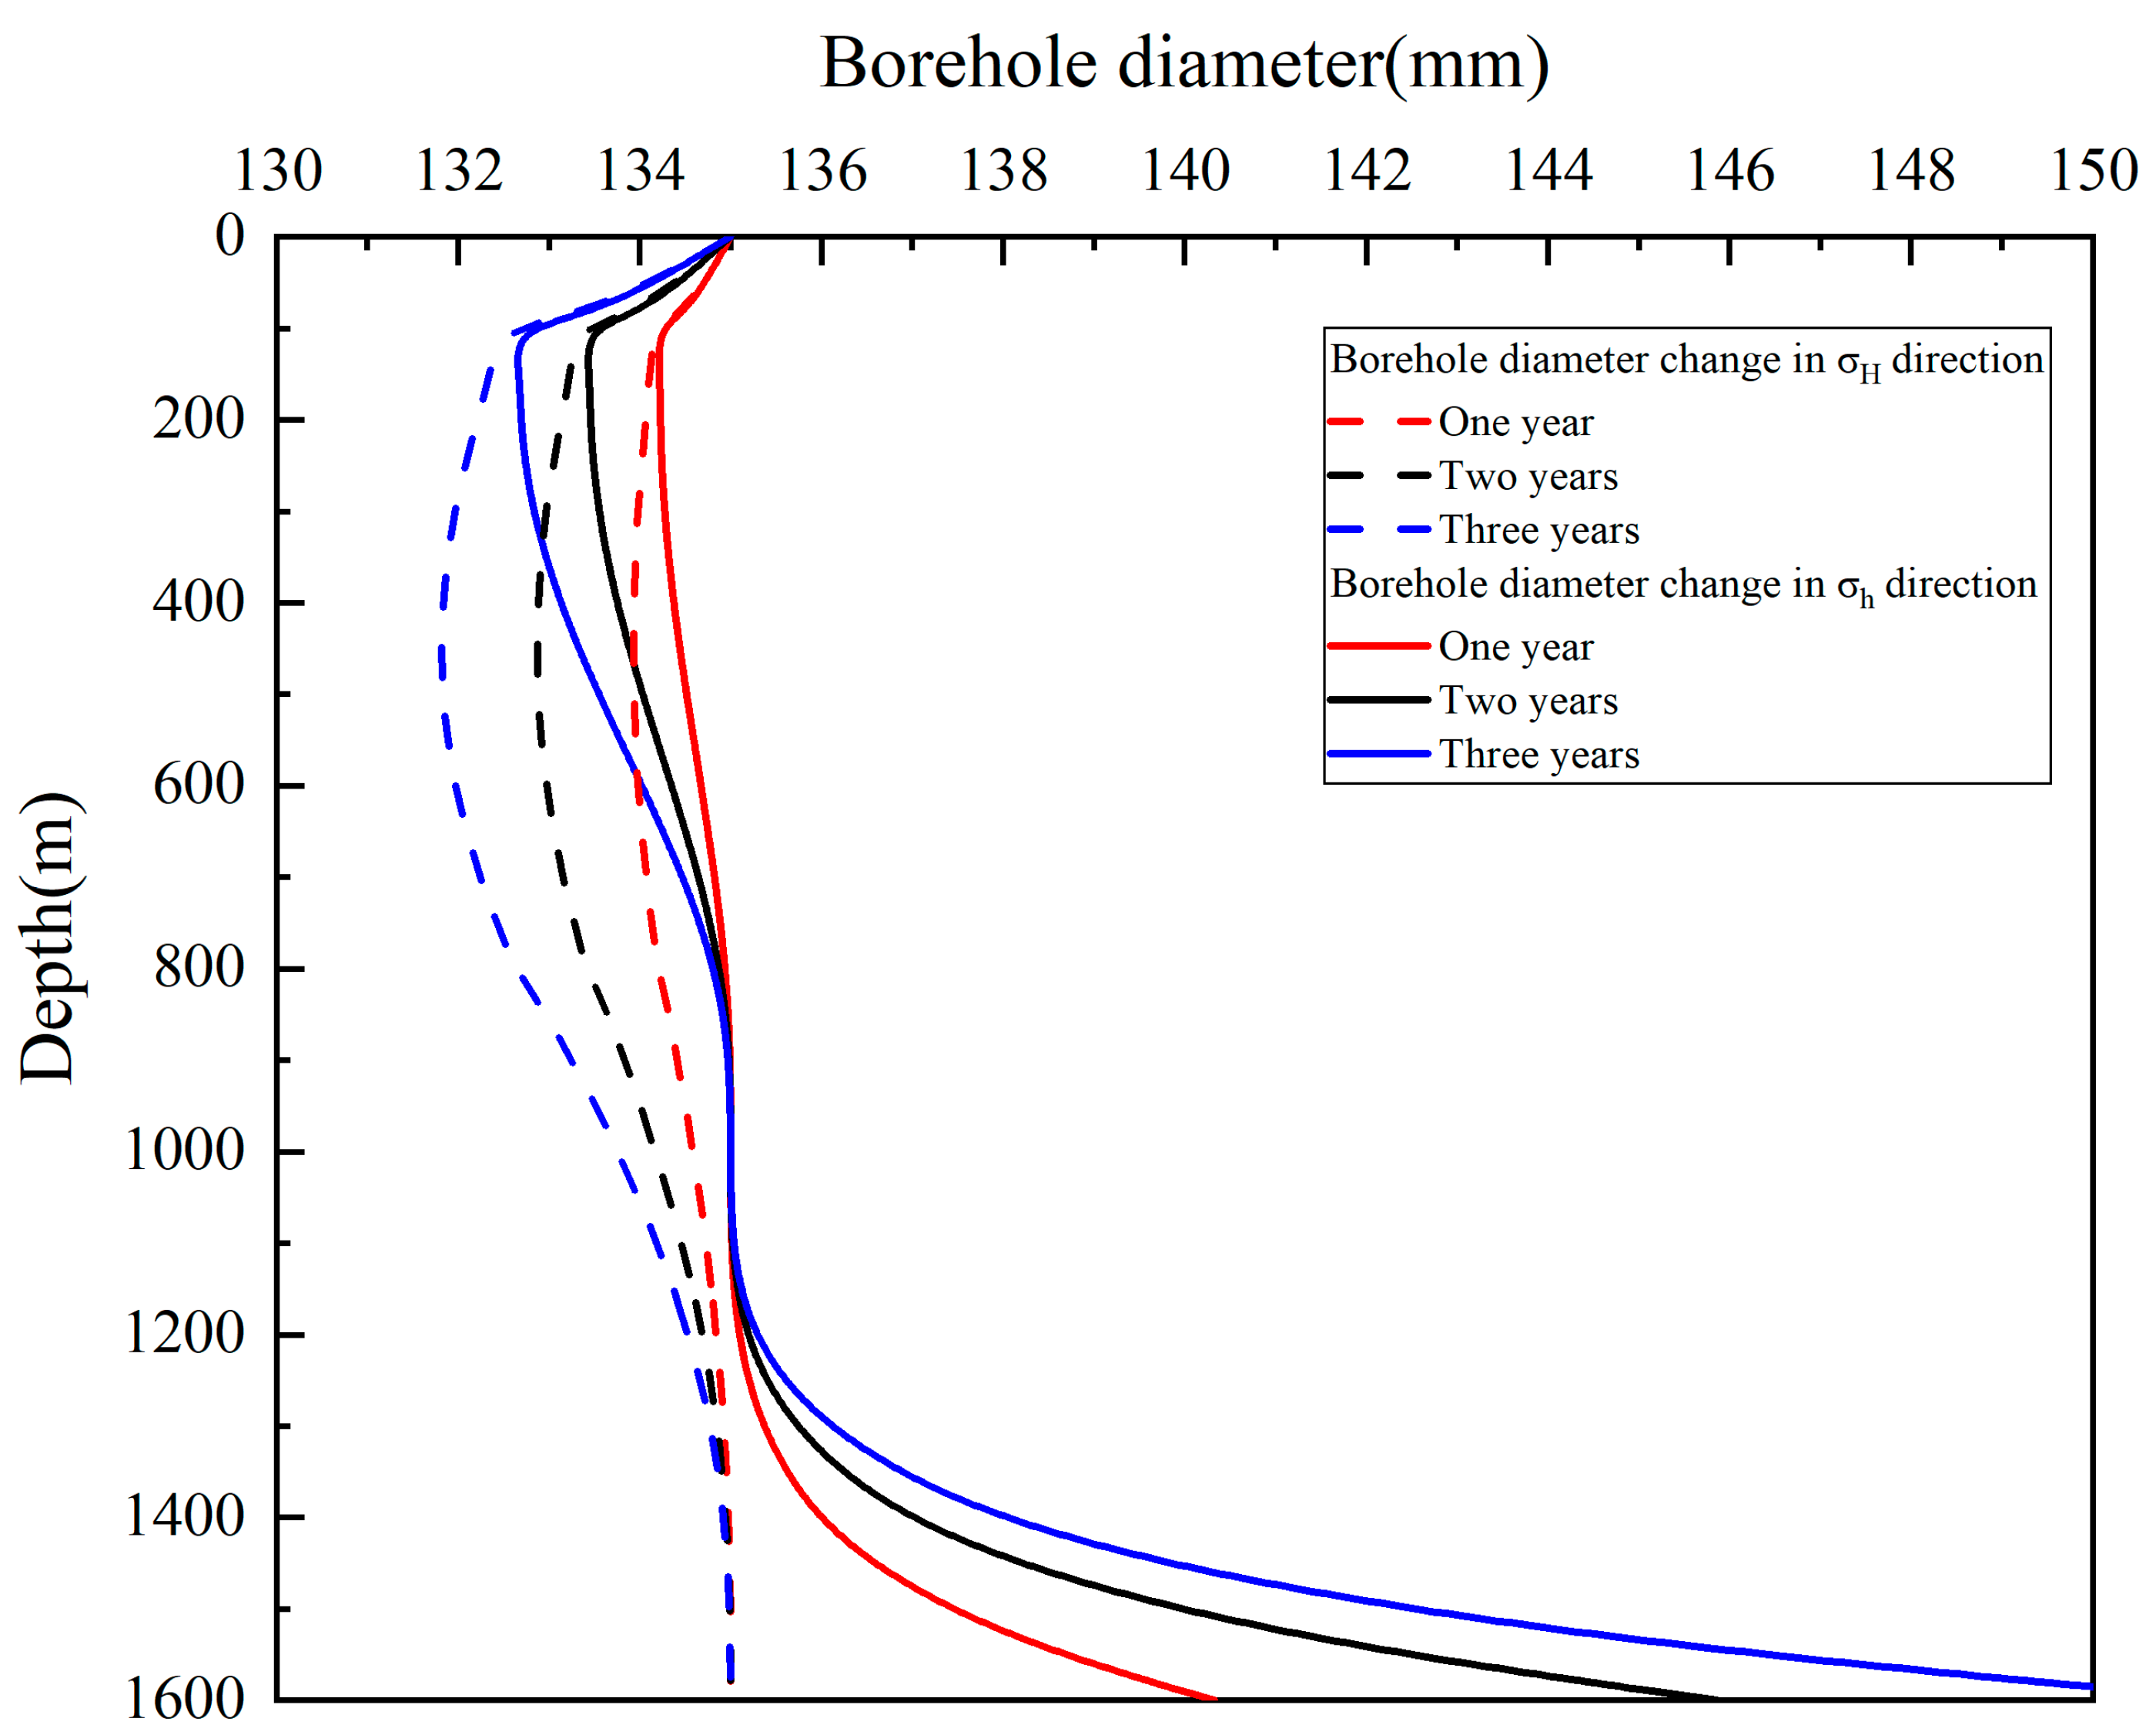
Figure 6 shows borehole deformation with time. In the σ h direction, as the depth increased to 100 m, the shrinking deformation gradually diminished, and deformation was largely absent at 800–1200 m (ignoring the first 100 m stage without drilling fluid). When the depth exceeded 1000 m, a large expansion deformation was observed over time. However, after 100 m, the situation was significantly different in the σ H direction, where borehole shrinking gradually increased until a depth of approximately 400 m, then decreased slowly with increasing depth. After 1200 m, the borehole generally did not show deformation.
From the above discussion, we can identify three stages of borehole deformation: borehole shrinking in any direction at 0–1000 m, shrinking in the σ H direction, expansion in the σ h direction at 1000–1600 m, and expansion in any direction after depths exceeding 1600 m.

4. Analysis of Factors Influencing Ice Borehole Deformation

To explore the effect of various variables on ice borehole deformation, we assumed that the borehole depth was 1600 m (without drilling fluid in the first 100 m), the initial borehole diameter was 135 mm, and the period of the borehole deformation was one year. We selected temperature gradient β 0 , surface temperature T s , and surface snow density ρ s as internal factors, and drilling fluid density ρ 0 as an external factor affecting ice borehole wall deformation. The rate of borehole diameter change was defined as Δ k = | Δ R Δ H | , where Δ R is the change in diameter and Δ H is the change in depth. The single-variable sensitivity analysis method was used to analyze the influence of various factors on ice borehole wall deformation. When analyzing one variable, we controlled for the other three variables as the average of the range in Table 3.
Surface temperature was chosen as an influence factor in ice borehole deformation because the annual average temperature of an ice sheet’s surface varies significantly from the edge to the interior of the ice sheet, and the most intuitive external factor for drilling work in different places is surface temperature. However, surface temperature also varies with daily and seasonal cycles. The mean annual air temperature at the snow surface is commonly estimated by assuming that it is the same as the snow temperature measured at a depth of 10 m [42,43]. Therefore, we used the snow temperature measured at a depth of 10 m to replace the surface temperature value.

4.1. Effect of Surface Temperature

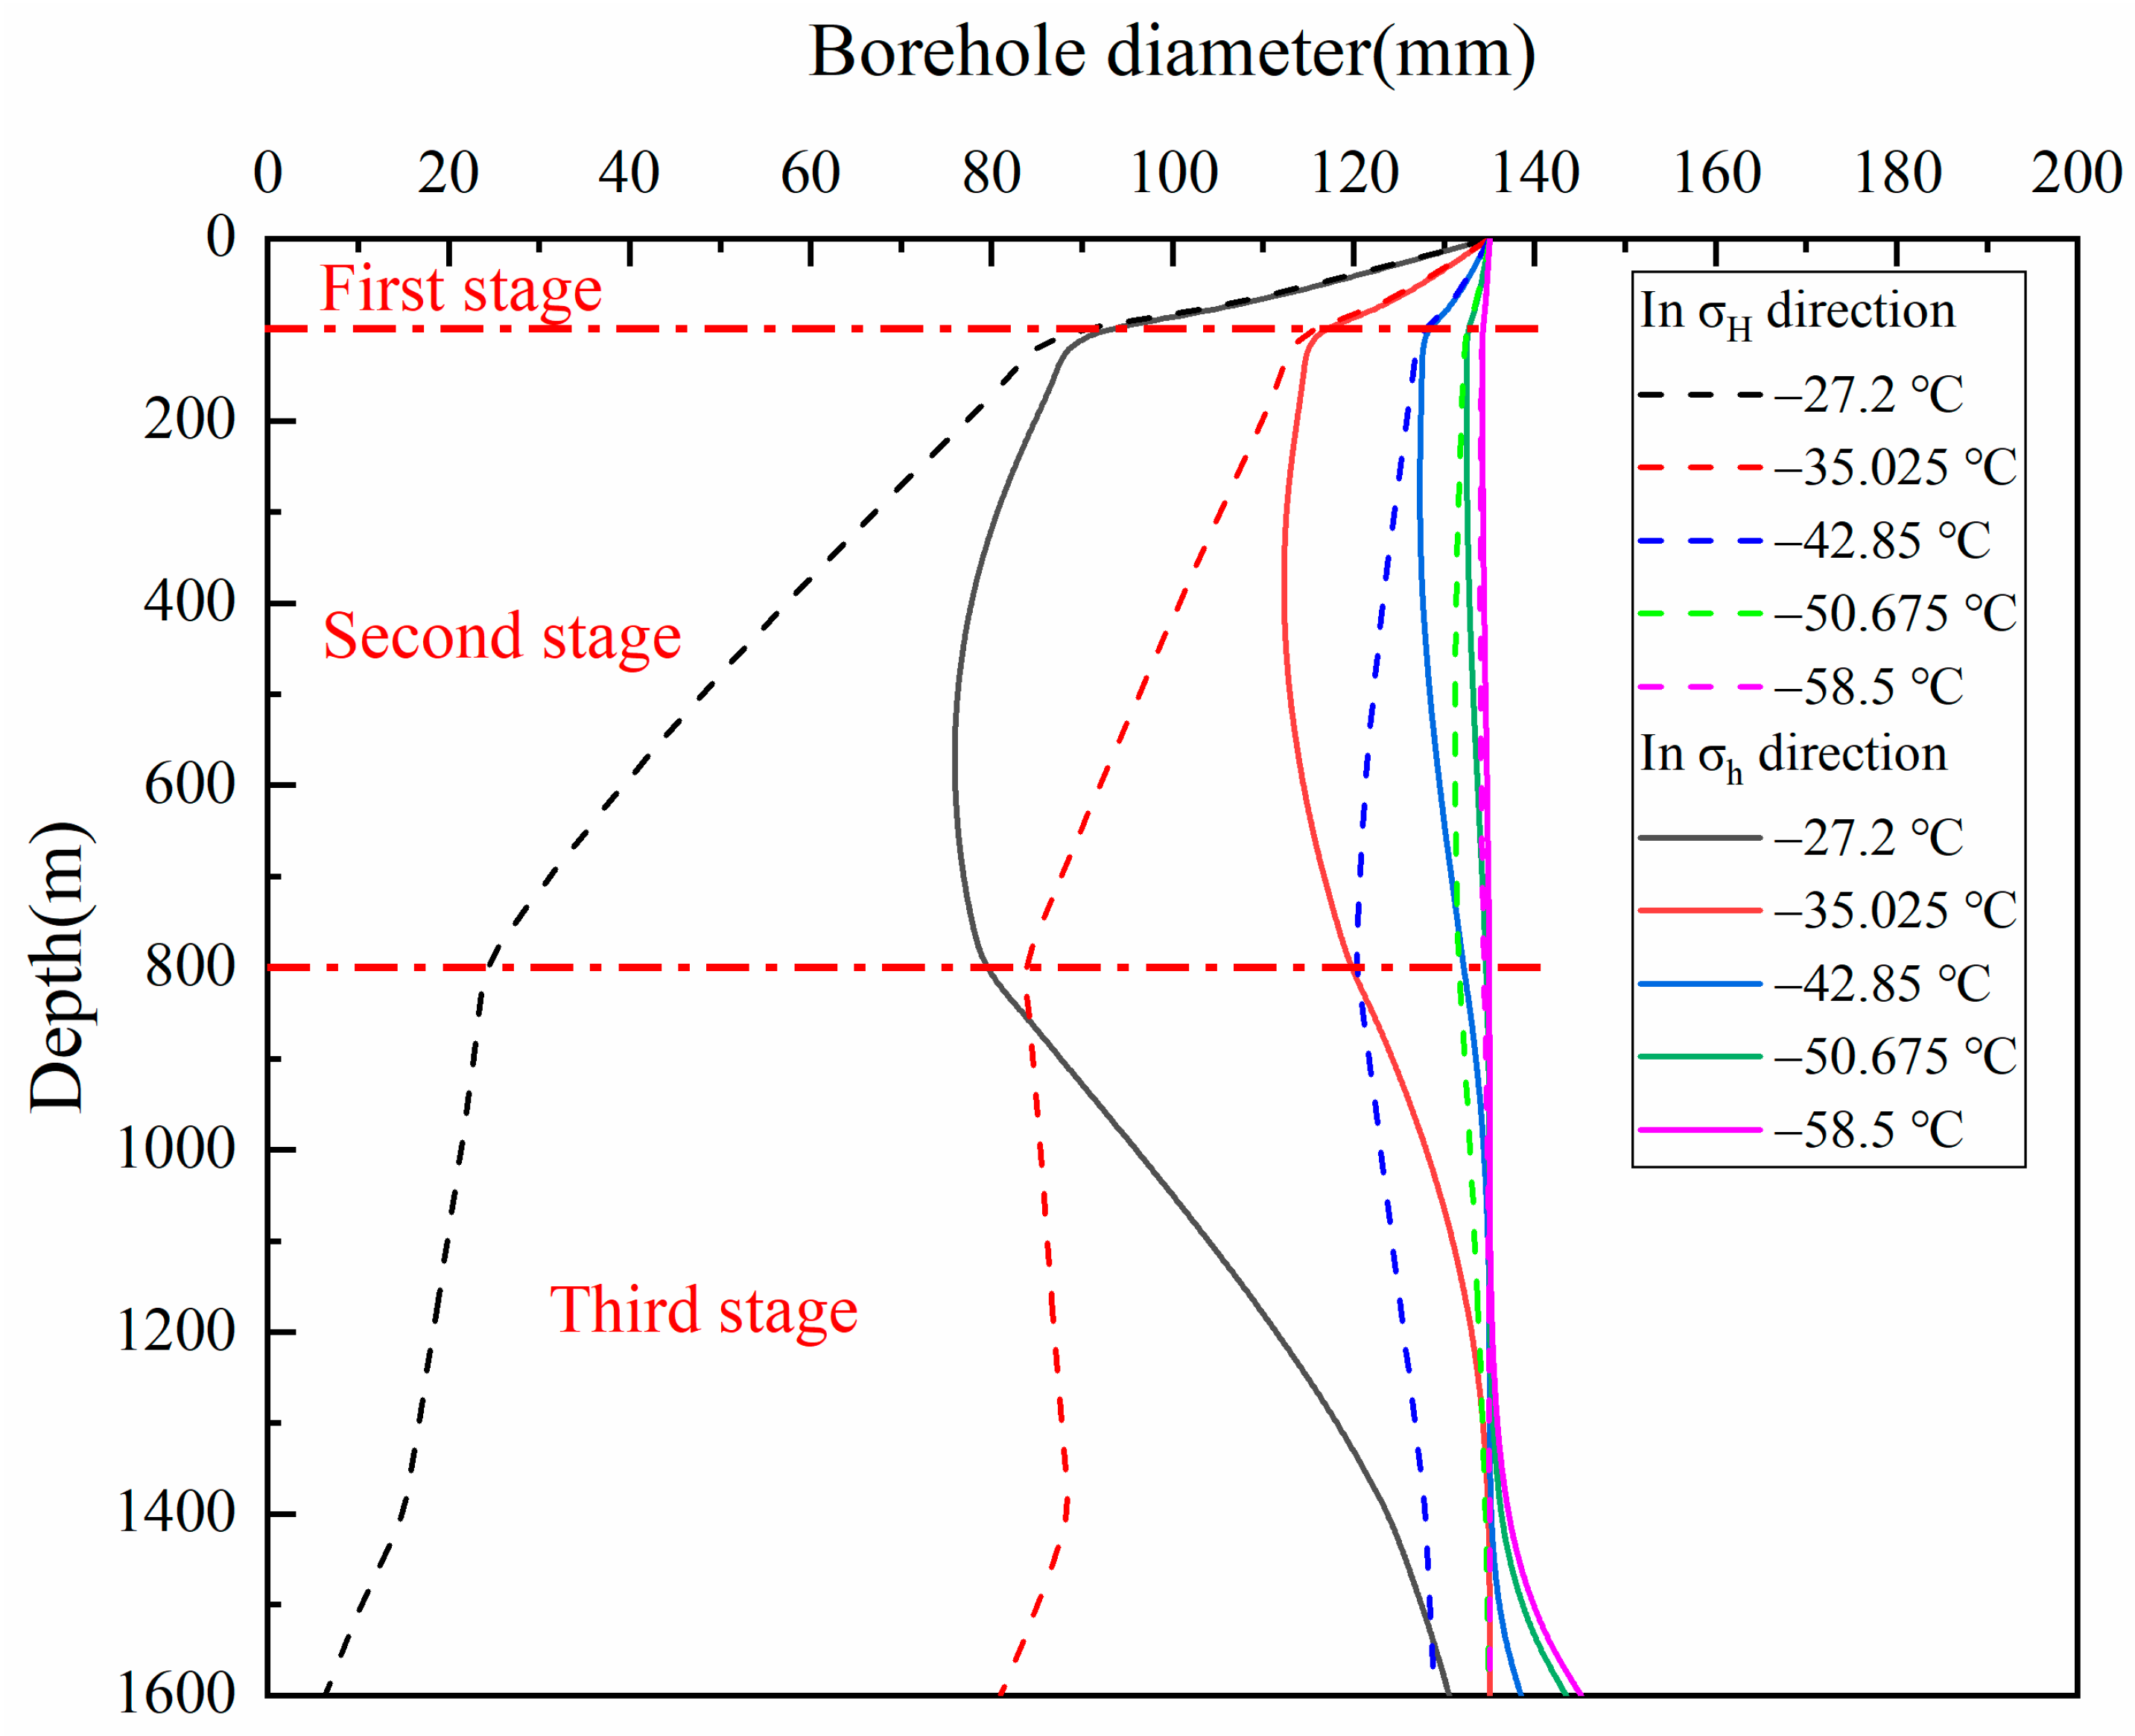
To analyze the effect of surface temperature on ice borehole deformation, we set the other parameters to be the average value of the range given in Table 3, that is, β 0 = 0.0245 Km−1, ρ s = 350 kg/m3, and ρ 0 = 905 kg/m3. Figure 7 shows the deformation of the borehole diameter in the σ h and σ H directions at different surface temperatures. The evolution of the borehole diameter can be divided into three depth stages in both the σ h and σ H directions. In the first stage, Δ k increased rapidly between the depths of 0 m and 100 m. This was caused by the absence of drilling fluid when the depth was less than 100 m, which caused the borehole to shrink continuously. In the second stage, Δ k increased slightly between the depths of 100 m and 800 m. This was a result of the action of the drilling fluid pressure, which causes Δ k to decline with increasing depth. In the third stage, at a depth greater than 800 m, Δ k gradually became stable in the σ H direction. This is because when the depth exceeds 800 m, the value of the enhancement factor E in Equation (22) decreases with increasing depth; thus, the rate of borehole diameter change declines with depth. However, Δ k began to increase negatively after 800 m in the σ h direction. This is because the drilling fluid pressure increases faster than the minimum principal stress. Therefore, the pressure difference decreases with increasing depth.
In the σ h direction, as the surface temperature was higher than −42.85 °C, the borehole deformation forms were always shrinking. However, when the surface temperature was lower than −42.85 °C, the diameter of the borehole at 1400 m under the effect of different surface temperatures was 124, 135, 135, 136, and 137 mm, respectively. When the temperature was lower than −42.85 °C, the borehole began to expand above 1400 m. This can be explained by Equations (1), (3), and (10), which state that the surface temperature will affect the minimum principal stress of the ice sheet. The lower the surface temperature, the smaller the corresponding σ h . Therefore, when the surface temperature is lower, the borehole begins to expand at a certain depth because the σ h is less than the pressure of the drilling fluid. In the σ H direction, as the surface temperature was higher than −42.85 °C, the borehole deformation forms were always shrinking. However, when the surface temperature was lower than −42.85 °C, the borehole did not deform.
The evolution of the borehole change in diameter is shown in Figure 7. In the σ h direction at a depth of 800 m, the borehole diameters under the effect of different surface temperatures were 79, 120, 132, 135, and 135 mm. Compared with the initial borehole diameter of 135 mm, the corresponding rates of diameter change were 41%, 11%, 2%, 0%, and 0%, respectively. In the σ H direction at a depth of 800 m, the borehole diameters under the effect of different surface temperatures were 24, 83, 120, 132, and 134 mm. Compared to the initial borehole diameter of 135 mm, the corresponding rates of diameter change were 82%, 39%, 11%, 2%, and 0.7%, respectively. This proves that as the surface temperature increases, the borehole diameter gradually decreases; the higher the temperature, the greater the sensitivity of the borehole diameter.

4.2. Effect of Temperature Gradients

The temperature gradient is different throughout the polar region; therefore, the temperature gradient was set as a variable to study its effect on changes in borehole diameter. To analyze the effect of temperature gradients on ice borehole deformation, we held other parameters at the average value of the range in Table 3, that is, T s = −42.85 °C, ρ s = 350 kg/m3, and ρ 0 = 905 kg/m3. Figure 8 shows the deformation of the borehole diameter in the σ h and σ H directions with different temperature gradients. The evolution of the borehole diameter also occurred in three depth stages. However, the law describing borehole diameter change was different from that for the effect of the surface temperature in the third stage, as Δ k began to show negative growth. This was caused by the drilling fluid pressure increasing faster than the maximum horizontal principal stress after a depth of 800 m.
The evolution of borehole diameter change is shown in Figure 8. In the σ h direction, when the depth was less than 1250 m, the borehole shrank; when it was greater than 1250 m, the borehole began to expand. The borehole always shrank in the σ H direction. In the σ h direction, the value of the temperature gradient did not affect the change in borehole diameter. In the σ H direction at a depth of 1600 m, the borehole diameters under the effect of different temperature gradients were 130, 130, 130, 128, and 128 mm. Compared with the initial borehole diameter of 135 mm, the corresponding rates of diameter change were 3.7%, 3.7%, 3.7%, 5.2%, and 5.2%, respectively. This proves that, at the same depth, the surface temperature has a linear relationship with borehole diameter.

4.3. Effect of Surface Snow Density

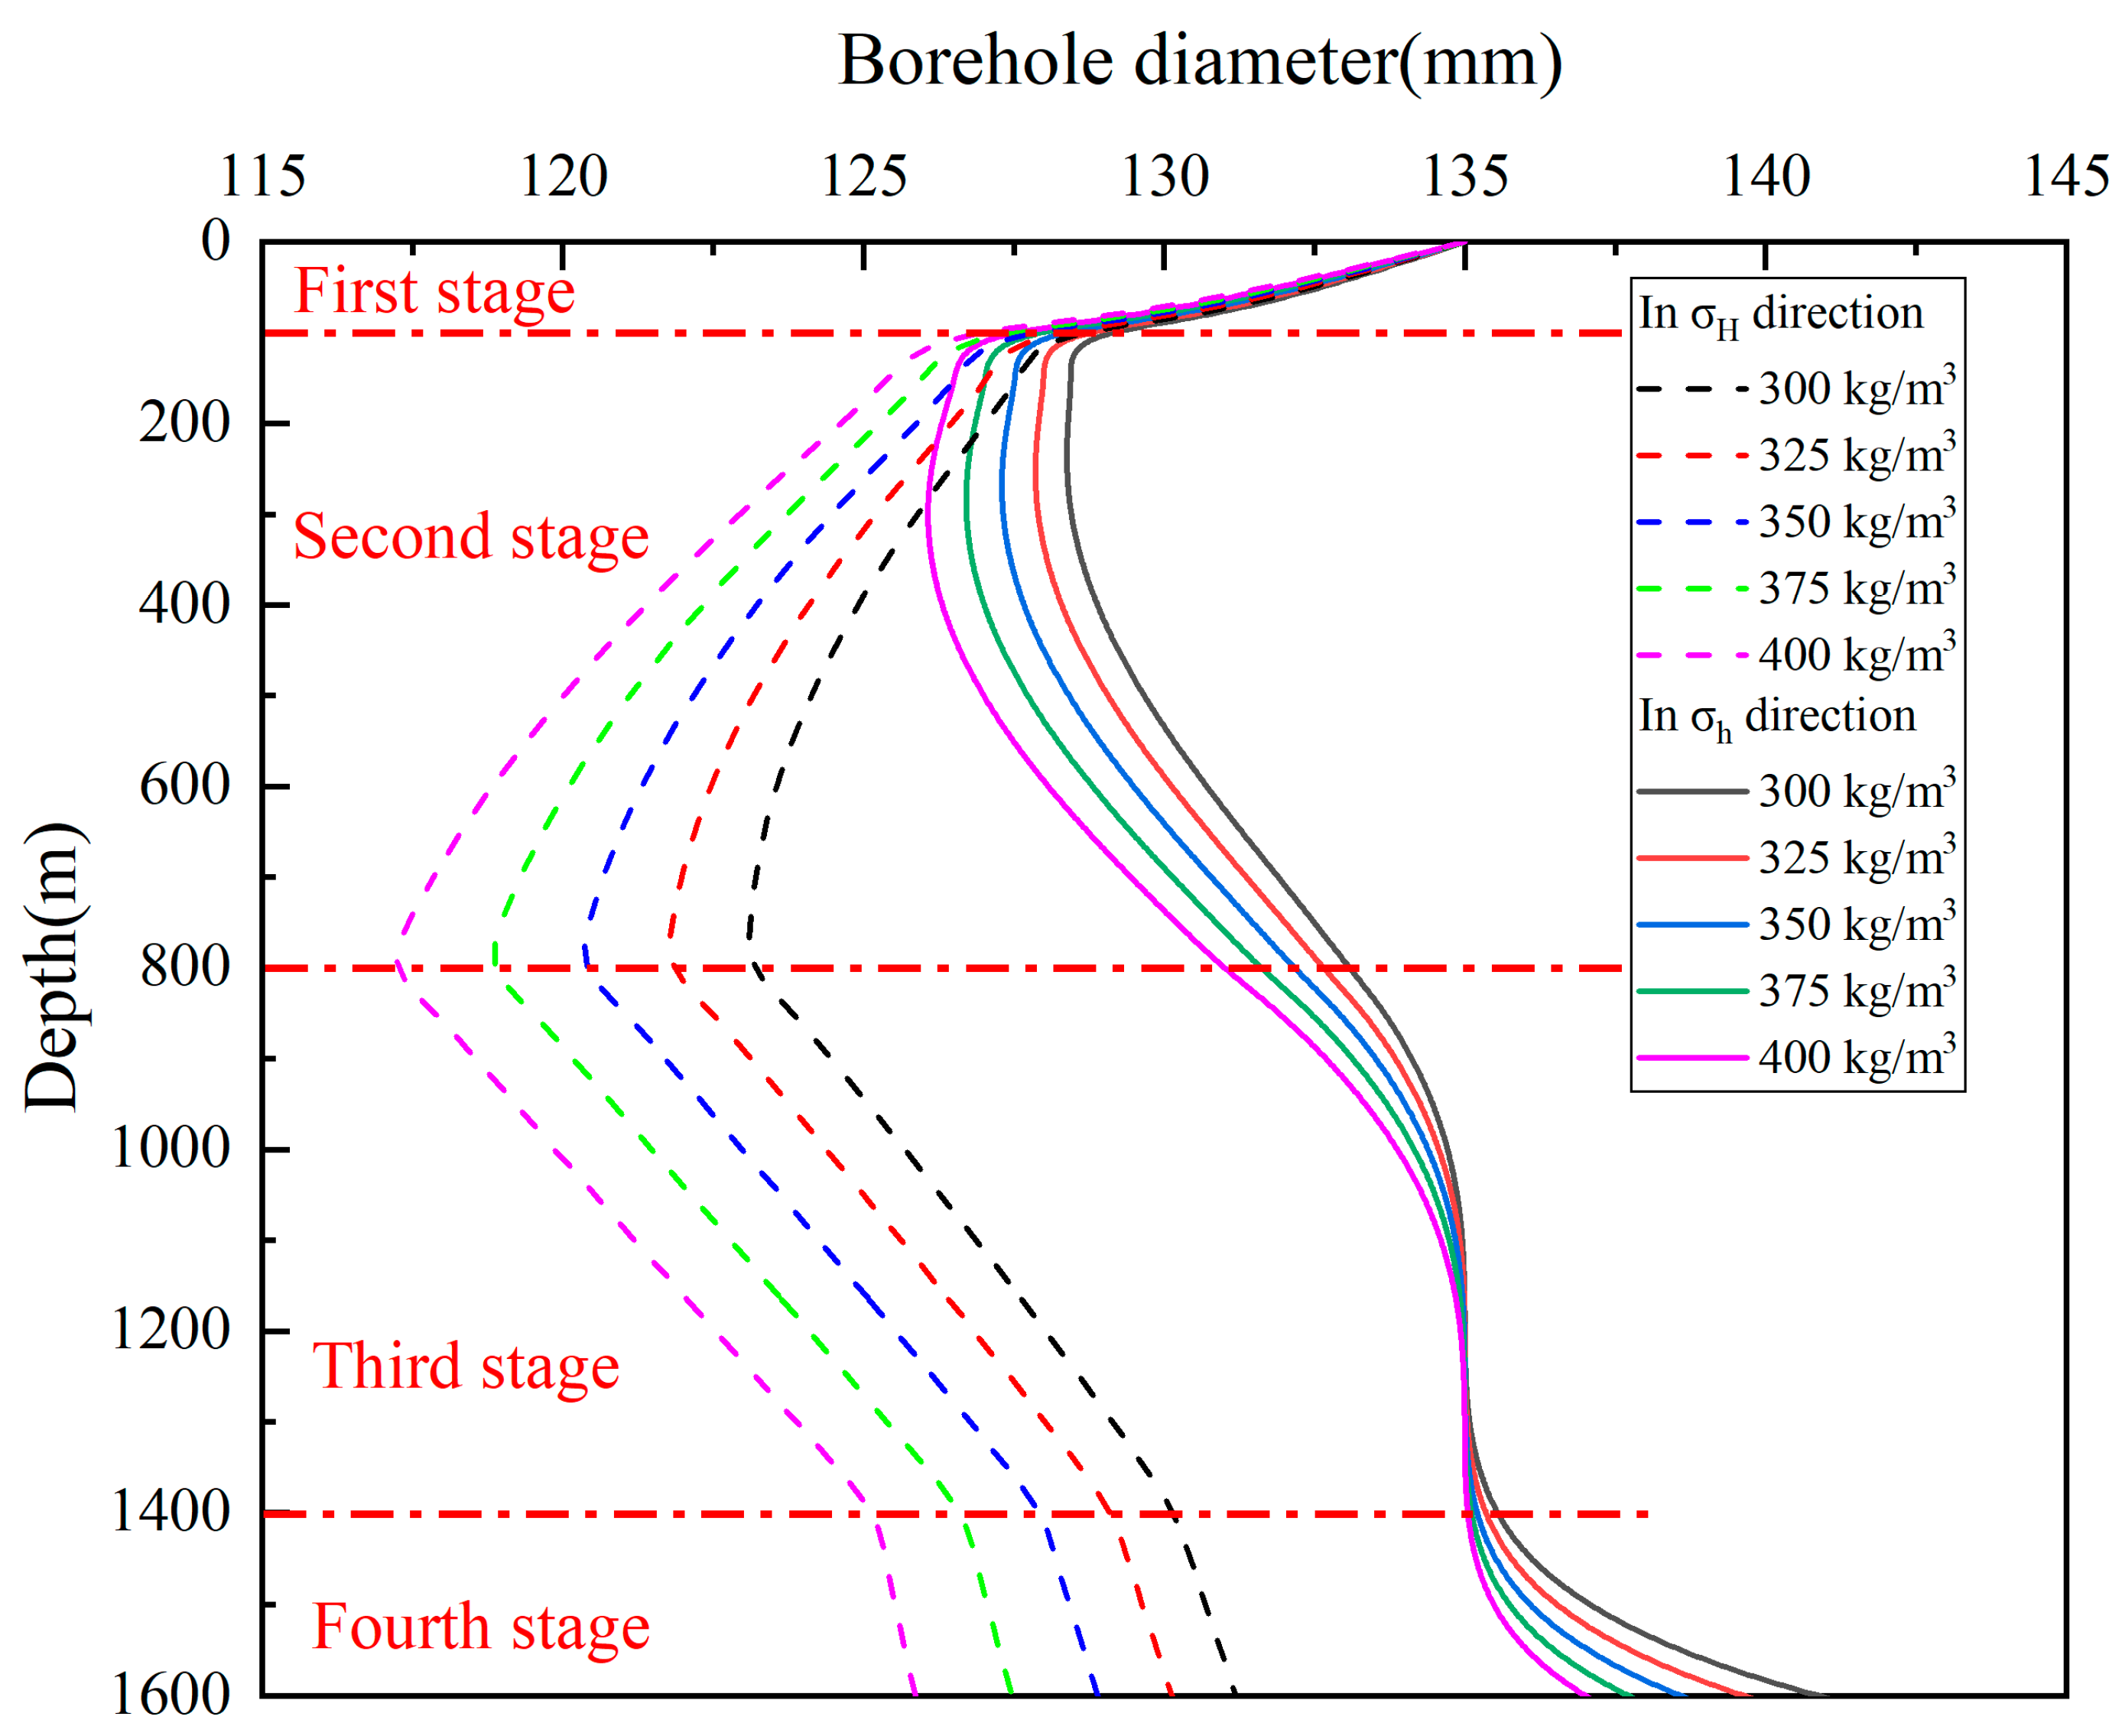
To analyze the effect of surface snow density on ice borehole deformation, we held the other parameters at the average value of the range in Table 3, that is, β 0 = 0.0245 Km−1, T s = −42.85 °C, and ρ 0 = 905 kg/m3. Figure 9 shows the deformation of the borehole diameter in the σ h and σ H directions at different surface snow densities. Unlike the effects of surface temperature and temperature gradients, the evolution of the borehole diameter could be divided into four depth stages. The diameter changes in the first three stages were the same as the effects of the temperature gradients. However, in the fourth stage (at a depth greater than 1400 m), Δ k became smaller than that in the third stage in the σ H direction. The reason for this is that the enhancement factor E is a fixed value and was smaller in the fourth stage. Furthermore, Δ k began to grow negatively after 1400 m in the σ h direction. This is because the drilling fluid pressure increases faster than the minimum principal stress.
The evolution of the change in borehole diameter is shown in Figure 9. In the σ h direction, when the depth was less than 1300 m, the borehole shrank; at depths greater than 1300 m, the borehole began to expand. The borehole always shrank in the σ H direction. In the σ h direction at a depth of 400 m, the borehole diameters at a depth of 400 m were 125, 124, 123, 122, and 121 mm. Compared to the initial borehole diameter of 135 mm, the corresponding rates of diameter change were 7%, 8%, 9%, 10%, and 10%, respectively. In the σ H direction, at a depth of 1600 m, the borehole diameters under the effect of different surface snow densities were 131, 130, 129, 127, and 126 mm, respectively. Compared to the initial borehole diameter of 135 mm, the corresponding diameter rates of change were 3%, 4%, 4%, 6%, and 7%, respectively. This proves that, at the same depth, the surface snow density has a linear relationship with borehole diameter.

4.4. Effect of Drilling Fluid Density

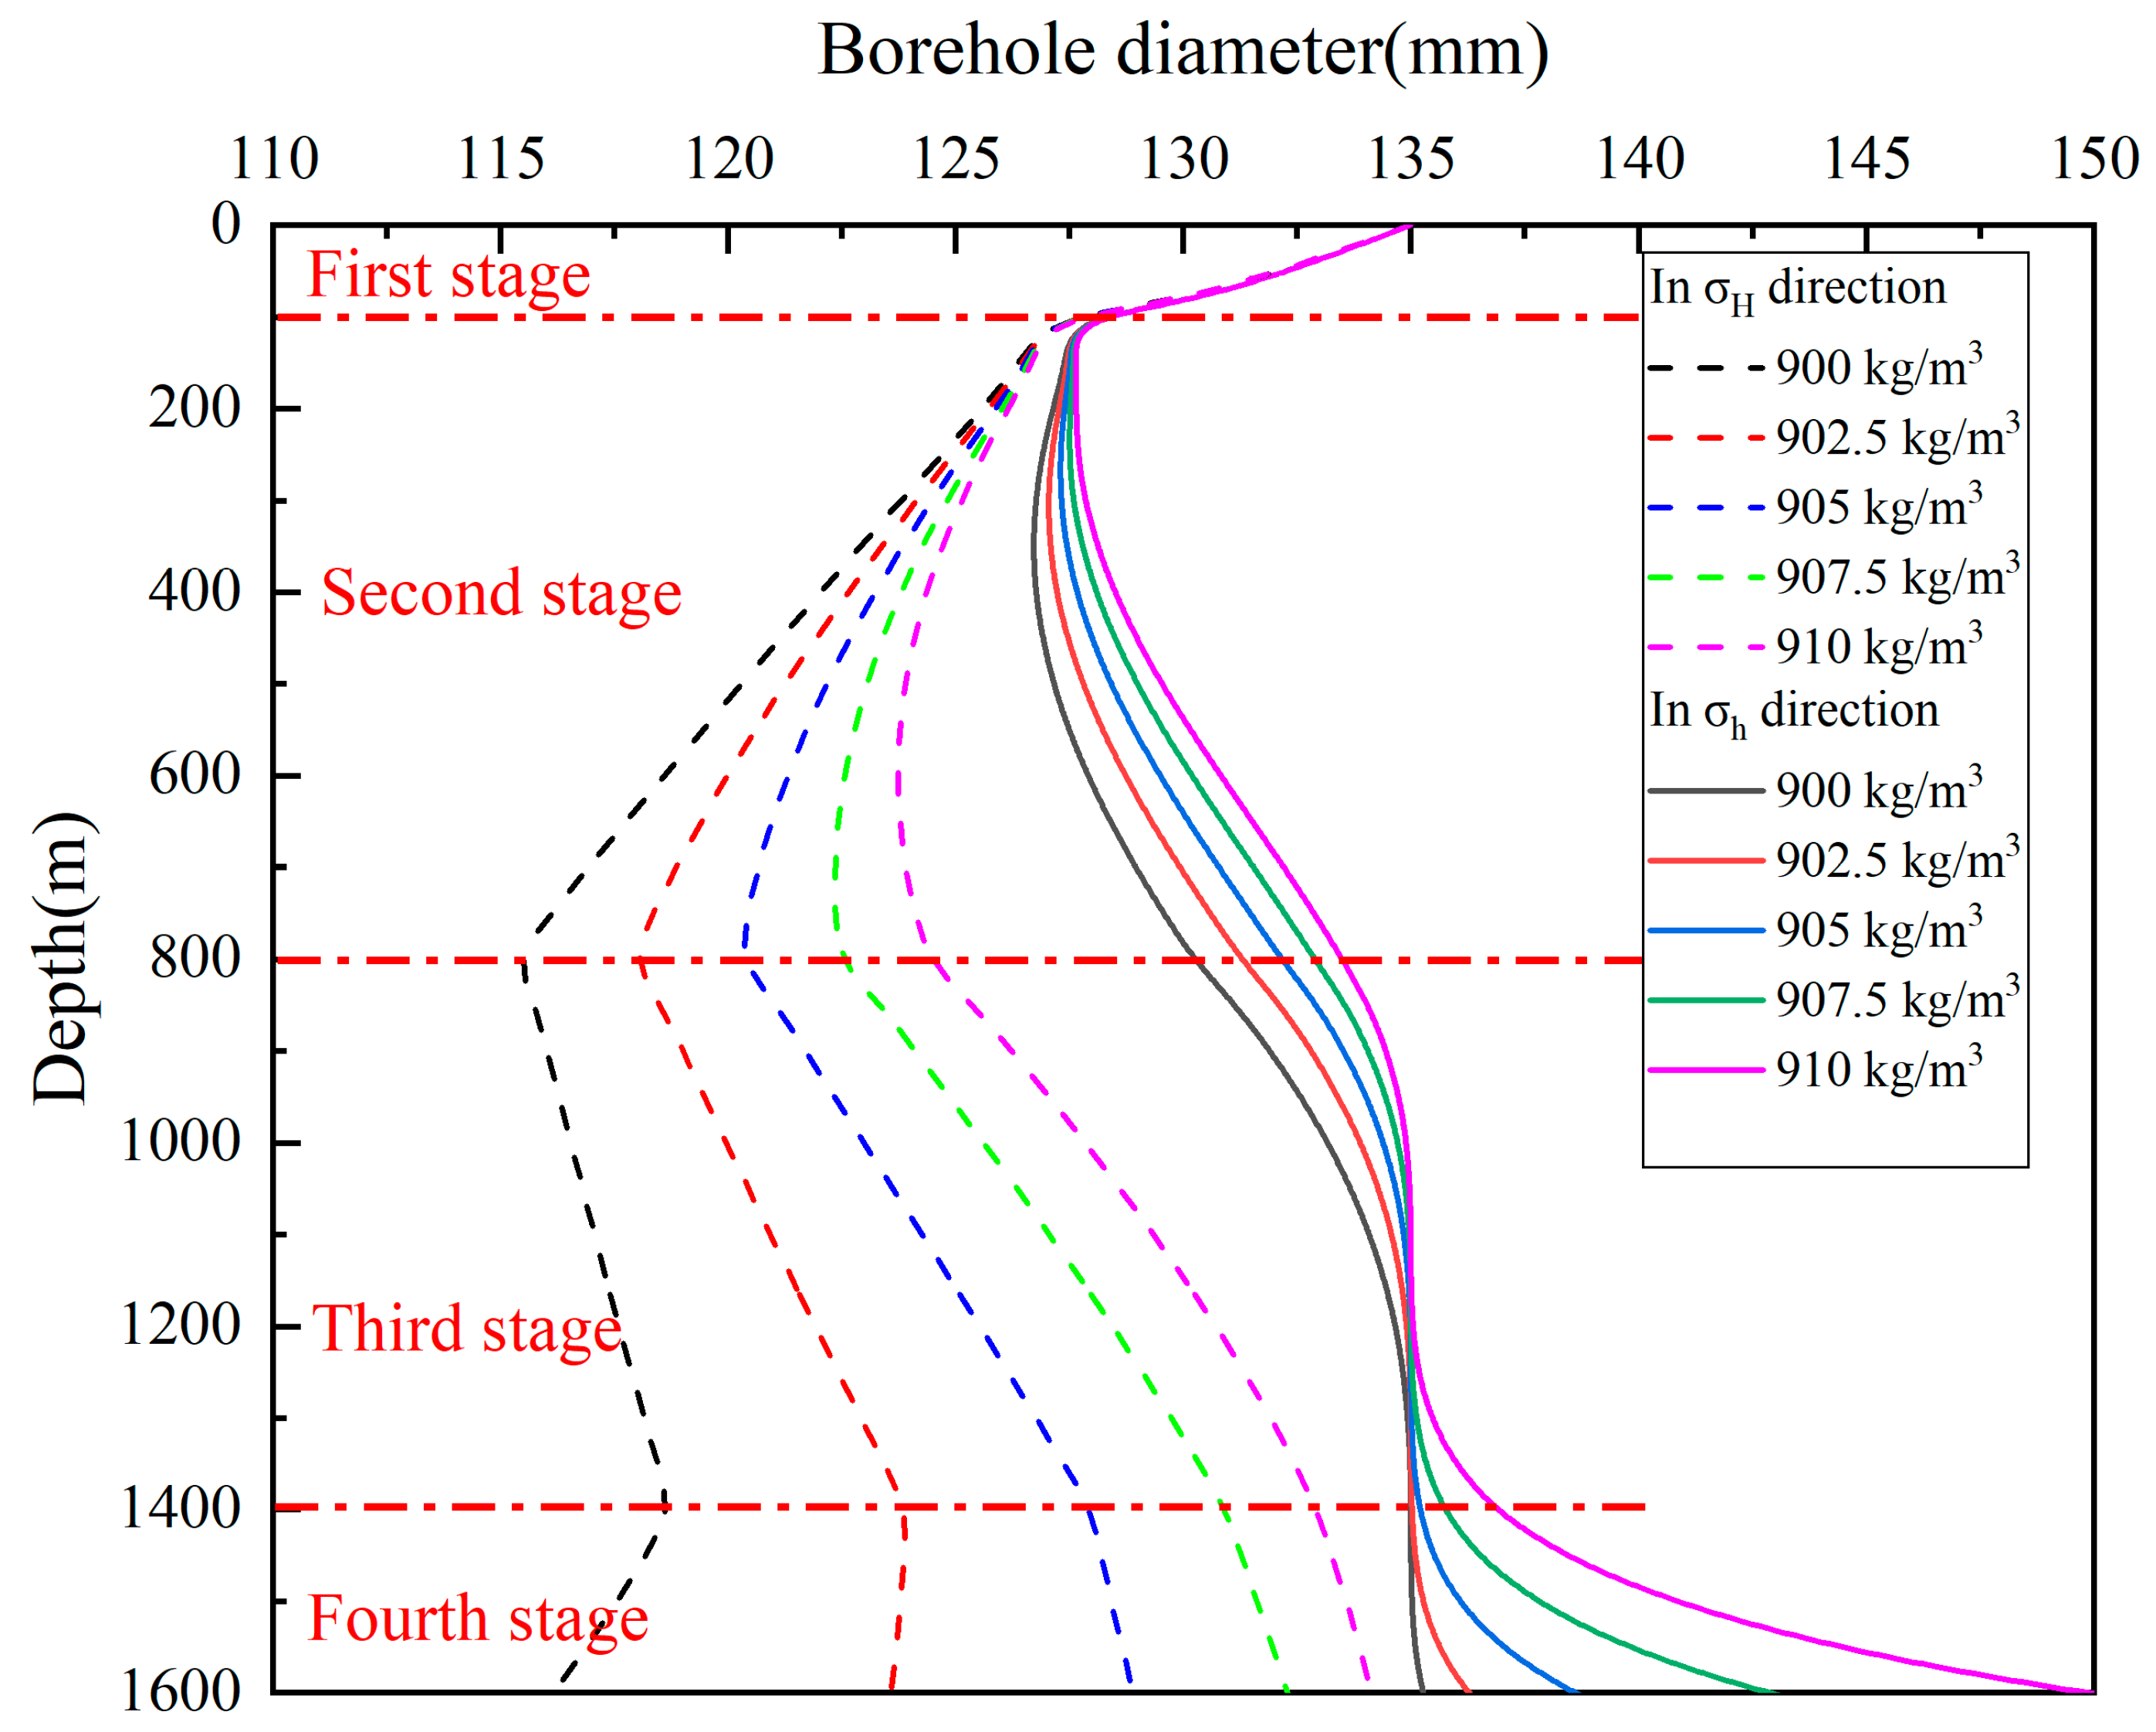
To analyze the effect of drilling fluid density on ice borehole deformation, we held the other parameters at the average value of the range in Table 3, that is, β 0 = 0.0245 Km−1, T s = −42.85 °C, and ρ s = 350 kg/m3. Figure 10 shows the deformation of the borehole diameter in the σ h and σ H directions at different drilling fluid densities. The evolution of the borehole diameter also occurred in four depth stages. The diameter change law was nearly the same as that under the effect of surface snow density.
The evolution of the change in borehole diameter is shown in Figure 10. In the σ h direction, when the depth was less than 1200 m, the borehole shrank. When it was more than 1200 m, the borehole began to expand. The borehole always shrank in the σ H direction.
In the σ h direction at a depth of 800 m, the borehole diameters were 130, 131, 132, 133, and 133 mm. Compared to the initial borehole diameter of 135 mm, the corresponding rates of diameter change were 4%, 3%, 2%, 1%, and 1%, respectively. Furthermore, at a depth of 1600 m, the borehole diameters were 135, 136, 138, 143, and 149 mm. Compared to the initial borehole diameter of 135 mm, the corresponding rates of diameter change were 0%, 1%, 2%, 6%, and 10%, respectively. Thus, at the same depth above 1200 m, the drilling fluid density has a linear relationship with the borehole diameter. When the depth is more than 1200 m, drilling fluid density has a non-linear relationship with borehole diameter at the same depth.
In the σ H direction, the borehole diameters at a depth of 800 m were 115, 118, 120, 122, and 124 mm. Compared to the initial borehole diameter of 135 mm, the corresponding rates of diameter change were 15%, 13%, 11%, 10%, and 8%, respectively. Furthermore, at a depth of 1600 m, the borehole diameters were 116, 124, 129, 132, and 134 mm, respectively. Compared to the initial borehole diameter of 135 mm, the corresponding rates of diameter change were 14%, 8%, 4%, 2%, and 1%, respectively. This proves that at the same depth above 800 m, drilling fluid density has a linear relationship with borehole diameter. At depths greater than 800 m, and at the same depth, drilling fluid density has a non-linear relationship with borehole diameter.

4.5. Multivariate Sensitivity Analysis

To explore the sensitivity of certain factors to borehole deformation, a multivariate analysis was performed. Owing to the inconsistency of unit dimensions, this study normalized all factors according to Equation (23) and calibrated the interval of all factors to be the same interval [–1,1] as follows:
y = x x m i n + x m a x 2 x m a x x m i n 2
where x is the value of the original interval, and y is the value of the normalized interval.
Subsequently, a sensitivity comparison was made for the rate of borehole diameter change under the effect of all factors. The values of all factors after normalization are listed in Table 4.
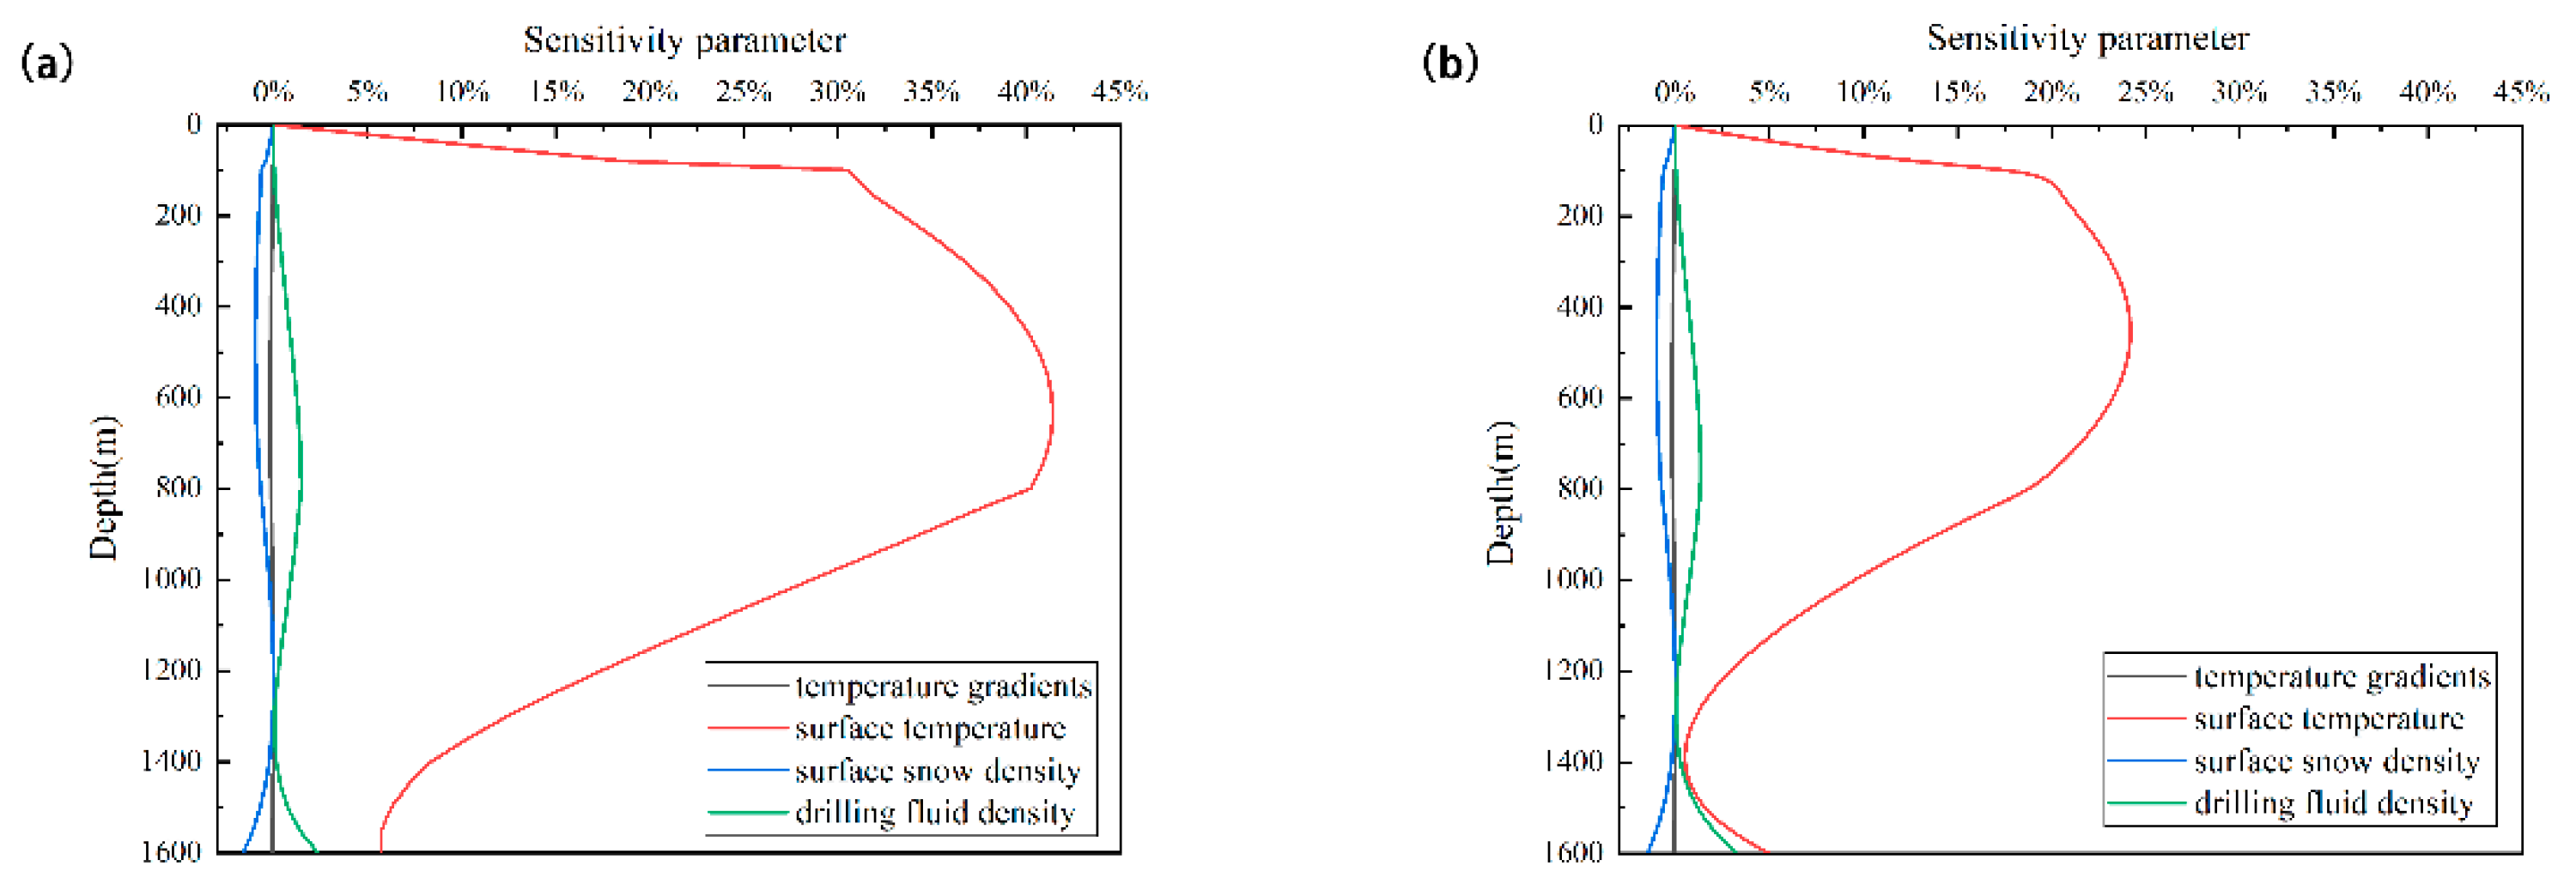
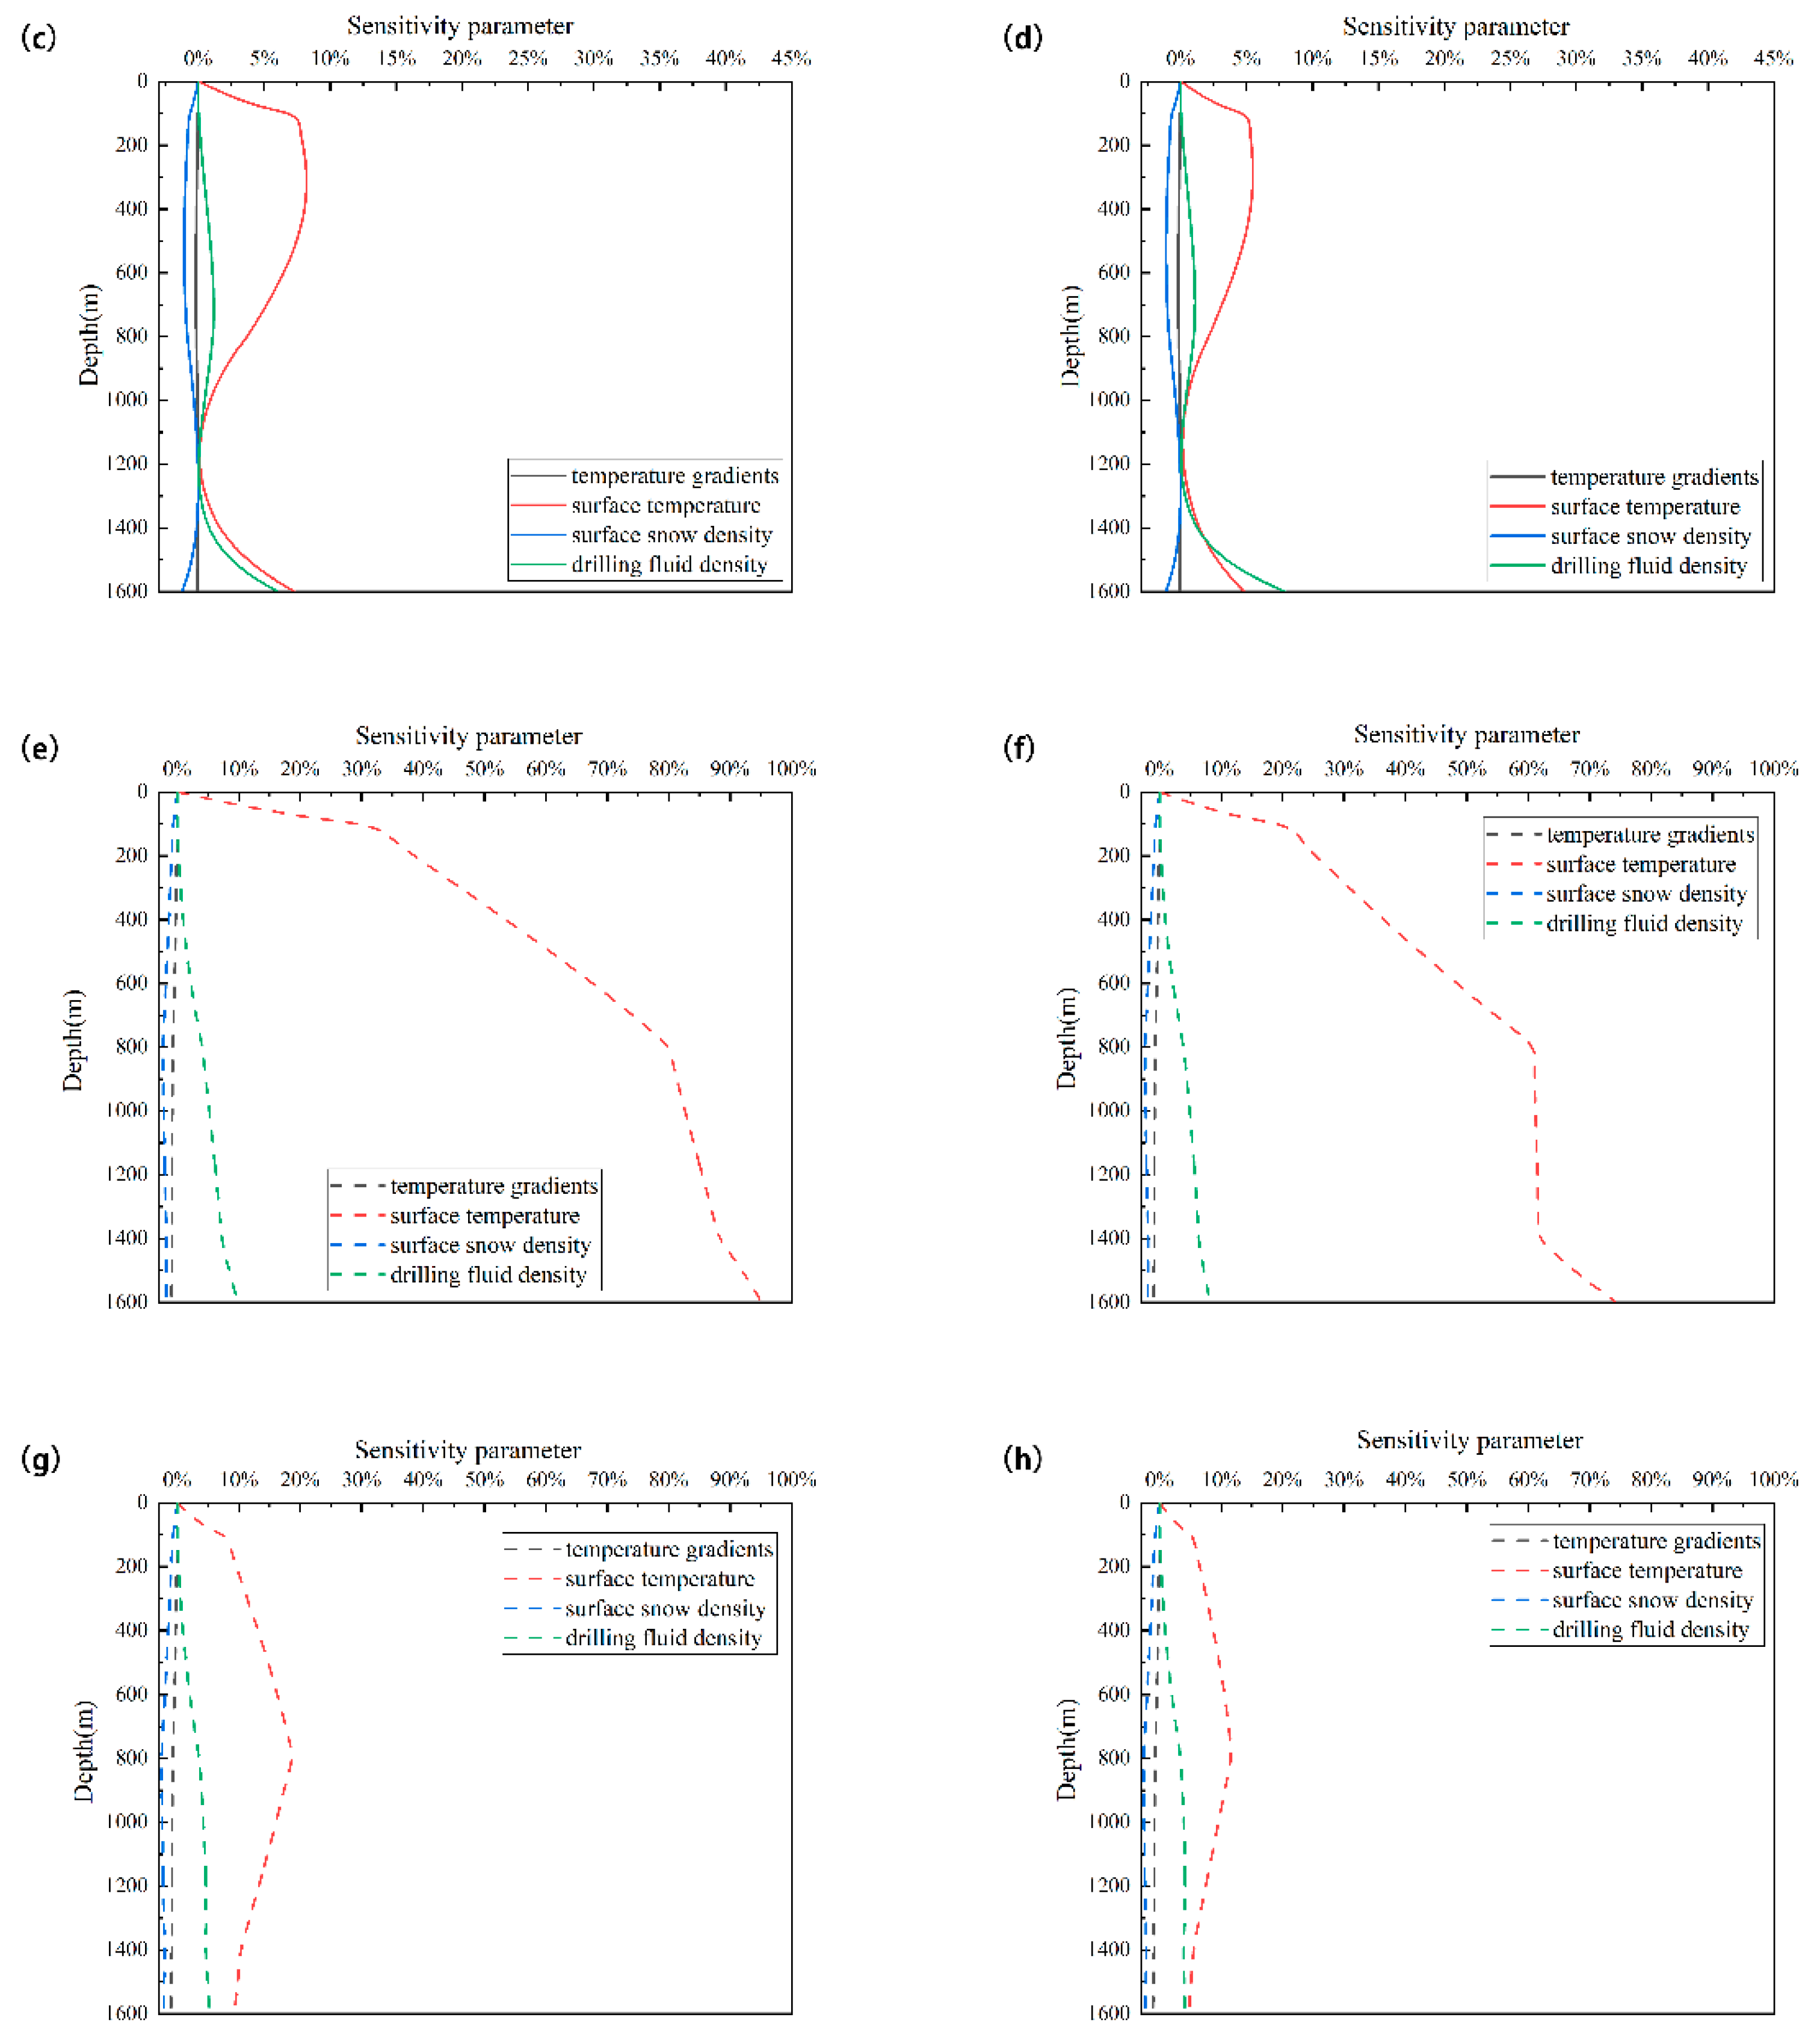
Figure 11 shows the sensitivity of the borehole diameter to the four factors. The sensitivity of borehole diameter to temperature gradients, surface snow density, and drilling fluid density was almost the same and relatively small, indicating that these factors have little effect on borehole diameter. However, the sensitivity of the borehole diameter to surface temperature was greater than that of the other three factors, indicating that the borehole diameter is mainly controlled by the surface temperature. In addition, the ice temperature was calculated from the surface temperature; therefore, the ice temperature was the dominant factor governing borehole deformation. However, with an increase in the floating range of sensitive factors, the sensitivity of deformation to the four factors tended to be the same. However, when the depth was greater than 1200 m, the impact of drilling fluid density increased significantly in the σ h direction. The effect of ice temperature was unsurprising, particularly as it was prescribed in the model. However, this study quantitatively described its sensitivity, where the maximum sensitivity of the borehole diameter to ice temperature was 41% at 650 m in the σ h direction and 95% at 1600 m in the σ H direction.

5. Conclusions

A computation model for calculating ice borehole deformation during polar drilling was proposed in this study. Subsequently, the borehole deformations in the upper 50% of the borehole at the Chinese Antarctic Kunlun station were calculated using this model. Additionally, the factors affecting borehole deformation were investigated. Thus, the dominant factors controlling borehole deformation were obtained. The main conclusions are as follows:
(1) Borehole shrinking, expansion, and their mixed existence occur simultaneously in ice borehole deformations. Ice borehole shrinkage occurred in all principal stress directions for DK-1 at Dome A above 1000 m. Between 1000 and 1600 m, the ice borehole closed in the maximum horizontal principal stress direction and expanded in the minimum horizontal principal stress direction. Below 1600 m, the ice borehole expanded in all the principal stress directions.
(2) With respect to internal factors that affect borehole deformation, the deformation increased with increasing surface temperature at the same depth, while temperature gradient had a minimal effect on borehole deformation. However, as the borehole shrank, borehole deformation increased with increasing surface snow density at the same depth. As the borehole expanded, borehole deformation increased with decreasing surface snow density.
(3) With respect to external factors that affect borehole deformation, as the borehole shrank, borehole deformation increased with decreasing drilling fluid density at the same depth. As the borehole expanded, borehole deformation increased with increasing drilling fluid density.
(4) Ice temperature was the dominant factor affecting the deformation of the ice borehole. The rate of borehole deformation also increased with increasing ice temperatures. This finding suggests that the drilling fluid density should be increased in areas with a high ice temperature to prevent borehole shrinking.

Author Contributions

Y.W.: conceptualization, formal analysis, investigation, writing—original draft preparation, writing—review and editing; X.Z.: software, data curation, and writing—review and editing; S.N.: methodology, writing—reviewing and editing; Y.Z.: supervision, validation; C.C.: conceptualization, funding acquisition, project administration. All authors have read and agreed to the published version of the manuscript.

Funding

This work was financially supported by the National Natural Science Foundation of China (Nos. 41876218 and 42272364) and the Program for JLU Science and Technology Innovative Research Team (No. 2017TD-24).

Data Availability Statement

The data presented in this study are available on request from the corresponding author.

Acknowledgments

The authors also thank anonymous reviewers for their fruitful discussion and useful comments.

Conflicts of Interest

The authors declare no conflict of interest.

References

  1. Gautier, D.L.; Bird, K.J.; Charpentier, R.R.; Grantz, A.; Houseknecht, D.W.; Klett, T.R.; Moore, T.E.; Pitman, J.K.; Schenk, C.J.; Schuenemeyer, J.H.; et al. Assessment of Undiscovered Oil and Gas in the Arctic. Science 2009, 324, 1175–1179. [Google Scholar] [CrossRef] [Green Version]
  2. Lodolo, E.; Camerlenghi, A.; Madrussani, G.; Tinivella, U.; Rossi, G. Assessment of gas hydrate and free gas distribution on the South Shetland margin (Antarctica) based on multichannel seismic reflection data. Geophys. J. Int. 2002, 148, 103–119. [Google Scholar] [CrossRef] [Green Version]
  3. Schulson, E.; Duval, P. Creep and Fracture of Ice; Cambridge University Press: Cambridge, UK, 2009. [Google Scholar]
  4. Duval, P.; Ashby, M.F.; Anderman, I. Rate-controlling processes in the creep of polycrystalline ice. J. Phys. Chem. 1983, 87, 4066–4074. [Google Scholar] [CrossRef]
  5. Glen, J. The Creep of Polycrystalline Ice. Proc. R. Soc. A Math. Phys. Eng. Sci. 1955, 228, 519–538. [Google Scholar] [CrossRef]
  6. Hooke, R.L.; Mellor, M.; Budd, W.F.; Glen, J.W.; Higashi, A.; Jacka, T.H.; Jones, S.J.; Lile, R.C.; Martin, R.T.; Meier, M.F.; et al. Mechanical properties of polycrystalline ice: An assessment of current knowledge and priorities for research: Report prepared for the International Commission on Snow and Ice, with support from the U.S. National Science Foundation. Cold Reg. Sci. Technol. 1980, 3, 263–275. [Google Scholar] [CrossRef]
  7. Mellor, M.; Cole, D.M. Deformation and failure of ice under constant stress or constant strain-rate. Cold Reg. Sci. Technol. 1982, 5, 201–219. [Google Scholar] [CrossRef]
  8. Fujii, Y.; Azuma, N.; Tanaka, Y.; Nakayama, Y.; Kameda, T.; Shinbori, K.; Katagiri, K.; Fujita, S.; Takahashi, A.; Kawada, K.; et al. Deep ice core drilling to 2503 m depth at Dome Fuji, Antarctica. Mem. Natl. Inst. Polar Res 2002, 56, 103–116. [Google Scholar]
  9. Ueda, H.; Talalay, P. Fifty Years of Soviet and Russian Drilling Activity in Polar and Non-Polar Ice: A Chronological History; Cold Regions Research and Engineering Laboratory: Hanover, NH, USA, 2007; p. 145. [Google Scholar]
  10. Talalay, P.; Fan, X.; Xu, H.; Yu, D.; Han, L.; Han, J.; Sun, Y. Drilling fluid technology in ice sheets: Hydrostatic pressure and borehole closure considerations. Cold Reg. Sci. Technol. 2014, 98, 47–54. [Google Scholar] [CrossRef]
  11. Fisher, D.A.; Koerner, R.M. On the Special Rheological Properties of Ancient Microparticle-Laden Northern Hemisphere Ice as Derived from Bore-Hole and Core Measurements. J. Glaciol. 1986, 32, 501–510. [Google Scholar] [CrossRef] [Green Version]
  12. Paterson, W.S.B. Secondary and tertiary creep of glacier ice as measured by borehole closure rates. Rev. Geophys. 1977, 15, 47. [Google Scholar] [CrossRef]
  13. Talalay, P.; Hooke, R. Closure of deep boreholes in ice sheets: A discussion. Ann. Glaciol. 2007, 47, 125–133. [Google Scholar] [CrossRef]
  14. Hooke, R.L. Principles of Glacier Mechanics, 2nd ed.; Cambridge University Press: Cambridge, UK, 2005. [Google Scholar]
  15. Ghassemi, A.; Diek, A. Linear chemo-poroelasticity for swelling shales: Theory and application. J. Pet. Sci. Eng. 2003, 38, 199–212. [Google Scholar] [CrossRef]
  16. Bradley, W.B. Failure of Inclined Boreholes. J. Energy Resour. Technol. 1979, 101, 232–239. [Google Scholar] [CrossRef]
  17. Karimi-Khajelangi, B.; Noorian-Bidgoli, M. Numerical study of the effect of rock anisotropy on stresses around an opening located in the fractured rock mass. J. Pet. Sci. Eng. 2022, 208, 109593. [Google Scholar] [CrossRef]
  18. Budd, W.; Jacka, T.; Jenssen, D.; Radok, U.; Young, N. Derived Physical Characteristics of the Greenland Ice Sheet; University of Melbourne: Melbourne, Australia, 1982. [Google Scholar]
  19. Schytt, V. Snow Studies at Maudheim; Scientific Results; Norwegian British Swedish Antarctic Expedition,1949–1952; scientific results; Norsk Polarinstitutt: Oslo, Norway, 1958. [Google Scholar]
  20. Cuffey, K.M.; Paterson, W.S.B. Physics of Glaciers; Academic Press: Cambridge, MA, USA, 2010. [Google Scholar]
  21. Talalay, P.; Gundestrup, N. Hydrostatic pressure and fluid density profile in deep ice bore-holes. Mem. Natl. Inst. Polar Res. 2002, 56, 171–180. [Google Scholar]
  22. Hongkui, G.; Yingsong, L. Distribution of In-Situ Stresses in Oilfield. Fault-Block Oil Gas Field 1998, 5, 1–5. [Google Scholar]
  23. Joussineau, G.d.; Petit, J.-P.; Gauthier, B.D.M. Photoelastic and numerical investigation of stress distributions around fault models under biaxial compressive loading conditions. Tectonophysics 2003, 363, 19–43. [Google Scholar] [CrossRef]
  24. Zhang, N.; An, C.; Fan, X.; Shi, G.; Li, C.; Liu, J.; Hu, Z.; Talalay, P.; Sun, Y.; Li, Y. Chinese First Deep Ice-Core Drilling Project DK-1 at Dome A, Antarctica (2011–2013): Progress and performance. Ann. Glaciol. 2014, 55, 88–98. [Google Scholar] [CrossRef] [Green Version]
  25. Wang, B.; Tian, G.; Cui, X.; Zhang, X. The internal COF features in Dome A of Antarctica revealed by multi-polarization-plane RES. Appl. Geophys. 2008, 5, 230–237. [Google Scholar] [CrossRef]
  26. Guo, Y.; Li, G.; Jia, C.; Chang, T.; Cui, H.; MARKOV, A. Study of ultrasonic test in the measurements of mechanical properties of ice. Chin. J. Polar Res. 2016, 28, 152–157. [Google Scholar]
  27. Hou, S.; Li, Y.; Xiao, C.; Ren, J. Recent accumulation rate at Dome A, Antarctica. Chin. Sci. Bull. 2007, 52, 428–431. [Google Scholar] [CrossRef]
  28. Wang, Y.; Sodemann, H.; Hou, S.; Masson-Delmotte, V.; Jouzel, J.; Pang, H. Snow accumulation and its moisture origin over Dome Argus, Antarctica. Clim. Dyn. 2013, 40, 731–742. [Google Scholar] [CrossRef]
  29. Hooke, R.L.; Hudleston, P.J. Ice Fabrics in a Vertical Flow Plane, Barnes Ice Cap, Canada. J. Glaciol. 1980, 25, 195–214. [Google Scholar] [CrossRef] [Green Version]
  30. Baker, R.W. Textural and crystal-fabric anisotropies and the flow of ice masses. Science 1981, 211, 1043–1044. [Google Scholar] [CrossRef] [PubMed]
  31. Baker, R.W. A flow equation for anisotropic ice. Cold Reg. Sci. Technol. 1982, 6, 141–148. [Google Scholar] [CrossRef]
  32. Russell-Head, D.S.; Budd, W.F. Ice-Sheet Flow Properties Derived from Bore-Hole Shear Measurements Combined with Ice-Core Studies. J. Glaciol. 1979, 24, 117–130. [Google Scholar] [CrossRef] [Green Version]
  33. Hooke, R.; Dahlin, B.; Kauper, M. Creep of Ice Containing Dispersed Fine Sand. J. Glaciol. 1972, 11, 327–336. [Google Scholar] [CrossRef]
  34. Durham, W.B.; Kirby, S.H.; Stern, L.A. Effects of dispersed particulates on the rheology of water ice at planetary conditions. J. Geophys. Res. 1992, 97, 20883. [Google Scholar] [CrossRef] [Green Version]
  35. De La Chapelle, S.; Milsch, H.; Castelnau, O.; Duval, P. Compressive creep of ice containing a liquid intergranular phase: Rate-controlling processes in the dislocation creep regime. Geophys. Res. Lett. 1999, 26, 251–254. [Google Scholar] [CrossRef]
  36. Mangold, N.; Allemand, P.; Duval, P.; Geraud, Y.; Thomas, P. Experimental and theoretical deformation of ice–rock mixtures: Implications on rheology and ice content of Martian permafrost. Planet. Space Sci. 2002, 50, 385–401. [Google Scholar] [CrossRef]
  37. Eisen, O.; Hamann, I.; Kipfstuhl, S.; Steinhage, D.; Wilhelms, F. Direct evidence for continuous radar reflector originating from changes in crystal-orientation fabric. Cryosphere 2007, 1, 1–10. [Google Scholar] [CrossRef] [Green Version]
  38. Matsuoka, K.; Furukawa, T.; Fujita, S.; Maeno, H.; Uratsuka, S.; Naruse, R.; Watanabe, O. Crystal orientation fabrics within the Antarctic ice sheet revealed by a multipolarization plane and dual-frequency radar survey. J. Geophys. Res. Solid Earth 2003, 108, 1–10. [Google Scholar] [CrossRef]
  39. Tang, X.; Sun, B.; Zhang, Z.; Zhang, X.; Cui, X.; Li, X. Structure of the internal isochronous layers at Dome A, East Antarctica. Sci. China Earth Sci. 2011, 54, 445–450. [Google Scholar] [CrossRef]
  40. Sun, B.; Moore, J.C.; Zwinger, T.; Zhao, L.; Steinhage, D.; Tang, X.; Zhang, D.; Cui, X.; Martín, C. How old is the ice beneath Dome A, Antarctica? Cryosphere 2014, 8, 1121–1128. [Google Scholar] [CrossRef] [Green Version]
  41. Zhao, L.; Moore, J.C.; Sun, B.; Tang, X.; Guo, X. Where is the 1-million-year-old ice at Dome A? Cryosphere 2018, 12, 1651–1663. [Google Scholar] [CrossRef] [Green Version]
  42. Morris, E.M.; Vaughan, D.G. Snow surface temperatures in West Antarctica. Antarct. Sci. 1994, 6, 529–535. [Google Scholar] [CrossRef]
  43. Wang, Y.; Hou, S. Spatial distribution of 10 m firn temperature in the Antarctic ice sheet. Sci. China Earth Sci. 2011, 54, 655–666. [Google Scholar] [CrossRef]
  44. Ding, M.; Xiao, C.; Jin, B.; Ren, J.; Qin, D.; Sun, W. Distribution of δ 18O in surface snow along a transect from Zhongshan Station to Dome A, East Antarctica. Chin. Sci. Bull. 2010, 55, 2709–2714. [Google Scholar] [CrossRef]
  45. Ma, Y.; Bian, L.; Xiao, C.; Allison, I.; Zhou, X. Near surface climate of the traverse route from Zhongshan Station to Dome A, East Antarctica. Antarct. Sci. 2010, 22, 443–459. [Google Scholar] [CrossRef]
Figure 1. Stress distribution around the borehole.
Processes 11 01150 g001
Figure 2. Stress around the ice borehole.
Processes 11 01150 g002
Figure 3. Drilling site of the first Chinese deep ice-core drilling project, DK-1, at Dome A, Antarctica.
Processes 11 01150 g003
Figure 4. Calculated ice temperature distribution and variation in density with depth at Dome A.
Processes 11 01150 g004
Figure 5. Variation in stress in the borehole wall, with depth ((a): for σ H direction; (b): for σ h direction).
Processes 11 01150 g005
Figure 6. Calculated borehole diameter changes with time for a 1600 m hole at Dome A.
Processes 11 01150 g006
Figure 7. Sensitivity analysis of changes in borehole diameter with surface temperature in one year.
Processes 11 01150 g007
Figure 8. Sensitivity analysis of changes in borehole diameter with temperature gradient in one year.
Processes 11 01150 g008
Figure 9. Sensitivity analysis of changes in borehole diameter with surface snow density in one year.
Processes 11 01150 g009
Figure 10. Sensitivity analysis of changes in borehole diameter with drilling fluid density in one year.
Processes 11 01150 g010
Figure 11. Sensitivity results for borehole diameter. ((ad) show sensitivity when the sensitivity factor is floated by −100%, −50%, 50%, and 100%, respectively, in the σ h direction. while (eh) show the sensitivity results in the σ H direction).
Processes 11 01150 g011aProcesses 11 01150 g011b
Table 1. Parameter values for the Dome A calculations.
ParametersDescriptionValueUnitReference
ρ ice Density of pure ice916.8 kg / m 3 [10]
z p Firn correction parameter34m[20]
μ Poisson’s ratio of ice0.331 [26]
nCreep exponent3 [10]
BCoefficient of viscosity0.14MPa a1/n[14]
r e Longitudinal strain rate0.1a−1[14]
b n Accumulation rate0.023ma−1[27]
κ Thermal diffusivity37.2m2a−1[14]
QActivation energy for creep60kJmol−1[13]
RUniversal gas constant8.314Jmol−1k−1
β 0 Temperature gradients0.0226Km−1[18]
T s Annual temperature at 10 m depth of the ice layer−58.5°C[27]
ρ s Density of surface snow350 kg / m 3 [28]
ρ 0 Density of drilling fluid at 0 °C901.2kg/m3[10]
Table 2. Value of E at various depths.
Depth (m)Value of E
0–8001–4
800–14004–2.4
1400–20002.4
Table 3. Variable values.
ParametersDescriptionValueUnitReference
β 0 Temperature gradients0.0226–0.0264Km−1[18]
T s Temperature at 10 m of the ice layer−27.2–
−58.5
°C[27,44]
ρ s Density of surface snow300–400 kg / m 3 [45]
ρ 0 Density of drilling fluid at 0 °C900–910kg/m3(Personal communication)
Table 4. Sensitivity analysis factor values.
−1−0.500.51
Temperature gradient0.02260.023550.02450.025450.0264
Surface temperature−27.2−35.025−42.85−50.675−58.5
Surface snow density300325350375400
Drilling fluid density900902.5905907.5910
Disclaimer/Publisher’s Note: The statements, opinions and data contained in all publications are solely those of the individual author(s) and contributor(s) and not of MDPI and/or the editor(s). MDPI and/or the editor(s) disclaim responsibility for any injury to people or property resulting from any ideas, methods, instructions or products referred to in the content.