Abstract
Fruit and vegetables (FV) are the major source of bioactive compounds for human beings. FV supply chains are complex and sensitive due to various features, including the seasonality of products, variations in demand, and short shelf-lives. The amount of waste in FV supply chains is significant compared with other supply chains as 44% of fresh FV produced globally are wasted in the food chain. This large amount of waste has a significant impact on the economy, food security, available natural resources, and the environment. To reduce food losses in the fresh food supply chain (FFSC), the root causes of waste must be first identified. While a number of researchers have investigated food losses in Australia, most only consider a specific stage in the supply chain and multiple stages in the FFSC are often overlooked. Additionally, the impact of advanced storage technologies, packing, handling, and transport on food losses should be investigated. Furthermore, supply chain practices are changing in response to uncertainties, such as the pandemic and climate changes, which also need to be captured. This research aims to identify the key factors contributing to fresh fruit and vegetable losses through a comprehensive empirical study. Primary data were collected through a well-designed questionnaire-based survey targeting major stakeholders in the FFSC, including farmers, distributors, and retailers in Australia. The survey investigates current postharvest practices and the effects of these practices on food losses. The main factors influencing food losses were identified and the options to reduce these losses were outlined. The results showed that losses mostly occurred at the farm level, and picking practices and preharvest conditions largely contributed to FV losses. The results highlight the need for proper training and education for workers involved in harvesting and handling fresh produce.
1. Introduction
According to the United Nations Food and Agriculture Organization (FAO), one-third of the food produced globally is wasted in the food supply chain every year. Food loss or food waste is considered a major global barrier to achieving food sustainability. Food losses have adverse effects on food security, food quality and safety, economic development and the environment. The impact is more prominent and noticeable in poorer countries. Gerland et al. [1] indicated that the world population is expected to reach around 12.3 billion by 2100, which means that a further 5 billion people will need to be fed, and the issue of food loss will be critical as demand for food resources will be significantly increased to meet the requirements of the future population. Together with the high levels of food waste, prices have been rising globally and are expected to continue rising in the near future. Global uncertainty and wars have further contributed to price rises. Increasing food prices particularly affect poor people by making it difficult for them to purchase essential foods [2]. As food production needs to be increased to meet the growing demand and deliver at affordable prices, environmental issues will be raised as well due to the increased use of resources such as water, fertilizers, pesticides, and energy which are usually required for farming practices [3,4]. The best way to minimize the required food production and consequently increase available is to minimise the loss in the FFSC. If the food waste issue is not properly addressed, the increase in food production will result in further increased food losses. Therefore, food loss is a vital factor when addressing sustainability and food security [5].
Food waste is defined as any kind of food that is discarded, intended to be discarded or is required to be discarded. Fresh produce consists of products that are perishable in nature, have a limited shelf life and are characterised by seasonality [6,7]. The fresh produce supply chain includes all the activities (farming, wholesaling, storing and retailing) that occur from the producer to the distributor and up to the final consumer. This waste could occur during processing, handling, packaging and transporting [8]. In 2015, the Sustainable Development Goals (SDGs) were adopted by the United Nations with a specific target to reduce food loss at each stage of the supply chain. The SDGs Target 12.3 indicated that “By 2030, halve per capita global food waste at the retail and consumer levels and reduce food losses along production and supply chains, including post-harvest losses” [9].
Over the past years, there have been various regional and international initiatives aimed at defining and quantifying the occurrences of food loss and waste throughout the food supply chain. For instance, Nahman et al. [10] estimated the food loss costs throughout the food supply chain in South Africa, while Werf and Gilliland [11] assessed the food loss and waste in developed countries (USA, Canada, UK, Japan, and some EU countries). Xue et al. [12] estimated the food loss at global level for major commodity groups. However, Li et al. [13] claimed that it is difficult to measure food loss and food waste due to the definitions and calculation methods used for measuring the loss. Even though these studies have identified significant gaps regarding the causes of food loss, due to differences in definitions and determinations of these causes, the available data on food loss are disjointed and heterogeneous.
Food losses occur at the early stage of the food supply chain, at the production, postharvest, and processing stages. In other words, food is lost before reaching the consumer. On the other hand, food waste also occurs at the consumer stage, which is usually related to the “consumer behaviour” and retailers’ decisions to throw the food away [14,15]. The level of waste mostly depends on the natural characteristics of the product, and other external factors such as temperature, shelf-life and variation in demand [8]. The food loss rate is not the same in all countries, especially when comparing developed and less developed countries. According to a comparative review by Hodges et al. [16], these losses in developed countries usually occur after harvesting and leaving the farm, and mostly at the consumer stage. On the other hand, in less developed countries, the food is lost even before reaching the farm gate [17].
Australian farmers supply about 93 percent of the domestic food demand, and 60 percent of their farm produce is exported [18]. Australian fresh produce is valued at AU$ 42.8 billion and the primary food industry employs around 1.7 million people [19]. However, more than 7.6 million tonnes of food across the Australian food supply chain is wasted, which costs the economy around AUD 36.6 billion each year [20]. About 3.32 million tonnes is sent to landfill [21].
Australian researchers are focusing on this important matter. Some states have implemented campaigns, including New South Wales with a campaign called “Love Food Hate Waste” that is part of the Waste Resource Action Programme (WRAP) and is aimed at reducing business and household waste with the cooperation of government and non-profit organisations [22]. According to Schneider et al. [22], the majority of the research focuses on consumer, household and trade waste, and only a few research works examine farming or processing losses. Hamilton et al. [23] and Baker et al. [24] surveyed household waste and evaluated the economic effects of waste. Mason et al. [25] reviewed a large number of previous studies on Australian food waste and concluded that it was not possible to collect accurate information about at national or state levels due to differences in defining waste, the methods used and the targeted waste streams. Others looked at waste from a different perspective; for example, Ridoutt et al. [26] investigated the water footprint of losses in a fresh mango supply chain at the processing level and showed that reducing the food losses would have a great impact on the availability of freshwater.
Understanding the origin of food loss in the supply chain will help researchers and stakeholders find effective solutions to reduce and prevent food losses. The main factors causing food loss and waste have been examined by researchers from many different perspectives. Although some researchers tried to identify the causes of losses in food supply chains [27,28,29,30], they only considered a single stage in FFSC for their studies; thus, it is still difficult to compare findings as each considered different stages of FFSC or different types of products. Griffith et al. [31] investigated losses in fresh apple supply chains in Australia and reported the estimated amount of fresh apple loss and costs associated with these losses. Ghosh et al. [32] investigated options to minimize food losses for fresh fruit and vegetables producers in Western Australia.
To date, there has been no thorough investigation into the various factors that lead to food waste in the entire fresh food supply chain in Australia. In particular, it is crucial to consider the cooling and transportation methods used by farms, distributors, and retailers when pinpointing the underlying reasons for food loss. This study seeks to address this knowledge gap by identifying the key factors that contribute to loss in the supply chain for fresh fruit and vegetables in Australia.
2. Materials and Methods
This study used a questionnaire-based survey to collect primary data. A well-designed questionnaire-based survey was conducted among different supply chain actors in Australia including the growers, distributors, wholesalers, retailers, and local markets involved in FFSC.
The issue of post-harvest losses in the supply chain for fresh fruit and vegetables was studied at each stage of the supply chain. A comprehensive systematic review of current literature was conducted to understand the post-harvest losses and wastage problems in the supply chain of agricultural products, especially the supply chain of fruit and vegetables. In the literature, researchers have reported that it is difficult to estimate the losses of fresh fruit and vegetables and have provided inconsistent data. Generally, two approaches have been adopted to determine the food losses in supply chains. The first approach is to directly measure the actual losses from the start assuming that all the quantities are known, which is actually not the case as quantifying the actual losses in the chain is difficult [16]. The second approach is to gather the information from actual stakeholders using questionnaire-based surveys. In general, qualitative losses are challenging to assess compared with quantitative losses [33]. In this study, a self-administered questionnaire-based survey was suitable as it allowed a large number of respondents from all stages of the FFSC to be approached and data from actual stockholders to be gathered. In the literature, similar research studies regarding food losses in supply chains employed a similar approach. This approach helps the research to attain greater reliability and accuracy levels when gathering data and decreases the level of subjectivity [34].
Once the survey questionnaire was designed, a pilot test was conducted to evaluate the validity and the appropriateness of the questionnaire. The pilot test was carried out at Queensland University of Technology with a group of experts in supply chain processes. Based on their responses, some modifications were made to the questionnaire, which included adding questions and changing some questions to Likert scale-type questions. Further tests with the modified questionnaire were performed with expert academic staff at the Queensland University of Technology. Most of the questions were based on 1–5 Likert scales, where 1 stands for strongly disagree/least applies and 5 for strongly agree/most applies. Other questions were multiple-choice type, and one question was an open answer format that allowed any respondent to add a comment or provide further information. The survey questions were simple, and the participants were offered to receive the survey’s output if they wished.
The questionnaire enabled the respondents to provide both qualitative and quantifiable information on different aspects of the processes of harvesting, transport, storage, and sale, and also the information about food losses and waste management. All survey participants were provided with a summary letter that fully explained the nature of the questionnaire as required by Human Research Ethics at Queensland University of Technology.
3. Data Collection and Sampling
The online survey was created and published using Qualtrics software, which is one of the most popular survey tools used for survey research. The questionnaire link was sent directly to participants through their official emails. Moreover, a response period of three weeks was provided to the survey respondents, along with the periodical follow-ups in the form of email reminders and phone calls.
A total of 500 survey invitations were emailed to participants who were randomly selected. In addition, an advertisement for the survey was published in the monthly newsletter of the Australian Institute of Food Science and Technology (AIFST), where different supply chain actors were requested to follow the questionnaire link to participate if they wished.
Out of the 500 questionnaires sent to participants, 55 were returned uncompleted as some participants had changed email addresses, changed organisations or closed their businesses. Additionally, some of the respondents informed us that they were not selling or dealing with fresh fruit and vegetables. A total of 75 responses were received from the survey which corresponds to a 16.8 response rate. After filtering the responses, and excluding the incomplete surveys, a total of 63 responses were analysed for this study.
4. Data Analysis
Most of the data collected in this research were quantitative; therefore, a quantitative type of data analysis technique was used employing statistical software, i.e., Statistical Package for Social Science (SPSS) version 28.0.1.0 (142), which is a common statistical tool for analysing quantitative data [35]. The data were analysed by descriptive statistics using SPSS. Since the purpose of this study is to identify the factors causing food loss, this data analysis technique allowed the researchers to establish the outcomes of each item formulated in the survey questionnaire and provided a summarised view of the responses collected by the participants.
Reliability analysis in surveys is vital to ensure that the survey measures are precise and consistent over time and across different groups of respondents. The most important procedure used to statistically determine reliability is the Cronbach’s coefficient alpha [36]. In addition, to obtain reliable data, the instruments measuring the same construct should be significantly different from other instruments. In other words, the questions in the questionnaire should be different from each other with no repetition of questions. Therefore, an F-test of reliability analysis was used to measure the uniqueness of the variables. A significant value of F confirms that each variable of the analysis is unique and not repeated.
5. Results
The first part of the survey collected demographic information. The participants were requested to provide their name (optional to answer), size and type of their organization, and the fresh products they were dealing with. The second part of the survey contained the questions related to the levels of food loss at their stage of the supply chain, the factors contributing to these losses, the control and handling measures they implement, and the cooling technologies they apply. The participants were asked their opinion about the methods of loss minimization as well as preferred food disposal methods. Before analysing the data, the reliability of the instrument was tested.
6. Instrument Reliability
Reliability tests results of the present survey instrument are presented in Table 1 below. Considering the value of Cronbach’s Alpha, the values exceeded the minimum value of 0.6, which means that the data are highly reliable for the analysis [36]. Two most important constructs of this study, Stages of food loss (FL) and factors contributing to FL constructs, have very high (>0.92) reliability. Moreover, all the variables have significant F values (ρ < 0.05), which indicates that the variables studied are unique and not a repetition.

Table 1.
Reliability test results.
7. Demographic Characteristics of the Respondents
The size distribution of the participants’ organisations is an important measure of the companies’ representation. In general, the size of any organization is usually categorised as small, medium or large, as indicated by the number of employees at the company [37]. The responses categories in the questionnaire were small (1–50 employees), medium (50–150 employees), and large companies (more than 150 employees). Figure 1a shows that, most participants were small-size firms (55.56%), while 31.75% were medium size companies and 12.7% were large firms. Regarding the type of firm, the distribution of participants shows the majority of the respondents were farmers followed by distributors and retailers, and some participants reported that they were food hubs. It is clear that all major stakeholders in the FFSC participated in the study.
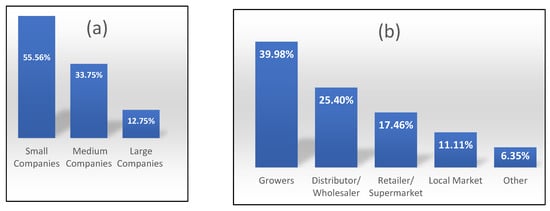
Figure 1.
(a) Firm/company size. (b) Firm/company type.
The participants were asked about the products they handled in their firm, and most indicated that they dealt with multiple products. The major fresh products included apple and pear, stone fruits, berries, citrus, carrots, onions, pumpkin, and cucumber. Other products were tropical fruits, root vegetables and leafy greens. In addition, one producer reported nuts as their main product. From Figure 2, it can be seen that apple and pear were the most commonly grown or handled products among the respondents (63.5%), followed by stone fruits such as peaches and apricots (50.8%). The proportions of the other products were between 40% and 46%.
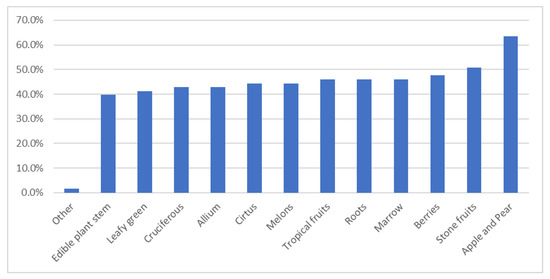
Figure 2.
Proportion of respondents dealing (production/storage/selling) with different types of fruits in Australia.
8. Practices and Technologies Adopted by the Companies
In the second section of the survey, the questions were about handling/control measures for their products, the cooling technologies used for storage, the vehicles used for transportation, and other factors related to food loss. The questions were also about the stages where the most losses occurred, and the methods of disposing and reducing food loss at the participant’s site. These questions were mostly Likert scale questions, where different options were listed, and participants indicated the preferred option which was scaled from “Strongly agree/Mostly applied” (5) to “Strongly disagree/Not applied at all” (1). In addition, the participants had the option to add their answer in the “other” box for options that were not listed.
The participants were asked about control/handling measures they use, and to indicate the level of use of these measures at their site. The questions included whether their products need a controlled temperature or humidity during transport to storage and whether these products require special handling or storage measures. The mean scores for these measures are presented in Figure 3. It can be seen that the most important measure that companies are concerned about is controlling the temperature, followed by controlling the humidity with mean scores of 4.34 and 4.03, respectively. These conditions help reduce the losses of perishable fruit and vegetables. The use of special handling and storage methods had mean values of 3.52 and 3.49, respectively, which indicates that both measures are still important but not as critical as temperature and humidity control.
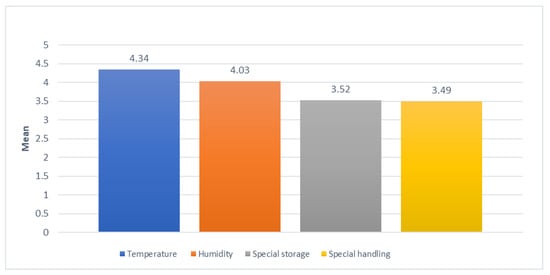
Figure 3.
The methods and technologies employed by participants to maintain freshness of their products on their premises in Australia.
Other practices that participants were asked about were the level of technology applied in their transport fleet. Participants were asked to indicate the type of vehicles they used in transporting the products. The results presented in Figure 4 shows that 80.95% of the participants use refrigerated trucks or vans to transport fresh products, while only 19% still use normal trucks at their firms. It is clear that mostly the small farms still use normal trucks to transport products, whereas all the medium and large firms use refrigerated trucks. Poor transportation infrastructure and unsuitable vehicles lead to degraded or spoiled food when moving products from one place to another, especially considering that many fruit and vegetables can easily perish in hot weather in subtropical climates such as in Queensland [38]. Thus, an effective supply chain for FV products requires a cold chain, such as refrigerated vehicles to maintain product freshness during transport.
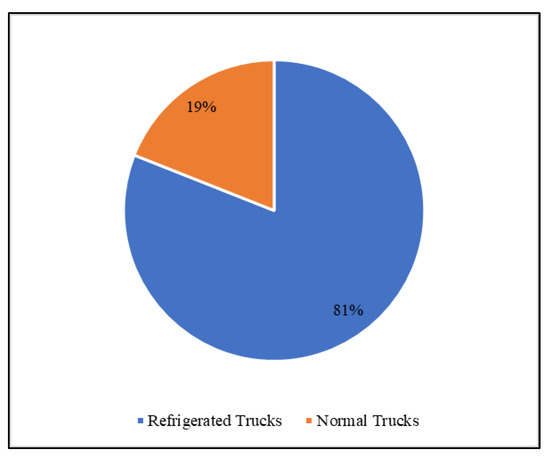
Figure 4.
Type of transportation infrastructure for FV in Australia.
In the questionnaire, participants were asked to indicate the most applicable cooling technology they used. The most common technologies used for storing products for longer times were regular atmosphere (RA), controlled atmosphere (CA), and smart fresh controlled atmosphere (SFCA). RA refers to systems where only temperature and humidity are controlled to store fresh produce, which usually keeps products fresh for several weeks [39]. In CA, concentrations of oxygen, carbon dioxide, and nitrogen, as well as the temperature and humidity, are regulated, which can keep products fresh up to one year [40]. SFCA is a special type of CA technology in which fruit and vegetables are treated in a ‘smart-fresh’ environment, that contains 1-Methylcyclopropene (1-MCP), which has a similar structure to ethylene and is used as an inhibitor to block or impede the effects of ethylene, a natural compound that is involved in fruit ripening [40,41].
In the bar graph below (Figure 5), the results reveal that the regular atmosphere cooling technique is most commonly used with the highest mean score of 4.18, followed by the controlled atmosphere (3.93), and the lowest mean score for the smart fresh technique (2.91).
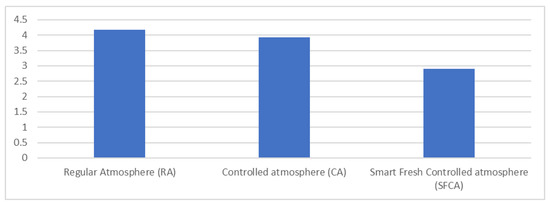
Figure 5.
Application of cooling storage technologies applied by participants at their premises.
The extensive use of RA is due to its low operational cost and ability to keep products fresh for a reasonable time [42]. CA is also applied frequently as it maintains the produce fresh for longer periods up to 1 year. The results also show that SFCA is not commonly applied. One reason is that it is relatively expensive to implement and maintain SFCA, making it less accessible to smaller-scale growers and producers. Additionally, it requires specialized equipment and technical expertise to properly monitor and regulate the atmosphere in storage facilities [40].
The results were further analysed to determine which stakeholders used what technology. As can be seen in Figure 6, growers and distributors mostly apply RA and CA almost equally. The farmers’ and distributors’ priorities are to meet the varying demand of the season and, therefore, want to ensure the supply is available within the season. The use of both RA and CA technologies allows managers to meet the demand at the required time with a high-quality product. Retailers and local markets are the window of fresh produce for the final customer, and the main goal of retailers is to satisfy the customer and meet their needs. Usually, retailers present their fresh produce on open shelves under a controlled environment, thus the application of CA and SFCA is limited for retailers when meeting the demand day by day to maintain the freshness of FV. The application of SFCA is very limited among retailers, and not even used at local markets, as SFCA is not necessary for the retailer to satisfy their needs. For example, keeping the product for up to one year is not required at markets. Moreover, it is very costly technology. Most of the retailers have pre-contracts with the distributor or farmer for delivery on weekly basis to satisfy the demand as needed.
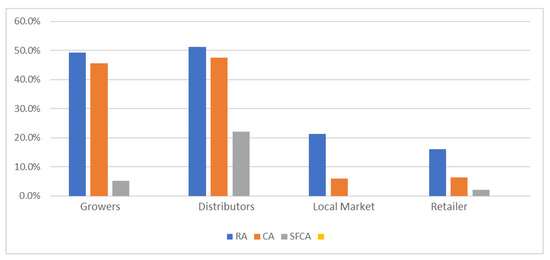
Figure 6.
Application of storage technology used by participants in the Australian supply FFSC.
9. Stages of Food Loss
Food loss is a significant issue that occurs at various stages of the food supply chain, from production to consumption. To address this issue, it is crucial to identify the specific areas where food loss is most prevalent. One way to do this is through surveys or questionnaires that ask respondents to rate the likelihood of food loss occurring at different stages of the supply chain.
The Likert scale is a commonly used rating scale that allows respondents to express their agreement or disagreement with a statement. In this case, respondents were asked to rate their agreement with the statement that food loss occurs at different stages of the supply chain. The scale ranged from 1 (for strong disagreement) to 5 (for strong agreement).
As can be seen from the data presented in Table 2, the highest occurrence of food loss in the supply chain occurs during the process of picking produce for sorting and packaging. The next two most significant stages of food loss were identified by the respondents as occurring at the farm and during grading, both scoring 3.83. These three stages had the highest mean scores, with a mere 0.01 difference, suggesting that all three areas are equally important for addressing food losses. Notably, the most significant losses occurred during the harvest stage, particularly in the field during the picking of fresh fruits or vegetables, with a mean score of 3.84. This was attributed to various factors, such as workers’ lack of knowledge of the products being picked and the availability of suitable tools. Furthermore, the timing of the picking was deemed critical as it varies from product to product [8,29,43]. For example, fruits in the berries family should be picked in the early morning while the fruit is still cool and easy to harvest without bruising. These picking practices are some of the factors that lead to food losses which are further discussed in later sections.
Table 2.
Stages at which food losses occur in the supply chain in Australia.
The study employed factor analysis to determine the importance of the items in the ‘stages of food loss in the supply chain’ category. In the factor analysis, as presented in Table 3, a two-factor solution was extracted. These two factors accounted for a total of 79.07% of the total variance. To verify the validity of the factor analysis, both the Kaiser–Meyer–Olkin (KMO) test and Barlette’s test were conducted. The KMO value of 0.8 indicates that the sample size is sufficient and at a reasonable level, and the Barlette’s test of sphericity was significant (x2 = 420.391, and ρ < 0.01).
Table 3.
Factor analysis for the stages of food loss in Australian fresh food supply chain.
Based on the rotated components matrix in Table 3, the eight items related to the stages when losses occurred were grouped into two main variables: harvest level and post-harvest level. These two variables were further categorized into sub-stages, as presented in Table 3. Losses at the harvest level were primarily associated with losses in the field, either left on trees or while picking the fruit or vegetables. The trimming, cleaning, and grading stages also belong to the harvest level where most loss occurs. The other level resulting from the factor analysis is the post-harvest level, which includes the stages of packing, storing, transporting, and leftovers either at the farm warehouses or at distributor and retailer storages.
10. Factors Leading to Food Loss
Many factors cause the loss of foods, and these factors include the weather before harvesting, the practices following harvesting, the duration from harvesting to storage, the control variables of the warehouse or storage area, the food handling practices, the standards of quality and regulation, the technology which is used while storing the food in the warehouse, the food packaging practices, and pests and diseases. There are also some additional factors, including insufficient facilities, lack of storage capacity of the warehouse in which the food is stored, lack of transportation infrastructure for delivering the food to retailers or wholesalers and the lack of knowledge of the demand in the market. Based on the mean values of the factors (Table 4), it can be seen that the pre-harvest weather condition is the top-ranked factor causing the food losses. This is an interesting finding as it has never reported before as the main factor of food loss.
Table 4.
Factors leading to food loss in Australia.
In further analysis, a factor analysis was performed. The respondents were asked to provide their agreement to the 12 factors listed in Table 5, and with factor analysis, these items were grouped into only two factors. The KMO test had a very good value of 0.8, and the Barlette’s test was found to be significant with X2 = 544.18 and ρ = 0.01. Out of 12 factors, 7 factors were grouped together (component 1), and the other 5 factors were grouped together into component 2. The pre-harvest condition factor was found to be the most important factor with the highest mean. The items grouped under this ‘pre-harvest condition’ are mostly related to the losses at the farm. This implies that more attention is required at the farmer level to avoid food losses by modifying pre-harvest practices, and selecting the appropriate time to harvest fresh produce based on the nature of the product and the environmental conditions on harvest day. In Table 5, all the factors under component 1 can be related to inefficient infrastructures, lack of knowledge regarding the market demand, and the strict regulations for fresh produce specified at the retailer level. These factors are mostly related to the distributors and retailers, while the factors in component 2 are mostly related to the farm stage.
Table 5.
Factor analysis, rotated component matrix for causes of food losses in Australia.
The results from Table 3 and Table 5 are linked to each other. Most of the factors related to food loss in component 1 are at the post-harvest level, while the component 2 is mostly related to practices and factors at the harvest or farm level.
In addition to the factors above, the respondents were asked to rank some practices that contribute to food loss. These included (1) transporting the products together in a truck to save transportation costs, (2) storing multiple products in the same room, and (3) the method of packing. The majority of the respondents somewhat agreed with these factors. When examining the ranking of the means in Table 6, it can be seen that the practice causing the most loss is the method of packaging the food, with a mean of 3.79, while storing and transporting multiple products together had very similar means of 3.69 and 3.68, respectively. These findings demonstrate the substantial contribution of these practices to food losses and the agreement of respondents regarding their impact.
Table 6.
Practices applied at FFSC causing food losses in Australia.
Different methods are used by stakeholders for food loss reduction. The respondents were asked to select and rank five such methods in the questionnaire. The methods are (1) engaging trained workers in the field for harvesting and handling the produce, (2) revising regulations and standards on visual appearance, (3) improving storage facilities and technology used for cooling, (4) improving vehicles and engaging trained drivers, and (5) promoting more farmers’ markets. The participants were also given the option to add other practices.
By adopting these methods, there is a higher chance that companies will be able to reduce the loss of food in future. The mean ranking presented in Figure 7 shows that the method which is considered most effective for reducing food loss is engaging trained workers in the field for the harvesting and handling of products (3.75), followed by revising the regulations on visual appearance (3.71). The least preferred method was to promote more farmers into the market and selling directly from farmer site (3.42). One respondent suggested another method: modifying the pre-harvest practices to reduce the possibility of food loss at farms.
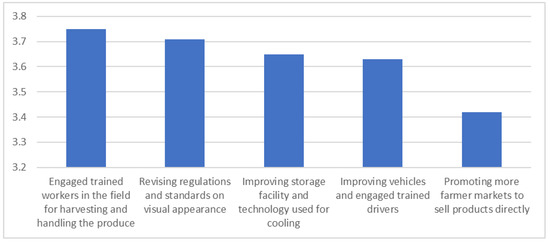
Figure 7.
The strategies employed by Australian companies to mitigate food losses.
The respondents were asked to rate the methods of disposal of food once losses occurred on a Likert scale ranging from 1 for strong agreement to 5 for strong disagreement. Six methods of disposal are mostly used to dispose unsold or lost food, namely, feeding to animals, composting, donating to charity if it is in reasonable condition, dumping if the food is expired or not suitable for consumption, sale in the local market in bulk without wrapping or packaging, and using it for making other products. Table 7 presents the participants’ responses. It was found that the method considered most suitable for disposing unsold and lost food is feeding to animals as it ranked 1 with the highest mean score (3.73). This was followed by composting and donating with almost the same mean scores (3.57, 3.56). On the other hand, using the unsold produce in other products received the lowest mean score (3.23).
Table 7.
The techniques utilized for the disposal of wasted food in Australia.
11. Discussion
The fresh food industry, including fruit and vegetables, is a rapidly growing and emerging sector globally. This study aims to identify the underlying causes of food losses and factors contributing to waste in the fresh food supply chain (FFSC) in Australia. The current level of food waste is a major challenge to food safety and security, exacerbating the issue of global food scarcity. According to the National Food Waste Strategy Feasibility Study conducted by FIAL [44], food waste is a significant issue in Australia, with an estimated 7.6 million tonnes of food wasted annually, costing the economy approximately AUD 36.6 billion. This translates to 312 kg per person, which is equivalent to one in five bags of groceries or AUD 2000 to AUD 2500 per household each year. Additionally, food waste contributes to approximately 3% of Australia’s yearly greenhouse gas emissions. Furthermore, Australia utilizes 2600 gigalitres of water to grow food that is ultimately wasted, which is five times the water volume in Sydney harbour. The land used to produce wasted food exceeds 25 million hectares, a land area larger than the state of Victoria.
In the post-pandemic period, food prices have risen sharply worldwide, further exacerbating food insecurity. A significant proportion of people in developing and developed countries are struggling to access basic food due to high prices. A well-designed, effective, and efficient fresh food supply chain is crucial to reducing waste and feeding vulnerable populations, as well as improving the livelihoods and revenues of farmers. The findings of this study reveal that the application of storing and cooling technologies in the FFSC is limited, which is a key factor contributing to fresh food losses. These results are consistent with the research conducted by Magalhães et al. [45], in which the authors found that the fresh food supply chain network is in its early stages, and the lack of technological application in this field has exacerbated the challenges faced by countries in providing for their growing populations.
The current study investigated the root causes of food loss in the fresh food supply chain (FFSC) in Australia. The study examined several factors that contribute to food waste, including pre-harvest weather conditions, harvesting practices, handling practices, quality standards and regulations, packing practices, trimming and cleaning, grading, lack of storage capacity/warehouses, lack of transportation infrastructure, and lack of knowledge about the market demand. The results showed that the use of a combination of normal and refrigerated trucks for food transportation is common practice among companies in the FFSC, which could be a cause of food waste as normal refrigerators can reduce the postharvest life of fresh foods. This finding is supported by Surucu-Balci and Tuna. [46], who noted that effective transport refrigeration plays a vital role in minimizing food loss during transportation.
The study’s results suggest that a lack of appropriate storage and handling technologies and practices contribute to food waste and losses in the FFSC. This study’s findings have significant implications for policymakers and companies involved in the food supply chain, as they can use this information to develop and implement strategies aimed at reducing food waste and losses, improving food safety and security, and improving the livelihood and revenues of farmers.
The present study reveals that the effective methods for managing unsold food used by Australian companies include composting, donating, dumping, or selling it to local markets. Moreover, the study identified several strategies to minimize food loss, such as employing trained workers for harvesting and handling, promoting farmers’ markets for direct selling, and improving storage facilities and cooling technology. These findings are in line with previous research conducted in other countries by Porter et al. [47], Raut et al. [48]) and Messner [49]), which emphasized the significance of improving supply chain efficiency and investing in food processing units and cold chain infrastructure to enhance the agricultural sector’s situation, increase farmers’ income, and boost the food economy.
The literature has highlighted the various factors contributing to food loss that occur at each stage of the supply chain. Notably, in developed countries, food waste is most prevalent during the consumption stage, accounting for over 40% of the total waste throughout the chain, primarily due to “consumer behavior”. Additionally, declining quality resulting from different factors is also a significant contributor to food loss. For instance, de Souza et al. [50] suggested the importance of circular economy principles and innovative marketing strategies to mitigate food waste and emphasized the challenges in perishable food supply chains for sustainability management from a developing economy perspective. Moreover, Gustavo et al. [51] proposed conventional and digitized marketing alternatives in supermarkets to reduce waste. These studies suggest that adopting sustainable and innovative approaches can help to reduce food loss and improve supply chain efficiency.
The proper timing of harvest in fresh produce production is a critical decision, as harvesting at the wrong maturity level can cause a greater loss of product quality compared with products harvested at the appropriate maturity level. Furthermore, careless handling of fresh produce can also contribute to food loss, as some products may become damaged, crushed, or bruised. The distance between farms and storage warehouses can also contribute to quality decline, as fresh produce may be kept in trucks for a long time or exposed to the sun in the field, leading to quality degradation.
According to Kader et al. [52], some farmers may lack knowledge of the biological and environmental factors that contribute to food waste. Moreover, food safety scares, which can result in fresh produce being left unharvested, are an unusual factor that contributes to food waste, as identified by Gunders and Bloom [53]. For instance, in 2008, a warning by the U.S. Food and Drug Administration about Salmonella contamination led to a decrease in demand for tomatoes, resulting in 32% of tomatoes being lost as they were at risk of contamination. This warning resulted in a decreased demand for tomatoes, and therefore, not all tomatoes needed to be harvested to meet the reduced demand.
These findings are consistent with previous research conducted by Sargent et al. [54], which suggested that the timing of harvesting fresh produce is a crucial decision in the production process. Furthermore, careless handling of fresh produce and the distance between farms and storage warehouses can cause a decline in quality, leading to food loss. Thus, effective interventions are required to reduce food loss and waste in the Australian fresh produce supply chain.
The transportation stage is a critical component in the supply chain of fresh produce, and it involves several stages before the end consumer can access the product. The distance between these stages, coupled with different transportation times, can lead to challenges that contribute to food loss. Sargent et al. [54] reported that mishandling during transportation can cause damage to the fresh produce, reduce its quality, and lead to spoilage. Maintaining the appropriate temperature during transportation is also crucial, as failure to keep it at optimal levels can lead to a decline in quality. Refrigeration equipment and cooling systems must be in good condition to maintain the product’s temperature stability during transportation. Mahajan et al. [55] also established that transportation-related handling, inadequate refrigeration, and delays in cooling are the most common factors contributing to waste at this stage.
At the farm level, waste can occur when edible parts of the fresh produce are accidentally removed during trimming. Overproduction is also a significant factor that contributes to waste, as farmers sometimes produce more than required, leading to waste before products enter the processing stage. This happens because the size, shape, and freshness of the product may not meet the standards set by the retailers and manufacturers. Such cosmetic specifications and constraints are imposed by the processor and retailer, and if the farmer’s product does not meet them, the fresh product is rejected and wasted.
Lebersorger and Schneider [56] found that confusion regarding the date labelled on the product, damaged packaging, breakage, and apparent flaws of the product are other factors that lead to food waste. Consumers may not be interested in purchasing these products, leading to an increased waste rate. Respondents suggested that food loss and waste also stem from an unbalanced relationship between supply and demand, resulting in oversupply driven by overproduction. They further suggested that changing the political economy of the food system and adapting the supply to demand would reduce potential food loss. Furthermore, respondents highlighted that most farmers and transport companies have the requisite knowledge to handle fresh produce for maximum shelf life, and it is the large chain stores that need to improve their staff’s knowledge of how to handle fresh fruit and vegetables.
In summary, fresh produce passes through several stages in the supply chain, and transportation is an integral part of the process. Careful handling and appropriate storage during transportation are critical to maintain the quality of the product. At the farm level, waste can occur due to unintentional removal of edible parts and overproduction of fresh produce that does not meet the cosmetic specifications and constraints set by the retailers and manufacturers. Consumers’ preferences and market demands can also contribute to food waste. Addressing these factors will require a comprehensive approach that involves all actors in the food supply chain.
In recent years, there has been growing concern about the lack of understanding among consumers and retail workers regarding the various date labels present on fresh produce and other food products. The confusion surrounding labels such as “best before”, “best”, and “sell by” can lead consumers to believe that a product is no longer safe to consume, resulting in the avoidance of purchase altogether. Consequently, these products may remain on retailer’s shelves and eventually go to waste. Lebersorger and Schneider [56] identified additional factors that contribute to food waste, including damaged packaging, product flaws, and missing components. These issues can also discourage consumers from purchasing the product, exacerbating the waste rate.
To address this issue, education on the significance of the different date labels is crucial to reducing food waste. Providing clear guidelines on when a product is no longer consumable can help consumers make informed decisions about their purchases. Further measures, such as improving packaging and product quality, can prevent waste and increase consumer confidence in purchasing items.
Therefore, effective measures to educate consumers and retail workers about the different date labels, coupled with improvements in product quality and packaging, are key to reducing food waste and promoting sustainability in the food industry.
12. Conclusions
The objective of the current study is to examine the primary factors contributing to losses and waste in the fresh food supply chain, and to suggest potential solutions for addressing these issues in various situations across Australia. The findings of this study have significant implications for industry practitioners, highlighting the importance of a comprehensive understanding of the problem of food loss, as managerial attitudes and behaviors can have significant impacts on mitigating these losses [57].
This study provides a comprehensive overview of the complexities and difficulties associated with food loss and its causes. The first key implication for managers is the importance of strict internal quality standards, which can result in food loss at various stages of the fresh food supply chain. Therefore, management must implement measures to reduce the unnecessary waste generated by quality-related processes. Moreover, the study offers valuable insights for farmers, cold storage providers, transporters, commission agents, local traders, and other stakeholders involved in the fresh food supply chain, enabling them to identify and map the factors that contribute to losses and wastage and to implement appropriate measures to mitigate the risk of waste and losses. In conclusion, the study highlights the significance of a collaborative approach to reduce food waste, with all stakeholders working together to develop and implement effective strategies for minimizing waste throughout the supply chain.
Author Contributions
Conceptualization, R.A.S.A. and A.K.; methodology, R.A.S.A. and A.K.; validation, R.A.S.A. and A.K.; investigation, R.A.S.A.; resources, A.K.; writing—original draft preparation, R.A.S.A.; writing—review and editing, R.A.S.A., A.K. and P.Y.; supervision, A.K. and P.Y.; project administration, A.K. and P.Y. All authors have read and agreed to the published version of the manuscript.
Funding
This research received no external funding.
Data Availability Statement
Data used in this paper can be obtained by emailing the corresponding author.
Conflicts of Interest
The authors have no conflict of interest.
References
- Gerland, P.; Raftery, A.E.; Ševčíková, H.; Li, N.; Gu, D.; Spoorenberg, T.; Alkema, L.; Fosdick, B.K.; Chunn, J.; Lalic, N.; et al. World population stabilization unlikely this century. Science 2014, 346, 234–237. [Google Scholar] [CrossRef]
- Bräutigam, K.-R.; Jörissen, J.; Priefer, C. The extent of food waste generation across EU-27: Different calculation methods and the reliability of their results. Waste Manag. Res. 2014, 32, 683–694. [Google Scholar] [CrossRef]
- Roels, K.; Vangeyte, J.; Linden, V.V.; Gijseghem, D.V. Food losses in primary production: The case of Flanders. In Proceedings of the CIGR-Ag. Eng. 2012: International Conference on Agricultural Engineering, Valencia, Spain, 8–12 July 2012. [Google Scholar]
- Schulte-Uebbing, L.F.; Ros, G.H.; de Vries, W. Experimental evidence shows minor contribution of nitrogen deposition to global forest carbon sequestration. Glob. Chang. Biol. 2021, 28, 899–917. [Google Scholar] [CrossRef] [PubMed]
- Papargyropoulou, E.; Lozano, R.; Steinberger, J.K.; Wright, N.; bin Ujang, Z. The food waste hierarchy as a framework for the management of food surplus and food waste. J. Clean. Prod. 2014, 76, 106–115. [Google Scholar] [CrossRef]
- Ahumada, O.; Villalobos, J.R. Operational model for planning the harvest and distribution of perishable agricultural products. Int. J. Prod. Econ. 2011, 133, 677–687. [Google Scholar] [CrossRef]
- Gokarn, S.; Kuthambalayan, T.S. Creating sustainable fresh produce supply chains by managing uncertainties. J. Clean. Prod. 2018, 207, 908–919. [Google Scholar] [CrossRef]
- Mena, C.; Adenso-Diaz, B.; Yurt, O. The causes of food waste in the supplier–retailer interface: Evidences from the UK and Spain. Resour. Conserv. Recycl. 2011, 55, 648–658. [Google Scholar] [CrossRef]
- UN General Assembly (UNGA). A/RES/70/1Transforming our world: The 2030 Agenda for Sustainable Development. Resolut 25, 1–35. 2015. Available online: https://sustainabledevelopment.un.org/post2015/transformingourworld/publication (accessed on 6 April 2023).
- Nahman, A.; de Lange, W. Costs of food waste along the value chain: Evidence from South Africa. Waste Manag. 2013, 33, 2493–2500. [Google Scholar] [CrossRef]
- Van der Werf, P.; Gilliland, J.A. A systematic review of food losses and food waste generation in developed countries. In Proceedings of the Institution of Civil Engineers-Waste and Resource Management; Thomas Telford Ltd.: London, UK, 2017. [Google Scholar]
- Xue, L.; Liu, G.; Parfitt, J.; Liu, X.; Van Herpen, E.; Stenmarck, Å.; O’Connor, C.; Östergren, K.; Cheng, S. Missing Food, Missing Data? A Critical Review of Global Food Losses and Food Waste Data. Environ. Sci. Technol. 2017, 51, 6618–6633. [Google Scholar] [CrossRef]
- Li, C.; Bremer, P.; Harder, M.K.; Lee, M.S.; Parker, K.; Gaugler, E.C.; Mirosa, M. A systematic review of food loss and waste in China: Quantity, impacts and mediators. J. Environ. Manag. 2021, 303, 114092. [Google Scholar] [CrossRef]
- Losses, F.G.F.; Waste, F. Extent, Causes and Prevention; Food and Agriculture Organization of the United Nations: Rome, Italy, 2011. [Google Scholar]
- Parfitt, J.; Barthel, M.; Macnaughton, S. Food waste within food supply chains: Quantification and potential for change to 2050. Philos. Trans. R. Soc. B Biol. Sci. 2010, 365, 3065–3081. [Google Scholar] [CrossRef]
- Hodges, R.J.; Buzby, J.C.; Bennett, B. Postharvest losses and waste in developed and less developed countries: Opportunities to improve resource use. J. Agric. Sci. 2010, 149, 37–45. [Google Scholar] [CrossRef]
- Kaipia, R.; Dukovska-Popovska, I.; Loikkanen, L. Creating sustainable fresh food supply chains through waste reduction. Int. J. Phys. Distrib. Logist. Manag. 2013, 43, 262–276. [Google Scholar] [CrossRef]
- DAFF-Snapshot of Australian Agriculture 2023. Available online: https://www.agriculture.gov.au/abares/products/insights/snapshot-of-australian-agriculture (accessed on 21 January 2023).
- DAFF. Australian Food Statistics. Available online: https://www.agriculture.gov.au/agriculture-land/farm-food-drought/food/publications/afs (accessed on 21 January 2023).
- DCCEEW. Tackling Australia’s Food Waste. Available online: https://www.dcceew.gov.au/environment/protection/waste/food-waste (accessed on 22 January 2023).
- FIAL. National Food Waste Strategy Feasibility Study. Available online: https://www.fial.com.au/ (accessed on 22 January 2023).
- Schneider, F. Review of food waste prevention on an international level. In Proceedings of the Institution of Civil Engineers-Waste and Resource Management; ICE Publishing: London, UK, 2013. [Google Scholar]
- Hamilton, C.; Denniss, R.; Baker, D.G. Wasteful Consumption in Australia; Australia Institute Canberra: Canberra, Australia, 2005. [Google Scholar]
- Baker, D.; Fear, J.; Denniss, R. What a Waste–An Analysis of Household Expenditure on Food, Policy Brief No. 6; Australia Institute Canberra: Canberra, Australia, 2009. [Google Scholar]
- Mason, L.; Boyle, T.; Fyfe, J.; Smith, T.; Cordell, D. National Food Waste Assessment; Final Report; Institute for Sustainable Futures: Sydney, Australia, 2011; pp. 78–80. [Google Scholar]
- Ridoutt, B.; Juliano, P.; Sanguansri, P.; Sellahewa, J. The water footprint of food waste: Case study of fresh mango in Australia. J. Clean. Prod. 2010, 18, 1714–1721. [Google Scholar] [CrossRef]
- Bernstad, A.K.; Cánovas, A.; Valle, R. Consideration of food wastage along the supply chain in lifecycle assessments: A mini-review based on the case of tomatoes. Waste Manag. Res. J Sustain. Circ. Econ. 2016, 35, 29–39. [Google Scholar] [CrossRef]
- Gokarn, S.; Choudhary, A. Modeling the key factors influencing the reduction of food loss and waste in fresh produce supply chains. J. Environ. Manag. 2021, 294, 113063. [Google Scholar] [CrossRef] [PubMed]
- Magalhães, V.S.M.; Ferreira, L.M.D.F.; Silva, C. Causes of Food Loss and Waste: An Analysis along the Food Supply Chain; Industrial Engineering and Operations Management I: XXIV IJCIEOM: Lisbon, Portugal, 2019; pp. 173–182. [Google Scholar]
- Priefer, C.; Jörissen, J.; Bräutigam, K.-R. Food waste prevention in Europe—A cause-driven approach to identify the most relevant leverage points for action. Resour. Conserv. Recycl. 2016, 109, 155–165. [Google Scholar] [CrossRef]
- Griffith, G.; Rohr, S.; Mounter, S.; Fleming, E. Loss and Waste in the Australian Fresh Apple Value Chain. Proc. Food Syst. Dyn. 2020, 134–152. [Google Scholar] [CrossRef]
- Ghosh, P.R.; Fawcett, D.; Sharma, S.B.; Perera, D.; Poinern, G.E. Survey of food waste generated by Western Australian fruit and vegetable producers: Options for minimization and utilization. Food Public Health 2016, 6, 115–122. [Google Scholar]
- Kader, A.A. Increasing food availability by reducing postharvest losses of fresh produce. Acta Hortic. 2005, 682, 2169–2176. [Google Scholar] [CrossRef]
- Aaron, J.; Chew, T.-L. A guide to accurate reporting in digital image processing–can anyone reproduce your quantitative analysis? J. Cell Sci. 2021, 134, jcs254151. [Google Scholar] [CrossRef]
- Chen, X.; Sun, Y.; Zhang, T.; Shu, L.; Roepstorff, P.; Yang, F. Quantitative Proteomics Using Isobaric Labeling: A Practical Guide. Genom. Proteom. Bioinform. 2021, 19, 689–706. [Google Scholar] [CrossRef]
- Cronbach, L.J. Coefficient alpha and the internal structure of tests. Psychometrika 1951, 16, 297–334. [Google Scholar] [CrossRef]
- Aguilar-Fernández, M.E.; Otegi-Olaso, J.R. Firm Size and the Business Model for Sustainable Innovation. Sustainability 2018, 10, 4785. [Google Scholar] [CrossRef]
- Ishangulyyev, R.; Kim, S.; Lee, S.H. Understanding Food Loss and Waste—Why Are We Losing and Wasting Food? Foods 2019, 8, 297. [Google Scholar] [CrossRef] [PubMed]
- Veltman, R.; Verschoor, J.; Van Dugteren, J.R. Dynamic control system (DCS) for apples (Malus domestica Borkh. cv ‘Elstar’): Optimal quality through storage based on product response. Postharvest Biol. Technol. 2003, 27, 79–86. [Google Scholar] [CrossRef]
- Thompson, A.K.; Prange, R.K.; Bancroft, R.; Puttongsiri, T. Controlled Atmosphere Storage of Fruit and Vegetables; CABI: Wallingford, UK, 2018. [Google Scholar]
- Paam, P.; Berretta, R.; Heydar, M. An Integrated Loss-Based Optimization Model for Apple Supply Chain. In Operations Research Proceedings; Kliewer, N., Ehmke, J., Borndörfer, R., Eds.; Springer: Cham, Switzerland, 2017. [Google Scholar] [CrossRef]
- de Oliveira Anese, R.; Brackmann, A.; Wendt, L.M.; Thewes, F.R.; Schultz, E.E.; Ludwig, V.; Berghetti, M.R.P. Interaction of 1-methylcyclopropene, temperature and dynamic controlled atmosphere by respiratory quotient on ‘Galaxy’apples storage. Food Packag. Shelf Life 2019, 20, 100246. [Google Scholar] [CrossRef]
- Blanke, M. Challenges of Reducing Fresh Produce Waste in Europe—From Farm to Fork. Agriculture 2015, 5, 389–399. [Google Scholar] [CrossRef]
- FIAL. The National Food Waste Strategy Feasibility Study. Available online: https://www.fial.com.au/sharing-knowledge/food-waste (accessed on 23 January 2023).
- Magalhães, V.S.; Ferreira, L.M.D.; Silva, C. Using a methodological approach to model causes of food loss and waste in fruit and vegetable supply chains. J. Clean. Prod. 2020, 283, 124574. [Google Scholar] [CrossRef]
- Surucu-Balci, E.; Tuna, O. Investigating logistics-related food loss drivers: A study on fresh fruit and vegetable supply chain. J. Clean. Prod. 2021, 318, 128561. [Google Scholar] [CrossRef]
- Porter, S.D.; Reay, D.S.; Bomberg, E.; Higgins, P. Avoidable food losses and associated production-phase greenhouse gas emissions arising from application of cosmetic standards to fresh fruit and vegetables in Europe and the UK. J. Clean. Prod. 2018, 201, 869–878. [Google Scholar] [CrossRef]
- Raut, R.D.; Gardas, B.B.; Narwane, V.S.; Narkhede, B.E. Improvement in the food losses in fruits and vegetable supply chain—A perspective of cold third-party logistics approach. Oper. Res. Perspect. 2019, 6, 100117. [Google Scholar] [CrossRef]
- Messner, R.; Johnson, H.; Richards, C. From surplus-to-waste: A study of systemic overproduction, surplus and food waste in horticultural supply chains. J. Clean. Prod. 2020, 278, 123952. [Google Scholar] [CrossRef]
- de Souza, M.; Pereira, G.M.; de Sousa Jabbour, A.B.L.; Jabbour, C.J.C.; Trento, L.R.; Borchardt, M.; Zvirtes, L. A digitally enabled circular economy for mitigating food waste: Understanding innovative marketing strategies in the context of an emerging economy. Technol. Forecast. Soc. Chang. 2021, 173, 121062. [Google Scholar] [CrossRef]
- Gustavo, J.U., Jr.; Trento, L.R.; de Souza, M.; Pereira, G.M.; de Sousa Jabbour, A.B.L.; Ndubisi, N.O.; Jabbour, C.J.C.; Borchardt, M.; Zvirtes, L. Green marketing in supermarkets: Conventional and digitized marketing alternatives to reduce waste. J. Clean. Prod. 2021, 296, 126531. [Google Scholar] [CrossRef]
- Kader, A.A. Postharvest Technology of Horticultural Crops; University of California Agriculture and Natural Resources: Davis, CA, USA, 2002; Volume 3311. [Google Scholar]
- Natural Resource Defense Council. Wasted: How America is Losing Up to 40 Percent of Its Food from Farm to Fork to Landfill; Natural Resource Defense Council: New York, NY, USA, 2012; Available online: https://www.nrdc.org/sites/default/files/wasted-food-IP.pdf (accessed on 6 April 2023).
- Sargent, S.A.; Ritenour, M.A.; Brecht, J.K. Chapter 18: Handling, Cooling and Sanitation Techniques for Maintaining Postharvest Quality; University of Florida Cooperative Extension Service, Institute of Food and Agriculture Sciences: Gainesville, FL, USA, 2000. [Google Scholar]
- Mahajan, P.V.; Caleb, O.J.; Gil, M.I.; Izumi, H.; Colelli, G.; Watkins, C.B.; Zude, M. Quality and safety of fresh horticultural commodities: Recent advances and future perspectives. Food Packag. Shelf Life 2017, 14, 2–11. [Google Scholar] [CrossRef]
- Lebersorger, S.; Schneider, F. Food loss rates at the food retail, influencing factors and reasons as a basis for waste prevention measures. Waste Manag. 2014, 34, 1911–1919. [Google Scholar] [CrossRef]
- Onwude, D.I.; Chen, G.; Eke-Emezie, N.; Kabutey, A.; Khaled, A.Y.; Sturm, B. Recent Advances in Reducing Food Losses in the Supply Chain of Fresh Agricultural Produce. Processes 2020, 8, 1431. [Google Scholar] [CrossRef]


Disclaimer/Publisher’s Note: The statements, opinions and data contained in all publications are solely those of the individual author(s) and contributor(s) and not of MDPI and/or the editor(s). MDPI and/or the editor(s) disclaim responsibility for any injury to people or property resulting from any ideas, methods, instructions or products referred to in the content. |
© 2023 by the authors. Licensee MDPI, Basel, Switzerland. This article is an open access article distributed under the terms and conditions of the Creative Commons Attribution (CC BY) license (https://creativecommons.org/licenses/by/4.0/).