Article

Cogeneration of Fresh Water and Electricity with High-Temperature Power Cycles: Comparative Assessment of Multi-Effect Distillation and Reverse Osmosis

by
Patricia Palenzuela
1,2,*,
Diego-César Alarcón-Padilla
1,2,
Bartolomé Ortega-Delgado
1,2 and
Guillermo Zaragoza
1,2
1
CIEMAT—Plataforma Solar de Almería, Ctra. de Senés s/n, 04200 Almería, Spain
2
CIESOL Research Centre for Solar Energy, UAL-PSA, CIEMAT Joint Centre, Ctra. Sacramento s/n, 04120 Almería, Spain
*
Author to whom correspondence should be addressed.
Processes 2023, 11(4), 1181; https://doi.org/10.3390/pr11041181
Submission received: 22 February 2023 / Revised: 4 April 2023 / Accepted: 6 April 2023 / Published: 11 April 2023
(This article belongs to the Special Issue Latest Innovations in Seawater Desalination Processes)

Abstract

:
The pressing problems of water scarcity in many parts of the planet make water desalination one of the technological solutions for guaranteeing the fresh water supply. However, desalination processes require high energy consumption, mainly provided by fossil fuels. The integration of renewable energy sources into desalination processes is a promising option for decarbonizing the desalination sector. As most water-scarce regions with access to seawater frequently have high solar irradiation levels, it seems appropriate to exploit the sun to power the desalination process. This work presents the assessment of two integrated solar power and desalination systems regarding efficiency and water production. Two desalination processes (multi-effect distillation and reverse osmosis) are studied for potential coupling with the combined cycle of a central receiver solar plant to produce electricity and freshwater. In the case of the multi-effect distillation plant, it is integrated by replacing the Rankine cycle condenser of the combined cycle. In the case of the reverse osmosis plant, it is powered by the electricity generated from the combined cycle. For this comparison, the 21st of March has been considered as the design point and Almería (in the Southeast of Spain) as the plant location. The results show that the thermal cogeneration option renders a worse outcome (thermal efficiency of 50.2% for LT-MED case) than the decoupled generation of electricity and water (thermal efficiency of 53.3% for RO case), producing 18% less fresh water than the RO configuration (3831 m3/d vs. 4640 m3/d), due to the 6% penalty in the efficiency of the Rankine power cycle in the MED configuration as a result of increasing the condensation temperature from 42.6 °C to 70 °C.

1. Introduction

Seawater constitutes approximately 97.5% of the total water resources available on Earth. The remainder (i.e., 2.5% of the water) presents limited availability since about 80% of this water is ice in permanent glaciers [1]. Today, about 20% of the world’s population is experiencing water scarcity, which is becoming a major problem in water-stressed regions such as the Middle East and North Africa (MENA). The corresponding situation cannot be solved without developing future actions oriented toward a sustainable water supply [2]. On the other hand, the global distribution of freshwater is not uniform around the different parts of the world. The transportation of water from a water-rich area to a water-scarce region is not economically practical or sustainable to meet the requirements of all scenarios due to public and political pressures as well as technical issues. Therefore, new sources for obtaining potable water need to be developed. Seawater as a source is suitable for coastal areas, but it needs to be desalinated to get fresh water for human consumption and is associated with high energy consumption. The integration of renewable energy sources into the desalination process is required for decarbonizing the desalination sector [3]. As most water-scarce regions with access to seawater frequently have high solar irradiation levels, it seems appropriate to exploit the sun as a suitable renewable energy source to power the desalination process. This option is aligned with the EU’s commitment to global climate action under the Paris Agreement to be climate-neutral by 2050, thus an economy with net-zero greenhouse gas emissions [4,5]. Among solar technologies, Concentrating Solar Power (CSP), a dispatchable technology together with its ability to provide heat and electricity at once, seems to be the most promising to combine with desalination.
Parabolic trough (PT) and central receiver (CR) are the two dominant CSP technologies. Parabolic trough systems dominate the global market in CSP plants. However, the trend is drifting toward CR since this technology has a higher potential to reduce costs and increase efficiency [6]. Steam Rankine thermodynamic cycles coupled with PT technology reduce a CSP plant’s conversion efficiency when coupled with desalination [7,8,9,10,11,12,13,14,15], which makes the concept unviable in economic terms. There are some papers in the literature that evaluate the integration of desalination systems into CR power plants with Brayton cycles. Sharan et al. [16] analyzed the integration of a sCO2 solar tower plant and a MED desalination unit for the combined production of water and electricity. A new concept to store waste heat from the Brayton cycle in water tanks was introduced for increasing the water capacity factor up to 75%, achieving a reduction in water costs of 19%. They analyzed different locations for the plant and reported that in Yanbu (Saudi Arabia), using MED as the desalination system could produce 115 MWe and 4720 m3/d of distillate 16% cheaper than with RO, with a thermal efficiency of 48%. Maia et al. [17] analyzed the viability of a 10 MWe sCO2 solar tower power plant integrated with a MED desalination system in five different locations in Brazil. Results obtained showed that the most suitable locations in terms of performance and water production were those closest to the equator (lowest latitude) due to the lower variation in the annual solar irradiation, reaching a cycle thermal efficiency of 46.1%. Finally, Yuan et al. [18] performed an analysis of a CR solar power plant with sCO2 Brayton cycle and multi-effect distillation for the combined production of power and water. The exhaust gases of the Brayton cycle were used to drive the MED process, therefore no penalty was introduced into the power cycle. They obtained a solar thermal power efficiency of 24% and a water production of 459 m3/d with a MED of 5 effects.
MED desalination systems can be also coupled with CR solar power plants based on Rankine cycles. Related to this, Hoffmann & Dall [19] performed a techno-economic analysis of the integration of a MED into a 100 MWe CR power plant with Rankine cycle for the combined production of water and electricity in Namibia (Sub-Saharan Africa). The results were compared with the case of a RO connected to the grid at the coast and with a standalone CR dry-cooled power plant. The MED replaced the condenser of the Rankine power block, and different condensation temperatures were evaluated (60–75 °C). The penalization in the electricity production for condensing at 70 °C is 6%. The total annual profits equal those of the standalone CR plant for condensation temperature above 65 °C, thanks to the existing water tariffs (3.6 US $/m3) and feed-in tariffs (0.152 US $/kWh). Despite this, the CR+MED option was not competitive against a RO plant connected to the grid on the coast (LCOW of 1.783 US $/m3 vs. 2.646 US $/m3 of the CR+MED with condensation temperature of 75 °C). Wellmann et al. [20] presented an exergoeconomic assessment of a 12 MWe CR power plant with a Rankine cycle integrated and a desalination plant using a novel low-temperature distillation system in Egypt. The desalination unit combined the advantages of MSF and MED processes. Results obtained showed that the solar block destroyed 90% of the input exergy and the exergy efficiency reached 29%. The lowest LCOE obtained was 0.1971 $/kWh. Ouali et al. [21] performed a techno-economic evaluation of a CR power plant with a Rankine cycle integrated and a desalination unit based on membrane distillation technology. The evaluation was performed in six different coastal locations of the MENA region. Results showed that Egypt was the best location for the cogeneration plant, in terms of higher energy production, lower LCOE, lower water production costs and a higher capacity factor (67%). Frantz and Seifert [22] analyzed the coupling of a MED in a CR solar power plant with a Rankine cycle. Results showed that the distillate production could double if the heating steam temperature is increased from 65 to 90 °C but at the expense of decreasing the power production by 11%.
CR systems can achieve higher efficiencies when integrated into gas cycles (Brayton cycles), and these efficiencies can even be increased using combined cycles, reaching values of up to 50% [23]. The combined cycle consists of a gas cycle and a bottoming steam turbine cycle that can be either an organic Rankine cycle or a water Rankine cycle. In both cases, a heat recovery steam generator generates steam using the exhaust gases, leaving the gas turbine to drive the bottoming steam cycle. There are several papers dealing with the dual production of fresh water and electricity by integrating a desalination unit into a combined cycle. Eveloy et al. [24] evaluated the technical and economic feasibility of a gas turbine cycle thermally coupled with an organic Rankine cycle via an intermediate heat recovery unit that generated the mechanical power to drive a reverse osmosis (RO) high-pressure pump in the Arabian Gulf. The results showed that this combination was thermodynamically and economically feasible, considering the subsidized water prices. In addition, they found that the performance of the combined system was stable throughout the year despite the variation in ambient and seawater temperatures. Shaaban et al. [25] proposed the analysis and multiobjective optimization of the performance of a power and water cogeneration system consisting of the coupling of a multistage flash (MSF) distillation plant with an integrated solar combined cycle (ISCC). This combined cycle had a gas turbine engine with a multistage compressor intercooler, and the MSF unit was driven by the thermal energy recovered from this cooling stage. They concluded that the proposed cycle had good performance (thermal efficiency 62.8%) and significant improvements compared to the configuration without an intercooler compressor (the net output power was improved between 15% and 18.5%). Rensonnet et al. [26] carried out a thermo-economic analysis on the design and part load conditions of several dual-purpose configurations to evaluate their water and electricity costs. Among others, they considered a combined cycle with RO and a combined cycle with multi-effect distillation (MED). They found that the exergy cost of water produced with RO desalination technology was significantly lower than that produced in the MED configuration. Finally, Khademi et al. [27] presented a thermodynamic analysis and optimization of a combined CR solar power plant with sCO2 Brayton cycle, organic Rankine cycle and multi-effect distillation plant (no fossil backup). Maximum exergy efficiency of the integrated system of 61.78% was obtained, with a MED of 9 effects as the optimal value. Except for the last one, none of the papers based on combined cycles considers a solar power plant, but the power plant is a fossil-based conventional one in all cases. Also, the last one is a combined cycle with organic Rankine cycle that is not currently commercial. This paper considers the integration of two desalination systems into a central receiver CSP plant (CR-CSP) with a combined cycle consisting of a solar Brayton plus a Rankine steam cycle. The CR-CSP plant’s power block consists of a solar–hybrid gas turbine system. Two desalination plants have been considered to be integrated into the combined cycle: (1) a low-temperature multi-effect distillation (LT-MED) unit and (2) a reverse osmosis unit. In the case of the LT-MED plant, it is integrated by replacing the Rankine cycle condenser of the combined cycle. In the case of the reverse osmosis plant, it is powered by the electricity generated from the combined cycle. The analysis has been carried out in terms of energy efficiency and water production considering the 21st of March as the design point and Almería (in the Southeast of Spain) as the location. The results obtained can be the starting point to discard cogeneration systems that render worse outcomes in the South of Europe, and they are only valid for the particular conditions examined.

2. System Description

2.1. Central Receiver Solar

The central receiver solar plant (see Figure 1) consists of a solar–hybrid power system with direct solar heating. The solar field is composed of heliostats that direct the sunlight toward the receiver, which is cooled by compressed air. The heated air from the receiver is then transferred to a power block for generating electricity.
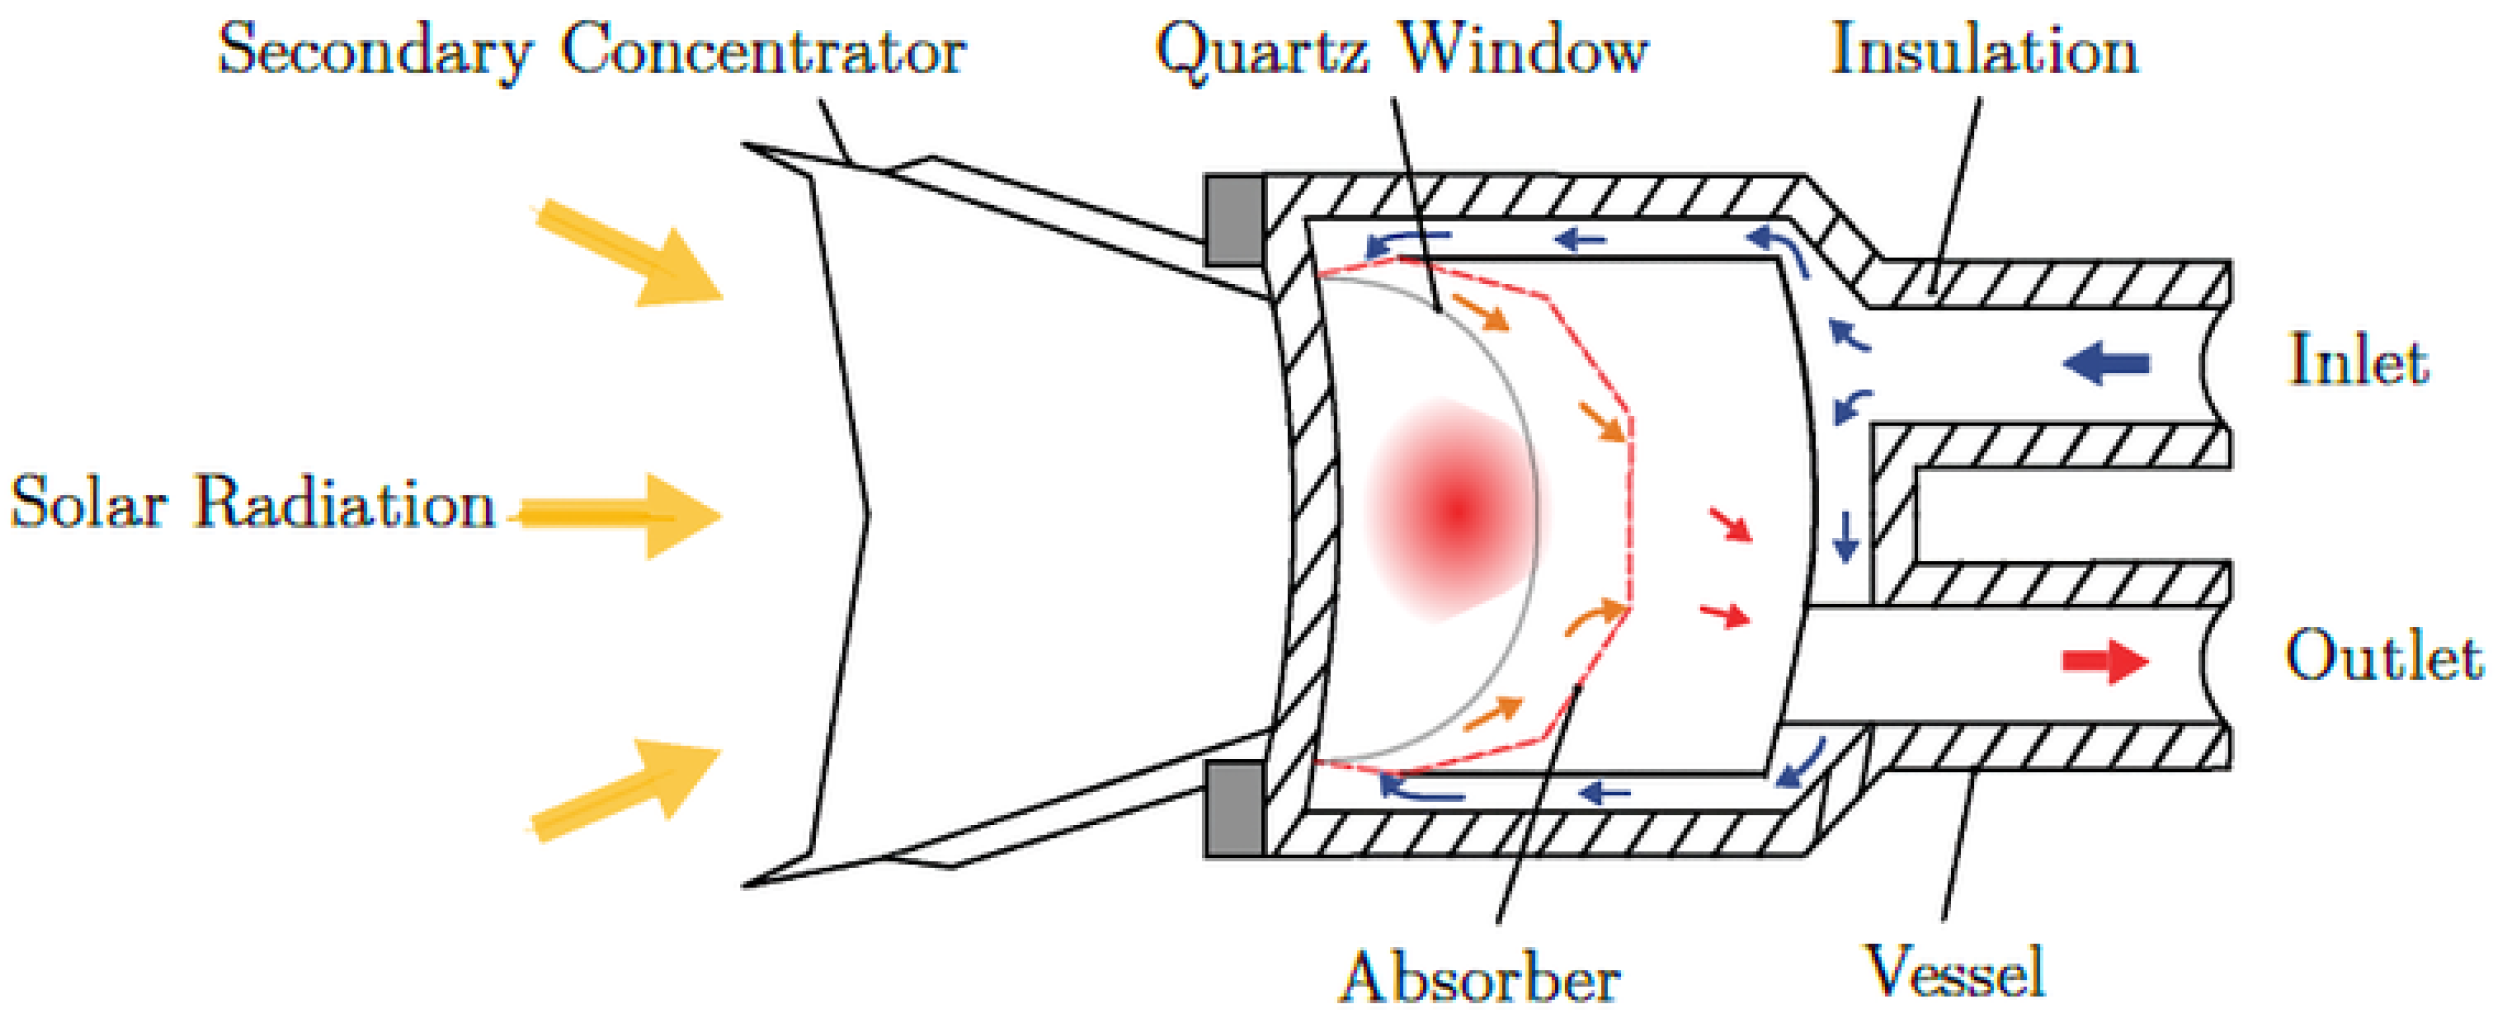
For the solar receiver (see Figure 2), the same characteristics as the receiver developed in the SOLGATE Project [28] at Plataforma Solar de Almería (PSA), in Spain, were selected. It consists of low-temperature, medium-temperature and high-temperature receiver modules, which are connected in series to increase the air temperature up to 1000 °C. The ceramic foam absorber receives concentrated solar radiation across a quartz window. The pressurized air collects the heat from the absorber, and then it is addressed to the power block. The quartz window enables high pressure and temperature, and an active window cooling system that blows cold air toward the window is integrated to avoid overheating of the quartz glass. All three modules are arranged in a honeycomb-like arrangement in the focal spot, with each module having a power level of about 400 kWth and a temperature increase of about 250 °C.
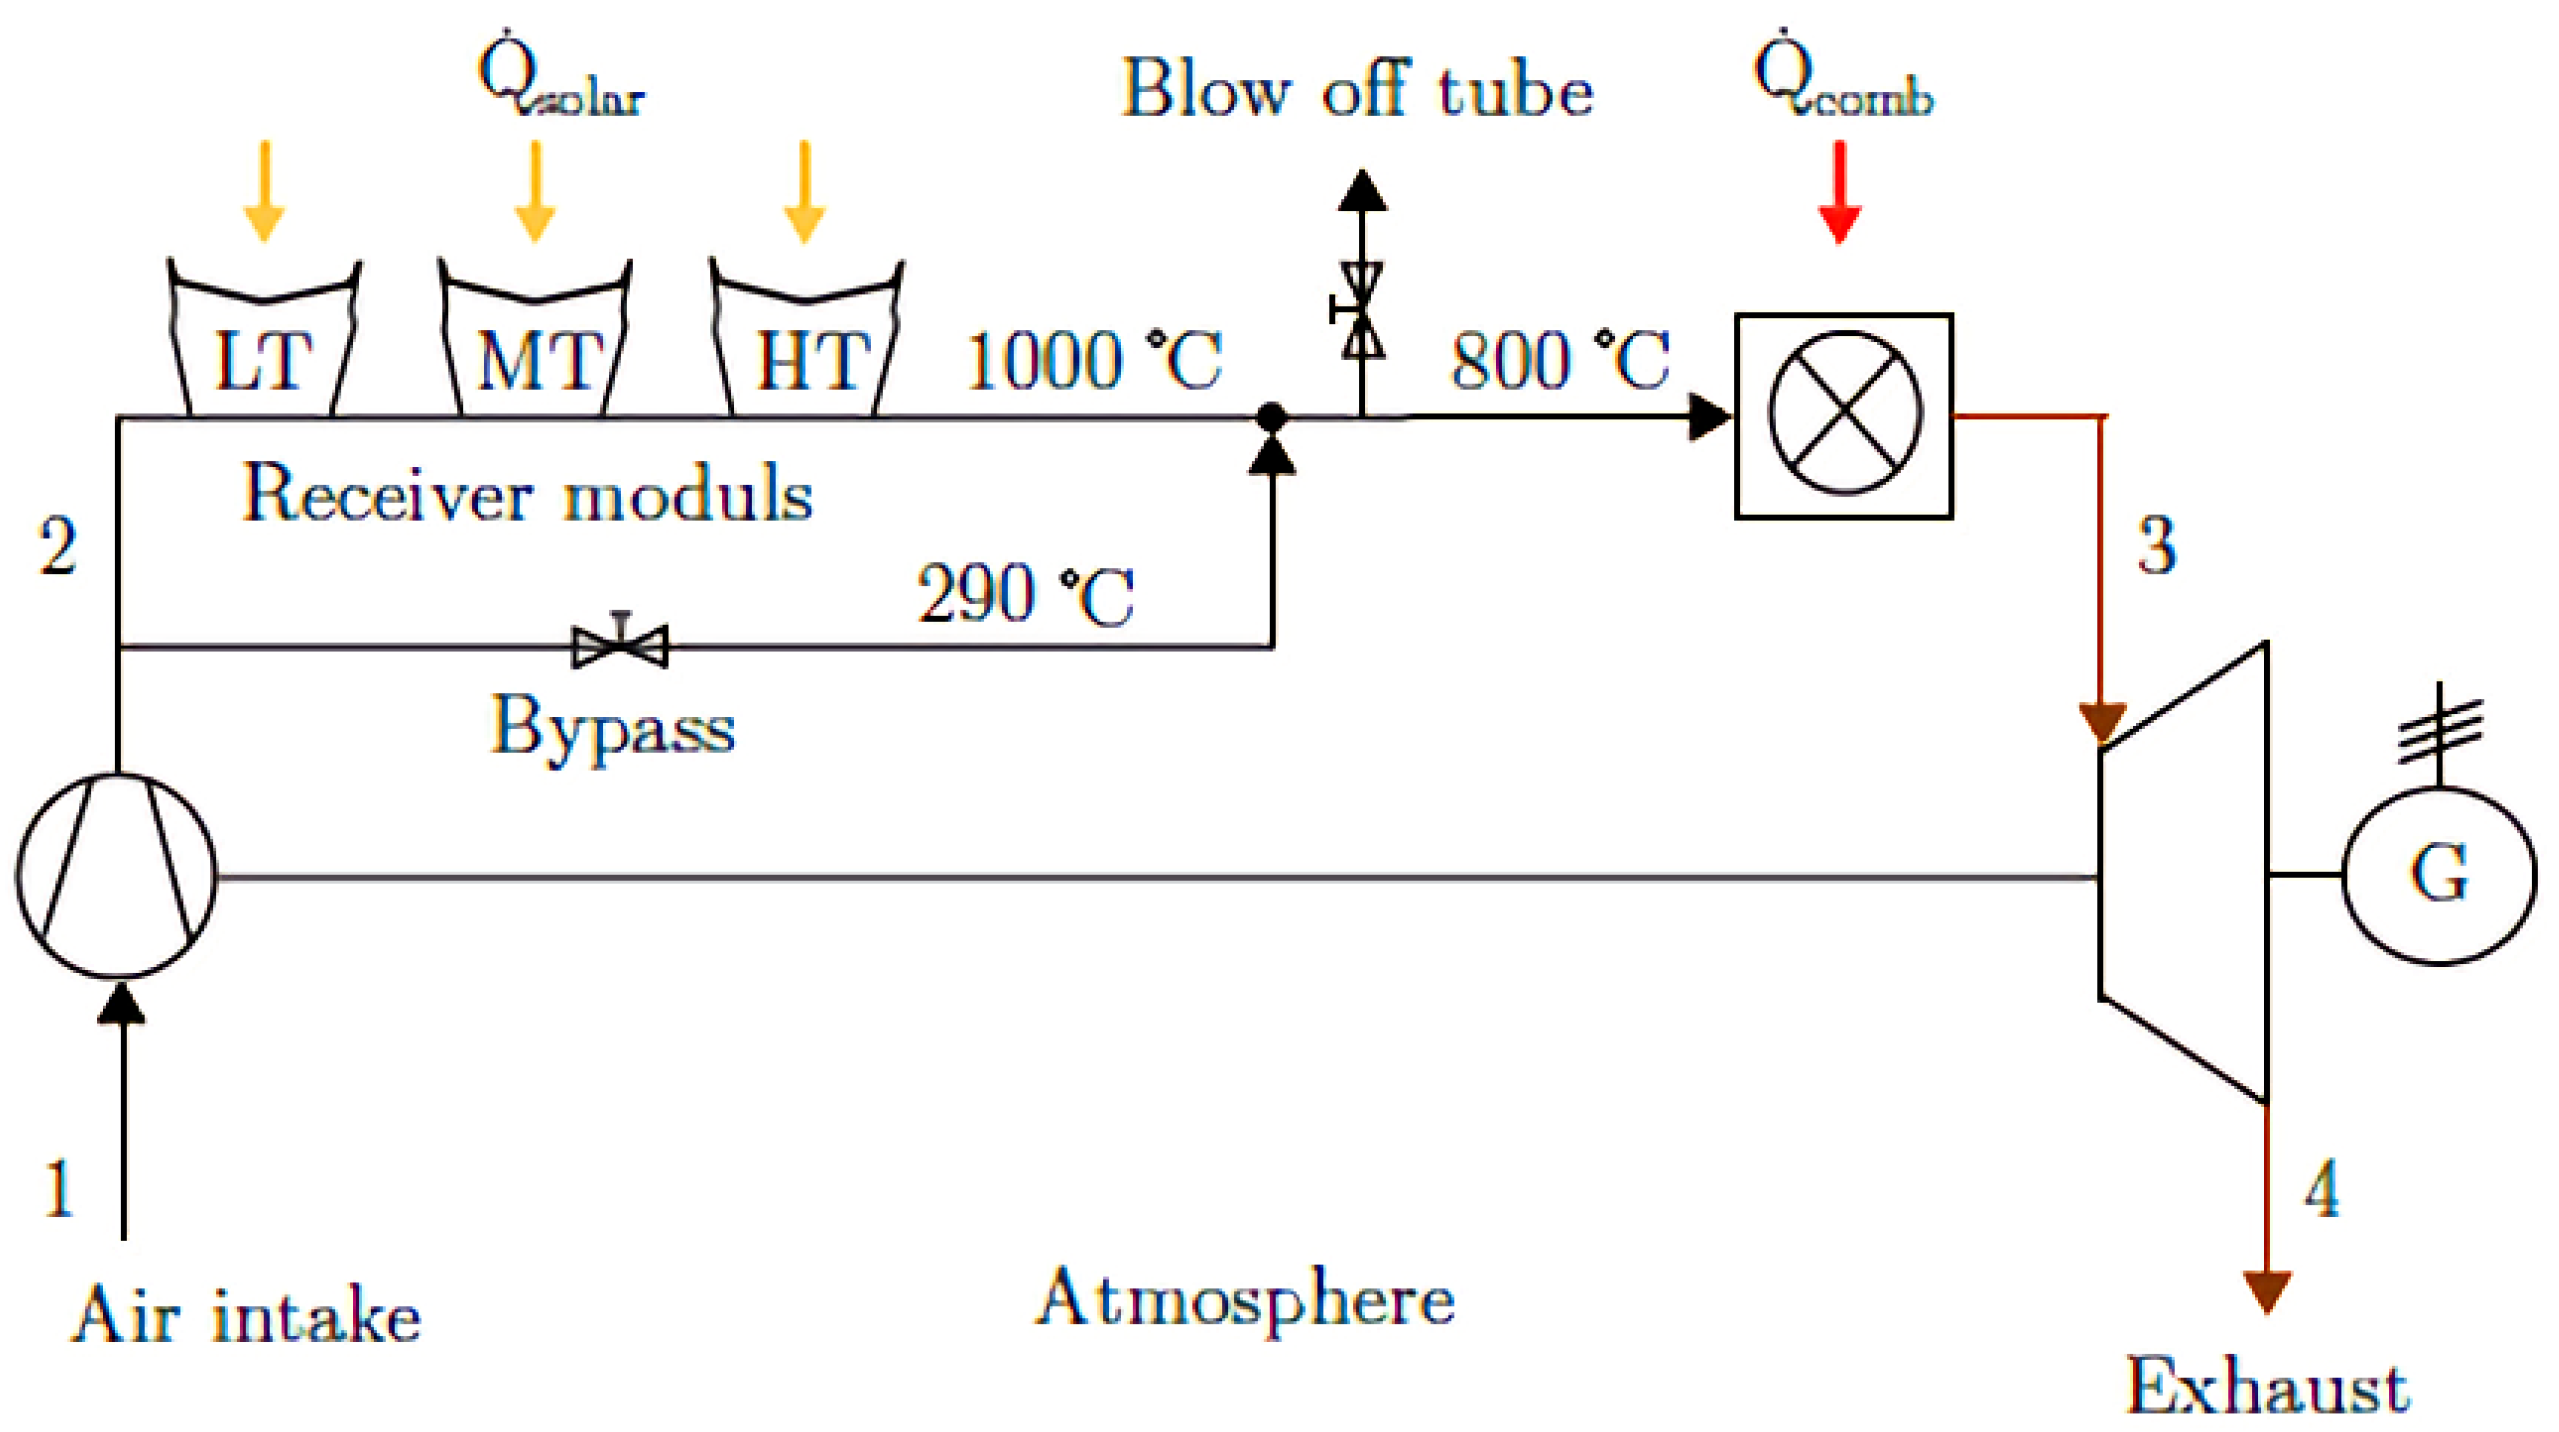
The solar-driven Brayton cycle of the SOLGATE project (see Figure 3) consists of a compressor, combustion chamber and gas turbine. The air is compressed and directed to the combustion chamber and then is heated and expanded in the turbine, generating electricity.
For the combined cycle, a conventional layout was assumed. The Rankine cycle recovers the exhaust heat from the Brayton cycle by a recovery boiler (see Figure 4), where the energy is transferred from the exhaust gas to water, which evaporates, producing steam. Then, this steam is expanded in a turbine, generating electricity. Finally, the steam condenses, and the resulting condensate is pumped back into the feed water tank.

2.2. LT-MED Coupled with a Central Receiver Solar Plant

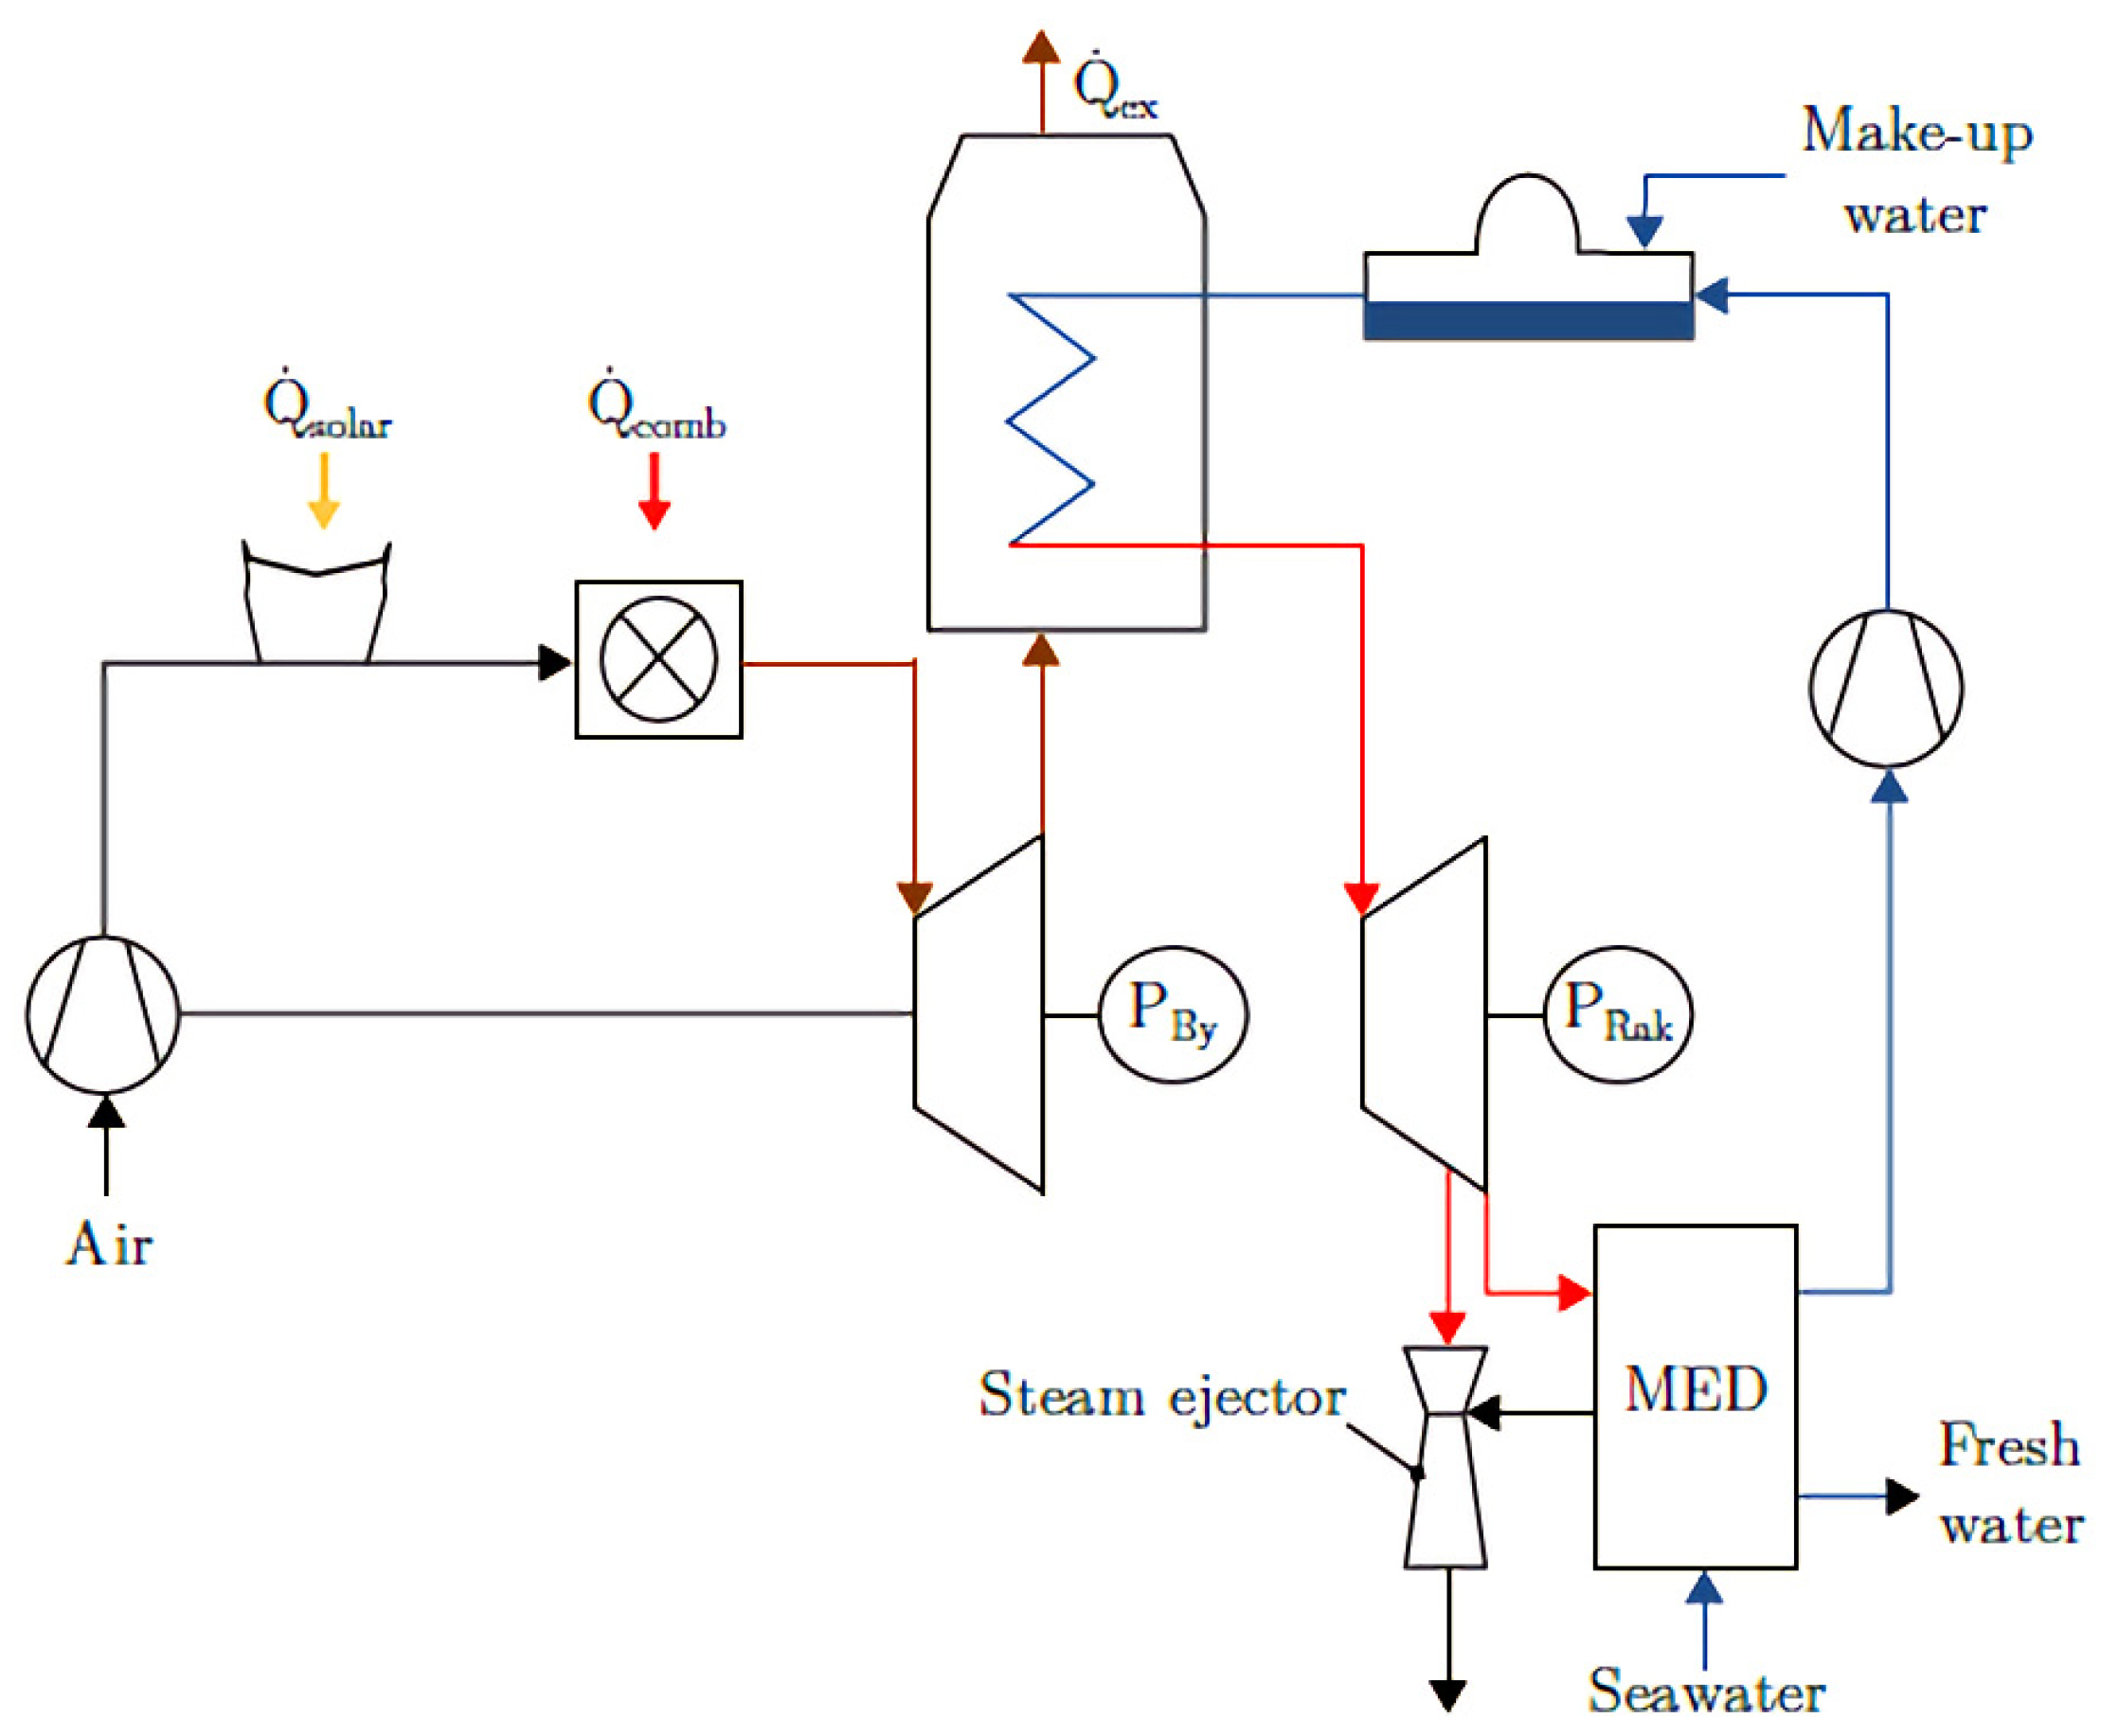
In the case of the LT-MED plant (see Figure 5), it is integrated by replacing the Rankine cycle condenser of the combined cycle. Consequently, the exhaust steam is relieved only up to 0.32 bar to obtain the required temperature of 70 °C for powering the MED process. The vacuum in the MED plant operates by a steam ejector driven by high-pressure steam. For that reason, it was considered that a marginal part of the steam is extracted from the Rankine power block at a pressure of 5 bar to produce and maintain that vacuum within the MED unit.

2.3. Reverse Osmosis Coupled with a Central Receiver Solar Plant

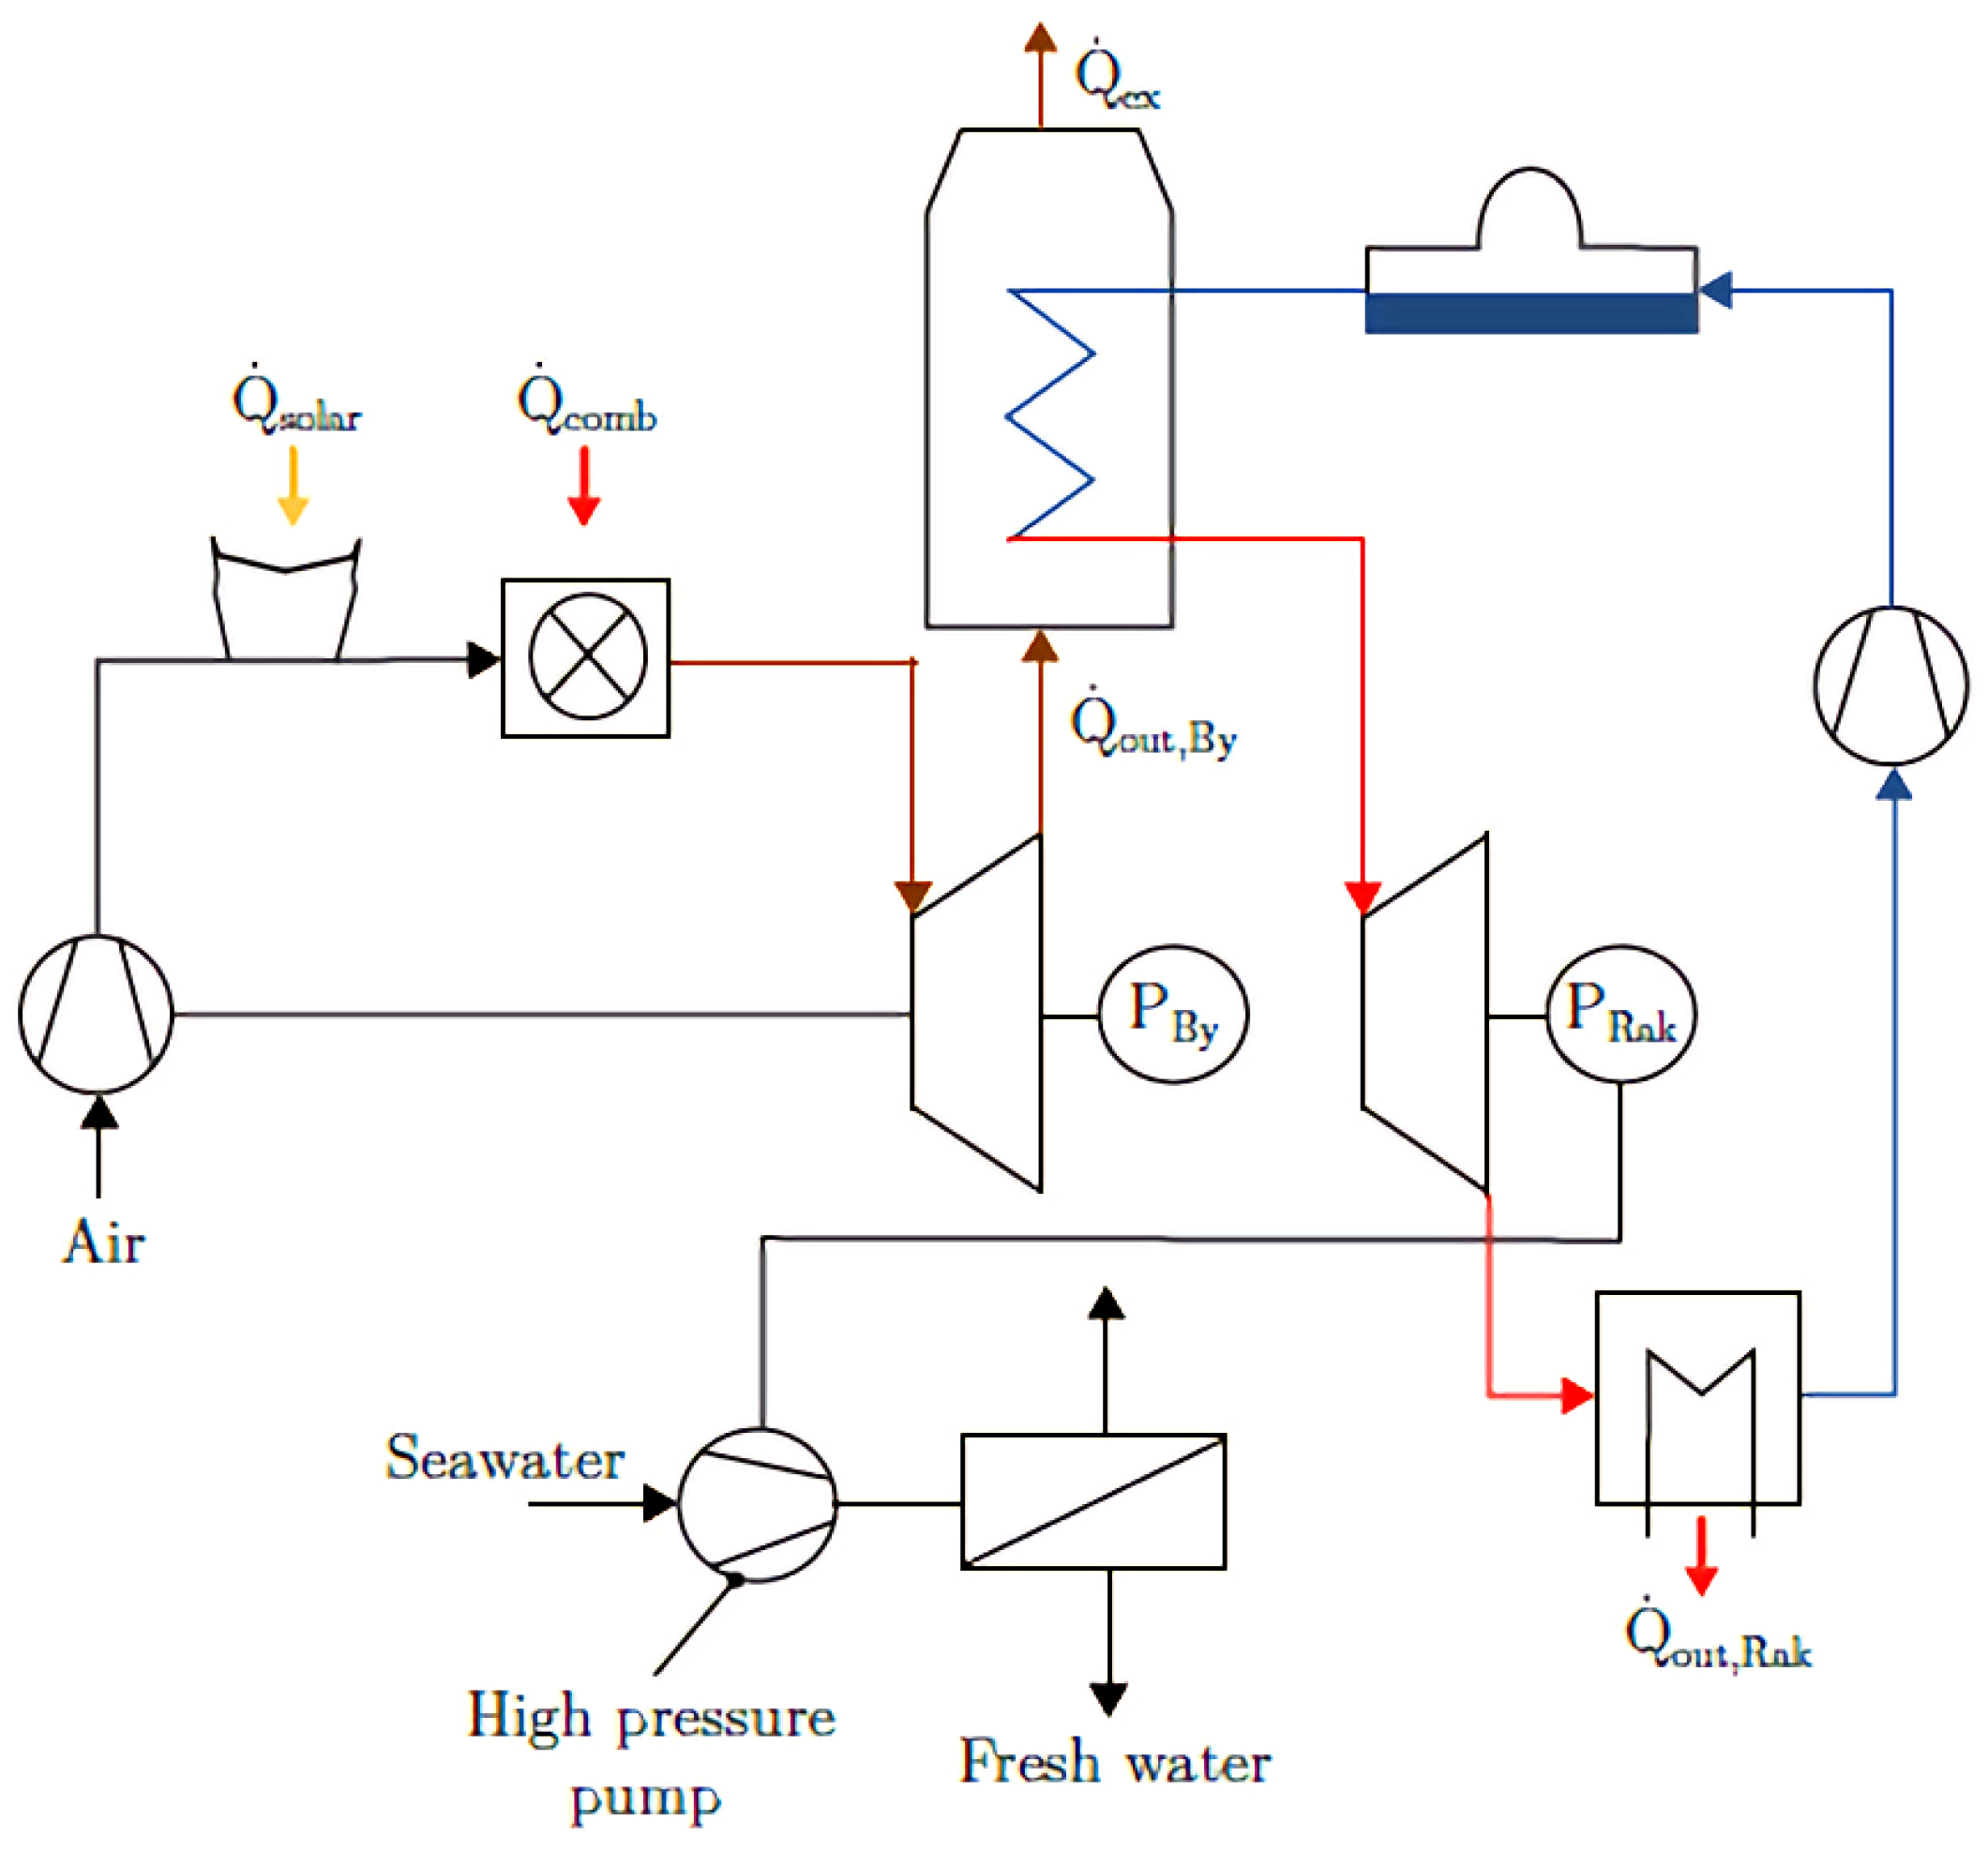
In the case of the reverse osmosis plant (see Figure 6), it is powered by the electricity generated from the combined cycle of the CRS plant. Therefore, part of the produced electricity drives a high-pressure pump to run this membrane-based desalination process. The exhaust steam pressure in the turbine was established at 0.085 bar (42.7 °C), which is limited by the available cooling water temperature in the condenser.

3. Modeling

This section presents the modeling and simulation of all the components of the cogeneration plants. The solar field and receiver were designed using HFLCAL software and the combined desalination and the CRS plants were simulated using the commercial software EBSILON v11 [29].

3.1. Central Receiver Solar Plant

3.1.1. Solar Field

The efficiency of the heliostat field is defined as follows:
η H F = Q ˙ R , i n c I D N I · A H F
where Q ˙ R , i n c is the intercepted thermal flow at the receiver, I D N I is the direct normal irradiance, and A H F is the total area of the heliostat field. In addition, the efficiency of the solar field can be calculated by the following equation:
η H F = ε H F · η o p t , H F
where ε H F is the average solar field reflectivity and η o p t , H F is the optical solar field efficiency, both depending on the sun’s azimuth and elevation angle [30]. The optical efficiency of the solar field is determined by the following equation:
η o p t , S F = η c l · η c o s · η s h · η b l · η a t · η s p l · η H F , p a r
where η c l is the cleanliness factor, η c o s is the cosine efficiency, η s h and η b l consider the shadowing and blocking effects, η a t is the factor for atmospheric extinction, η s p l accounts for the spillage losses and η H F , p a r are the parasitic losses of the solar field.

3.1.2. Receiver

The receiver efficiency is determined by the thermal losses (by reflection, thermal radiation, and convection). The reflection losses are based on the absorption limit of the applied material. The thermal radiation can be derived from Plank’s radiation law, and the convection losses are due to the temperature difference between the receiver and the ambient air [31]. Thereby, the receiver efficiency for a steady-state operation is defined as:
η R = Q ˙ R , o u t Q ˙ R , i n c = Q ˙ R , i n c Q ˙ r e f Q ˙ r a d Q ˙ c o n Q ˙ c o v Q ˙ R , i n c
where Q ˙ R , o u t is the output heat flow to the power block, Q ˙ r e f are the reflection losses, Q ˙ r a d are the thermal losses due to radiation and Q ˙ c o n and Q ˙ c o v are the thermal losses due to conduction and convection, respectively.

3.1.3. Power Block

The thermal efficiency of the combined cycle, η t h , c o , is defined as follows:
η t h , c o = P c o Q ˙ i n = P B y + P R a n k Q ˙ i n , B y + Q ˙ i n , R a n k
where P B y and P R a n k are the net power produced by the Brayton and Rankine cycles, respectively, and Q ˙ i n , B y and Q ˙ i n , R a n k are the heat rate input to both power cycles. These heat rate inputs are determined through the following equations that define the thermal efficiency of each cycle:
Q ˙ i n , B y = η t h , B y · P B y
Q ˙ i n , R a n k = P R a n k η t h , R a n k · Q ˙ o u t , B y η t h , R a n k
Finally, the electrical power of the combined cycle, P c o , can be obtained as follows:
P c o = P e l P R O / M E D P p u m p P c o o l
where P e l is the gross power production, P R O / M E D is the power consumed by the desalination processes (RO or MED), P p u m p   is the power consumed by the pumps and P c o o l is the power consumed by the cooling system.

3.2. Reverse Osmosis

The mathematical modeling was based on the fundamentals of the reverse osmosis process. It was implemented in MATLAB–Simulink and validated by comparing the outputs with the commercial software Reverse Osmosis System Analysis (ROSA v9) [32].
The system considers the pre- and post-treatment, a high-pressure pump and an Energy Recovery System (ERS) with a turbine and a generator. A membrane module composed of six membrane elements was selected, operating in line to obtain a recovery ratio (ratio between product water and feedwater) of 40%. It was assumed that all six membranes are considered a single element to estimate their performance.
The osmotic pressure of an ideal dilute solution containing more than one solute is given by the following equation:
π = R · T · i c i
where c i is the concentration of component i in the solution [33].
The total permeate flow rate, V ˙ D , is determined as follows:
V ˙ D = A M · L · F F · Δ p Δ π
where A M is the total active membrane area, L is the permeability coefficient (which depends on the characteristics of the membrane and is considered constant [34]), F F is a factor accounting for the fouling effects of the membrane, and Δ p is the required applied pressure in the membrane. The applied pressure, Δ p , should be able to overcome the osmotic pressure of the concentrate in the final stage of the RO unit. According to Perry and Green [35], the osmotic pressure of the concentrate rises with the osmotic pressure of the feed:
π C o n = 1 1 Φ · π F
Substituting Equation (8) into Equation (7) for the required pressure, the applied pressure in the membrane is obtained by the following equation:
Δ p = Φ · V F , R O A M · L · F F + π F 1 Φ
where Φ is the recovery ratio, V F , R O is the feedwater flow rate and π F is the osmotic pressure of the feed. Note that Equation (12) does not consider scaling or concentration polarization over the operating time.
The power consumption of the reverse osmosis process, P R O , is calculated as follows:
P R O = V F , R O · Δ P η p V C o n · Δ P T · η T · η G
where V C o n is the concentrate flow rate, Δ P T is the pressure drop over the turbine of the ERS, and η p , η T and η G are the efficiency factors of the pump, turbine and generator, respectively [36].
The total power consumed by the desalination system, P R O , is the sum of the power consumed by the RO process ( P p r o c e s s ) and the power required for the pretreatment ( P P r ), as shown in Equation (11):
P R O = P p r o c e s s + P P r
For the pretreatment, a specific energy consumption of 0.65 kWh/m3 was assumed [37]. It should be noted that the post-treatment was neglected because its energy demand is relatively low compared to P R O and P P r . The Specific Energy Consumption ( S E C ) of the desalination process is obtained as follows:
S E C = P R O V ˙ D = Δ P Φ · 1 η p 1 Φ · Δ P T Δ P · η T · η G + P P r V ˙ D
The selected membrane is a spiral–wound element with polyamide thin film composite (Dow FilmtecTM SW30HR_380 [38]), which was selected from DowWater & Process Solutions. The area of the membrane is 35 m2, has a permeate production of 24.6 m3/day and a salt rejection of 99.65%, at design conditions. Regarding the operating limits of this membrane [36], the maximum operating temperature and pressure are 45 °C and 83 bar, respectively, the maximum element pressure drop is 1 bar, the pH range (in continuous operation) is between 2 and 11 and the maximum feed SDI (Silt Density Index) is 5.
The permeability coefficient was estimated based on the data delivered by ROSA, resulting in L = 1.0979 · 10−3 m/(h bar).

3.3. Multi-Effect Distillation

The mathematical model of the LT-MED plant for determining its freshwater production was based on the model developed by Palenzuela et al. [39,40] and was implemented in the Matlab R2015b software environment. This model was developed based on the configuration of the pilot MED plant at Plataforma Solar de Almería and was validated with experimental data from this plant. For the sake of simplicity, only the main equations used are shown in this section. Note that the model does not account for the heat losses to the ambient.
The specific thermal energy consumption ( S T C ) of the MED unit is defined as the external thermal energy supplied to the distillation unit ( Q e f f , 1 ) divided between the total distillate flow rate ( V ˙ D ):
S T C = Q e f f , 1 V ˙ D
The total distillate flow rate is determined as the sum of the flows leaving each effect of the MED unit:
V ˙ D = i = 2 N M d , i
The thermal energy supplied to the distillation unit is calculated by an energy balance in the first effect, as follows:
Q e f f , 1 = M g b , 1 · λ g b , 1 + M f · C p · T b , 1 T f = M s · λ s
where M g b , 1 is the total vapor flow rate generated in the first effect and λ g b , 1 is the latent heat of evaporation at the temperature T b , 1 , which is the temperature of the remaining brine after evaporation.   M f is the feedwater flow rate sprayed in the first effect of MED at a temperature T f , C p is the specific heat capacity, M s is the low-pressure steam mass flow rate supplied in the first effect and λ s is the change in enthalpy associated with the vapor condensation in the first effect at steam temperature T s .
The required heat transfer area for the first effect ( A e f f , 1 ) and the rest of effects ( A e f f , i ) is determined by the following heat transfer equations:
First   effect :   Q e f f , 1 = U e f f , 1 · A e f f , 1 · T s T b , 1 = M s · λ s
Effect   i :   Q e f f , i = U e f f , i · A e f f , i · T v , i 1 T b , i = M v , i 1 · λ v , i 1
where U e f f , 1 and U e f f , i are the heat transfer coefficients of the first and the rest of effects, respectively. These coefficients are calculated by a correlation given by El-Dessouky and Ettouney [41] that is a function of the brine temperature, as indicated by Equation (18):
U e f f , i = 1.9695 + 1.2057 · 10 2 · T b , i 8.5989 · 10 5 · T b , 1 2 + 2.5651 · 10 7 · T b , 1 3
Q e f f , i is the heat transfer rate in each effect; M v , i 1 is the total vapor flow rate generated in one effect and going to the following one as the heating source and λ v , i 1 is the change in enthalpy associated with the vapor condensation in effect i , at vapor temperature T v , i 1 .
The plant performance is evaluated by the Gain Output Ratio ( G O R ), which is defined as the mass flow rate of distillate produced per consumed heating steam rate and by the recovery ratio ( R R ), which is the ratio of the distillate product flow rate to the feed flow rate supplied:
G O R = M p r o d M s
R R = M p r o d M f
Regarding the electricity consumption for the MED plant, P M E D , an SEC of 2 kWh/m3 was considered, which accounts for the water pumping from the sea to the desalination plant.

Design of the Vacuum System

The vacuum system was designed by determining the motive steam flow rate required in the ejector. The mass flow rate of the sucked air was estimated based on the calculation of the noncondensable gases.
From Equation (22), the total distillate mass flow rate is given by:
M p r o d = G O R · M s
According to Equation (23), the volume flow rate of the feed water, V F , M E D , can be determined as follows:
V F , M E D = G O R · M s R R · ρ F
where ρ F is the density of the feed water. Assuming ambient conditions and that the seawater is saturated with air, the amount of dissolved gases released during the evaporation process can be estimated as:
r a i r = V a i r V F , M E D = 16.86 l a i r l f e e d = 0.01686 m a i r 3 m f e e d 3
where r a i r is the volume flow fraction between the dissolved air and the feed [42]. The mass flow rate of the overall sucked air is then obtained as follows:
m a i r = r a i r · V F , M E D · ρ a i r + m l e a k a g e
where m l e a c k a g e is an additional air mass flow rate entering the system due to the lack of total tightness.

3.4. Simulation

3.4.1. RO Model

The input parameters for the RO model are summarized in Table 1. The pH and the operating temperature were set to 7.6 and 25 °C, respectively, and they are supposed to be constant during the whole process. The C O 3 2 concentration is obtained from ROSA, as it depends on the pH and temperature of the water. The seawater source selected was seawater from the Mediterranean Sea and the feed flow through one module was set to 200 m3/day with a recovery of 40%.
The concentration of the dissociated ions in the seawater is shown in Table 2.
The TDS (Total Dissolved Solids) corresponds with the sum of all ion concentrations. The model ignores/neglects the water chemical properties, as well as the chemical influence of ions and the charge neutrality of water. Furthermore, the ion activity factor is set to one, neglecting any molecular interactions.
The output data from solving the model are the osmotic feed and concentrate pressures ( π F and π C o n ), the applied pressure in the membrane ( Δ p ), the permeate and concentrate flow rates ( V H 2 O and V C o n , respectively) and the RO plant energy consumption ( P R O ).

3.4.2. MED Model

The input parameters of the LT-MED model are summarized in Table 3. They are based on the nominal values of the MED-PSA pilot plant. The model allows estimating the production of freshwater for a given amount of external heat supply obtained when the combined power cycle is simulated.
The output data from the MED model are given in Table 4.

3.4.3. CRS + Desalination Model

The location selected to run the simulations is Almería (Spain), with a latitude and longitude of 36.8° and −2.45°, respectively. The design point has been selected on the 21 March 2016 at noon, with a Direct Normal Irradiance of 817 W/m2, ambient temperature of 20 °C and wind velocity of 4.1 m/s.
Table 5 summarizes the data of the designed receiver, and Table 6 presents the boundary conditions of the power block. For the designed receiver, data from SOLGATE solar receiver were taken. The data from the power block were provided by the Institute of Energy Technology at the University of Hamburg. The evaporation occurred in a dual-pressure boiler with pressures of 5 and 121 bar respectively. The gas turbine operated with an inlet temperature of 1256 °C.
It was assumed that both CRS+Desalination configurations provide a total net power of 14 MWe. The net power resulting from the LT-MED configuration was that considered for the comparison due to the penalty associated with this configuration. This arises from the gross power production after subtracting the internal power consumption by the pumps and the power consumption required by the desalination process and the cooling system. In both configurations, the CSP plant is located at Tabernas, Almería (South of Spain), which is 40 km from the sea and has an altitude of 500 m, in order to avoid the corrosion problems that the sea could cause in the solar field. For the case of CRS+RO configuration, it was considered that the RO unit is located close to the sea, and only the cooling water of the power block needed to be transported over a certain distance to the plant. The energy demand for feeding the RO unit and for brine disposal was assumed to be negligible. In this configuration, the steam in the Rankine cycle was expanded up to a pressure of 0.085 bar (42.7 °C) considering a cooling water temperature of 25 °C.
In the case of the CRS+LT-MED configuration, the steam in the Rankine cycle was expanded up to a pressure of 0.32 bar (corresponding to a temperature of 70 °C, which is the steam temperature required by the MED unit), which penalizes the electricity production. The condensed water of the Rankine cycle was fed back to the feed water tank. The relatively high feed water temperature replaced the need for preheating the water in the power cycle. In this configuration, the desalination plant had to be located close to the power plant as it is fed with the steam coming from the power block. Hence, in this case, the cooling water and the LT-MED feedwater were transported over the total distance. The rejected seawater from the condenser and the brine were pumped back into the sea. Considering an average energy consumption of 3.6 Wh/(m3mrise) for the conveyance and lift system, the CRS+LT-MED system would have an energy demand of 2.1 MWel for the water supply while the CRS+RO system would require 1 MWel. Additional simulations were carried out considering the installation of a pressure boiler working at an operating pressure of 0.32 bar and 1.1 bar to produce additional steam for the LT-MED plant. The required energy for the boiler was provided by the exhaust gas coming from the Brayton cycle.

4. Results and Discussion

4.1. Solar Field

Regarding the solar field, Table 7 illustrates the resulting design parameters obtained by the simulation with the software HFCAL.
These parameters allowed determining the average optical solar field efficiency for different azimuth and elevation angles of the sun. The resulting optical efficiency distribution obtained by HFCAL is shown in Figure 7. As can be seen, the tower casts a shadow on some of the heliostats located close to it, and the heliostats on the borderline of the solar field show losses due to cosine and intercept factors. According to the date and time selected for the location of Almería, the resulting thermal power provided by the solar field to the receiver was 16,130 kWth. The efficiency matrices obtained by HFLCAL were imported to EBSILON for the power plant simulation.

4.2. CRS Plant with RO

The CRS plant performance and thermal efficiencies for powering the RO process are illustrated in Table 8.
It should be noted that the solar fraction was only given for the design point. The simulation has to be carried out for a full year to conclude more accurate results regarding the yearly solar fraction.
Table 9 illustrates the freshwater production of the RO plant. As can be seen, the desalination plant without an energy recovery system produces less water and, consequently, needs a lower power demand for the pretreatment. On the other hand, the configuration equipped with a recovery energy system requires more power for the pretreatment (126 kWe) and has, consequently, a lesser amount of power available for the RO process. However, the freshwater produced is higher due to the higher energy efficiency, which leads to lower specific energy consumption of the RO plant.

4.3. CRS Plant with LT-MED

Table 10 illustrates the results of the CRS plant with an integrated LT-MED.
For this configuration, the Rankine cycle produces lower electricity than in the case of CRS+RO (4.4 MWe), due to the efficiency drop (50.2% in comparison with CRS+RO configuration) caused by the limitation of the steam expansion up to 0.32 bar because the LT-MED requires steam at 70 °C. Table 11 shows the steam mass flow rate, the heat rate of the supplied steam, the heat recovered and the performance of the LT-MED unit ( G O R and S T C ) for the three cases considered: without an additional boiler (Case 1), with an additional boiler that produces steam at 0.32 bar (Case 2) and with an additional boiler that produces steam at 1.1 bar (Case 3). As expected, the plant produces more freshwater with an increasing heat supply.

4.4. Comparative Assessment of the CRS Plant with RO & LT-MED

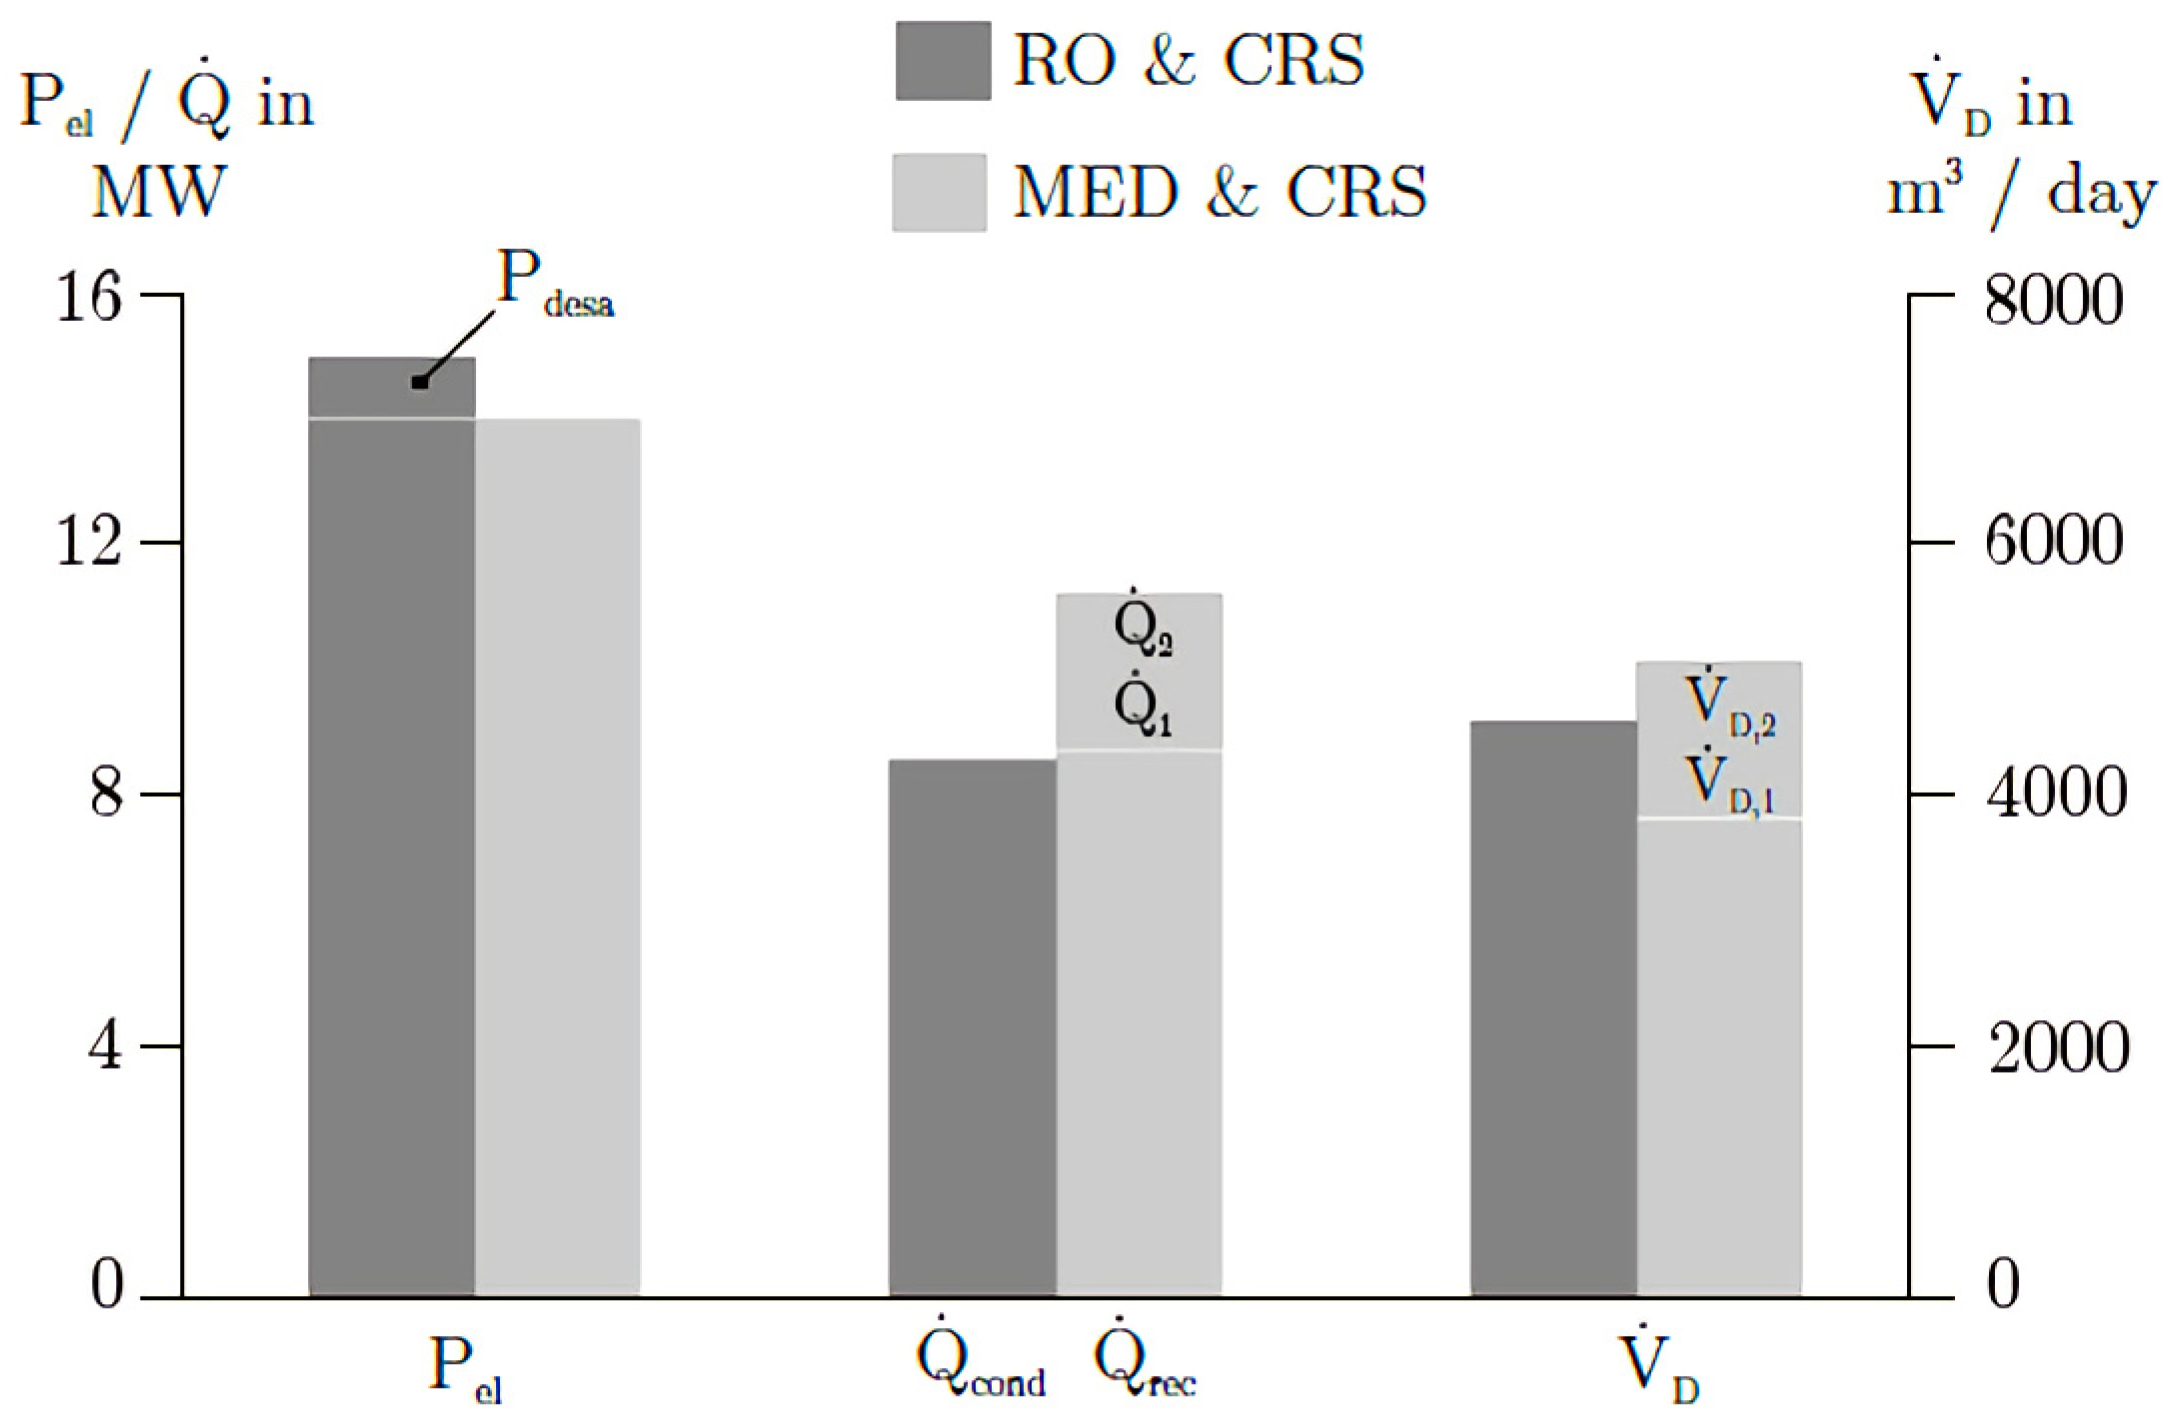
Figure 8 shows the produced energy, the amount of heat dissipated in the condenser ( Q ˙ c o n d ) and recovered ( Q ˙ r e c ) and the water production ( V ˙ D ) for both plant configurations.
As can be seen in Figure 8, the combination of the CRS plant with the RO unit allows a higher gross electricity generation than the combination of CRS plus LT-MED (see P d e s a ). The RO plant delivers water production of 4640 m3/day, an S E C of 4.6 kWh/m3 and the overall power plant configuration results in a thermal efficiency of 53.3%.
On the other hand, the CRS+LT-MED configuration results in an average S T C of 62 kWh/m3. The dissipated heat rate in the condenser ( Q ˙ c o n d ) is about 8566 kW, the temperature of the exhaust gas is 164 °C and the water production is about 3831 m3/day, which is significantly lower than the water production of the RO unit. In addition, the effect of integrating the LT-MED plant into the overall power plant leads to a penalty in the thermal efficiency of the power plant of three points, from 53.3% to 50.2%. In case an additional low-pressure boiler with an operating pressure of 1.1 bar is implemented to exploit the energy content in the exhaust gases from the Brayton cycle, it is ensured that the LT-MED plant gains additional steam (which is shown as Q ˙ 1 in Figure 8). Consequently, water production rises by V ˙ D , 1 . In this case, the temperature of the exhaust gas would decrease up to 117 °C. In the case that a boiler with an operating pressure of 0.32 bar is implemented for the same purpose, the recovered heat rate ( Q ˙ r e c ) and water production increases by Q ˙ 2 and V ˙ D , 2 (4932 m3/day) surpassing the RO water production. In this case, the exhaust gas temperature would drop down to 85 °C as the exhaust heat can be recovered more efficiently. The thermal efficiency of the combined cycle obtained can be compared with that obtained in a similar work from Resonnet et al. [26] where they reached up to 55.19% of thermal efficiency with the configuration CC+RO, while a penalty of seven points in the efficiency (48.47%) was obtained for the configuration CC+MED.

5. Conclusions

The objective of this paper was to explore combinations of a solar–hybrid gas turbine system with an expanded combined cycle to produce power and freshwater from seawater desalination (CSP+D plants). The two desalination systems proposed were RO and LT-MED. A model of both desalination plants was developed and implemented into Matlab and Simulink environments. Additionally, the central receiver solar plant with an integrated combined cycle was simulated in EBSILON for the location of Almería (Spain). The analysis was done in a design point, selected on the 21st of May. The two CSP+D plants were compared against each other in terms of their power and freshwater yields, assuming an equal net power of 14 MWe in both cases. From the comparison, it was found that the RO configuration produces 18% more freshwater than the LT-MED configuration. The latter resulted in a penalty in the thermal efficiency of the power plant (i.e., from 53.3% to 50.2%) due to the increase in the condensation temperature from 42.7 °C to 70 °C. In addition, the integration of LT-MED into the combined cycle of a CRS plant faces some challenges due to the need to locate the LT-MED close to the power plant. This effectively entails an additional energy demand for the MED, which was almost double the energy requirements for the RO unit. Nevertheless, for the case of thermal cogeneration with LT-MED, the new developments proposed in small-capacity solar tower plants for distributed generation may represent an opportunity for this option, as there is no penalty in the direct coupling to the Brayton cycle. Also, the inclusion of exergy analyses based on yearly simulations could lead to a fair comparison between the two different separation mechanisms, such as RO and MED.

Author Contributions

Conceptualization, P.P., D.-C.A.-P., B.O.-D. and G.Z.; methodology, P.P. and D.-C.A.-P.; software, P.P., D.-C.A.-P. and B.O.-D.; validation, P.P. and B.O.-D.; formal analysis, P.P., D.-C.A.-P., B.O.-D. and G.Z.; investigation, P.P., D.-C.A.-P., B.O.-D. and G.Z.; resources, G.Z.; data curation, P.P.; writing—original draft preparation, P.P. and D.-C.A.-P.; writing—review and editing, P.P., D.-C.A.-P., B.O.-D. and G.Z.; visualization, P.P. and D.-C.A.-P.; supervision, D.-C.A.-P. and G.Z.; project administration, P.P.; funding acquisition, D.-C.A.-P. and G.Z. All authors have read and agreed to the published version of the manuscript.

Funding

This research was funded by the Spanish government in the framework of the SOLTERMIN project (grant number ENE2017-83973-R) of the Ministerio de Economía, Industria y Competitividad (Spanish Ministry of Economy, Industry and Competitiveness) with ERDF funds.

Data Availability Statement

Not Applicable.

Acknowledgments

The research work leading to this article received funding from the Spanish government in the framework of the SOLTERMIN project (Ref. ENE2017-83973-R) of the Ministerio de Economía, Industria y Competitividad (Spanish Ministry of Economy, Industry and Competitiveness) with ERDF funds.

Conflicts of Interest

The authors declare no conflict of interest.

Abbreviations

Greek Symbols
α c o n Heat loss convective coefficient, W/m2K
Δ p r e c Nominal pressure drop in the receiver, bar
Δ P T Pressure drop over the turbine of the ERS, bar
Δ T h i g h Evaporator high-temperature difference, °C
Δ T l o w Evaporator low-temperature difference, °C
η a t Factor for atmospheric extinction
η b l Efficiency reduction due to blocking
η c l Cleanliness factor
η c o m p Compressor efficiency
η c o s Cosine efficiency
η G Efficiency of the generator
η H F Solar field efficiency
η H F , p a r Efficiency reduction due to parasitic losses
η p Efficiency of the pump
η s h Efficiency reduction due to shadowing
η T Efficiency of the turbine
η t h , c o Thermal efficiency of the combined cycle
η o p t , S F Optical solar field efficiency
η R Receiver efficiency
η s p l Efficiency reduction due to spillage
ε H F Average solar field reflectivity
ϵ r e c Receiver emissivity
λ g b , 1 Latent heat of evaporation inside the 1st effect of the MED unit, kJ/kg
λ s Latent heat of condensation in the 1st effect of the MED unit, kJ/kg
λ v , i Latent heat of condensation in effect i of the MED unit, kJ/kg
π Osmotic pressure, bar
π C o n Osmotic pressure of the concentrate, bar
π F Osmostic pressure of the feed, bar
Π Pressure ratio, Brayton
Φ Recovery Ratio for the RR
ρ F Density of the feed water, kg/m3
Roman Symbols
A a p Aperture area, m2
A e f f , i Heat transfer area of the effect i in the MED unit, m2
A H F Total area of the heliostat solar field, m2
A M Membrane area, m2
C p Specific heat, kJ/kg °C
c i Concentration of the component “i” in the solution, mol/m3
F F Fouling factor
G O R Gain Output Ratio
I D N I Direct normal irradiation, W/m2
L Permeability coefficient, m3/hm2bar
M d , i Distillate mass flow rate leaving each effect of the MED unit, kg/s
M f Feedwater mass flow rate sprayed in the 1st effect of the MED unit, kg/s
M g b , 1 Total vapor mass flow rate generated in the 1st effect, kg/s
M p r o d Mass flow rate of the total distillate produced in the MED unit, kg/s
M s Steam mass flow rate supplied in the 1st effect of the MED unit, kg/s
M v , i Vapor mass flow rate generated in effect i of the MED unit, kg/s
p Pressure, bar
P B y Net power produced by the Brayton cycle, W
P l o w Boiler low pressure, bar
P h i g h Boiler high pressure, bar
P R a n k Net power produced by the Rankine cycle, W
Q ˙ c o n Receiver losses due to conduction, W
Q ˙ c o v Receiver losses due to convection, W
Q e f f , 1 Thermal energy supplied in the 1st effect of MED plant, W
Q i n t Design intercept power, kW
Q ˙ i n , B y Thermal energy input of the Brayton cycle, W
Q ˙ i n , R a n k Thermal energy input of the Rankine cycle, W
Q ˙ r a d Receiver losses due to radiation, W
Q ˙ r e f Receiver losses due to reflection, W
Q ˙ R , i n c Intercepted thermal flow at the receiver, W
Q ˙ R , o u t Output heat flow from the receiver to the power block, W
R Universal gas constant, J/molK
R R Recovery Ratio
T Temperature, °C
T b , 1 Temperature of brine in the 1st effect of the MED after evaporation, °C
T f Temperature of the feedwater sprayed in the 1st effect of the MED, °C
T i n Gas turbine inlet temperature, °C
T r e c Surface temperature, °C
T v , i Vapor temperature in the effect i of the MED unit, °C
V a i r Volume of air, m3
V ˙ D Total permeate/distillate flow rate, m3/day
V C o n Concentrate flow rate, m3/s
V F , M E D Volume flow rate of feed water, m3/s
V F , R O Feedwater flow rate in the RO, m3/s
P R O / M E D Power consumed by the desalination processes, W
P P r Power consumed by the pretreatment, W
P p r o c e s s Power consumed by the RO process, W
S E C Specific Energy Consumption of the RO process, Wh/m3
S T C Specific Thermal Energy Consumption of the MED process, Wh/m3
U e f f Heat transfer coefficient, kW/m2 °C
CSPConcentrating Solar Power
CSP+DConcentrating Solar Power and Desalination
CRCentral Receiver
CRSCentral Solar Receiver
ISCCIntegrated solar gas turbine-steam turbine combined cycle
LT-MEDLow-temperature multi-effect distillation
MEDMulti-effect distillation
MENAMiddle East and North Africa
MSFMultistage flash
PSAPlataforma Solar de Almería
PTParabolic Trough
ROReverse Osmosis
ROSAReverse Osmosis System Analysis
SDISilt Density Index
TDSTotal Dissolved Solids

References

  1. Micale, G.; Cipollina, A.; Rizzuti, L. Seawater Desalination: Conventional and Renewable Energy Processes. In Seawater Desalination: Conventional and Renewable Energy Processes; Springer: Berlin/Heidelberg, Germany, 2009; ISBN 978-3-642-01149-8. [Google Scholar] [CrossRef]
  2. Lozán, J.L. Global Change: Enough Water for All? Wissenschaftliche Auswertungen: Frankfurt am Main, Germany, 2007; ISBN 3980966828. [Google Scholar]
  3. Alrobaei, H. Novel Integrated Gas Turbine Solar Cogeneration Power Plant. Desalination 2008, 220, 574–587. [Google Scholar] [CrossRef]
  4. UNESCO; World Water Assessment Programme. The United Nations World Water Development Report 2014: Water and Energy; UNESCO: Paris, France, 2014. [Google Scholar]
  5. The Glasgow Climate Pact—UN Climate Change Conference (COP26) at the SEC—Glasgow 2021. Available online: https://ukcop26.org/the-glasgow-climate-pact/ (accessed on 9 February 2023).
  6. Boretti, A.; Castelletto, S. Techno-economic performances of future concentrating solar power plants in Australia. Humanit. Soc. Sci. Commun. 2021, 8, 326. [Google Scholar] [CrossRef]
  7. Palenzuela, P.; Ortega-Delgado, B.; Alarcón-Padilla, D.-C. Comparative assessment of the annual electricity and water production by concentrating solar power and desalination plants: A case study. Appl. Therm. Eng. 2020, 177, 115485. [Google Scholar] [CrossRef]
  8. Ortega-Delgado, B.; Palenzuela, P.; Alarcón-Padilla, D.C. Analysis of the Time Step Influence in the Yearly Simulation of Integrated Seawater Multi-Effect Distillation and Parabolic trough Concentrating Solar Thermal Power Plants. Processes 2022, 10, 573. [Google Scholar] [CrossRef]
  9. Palenzuela, P.; Zaragoza, G.; Alarcón-Padilla, D.C.; Guillén, E.; Ibarra, M.; Blanco, J. Assessment of Different Configurations for Combined Parabolic-Trough (PT) Solar Power and Desalination Plants in Arid Regions. Energy 2011, 36, 4950–4958. [Google Scholar] [CrossRef]
  10. Palenzuela, P.; Zaragoza, G.; Alarcón, D.; Blanco, J. Simulation and Evaluation of the Coupling of Desalination Units to Parabolic-Trough Solar Power Plants in the Mediterranean Region. Desalination 2011, 281, 379–387. [Google Scholar] [CrossRef]
  11. Palenzuela, P.; Alarcón-Padilla, D.C.; Zaragoza, G. Large-Scale Solar Desalination by Combination with CSP: Techno-Economic Analysis of Different Options for the Mediterranean Sea and the Arabian Gulf. Desalination 2015, 366, 130–138. [Google Scholar] [CrossRef]
  12. Palenzuela, P.; Zaragoza, G.; Alarcón-Padilla, D.C. Characterisation of the Coupling of Multi-Effect Distillation Plants to concentrating Solar Power Plants. Energy 2015, 82, 986–995. [Google Scholar] [CrossRef]
  13. Ortega-Delgado, B.; García-Rodríguez, L.; Alarcón-Padilla, D.C. Thermoeconomic Comparison of Integrating Seawater Desalination Processes in a Concentrating Solar Power Plant of 5 MWe. Desalination 2016, 392, 102–117. [Google Scholar] [CrossRef]
  14. Ortega-Delgado, B.; Palenzuela, P.; Bonilla, J.; Berenguel, M.; Roca, L.; Alarcón-Padilla, D.C. Dynamic Modeling of a Multi-Effect Vertical Falling-Film Evaporator for Water Reuse in CSP Plants. Desalination 2022, 529, 115623. [Google Scholar] [CrossRef]
  15. Ortega-Delgado, B.; Palenzuela, P.; Alarcón-Padilla, D.C. Parametric Study of a Multi-Effect Distillation Plant with Thermal Vapor Compression for Its Integration into a Rankine Cycle Power Block. Desalination 2016, 394, 18–29. [Google Scholar] [CrossRef]
  16. Sharan, P.; Neises, T.; McTigue, J.D.; Turchi, C. Cogeneration using multi-effect distillation and a solar-powered supercritical carbon dioxide Brayton cycle. Desalination 2019, 459, 20–33. [Google Scholar] [CrossRef]
  17. Maia, C.B.; Silva, F.V.M.; Cabezas-Gómez, L. A CSP-desalination system using a supercritical carbon dioxide Brayton cycle in Brazil. J. Braz. Soc. Mech. Sci. Eng. 2022, 44, 154. [Google Scholar] [CrossRef]
  18. Yuan, L.; Zhu, Q.; Zhang, T.; Duan, R.; Zhu, H. Performance evaluation of a co-production system of solar thermal power generation and seawater desalination. Renew. Energy 2021, 169, 1121–1133. [Google Scholar] [CrossRef]
  19. Hoffmann, J.E.; Dall, E.P. Integrating desalination with concentrating solar thermal power: A Namibian case study. Renew. Energy 2018, 115, 423–432. [Google Scholar] [CrossRef]
  20. Wellmann, J.; Meyer-Kahlen, B.; Morosuk, T. Exergoeconomic evaluation of a CSP plant in combination with a desalination unit. Renew. Energy 2018, 128, 586–602. [Google Scholar] [CrossRef]
  21. Ait Lahoussine Ouali, H.; Soomro, M.I.; Touili, S.; Eltaweel, M.; Alami Merrouni, A. Performance investigation of seawater desalination system powered by central receiver concentrated solar thermal plant. Appl. Therm. Eng. 2023, 225, 120165. [Google Scholar] [CrossRef]
  22. Frantz, C.; Seifert, B. Thermal Analysis of a Multi Effect Distillation Plant Powered by a Solar Tower Plant. Energy Procedia 2015, 69, 1928–1937. [Google Scholar] [CrossRef] [Green Version]
  23. Trieb, F.; Müller-Steinhagen, H.; Kern, J.; Scharfe, J.; Kabariti, M.; Al Taher, A. Technologies for Large Scale Seawater Desalination Using Concentrated Solar Radiation. Desalination 2009, 235, 33–43. [Google Scholar] [CrossRef]
  24. Eveloy, V.; Rodgers, P.; Qiu, L. Hybrid Gas Turbine–Organic Rankine Cycle for Seawater Desalination by Reverse Osmosis in a Hydrocarbon Production Facility. Energy Convers. Manag. 2015, 106, 1134–1148. [Google Scholar] [CrossRef]
  25. Shaaban, S. Performance Optimization of an Integrated Solar Combined Cycle Power Plant Equipped with a Brine Circulation MSF Desalination Unit. Energy Convers. Manag. 2019, 198, 111794. [Google Scholar] [CrossRef]
  26. Rensonnet, T.; Uche, J.; Serra, L. Simulation and Thermoeconomic Analysis of Different Configurations of Gas Turbine (GT)-Based Dual-Purpose Power and Desalination Plants (DPPDP) and Hybrid Plants (HP). Energy 2007, 32, 1012–1023. [Google Scholar] [CrossRef]
  27. Khademi, M.; Ahmadi, A.; Dashti, R.; Shirmohammadi, R. Thermoeconomic optimization of a solar-assisted supercritical CO2 Brayton cycle, organic Rankine cycle and multi-effect distillation system. Energy Rep. 2022, 8, 13494–13503. [Google Scholar] [CrossRef]
  28. European Commission, Directorate-General for Research and Innovation. SOLGATE, Solar Hybrid Gas Turbine Electric Power System; Publications Office of the European Union: Luxembourg, 2005. [Google Scholar]
  29. STEAG. Energy Services GmbH EBSILON Professional. Available online: https://www.steag-systemtechnologies.com/en/products/ebsilon-professional/ (accessed on 4 August 2021).
  30. Kaltschmitt, M.; Streicher, W.; Wiese, A. (Eds.) Erneuerbare Energien—Systemtechnik · Wirtschaftlichkeit · Umweltaspekte; Springer: Berlin/Heidelberg, Germany, 2020; ISBN 978-3-662-61189-0. [Google Scholar] [CrossRef]
  31. Singer, C. Solarturmreceiver für Überkritische Dampfprozesse und Ihre Technische und Ökonomische Bewertung; Springer Fachmedien: Wiesbaden, Germany, 2013; ISBN 978-3-658-02210-5. [Google Scholar] [CrossRef]
  32. WAVE Water Treatment Design Software. Available online: https://www.dupont.com/water/resources/design-software.html (accessed on 10 January 2023).
  33. Strathmann, H. Introduction to Membrane Science and Technology; Wiley-VCH: Weinheim, Germany, 2011; ISBN 9783527324514. [Google Scholar]
  34. Final Report Summary—SOLHYCO (Solar-Hybrid Power and Cogeneration Plants)|FP6|CORDIS|European Commission. Available online: https://cordis.europa.eu/project/id/19830/reporting (accessed on 20 February 2023).
  35. Green, D.W.; Perry, R.H. Perry’s Chemical Engineers’ Handbook, 8th ed.; McGraw-Hill Education: New York, NY, USA, 2008; ISBN 9780071422949. [Google Scholar]
  36. Melin, T.; Rautenbach, R. Membranverfahren: Grundlagen der Modul- und Anlagenauslegung, 3rd ed.; Springer: Berlin/Heidelberg, Germany, 2007; ISBN 9783540343288. [Google Scholar] [CrossRef]
  37. Pearce, G.K. UF/MF Pre-Treatment to RO in Seawater and Wastewater Reuse Applications: A Comparison of Energy Costs. Desalination 2008, 222, 66–73. [Google Scholar] [CrossRef]
  38. FilmTecTM SW30HR-380 Wet. Available online: https://www.dupont.com/products/filmtecsw30hr380wet.html (accessed on 20 February 2023).
  39. Palenzuela, P.; Alarcón, D.; Zaragoza, G.; Blanco, J.; Ibarra, M. Parametric Equations for the Variables of a Steady-State Model of a Multi-Effect Desalination Plant. Desalin. Water Treat. 2013, 51, 1229–1241. [Google Scholar] [CrossRef]
  40. Palenzuela, P.; Hassan, A.S.; Zaragoza, G.; Alarcón-Padilla, D.-C. Steady State Model for Multi-Effect Distillation Case Study: Plataforma Solar de Almería MED Pilot Plant. Desalination 2014, 337, 31–42. [Google Scholar] [CrossRef]
  41. El-Dessouky, H.T.; Ettouney, H.M. Fundamentals of Salt Water Desalination; Elsevier: Amsterdam, The Netherlands, 2002; ISBN 9780444508102. [Google Scholar] [CrossRef]
  42. Aigner, D.; Bollrich, G. Bauwesen Wissen: Handbuch der Hydraulik: Für Wasserbau und Wasserwirtschaft; Beuth Verlag GmbH: Berlin, Germany, 2015; ISBN 9783410213413. [Google Scholar]
  43. Greenlee, L.F.; Lawler, D.F.; Freeman, B.D.; Marrot, B.; Moulin, P. Reverse Osmosis Desalination: Water Sources, Technology, and Today’s Challenges. Water Res. 2009, 43, 2317–2348. [Google Scholar] [CrossRef]
Figure 1. Central receiver solar power plant with direct solar heating.
Processes 11 01181 g001
Figure 2. Scheme of the pressurized volumetric receiver. Adapted from [28].
Processes 11 01181 g002
Figure 3. Scheme of SOLGATE solar-driven Brayton cycle. Adapted from [28] (LT: Low Temperature; MT: Medium Temperature; HT: High Temperature; 1: air inlet from atmosphere; 2: Compressed air; 3: air outlet from combustor; 4: exhaust air from turbine).
Processes 11 01181 g003
Figure 4. Scheme of the combined Brayton/Rankine cycle.
Processes 11 01181 g004
Figure 5. LT-MED unit integrated into the combined cycle of the CRS plant.
Processes 11 01181 g005
Figure 6. CRS plant powering a RO unit.
Processes 11 01181 g006
Figure 7. Optical efficiency distribution of the solar field.
Processes 11 01181 g007
Figure 8. Comparison between the energy recovered, heat and water production for the two CRS+D configurations.
Processes 11 01181 g008
Table 1. Input data of the RO model for one module.
ParameterValueUnit
FixedpH7.6-
Operating temperature, T25°C
C O 3 2 Concentration8mg/L
Permeability coefficient, L1.0979 × 10−3m/(h bar)
VariableFeed flow, V F , R O 200m3/day
Recovery Ratio, Φ 40%
Fouling Factor, F F 0.85-
Table 2. Dissociated ion concentration of the Mediterranean Seawater [43].
ComponentConcentration in mg/L
Cl23,000
Na+12,000
SO42−2670
Mg2+1550
Ca2+670
HCO3142
CO32−8
Sr2+7.5
B5.3
TDS40,052.8
Table 3. Input data of the LT-MED model.
ParameterValueUnit
Initial temp. diff. in the 1st effect (brine–feedwater)3°C
Recovery Ratio, R R 37%
Number of effects, N e f f 15-
Number of preheaters, N p r e h 14-
Heating steam temperature, T s 70.6°C
Vapor temperature in the last effect, T v , N 35°C
Temperature increase in the condenser7°C
Table 4. Output data from the LT-MED model.
ParameterUnit
Heat transfer area, A e f f m2
Total distillate production, V ˙ D m3/day
Gain Output Ratio, G O R -
Feedwater flow rate, V F , M E D m3/day
Feedwater temperature, T f °C
Seawater mass flow rate, m s w kg/s
Specific Thermal Consumption, S T C kWh/m3
Table 5. Design parameters of the receiver.
ParameterValueUnit
Aperture area, A a p 19.63m2
Design intercept power, Q i n t 16,130kW
Efficiency, η R 0.74-
Emissivity, ϵ r e c 0.84-
Heat loss convective coefficient, α c o n 12W/m2K
Surface temperature, T r e c 830°C
Nominal pressure drop, Δ p r e c 1bar
Table 6. Boundary conditions of the power block.
ParameterValueUnit
Pressure ratio, Brayton, Π 16-
Gas turbine inlet temperature, T i n 1256°C
Low-pressure, Boiler, P l o w 5bar
High-pressure, Boiler, P h i g h 121bar
High-temperature difference, Evaporator, Δ T h i g h 20K
Low-temperature difference, Evaporator, Δ T l o w 15K
Compressor efficiency, η c o m p 85%
Generator efficiency, η G 98%
Table 7. Resulting design parameters of the heliostat field.
Design ParameterValueUnit
Total reflective area25,458.6m2
Number of heliostats220-
Heliostat reflective area115.72m2
Efficiency0.74-
Average field reflectivity0.88-
Field density0.22-
Table 8. EBSILON results of the CRS plant with the RO unit.
Design ParameterValueUnit
Power plant performanceGross Power Brayton10MWe
Gross Power Rankine5MWe
Parasitic energy losses0.1MWe
Thermal efficiencyBrayton cycle35.9%
Rankine cycle27.8%
Combined cycle53.3%
Solar fraction41%
Table 9. Results for the RO plant.
RO UnitVariableValueUnit
Power for desalination900kWe
No energy recovery systemPower for pretreatment MF/UF87kWe
Power for RO813kWe
Fresh water production3200m3/day
Number of modules40-
S E C RO process6.07kWh/m3
With energy recovery systemPower for pretreatment MF/UF126kWe
Power for RO774kWe
Fresh water production4640m3/day
Number of modules58-
S E C RO process3.98kWh/m3
Table 10. EBSILON results of the CRS plant with an LT-MED plant.
CRS Plant with
LT-MED
VariableValueUnit
Power plant performanceGross Power Brayton10MWe
Gross Power Rankine4.4MWe
Parasitic energy losses0.09MWe
Electric Consumption MED0.31MWe
Thermal efficiencyBrayton cycle35.9%
Rankine cycle24.5%
Combined cycle50.2%
Solar fraction41%
Brayton cycle35.9%
Table 11. Results for the LT-MED plant.
M s (kg/s) Q s (kW) Q r e c (kW) V ˙ D (m3/Day) G O R S T C (kWh/m3)
4.24910,0808831383110.3363.1
4.82911,63310,214456210.8261.2
5.23112,65811,120494210.8261.5
Disclaimer/Publisher’s Note: The statements, opinions and data contained in all publications are solely those of the individual author(s) and contributor(s) and not of MDPI and/or the editor(s). MDPI and/or the editor(s) disclaim responsibility for any injury to people or property resulting from any ideas, methods, instructions or products referred to in the content.