Article

Investigation on the Aerodynamic Performance of High-Pressure Cylinders under the Mode of Regulating Steam Supply with an Intermedium-Pressure Adjustment Valve

1
Key Laboratory for Thermal Science and Power Engineering of Ministry of Education, Department of Energy and Power Engineering, Tsinghua University, Beijing 100084, China
2
Energy and Electricity Research Center, Jinan University, Zhuhai 519070, China
3
Dongfang Turbine Co., Ltd., Deyang 618030, China
*
Author to whom correspondence should be addressed.
Processes 2023, 11(4), 1214; https://doi.org/10.3390/pr11041214
Submission received: 23 March 2023 / Revised: 10 April 2023 / Accepted: 11 April 2023 / Published: 14 April 2023
(This article belongs to the Section Energy Systems)

Abstract

:
In order to investigate the operational performance of the high-pressure (HP) cylinder towards a 300 MW boiler unit, the three-dimensional calculation method was applied to simulate the aerodynamic flow characteristics of the last five stage cylinder blades, including limiting streamline, isentropic efficiency along the blade height, and relative work amounts. Simulation results show that with the back pressure controlled at 3.4 MPa and the inlet steam flow decreasing to a certain extent, the flow state of the last three stage blades begins to deteriorate. When the back pressure continues to drop, the flow state becomes unstable at the blade root and the blade tip on the suction surface of the rotor blade, while the flow state is stable on the pressure surface of the rotor blade and the surface of the stationary blade. If the flow rate decreases, the flow separation area on the suction surface of the moving blade decreases, and the flow performance can be improved. With the decrease in the boiler load, the total-total isentropic efficiency for the last three stage blades of the HP cylinder gradually decreases. In addition, the isentropic efficiency at the blade root and blade tip is lower than that for the blade body, which is closely related to the flow separation phenomenon of the last three stages of moving blades at the root and tip. In the working condition of the intermedium-pressure adjustment valve, since the temperature variation is within a limited range, operational safety can be guaranteed under the design blade frequency and strength. This paper provides the upper and lower limits of the exhaust gas pressure for the HP cylinder under the intermedium-pressure adjustment valve participation mode concerning various working conditions as well as corresponding constraints. This is conducive to guiding the design and safe operation of the intermedium-pressure adjustment valve. Through adjusting the intermedium-pressure adjustment valve, a specific supply capacity of the unit can also be satisfied at the lower load, which is beneficial to the deep peak regulation of the unit.

1. Introduction

With the rapid development of renewable energy in recent years, the abandonment of wind and solar energy is becoming increasingly severe [1], and the demand for peak regulation of power grids is urgent. Coal-fired generating units are still the main body of many countries or regions, such as China. Hence, it is imperative for them to take responsibility for deep peak regulation. Conventional combined heat and power units usually operate in the mode of constant thermal power supply in winter, and the thermal load restricts the peak regulation capacity. Thermoelectric decoupling technology can remove the constraint of thermal production on power production, thus facilitating the development of cogeneration units with deep peak regulation capacity [2].
There are many ways to realize thermoelectric decoupling. One of them, partial removal of the low-pressure (LP) cylinder in the thermal supply during operation, is a relatively economical solution [3,4]. If the LP cylinder is partially removed, the key is how to ensure the safe and stable operation of the final blade for a long time [5,6,7]. Regarding the industrial steam supply, the decoupling of heat and electricity is commonly realized through high and low steam bypass or by directly reducing the temperature and pressure of the main steam [8,9]. Suppose the intermedium-pressure adjustment valve is applied to adjust and supply steam through the hot section or cold section. In that case, the steam supply pressure under low load conditions can also be adjusted to a certain extent.
The published studies on the application of the intermedium-pressure adjustment valve mainly focus on the controlling method. In order to ensure safe operation, the opening degree of the valve and the exhaust gas pressure of the high-pressure (HP) cylinder are generally controlled to prevent the vibration of the valve and the overload of the last blade due to more work [10,11]. However, studies were only found to investigate the flow field variation and aerodynamic characteristics of the HP cylinder when using an intermedium-pressure adjustment valve to adjust the heat supply. In contrast, current research is mainly concentrated on the LP cylinder. Namely, the analysis of the flow characteristics of the LP cylinder is complete, especially for the conditions running at low flow rates or high back pressure [12,13,14,15,16]. These studies have indicated that off-flow and backflow phenomena may occur when the flow state is far from the design conditions. A similar situation may also happen if the intermedium-pressure adjustment valve is deeply involved in the adjustment.
In this paper, a 300 MW boiler unit was selected as the research objective to investigate the operational performance of the HP cylinder mainly through a three-dimensional simulation method. Since the normal operational range of steam supply pressure is from 1.7 MPa to 3.4 MPa, three different back pressures were considered, 3.4 MPa, 2.7 MPa, and 1.9 MPa. Particularly, 3.4 MPa is the designed back pressure of the unit under 100% flow condition, 2.7 MPa is the designed back pressure under 80% flow condition, and 1.9 MPa is the designed back pressure under 60% condition. The three back pressures selected are the pressures with no participation from the intermedium-pressure adjustment valve adjustment. In this way, it is convenient to compare the flow state with or without the use of the intermedium-pressure adjustment valve. The aerodynamic flow characteristics of the last five stage cylinder blades were analyzed, including limiting streamline, isentropic efficiency along the blade height, and relative work amounts, thus better determining the safe operation mode when applying the intermedium-pressure adjustment valve in the adjustment for heat supply.

2. Model Description

2.1. Modeling Methods

This paper mainly discusses the aerodynamic performance of the last three stages of dynamic or stator blades under the adjustment of the intermedium-pressure adjustment valve. As shown in Figure 1, considering the flow characteristics of the incoming steam, two stages were added before the last three stage blades in the numerical simulation. In order to ensure stable gas flow at the inlet and outlet and no significant backflow, the inlet and outlet were extended, and the outlet section was directly extended a certain distance along the straight line without considering the influence of the exhaust cylinder.
The internal flow of the steam turbine has the remarkable feature of three-dimensionality, and the requirements for numerical simulation are challenging. The computational fluid dynamics software NUMECA, a highly integrated flow field numerical simulation software suitable for turbomachinery design, was applied to carry out this work. As the first simulation step, the computational model’s grid division was completed using the software module IGG/Autogrid5. Specifically, the thickness of the first layer of grids near the upper and lower end walls is 0.001 mm. The grid structure adopts an H-O-H topological grid, i.e., the inlet section adopts an H-type topological grid, the surrounding blade adopts an O-type topological grid, and the outlet section adopts an H-type topological grid, as shown in Figure 2a. Figure 2b presents the computational domain and mesh schematic diagram.
The complex flow inside the steam turbine should obey a series of physical conservation equations, including mass balance, momentum balance, and energy conservation balance. The turbulence model in this paper adopts the Spalart-Allmaras turbulence model (SA model), and the working medium is considered compressible condensable water vapor, which is based on the IAPWS-IF97 [16] property table.
It should be noted that the number and quality of meshes significantly affect the computational efficiency and the reliability of the calculation results [16,17,18,19]. In order to determine the appropriate number of grids, it is necessary to verify mesh independence. Taking the full load condition as an example (100% rated flow rate), the static outlet pressure is set at 3.4 MPa. The convergence criterion will be satisfied if the difference between the inlet and outlet flow rates is less than 0.05%. The total-total isentropic efficiency for the five-stage blades is defined as the evaluation standard. A total of six different grid schemes were generated, and the number of computational grids ranges from 1.45 million to 4.84 million. The numerical simulation results are shown in Figure 3. When the number of grids exceeds 3.93 million, the variation in the total-total isentropic efficiency tends to be unapparent. Hence, the number of grids is selected as 4.54 million in the following cases to balance the computational time and calculation accuracy.

2.2. Simulation Conditions

The inlet boundary condition is set at total pressure and total temperature, corresponding to the total flow rate. Specifically, the inlet total pressure and inlet total temperature are obtained based on the designed data of the turbine flow. According to the designed inlet pressure, temperature, and velocity, the kinetic energy of the inlet steam is converted into enthalpy, thus obtaining the total temperature and total pressure. In contrast, the outlet boundary condition is set to the given static pressure (back pressure). In total, three back pressures are involved in this paper, 3.4 MPa, 2.7 MPa, and 1.9 MPa. Meanwhile, for each back pressure condition, the effect of flow rate on the aerodynamic performance of the last three stage blades of the HP cylinder was also discussed (the ratio of the actual flow rate to the rated flow rate is defined as the load ratio). The detailed simulation conditions are listed in Table 1. The five load ratios listed in Table 1 are chosen so as to cover all possible load conditions during operation.

3. Results and Discussion

3.1. Flow Field Analysis

The possible flow instability over blade surfaces can be reflected by the limiting streamline [20]. At the 60% load ratio, the flow deterioration occurs at the last stage blade, the penultimate stage blade, and the antepenult stage blade, so that it is convenient to analyze the influence of increasing back pressure on flow conditions. Figure 4 and Figure 5 show the aerodynamic flow characteristics of the last three stage blades when the back pressure is controlled at 3.4 MPa and the load ratio is 60%, involving four types of blade surfaces: the pressure surface of the stator blade (S-P), the suction surface of the stator blade (S-S), the pressure surface of the moving blade (M-P), and the suction surface of the moving blade (M-S).
Figure 6 shows that for the last three stage blades, the flow instability may occur at the root and tip of the moving blade suction surface under almost all working conditions, regardless of the back pressure and load ratio. With the decrease in back pressure, this phenomenon seems more obvious. While the load ratio decreases, the flow separation area on the M-S surface will be smaller.
Flow instability can also happen on the pressure surface of moving blades. As shown in Figure 7, if the load ratio decreases below 70%, the flow instability on the M-P surface starts developing from the last stage blade. Under the 60% load ratio condition, from the blade root to the middle of the last stage blade, the flow disturbance over the M-P surface is evident, and the flow over the penultimate stage blade’s surface becomes unstable at a limited area near the blade tip. When the load ratio is further reduced to 50%, the flow instability on the M-P surface for all three stage blades is significant. As the steam flows to the last stage blade, the flow separation becomes more and more severe, and the aerodynamic loss increases. These results indicate that under the high back pressure of the HP cylinder, it is necessary to maintain the steam flow rate above a specific value. If the flow rate is too low, the flow state will deteriorate, affecting the work of the last three stages, and some safety hazards may exist. This is consistent with the aerodynamic analysis results of the LP cylinder at a small volumetric flow rate. Namely, the secondary flow and flow separation can also occur for the last two stage blades [21,22,23,24].
However, different from the situation with the suction surface of the moving blade, the aerodynamic flow characteristics of the pressure surface are significantly related to the back pressure. Figure 8 and Figure 9 show the limiting streamlines on the S-P and M-P surfaces of the last stage blade with a back pressure of 2.7 MPa and 1.9 MPa, respectively. It can be seen that when the back pressure is 2.7 MPa for the high load conditions (100% and 85% load ratio), the flow separation happens near the head of the S-P surface and the tail edge of the M-P surface, resulting in severe aerodynamic losses. The flow separation on the M-P surface of the last stage blade is only notable once the load ratio decreases to 50%. If the back pressure further drops to 1.9 MPa, the flow on S-P and M-P surfaces will be more stable at each load from an overall point of view, except for some local areas of the moving blade where the flow separation can occur at high loads (10~15% of the blade height, from the root or tip), this may be due to the lower flow rate in these areas compared with other areas on the M-P surface.
Therefore, for the low back pressure, the deterioration of the flow condition needs to be noticed if the total steam flow rate is high. The flow and work conditions at low loads may be acceptable.

3.2. Total-Total Isentropic Efficiency and Work Capacity

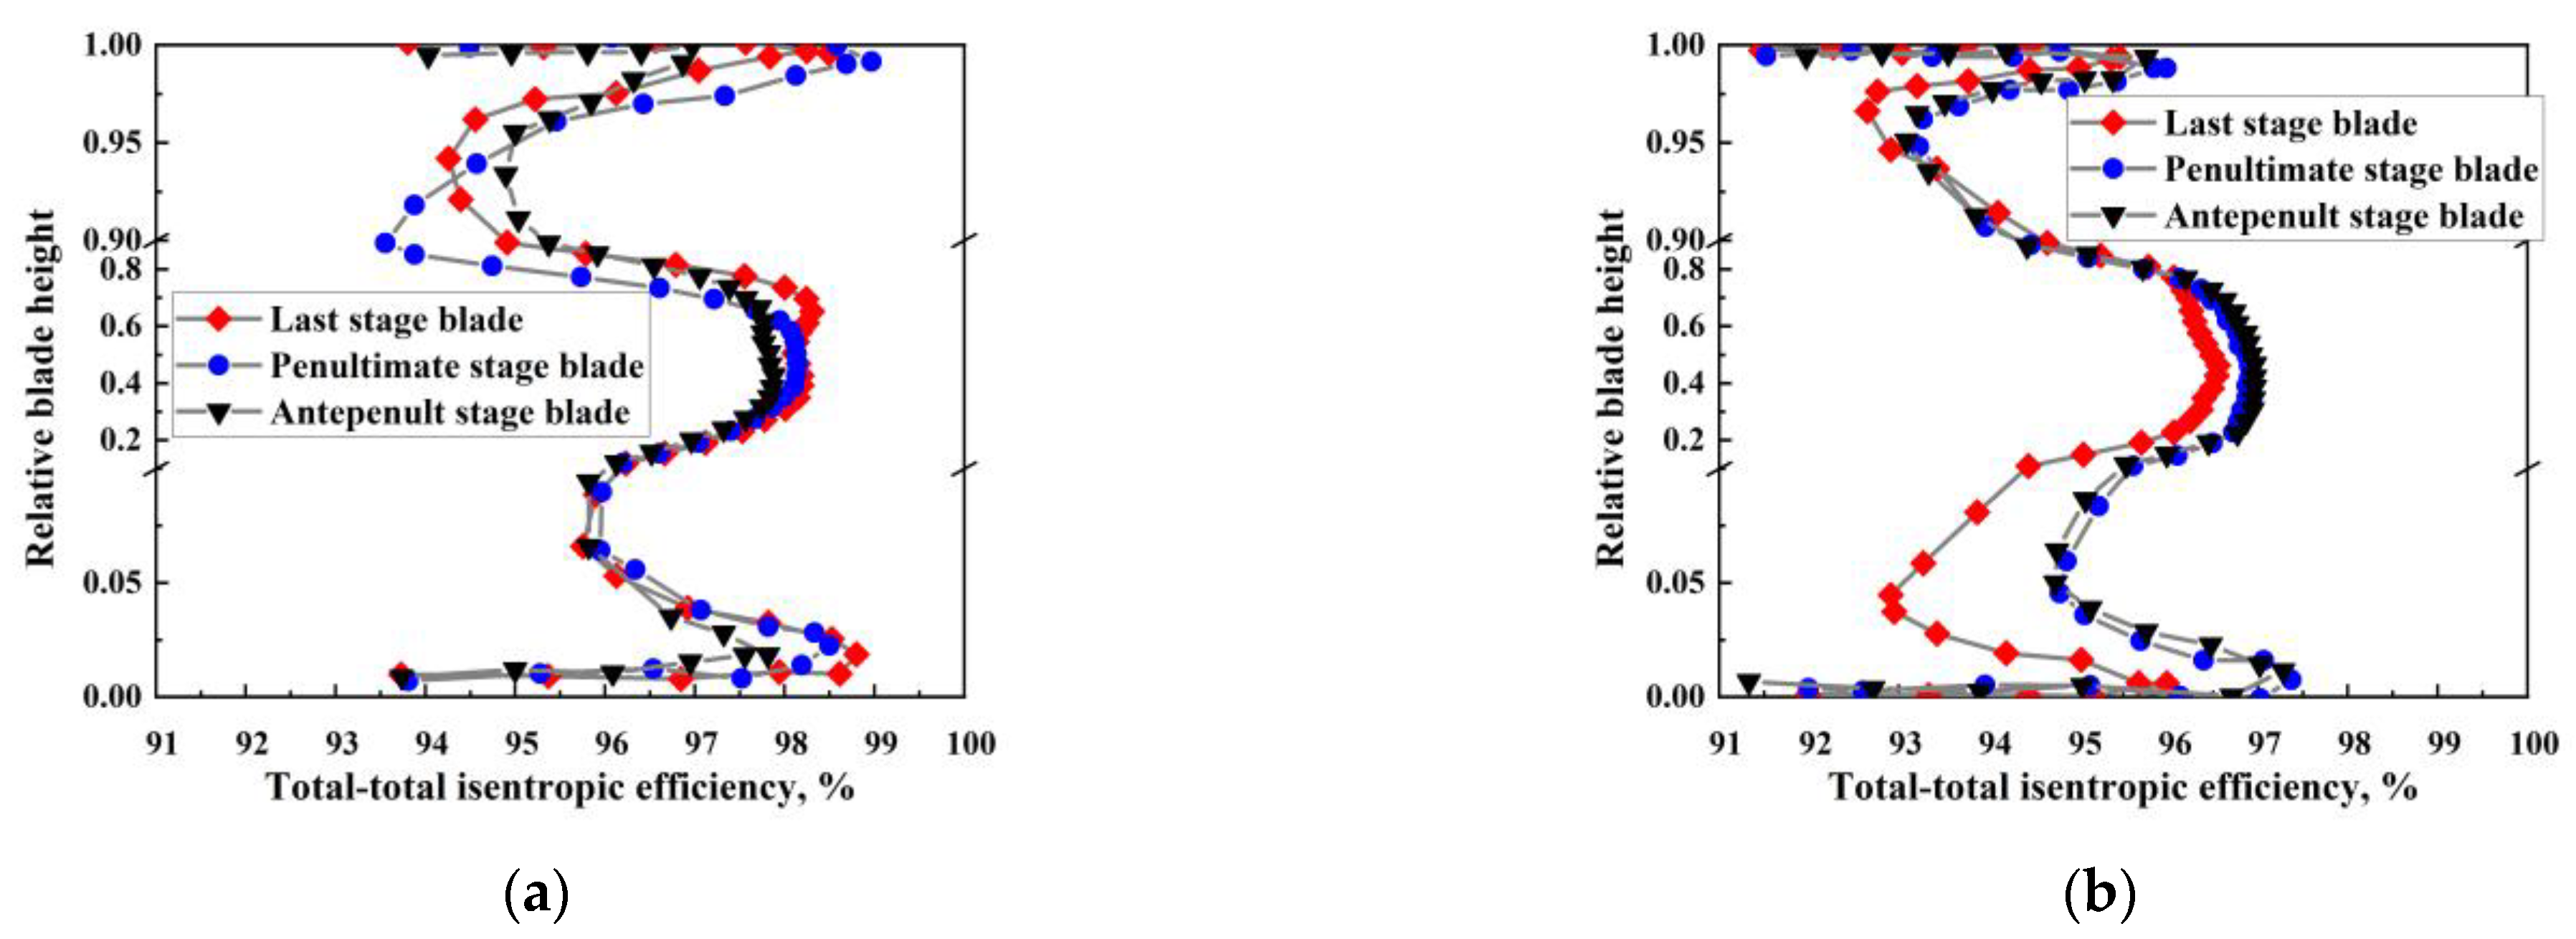
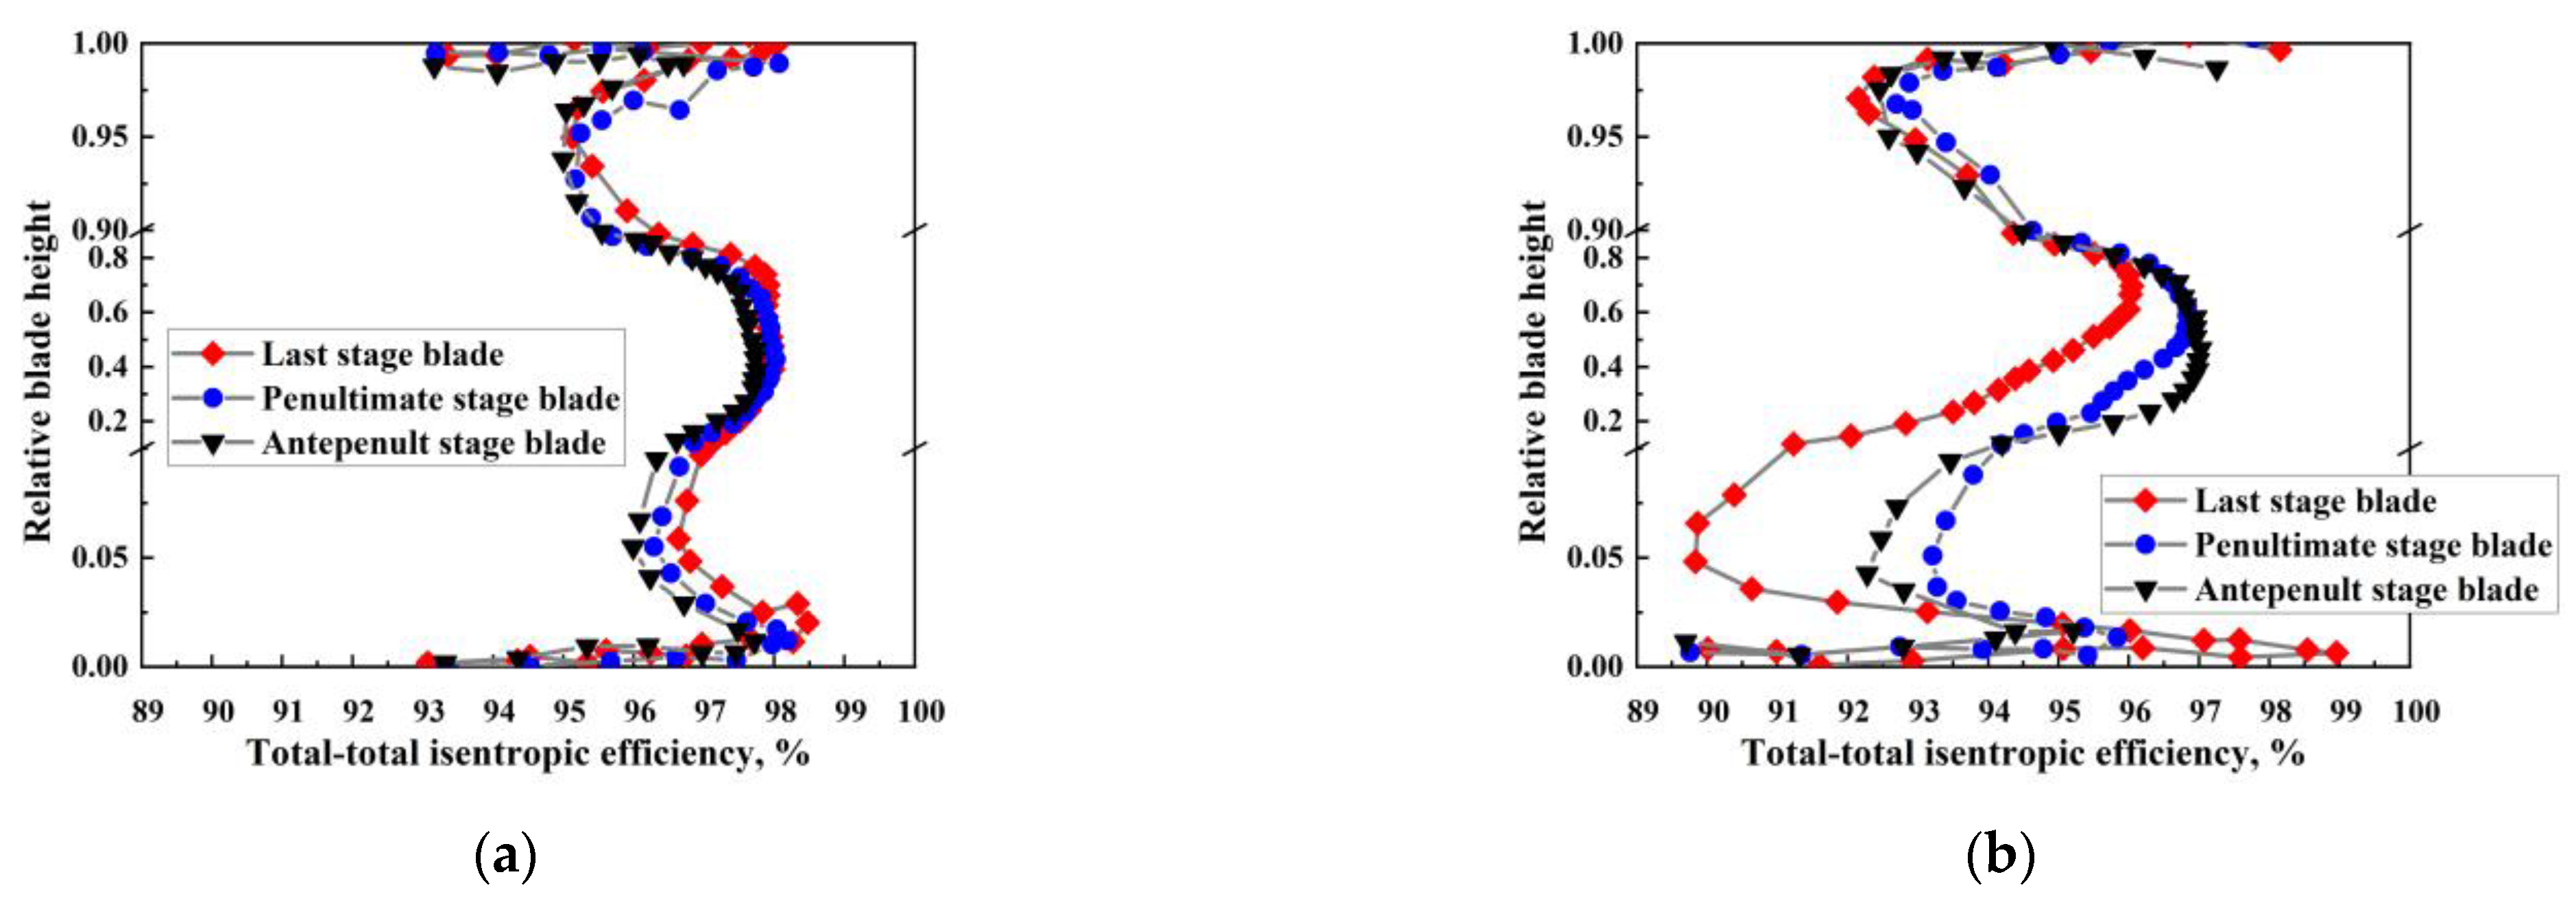
Figure 10 presents the distribution of the total-total isentropic efficiency along the blade height with a back pressure of 2.7 MPa. The distribution law shows a similar trend under the other two back pressure conditions (3.4 MPa and 1.9 MPa), which can be seen in Figure 11 and Figure 12. It can be seen that the total-total isentropic efficiency of the last three stages gradually decreases with the decline in load ratio. The efficiency at the blade root and tip is lower than that at the blade body, which has a close relationship with the flow separation phenomenon existing at both ends of the moving blade.
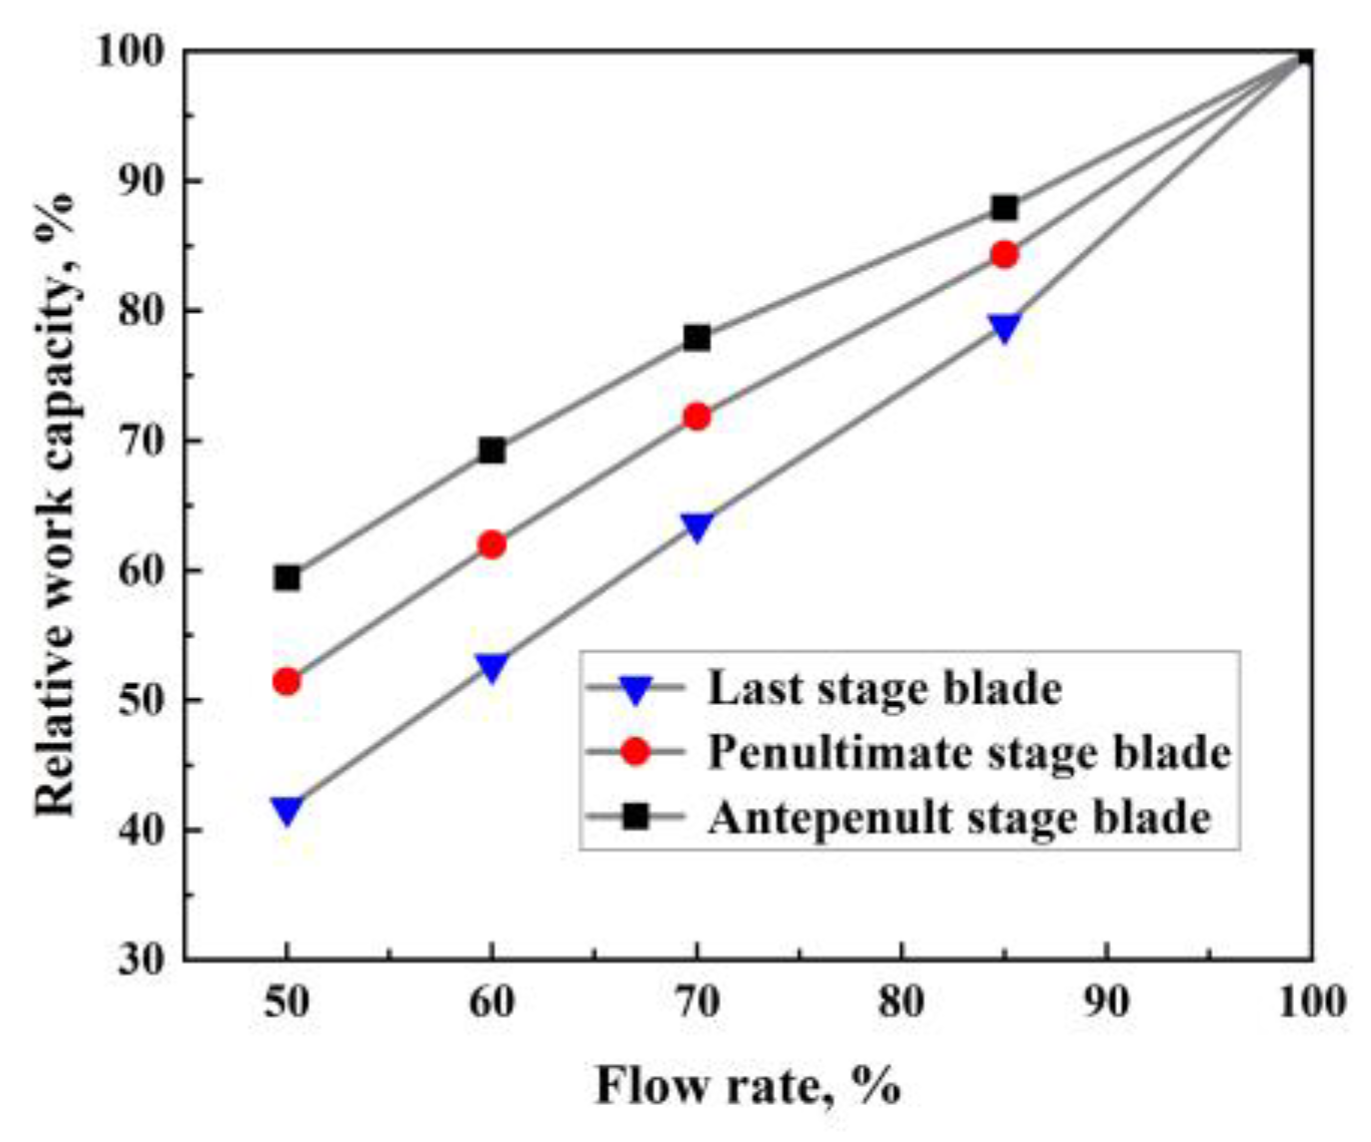
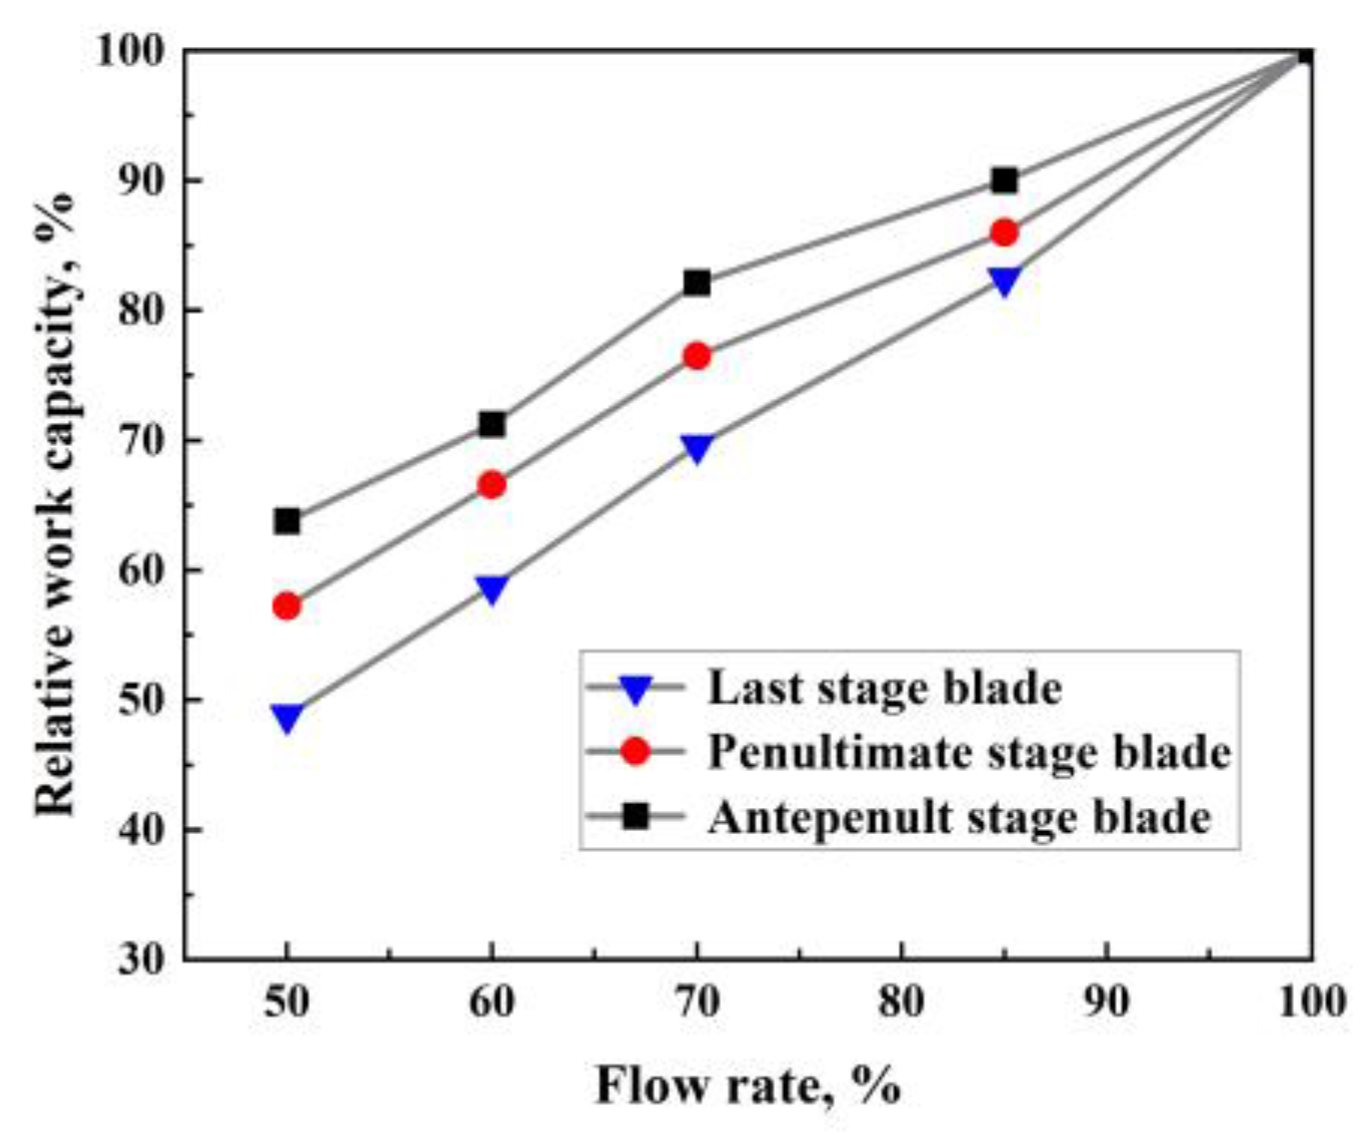
When maintaining a high back pressure condition, as the inlet steam flow decreases, the amount of work performed by the last three stage blades will decrease accordingly, as shown in Figure 13, Figure 14 and Figure 15. Specifically, the work performed by the antepenult stage blade decreases in proportion to the flow rate of the inlet flow. In contrast, the reduction in the amount of work performed by the last two stage blades, especially the last stage blade, is relatively more apparent. For instance, at 50% of the rated flow, the relative work capacity of the last stage blade is only 36.8% of that at full load. This can be ascribed to the deterioration of the working conditions around the last stage blade caused by the flow separation and increasing back pressure. At the same load (50%), when the back pressure drops to 2.7 MPa, the relative work capacity of the last stage blade increases to 41.7%. If the back pressure is further reduced to 1.9 MPa, the relative work capacity of the last stage can increase to 48.8%. This is consistent with the case of limiting streamlines.

3.3. Blade Frequency and Strength

Figure 16 and Figure 17 show the static temperature distribution on the pressure surface of moving blades under different conditions. Simulation results reveal that the back pressure has no significant effect on the surface temperature distribution for each stage blade. While, at the same back pressure, the variation of the surface temperature for the same stage blade is within 60 °C when the load changes.
In this temperature range, the elastic modulus of the blade material changes slightly [24,25,26]. According to Equation (1), the blade frequency is proportional to the square root of the elastic modulus. Hence, it can be inferred that the blade frequency does not change significantly. Namely, within the design load and back pressure range, blade frequency and material strength can ensure safe operation without serious problems.
f E J / ( ρ A )
where f denotes the type A vibration frequency, Hz; E denotes the material elastic modulus, Pa; J denotes the moment of inertia of blade section, kg m 2 ; ρ denotes the material density, kg / m 3 ; and A denotes the blade cross-sectional area, m 2 .

3.4. Control Strategy of High Discharge Pressure under Parameter Adjustment of the Intermedium-Pressure Adjustment Valve

Through the above analysis, it is acknowledged that if the outlet pressure of the HP cylinder is to be maintained at the rated value, the flow state of the last two stage blades will begin to deteriorate when the flow rate drops below 60%. Hence, the operating pressure of the HP cylinder must be reduced. When the back pressure decreases to a lower value, the flow state at significant flow rates deteriorates. Consequently, under different flow rates, to maintain a satisfactory flow state, there should be a safety threshold for the back pressure of the HP cylinder. Namely, this value cannot be too high or too low.
In terms of the actual power plant operation, the back pressure of the HP cylinder is usually controlled based on the ratio between the back pressure of the HP cylinder and the pressure of the turbine regulating stage [27,28,29]. However, this control mode could be more accurate.
The intermediate-pressure adjustment valve is a device used to regulate the pressure between two sections of a system. In the context of the paper, it is used to control the back pressure of the high-pressure cylinder. The principle of operation of the valve is relatively straightforward. When the pressure on the upstream side of the valve exceeds a setpoint, the valve opens to allow fluid to pass through to the downstream side, reducing the pressure differential. When the downstream pressure exceeds a setpoint, the valve will close, preventing further flow. By adjusting the setpoint of the intermediate-pressure adjustment valve, the pressure in the system can be controlled. This, in turn, can be used to regulate the back pressure of the high-pressure cylinder, which affects the performance and efficiency of the system as a whole.
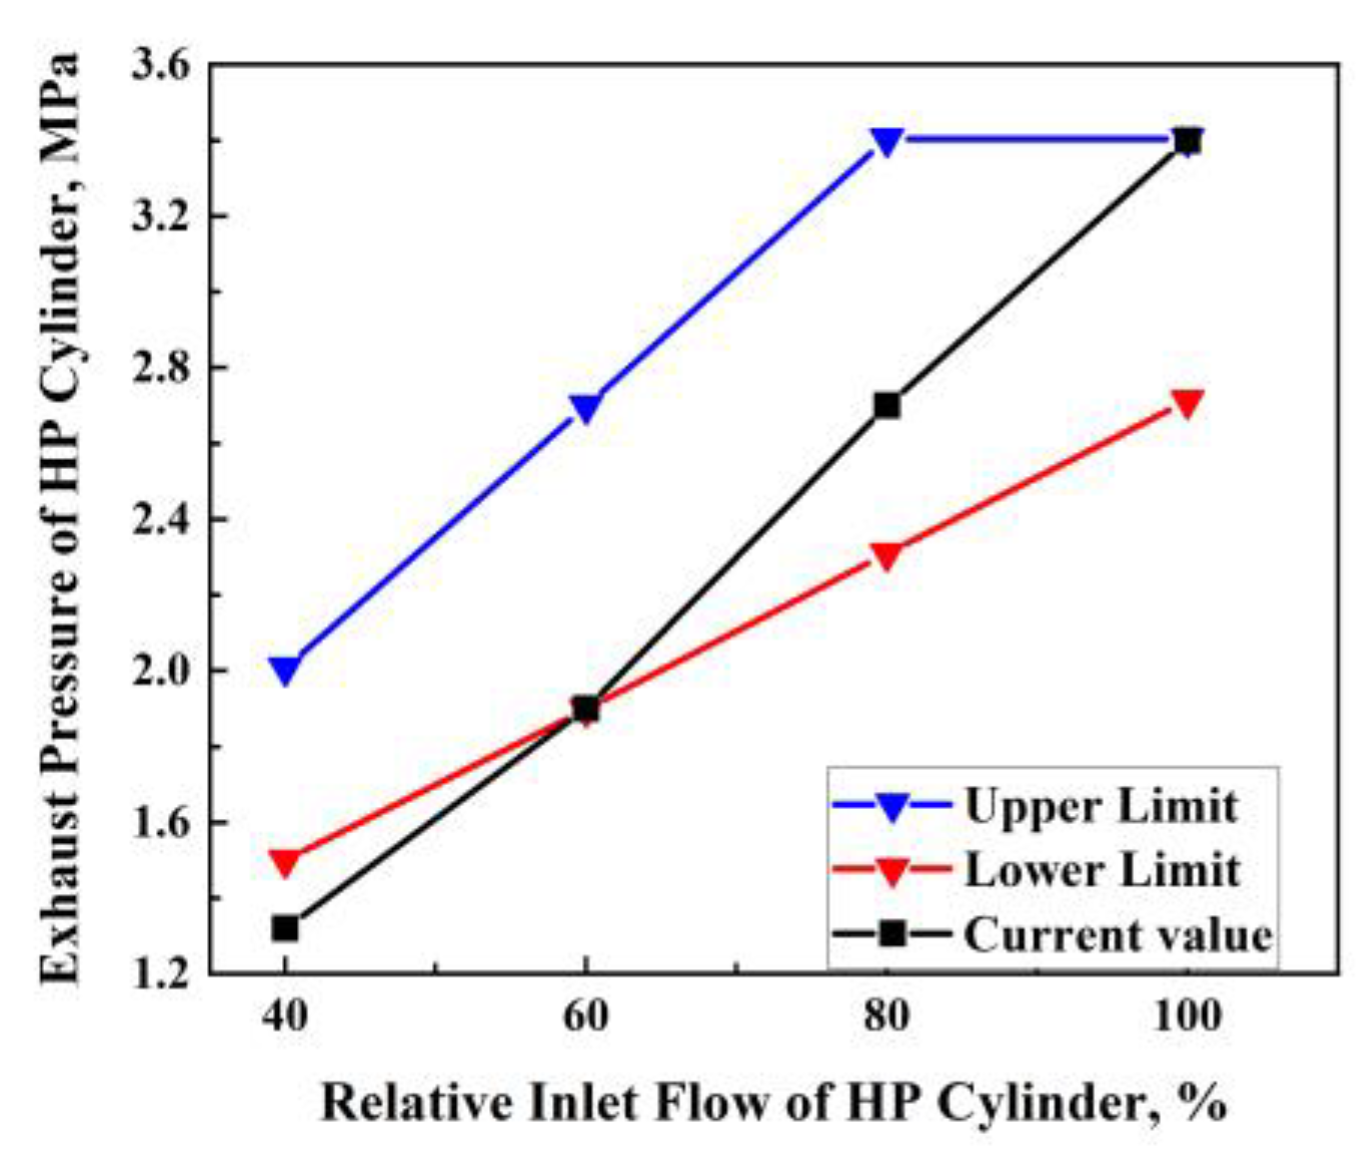
From the aerodynamic performance and safety perspective, this paper proposes a control strategy of the back pressure of the HP cylinder through adjusting the intermediate control value. The upper and lower limits of the back pressure are shown in Figure 18.
The back pressure of the HP cylinder still needs to be constrained by the following three conditions:
(1) The difference between the first-stage extraction pressure ( p 1 ) and exhaust pressure ( p c ) of the HP cylinder shall not exceed this differential pressure with the exact definition under the rated pressure ( Δ p ¯ ), thus preventing the overload of the last stage blade;
(2) The exhaust volume flow of the LP cylinder V( p C , m h ) (related to the extraction pressure p c and the exhaust flow of the HP cylinder m h ) should not exceed a certain proportion (λ) of the volume flow rate under the rated working condition ( V ¯ ), thus preventing the steam flow rate of the reheater from over-speeding;
(3) The operating temperature of thrust bearings ( T t l ) should be lower than a specific limit ( T ¯ tl ); otherwise, the negative thrust exceeds the standard level and the back pressure of the HP cylinder needs to be increased. Meanwhile, ensuring the required minimum flow rate of the medium-pressure cylinder after steam extraction is necessary.
In summary, the back pressure of the HP cylinder is subject to the following constraints:
s . t . { p 1 p c Δ p ¯ V ( p c , m h ) λ V ¯ T t l T ¯ t l
Therefore, according to the aerodynamic analysis, the upper and lower limits of the back pressure of the HP cylinder are obtained. Combined with the above constraints (Equation (2)), the steam extraction pressure at different loads with the participation of the intermedium-pressure adjustment valve can be determined, guiding the relevant unit transformation and safe operation.

4. Conclusions

In order to analyze the aerodynamic flow characteristics of the last five stage cylinder blades of the high-pressure cylinder, including limiting streamline, isentropic efficiency along the blade height, and relative work amounts, three-dimensional calculations were carried out in this paper. The steam turbine of a 300 MW unit was taken as the research objective, and three different back pressures of the HP cylinder were chosen as the simulation cases: 3.4 MPa, 2.7 MPa, and 1.9 MPa.
Results show that when the back pressure is controlled at 3.4 MPa and the inlet steam flow rate is lower than 60%, the flow state of the last stage blade begins to deteriorate. If the inlet steam flow rate is further reduced to 50%, the deterioration will happen on the last three stage blades. When the back pressure decreases to 2.7 MPa, the flow state at low flow rates can be improved. However, if the back pressure is reduced to 1.9 MPa, flow instability may occur at the root and tip of the moving blade suction surface for almost all working conditions. Meanwhile, the flow is stable on the pressure surface of the moving blade and the surface of the stator blade. In addition, with the decrease in flow rate, the flow separation area on the suction surface of the moving blade decreases, and the flow stability improves.
As the load decreases, the total-total isentropic efficiency of the last three stage blades gradually decreases. The efficiency at the blade root and tip is lower than that at the blade body. This is due in large part to the flow separation phenomenon on moving blades. The distribution of the total-total isentropic efficiency of the last three stages along the blade height shows a similar trend under different back pressures.
According to the temperature field data, the static temperature distribution on the blade surface under different back pressures is similar at the same load. When the back pressure stays the same, the surface temperature variation with load for the same blade is about 60 °C. Within this temperature variation range, the elastic modulus of the blade material changes little, and the blade frequency and material strength can ensure safe operation.
Based on the above analysis, the upper and lower limits, and corresponding constraints of the back pressure of the HP cylinder are suggested for various working conditions, which can provide relevant guidance for the design and safe operation of the steam supply related to the intermedium-pressure adjustment valve. Through adjusting the intermedium-pressure adjustment valve, a specific supply capacity of the unit can also be satisfied at the lower load. For example, when the back pressure of the HP cylinder is 2.7 MPa, the minimum steam load of the unit can be reduced from 80% to 60% with the participation of the intermedium-pressure adjustment valve, which is conducive to the peak regulation of the unit.

Author Contributions

Conceptualization, P.Z. and X.K.; methodology, P.Z.; software, X.L.; validation, P.Z., X.K. and X.L.; formal analysis, W.W.; investigation, P.Z.; resources, P.Z.; data curation, P.Z.; writing—original draft preparation, X.K.; writing—review and editing, X.T.; visualization, X.K.; supervision, P.Z.; project administration, P.Z.; funding acquisition, X.K; validation, Q.T.; resources, J.L. All authors have read and agreed to the published version of the manuscript.

Funding

This work was supported by the Key Project of the National Fourteen-Five Year Research Program of China: (2022YFB4100805).

Conflicts of Interest

The authors declare no conflict of interest.

References

  1. Cui, Y.; Chen, Z.; Yan, G.G.; Tang, Y.H. Coordinated wind power accommodating dispatch model based on electric boiler and CHP with thermal energy storage. Proc. CSEE 2016, 36, 4072–4081. [Google Scholar]
  2. Deng, T.Y.; Tian, L.; Liu, J.Z. Thermal and electric load coupling analysis and decoupling coordinated control in heat supply units. J. Syst. Simul. 2017, 29, 2593–2599. [Google Scholar]
  3. Ju, W.P.; Lyu, K.; Ma, T.S.; Yang, R.Z.; Gu, W.W. Comparison of thermo-electric decoupling techniques for heating units. Therm. Power Gener. 2018, 47, 115–121. [Google Scholar]
  4. Ye, X.D.; Zhao, H.; Luo, F.Q. A Heating System and Method for Cutting Off the Intake Steam of the Low-Pressure Cylinder. China Patent CN107013262A, 26 May 2017. [Google Scholar]
  5. Xi, S.P. 200MW three-cylinder three-row steam turbine low-pressure cylinder “zero power” operation extracts steam for heating. China Plant Eng. 2018, 16, 125–126. [Google Scholar]
  6. Xi, S.P. Application of retrofit technology of optical axis and cylinder cutting in heating unit. Plant Maint. Eng. 2018, 17, 105–107. [Google Scholar]
  7. Deng, X.Y.; Yang, H.; Zhang, H.W. Numerical analysis of two-stage three-dimensional viscous flow field at the end of low-pressure cylinder of steam turbine under the condition of small flow rate. In Proceedings of the 2004 Conference on Aerodynamic Thermodynamics of Heat Engines of the Chinese Society of Engineering Thermophysics, Xi’an, China, 1 October 2004; pp. 263–268. [Google Scholar]
  8. Xin, Z.G. Study on reconstruction scheme and application of bypass heating for 320MW unit. Electr. Eng. 2022, 181–184. [Google Scholar] [CrossRef]
  9. Hu, K.; Chen, Q. Overall energy efficiency and flexibility retrofit scheme analysis of heat-power integrated energy system. Therm. Power Gener. 2018, 47, 14–21. [Google Scholar]
  10. Ruan, J.; Duan, W.Q. Test on adjustment characteristics of adjustment door in heat reheating of 1000M steam turbine. Power Oper. 2020, 10, 94–96, 144. [Google Scholar]
  11. Yuan, B.; Huang, S.W. Research on high-flow heating control strategy of 330MW units based on medium pressure combined with valves. Power Energy 2021, 42, 461–464. [Google Scholar]
  12. Madhavan, S.; Rajeev Jain, C.; Sujatha, A.S. Vibration based damage detection of rotor blades in a gas turbine engine. Eng. Fail. Anal. 2014, 46, 26–39. [Google Scholar] [CrossRef]
  13. Dutta, A.; Rama Rao, B.K. Blade vibration triggered by low load and high back pressure. Eng. Fail. Anal. 2014, 46, 40–48. [Google Scholar]
  14. Carrera, E.; Filippi, M.; Zappino, E. Free vibration analysis of rotating composite blades via Carrera Unified Formulation. Compos. Struct. 2013, 106, 317–325. [Google Scholar] [CrossRef]
  15. Lau, R.C.K.; Leung, R.M.C.; So, Y.L. Vortex-induced vibration effect on fatigue life estimate of turbine blades. J. Sound Vib. 2007, 307, 698–719. [Google Scholar] [CrossRef]
  16. Wagner, W.; Kretzschmar, H.J. International Steam Tables: Properties of Water and Steam Based on the Industrial Formulation IAPWS-IF97; Springer: Berlin/Heidelberg, Germany, 2008; pp. 7–150. [Google Scholar]
  17. Pennacchi, P.; Chatterton, S.; Bachschmid, N.; Pesatori, E.; Turozzi, G. A model to study the reduction of turbine blade vibration using the snubbing mechanism. Mech. Syst. Signal Process. 2010, 25, 1260–1275. [Google Scholar] [CrossRef] [Green Version]
  18. Li, J.J.; Xu, Y.H.; Wang, W.; Zhang, Y.H. Influence of turbulence model on numerical simulation of axial compressor. J. Nanchang Hangkong Univ. (Nat. Sci.) 2017, 31, 12–19. [Google Scholar]
  19. Liang, X.; Tian, Z.F. Combined compact upwind difference schemes for Navier-Stokes equations. Chin. J. Comput. Phys. 2008, 6, 659–667. [Google Scholar]
  20. Yamada, K.; Funazaki, K.; Furukawa, M. The behavior of tip clearance flow at near-stall condition in a transonic axial compressor rotor. In Proceedings of the ASME Turbo Expo 2007: Power for Land, Sea, and Air, Montreal, QC, Canada, 14–17 May 2007; Paper No. GT2007-27725. pp. 295–306. [Google Scholar]
  21. Zeng, X.Q.; Zhu, B.; Cai, H. Three-dimensional viscosity numerical simulation and performance comparison of two types of steam turbine low pressure cylinder final stages under small volume flow conditions. In Proceedings of the 2001 Conference on Aerodynamic Thermodynamics of Heat Engines of the Chinese Society of Engineering Thermophysics, Nanjing, China, 1 January 2001; p. 157. [Google Scholar]
  22. Wang, Z.B.; Ning, Z.; Zhao, Y.; Zhang, L.; Shi, Q. Testing and study of last stage flowing characteristics of dry cooling type 200MW steam turbine. Electr. Power 1997, 3, 41–43, 68. [Google Scholar]
  23. Zhu, X.C.; Wang, H.T.; Zhou, D.W. Numerical study of off-design on LP casing of steam turbine. Therm. Turbine 2008, 37, 51–53. [Google Scholar]
  24. Liu, J.J.; Cui, Y.Q.; Jiang, H.D. Investigation of flow in steam turbine exhaust hood with/without turbine exit conditions simulated. ASME J. Eng. Gas Turbines Power 2003, 125, 292–298. [Google Scholar] [CrossRef]
  25. Fu, J.L.; Zhou, S.J.; Liu, J.J. Experimental and numerical investigation of interactions between axial turbine and non-axisymmetric exhaust hood. In Proceedings of the ASME Turbo Expo 2008: Power for Land, Sea, and Air, Berlin, Germany, 9–13 June 2008; Paper No. GT2008-50766. pp. 1265–1278. [Google Scholar]
  26. Luis, T. New supersonic loss model for the preliminary design of transonic turbine blades and the influence of pitch. J. Turbomach. 2020, 142, 1–45. [Google Scholar]
  27. Rehman, A.; Liu, B.; Asghar, M.M. Secondary flow and endwall optimization of a transonic turbine. Energies 2019, 12, 4103. [Google Scholar] [CrossRef] [Green Version]
  28. Liu, C.; Geng, L.X.; Wang, H.; Miao, H.Q.; Shang, Z.B.; Zeng, L.F. Control strategy in transformation of high and low pressure bypass combined heat supply. Therm. Power Gener. 2020, 49, 126–132. [Google Scholar]
  29. Acosta-López, J.G.; Blasetti, A.P.; Lopez-Zamora, S.; de Lasa, H. CFD modeling of an H-Type Darrieus VAWT under high winds: The vorticity index and the imminent vortex separation condition. Processes 2023, 11, 644. [Google Scholar] [CrossRef]
Figure 1. Model structure.
Processes 11 01214 g001
Figure 2. Schematic diagram of model mesh: (a) H-O-H topology; (b) computational grid.
Processes 11 01214 g002
Figure 3. Grid independence verification.
Processes 11 01214 g003
Figure 4. Limiting streamlines of the pressure surface on the last three stage blades of the HP cylinder (3.4 MPa back pressure, 60% load ratio).
Processes 11 01214 g004
Figure 5. Limiting streamlines of the suction surface on the last three stage blades of the HP cylinder (3.4 MPa back pressure, 60% load ratio).
Processes 11 01214 g005
Figure 6. Limiting streamlines on the M-S surface at different loads and back pressures (penultimate stage blade).
Processes 11 01214 g006
Figure 7. Limiting streamlines on the M-P surface at different loads (3.4 MPa back pressure): (a) Last stage blade; (b) penultimate stage blade; (c) antepenult stage blade.
Processes 11 01214 g007
Figure 8. Limiting streamlines on S-P and M-P surfaces at different loads (2.7 MPa back pressure, last stage blade).
Processes 11 01214 g008
Figure 9. Limiting streamlines on S-P and M-P surfaces at different loads (1.9 MPa back pressure, last stage blade).
Processes 11 01214 g009
Figure 10. Distribution of the total-total isentropic efficiency along the blade height (2.7 MPa back pressure): (a) 100% load ratio; (b) 50% load ratio.
Processes 11 01214 g010
Figure 11. Distribution of the total-total isentropic efficiency along the blade height (3.4 MPa back pressure): (a) 100% load ratio; (b) 50% load ratio.
Processes 11 01214 g011
Figure 12. Distribution of the total-total isentropic efficiency along the blade height (1.9 MPa back pressure): (a) 85% load ratio; (b) 60% load ratio; (c) 40% load ratio.
Processes 11 01214 g012
Figure 13. Amount of work performed by the last three stage blades (3.4 MPa back pressure).
Processes 11 01214 g013
Figure 14. Amount of work performed by the last three stage blades (2.7 MPa back pressure).
Processes 11 01214 g014
Figure 15. Amount of work performed by the last three stage blades (1.9 MPa back pressure).
Processes 11 01214 g015
Figure 16. Static temperature distribution on M-P surfaces with different back pressures (70% load ratio).
Processes 11 01214 g016
Figure 17. Static temperature distribution on M-P surfaces at different loads (2.7 MPa back pressure).
Processes 11 01214 g017
Figure 18. Upper and lower limits on back pressure of HP cylinder, as well as value of back pressure and relative inlet flow in the current simulation.
Processes 11 01214 g018
Table 1. Boundary conditions for each calculation case.
(a) 3.4 MPa back pressure
Load ratio/%10085706050
Inlet total pressure/MPa6.8276.0515.4315.0434.678
Inlet total temperature/K677.45673.85688.05697.15709.85
(b) 2.7 MPa back pressure
Load ratio/%10085706050
Inlet total pressure/MPa6.3755.5744.9354.5294.143
Inlet total temperature/K668.05662.65675.45682.95693.75
(c) 1.9 MPa back pressure
Load ratio/%8570605040
Inlet total pressure/MPa5.0804.4113.9843.5753.156
Inlet total temperature/K650.35660.95666.35674.75682.15
Disclaimer/Publisher’s Note: The statements, opinions and data contained in all publications are solely those of the individual author(s) and contributor(s) and not of MDPI and/or the editor(s). MDPI and/or the editor(s) disclaim responsibility for any injury to people or property resulting from any ideas, methods, instructions or products referred to in the content.