Article

Electrochemical Surface Treatment for Tailored Porous Structures

1
Inorganic Membranes and Membrane Reactors, Sustainable Process Engineering, Chemical Engineering and Chemistry, Eindhoven University of Technology, 5612 AP Eindhoven, The Netherlands
2
Flemish Institute for Technological Research, VITO NV, 2400 Mol, Belgium
3
Faculty III Process Sciences, Institute of Material Science and Technology, Chair of Advanced Ceramic Materials, Technische Universität Berlin, Straße des 17. Juni 135, 10623 Berlin, Germany
*
Authors to whom correspondence should be addressed.
Processes 2023, 11(4), 1260; https://doi.org/10.3390/pr11041260
Submission received: 28 February 2023 / Revised: 15 April 2023 / Accepted: 16 April 2023 / Published: 19 April 2023

Abstract

:
Plasma electrolytic oxidation (PEO) was used to establish a porous metal oxide layer on various titanium and zirconium workpieces in the form of wires, porous tubes, and 3D-printed structures. The ultimate goal of the work was to create a layer with the desired characteristics over a catalyst support or metal membrane structures to improve the performance of the targeted high-temperature catalytic conversion or separation applications. In doing so, it was ensured that the PEO-treated layer could provide the desired morphology, thickness, and porosity needed for the final processing step, which is usually a conventional coating method. This addresses the limitations of ceramic structures, including their mechanical resistance, thermal resistance, and conductivity, and their potential for being functionalized and utilized for high-temperature applications. The entire experimental run was carried out using a 2 kilowatt (maximum output) AC-power source with a maximum current limit of 6.5 Ampere while applying a constant potential (potentiostatic) and monitoring the current fluctuation. Depending on the surface areas of the PEO-treated samples, the applied potential ranged from 200 V to 260 V. The surface features of the fresh and PEO-treated composites, including their morphology and phases, were studied using conventional characterization techniques such as SEM, EDX, and XRD. The time required to observe the spark discharge was shortened by tuning the PEO parameters, such as gradually increasing the applied potential. This, in turn, allowed for longer surface treatment and, eventually, more control over the surface texture. The EDX analysis of the elemental composition of the PEO-treated surface indicated that the contribution of the electrolyte-deposited components increases when increasing the voltage and is accompanied by an increase in the extent of oxidation. The titanium samples displayed relatively intense discharges, especially in comparison to the Zirconium wires. The PEO-treated samples were coated via standard wet-coating techniques.

1. Introduction

Plasma Electrolytic Oxidation (PEO), also referred to as Micro Arc Oxidation (MAO), is a surface modification technique through which strongly adherent porous metal oxide layers can be formed on the surface of certain so-called ’valve metals’ and their alloys [1]. The porous layer produced by this technique is in the multi-micrometer thickness range, and the required potential and current are significantly higher than the ones needed in anodization, which is a better-known technique in the field of the surface modification of metals. In the case of a potentiostatic mode of PEO operation, the applied potential should be higher than the dielectric breakdown potential of the metal workpiece being treated by submerging it in an electrolyte solution. This results in the formation of plasma spark discharges, which spread all across the surface of the workpiece, enabling the formation of relatively thick, porous, hard, and strongly adherent oxide coatings of the same processed metal. This technique is usually applied to valve metals that have a high affinity to oxidation [2]. There are not many reports on the application of PEO for catalyst support and membrane applications, which is the primary focus of the current research. Most of the published reports on catalysts and porous material are in the area of photocatalysts and bio- and medical applications. However, there are many reports on the PEO treatment of materials that can be used for such applications such as aluminum [3,4,5,6,7], magnesium [8,9,10,11,12], tantalum [13,14], zirconium [15,16,17,18,19], titanium [20,21,22,23,24,25,26,27,28,29,30,31,32,33,34,35,36,37,38,39,40,41,42] as well as their alloys that have not necessarily been tested for catalyst and membrane applications.
The characteristics of a PEO-treated surface can be tailored by tuning the applied processing parameters, specifically the potential, current and electrolytic composition. This enhances the potential of using PEO to fabricate supports for catalytic or membrane structures. These have been investigated previously for different materials [43,44,45], including the targeted materials in this research, e.g., titanium, for catalytic photoactive coatings [46]. However, it should be highlighted that titanium and zirconium have been selected as the main substrate for the catalytic supports in this research due to their desired characteristics of physical, chemical, structural, and thermal conductivity for the targeted high-temperature applications.
For membrane applications, PEO can be used to produce an adherent coating, which can also contribute to determining the effective porosity and permeation of metal membranes, especially for high-temperature membrane applications. For instance, metal-supported membranes can be used for high-temperature carbon dioxide and oxygen separation, such as in situ gas separation from steel mill gas [47], or membrane reactors, such as methane activation processes [48,49,50,51]. In particular, for oxidative coupling of methane (OCM) membrane reactors, ceramic membranes such as α-alumina (Al2O3) membranes with [50,51,52,53] and without [48,49,54,55,56,57,58,59,60] an oxygen-permselective membrane layer have been utilized. Inorganic membranes have been extensively used for high-temperature gas separation applications, comprehensive reviews of which have been provided elsewhere [54,61]. In fact, based on the selectivity and degree of permeation of gases through the membranes, either permselective or porous membranes can be utilized. Among various types of membranes, porous metal membranes have distinguished potential to be used either as a distributor or as a support for an additional perm-selective ceramic layer for high-temperature applications. For instance, for the OCM membrane reactor, metal membranes provide a relatively higher sealing potential, are better able to withstand thermal shocks, and have easier construction and maintenance due to their non-brittle nature compared to conventional ceramic membranes [49,54]. This study systematically analyzes the potential of the PEO technique for establishing the oxide layer by employing titanium and zirconium with the desired characteristics for high-temperature catalytic and membrane applications.
For catalyst and membrane applications, the porosity of the oxide coatings plays a significant role because the physical and material characteristics of the coated surface and its porous structure (such as the oxide deposition amount, strength, and thickness) are correlated with their ultimate expected performance, such as gas permeability. For instance, several approaches have been used to study the porosity of oxide coatings on various types of aluminum alloys while adjusting various process parameters, such as electrode distance, applied current density, and process time [62,63].
The PEO treatment technique has been conventionally applied to workpieces of discs and plate geometries. However, it has also been applied to unconventional shapes, as has especially been reported in biomedical applications, even for porous substrates [64,65,66,67]. It can also be applied to workpieces with different geometries, such as wires, tubular structures [68,69], and even 3D-printed structures. These are the structures particularly studied in this research to obtain the desired mechanical-thermal-chemical characteristics of the targeted membrane and catalytic applications. Some of the samples used are slightly more difficult to treat due to a phenomenon called the ‘shielding effect’, which is caused by the formation of a potential difference between the inner and outer surface of the tubular workpieces, for instance. Wire-type workpieces are relatively easier to treat due to the lower individual wire surface area as well as the possibility of treating a large number of wires at the same time, for instance, in the form of wire bundles. In fact, such bundles can be further processed and utilized in this form in a catalytic bed reactor providing enhanced thermal performance, lower pressure drop, and ultimately improved catalytic performance. Similarly, 3D-printed workpieces offer good potential for treatment with the PEO process and can be tailored for catalytic applications.

2. Materials and Methods
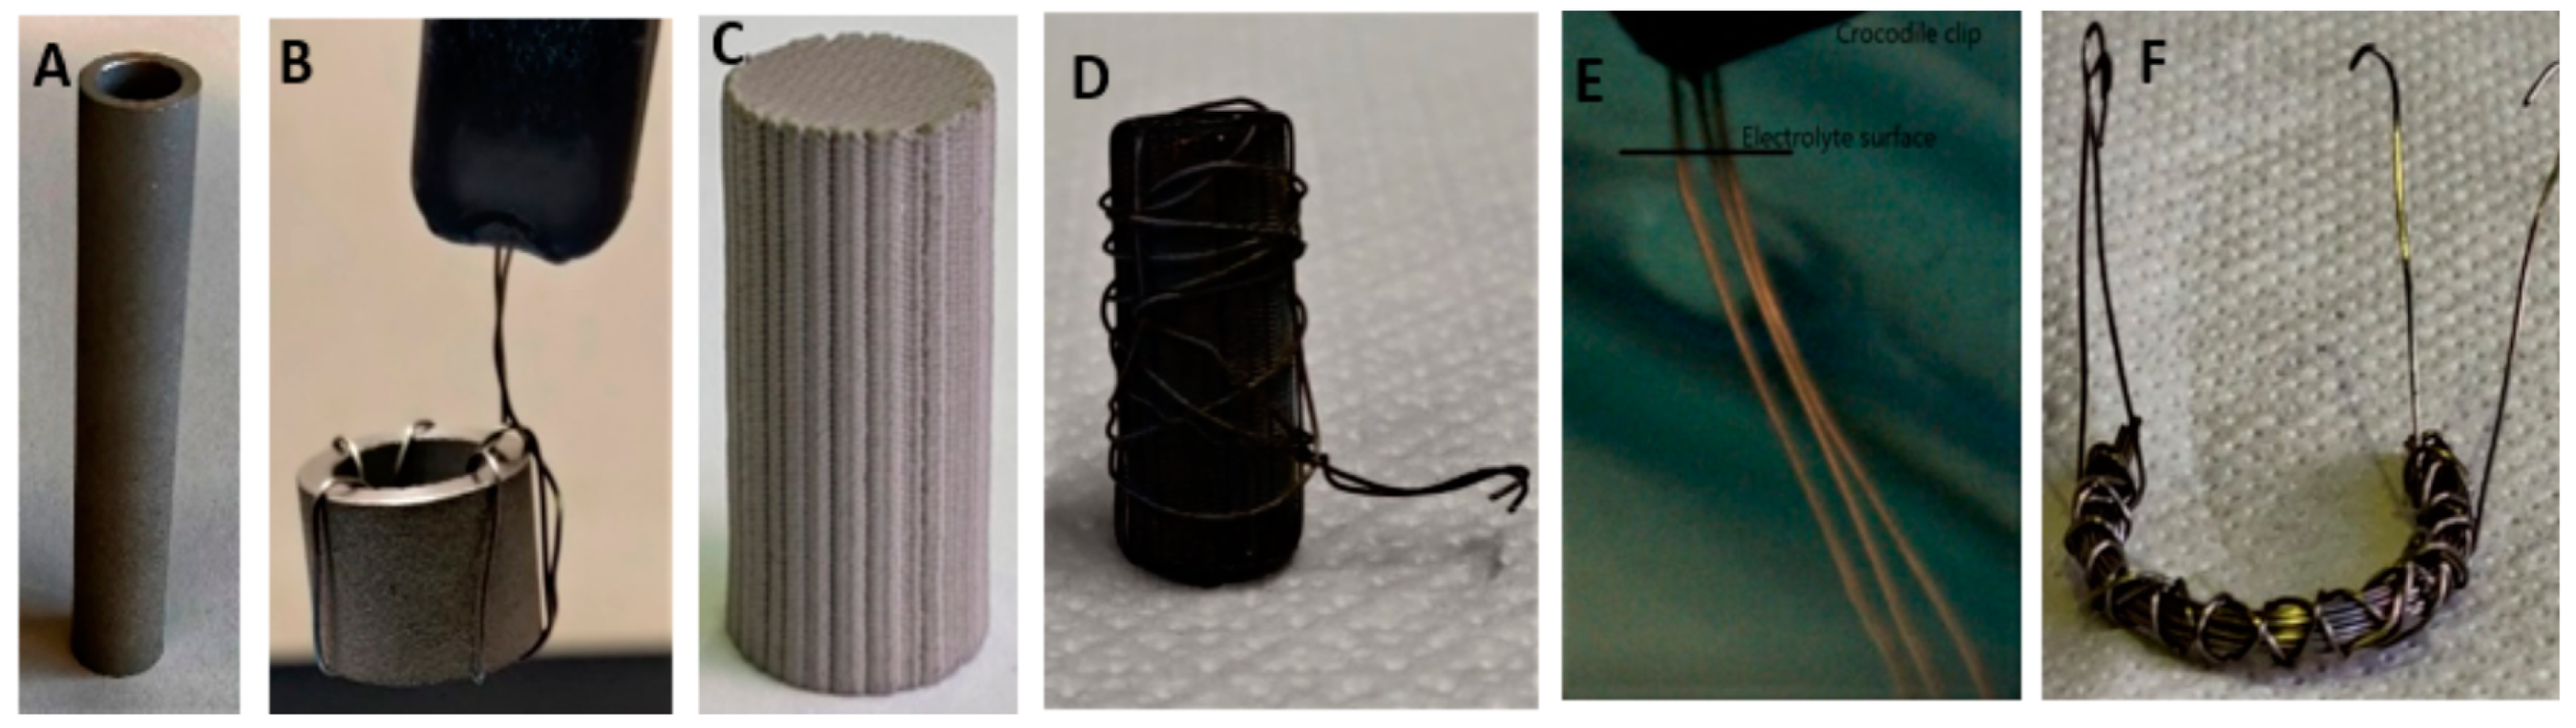
2.1. Materials

The main focus of this research is on the PEO treatment of metal supports for high-temperature catalytic and membrane applications. Therefore, the selected metal for the support had to possess a high melting point and thermal conductivity. The targeted applications in this research are the energy-intensive exothermic catalytic methane oxidative activation operation of OCM [48,49], CO2-hydrogenation, and the in situ CO2-removal from CO2-rich hot-gas streams [47,59]. Using metal substrates and supports for these applications offers potential benefits such as being able to effectively assemble and seal the membranes, as well as establishing the desired thermal characteristics for such high-temperature exothermic catalytic reactions via controlling the intensity of the reaction and its associated thermal aspects across the catalytic bed. Titanium and zirconium are among the materials which can be PEO-treated for such applications using the available extensive research experience on the PEO treatment of titanium and zirconium. Titanium alloys have demonstrated high-temperature oxidation resistance for temperatures beyond 750 °C [70,71,72]. Zirconium has a high melting point and is more readily available than other metals with high melting points, such as tantalum which can also be PEO treated. The most common oxide layers that are coated utilizing a mix of PEO and conventional coating techniques are titania, zirconia, alumina, and silica; these materials can be utilized to customize membrane and catalytic structures.
For the membrane applications, porous titanium tubes purchased from Stanford Advanced Materials (United States of America) with the properties summarized in Table 1 were used as workpieces.
Due to the large surface area of the tubular samples, they were cut from 10 cm long tubes to 2 cm pieces to improve their workability.
For the catalyst applications, wires of titanium and zirconium were provided by the Nanjing Youtian Metal Technology Co., Ltd. (Nanjing, China) and used as the support material. They were delivered as spools, and for experimentation, wire, as well as wire bundles, were prepared in 4 cm long samples. The bundle samples comprised 20 individual wires of either titanium or zirconium. The thicknesses of the titanium and zirconium wire samples were 300 µm and 250 µm, respectively. Further specifications of the original samples are provided in Appendix A. Photos of the prepared and treated samples are shown in Figure 1.
Titanium cylinders were manufactured by the Flemish Institute for Technological Research (VITO, Belgium) using a high-end nSrypt 3D-450HP printer and a modified printing ink which has been previously described [73]. The 3D-printed titanium scaffolds were treated by PEO for the ultimate catalyst application. The length, strut, and channel size of the scaffold samples with cubic unit cells were approximately 2 cm, 800 µm, and 1 mm, respectively. Figure 1 shows a photo of the untreated sample and the PEO-treated samples in the form of a 3D-printed scaffold and porous tube, which were attached to the anode using a titanium wire.
Two types of electrolytes were used during experimentation. Both electrolytes were dilute aqueous solutions containing additional Potassium Hydroxide (KOH) to increase the electrolytic conductivity. As shown in Table 2, the solutions were created using progressively increasing molarity (E1, E2, and E3). Sodium Metasilicate (Alfa Aesar) and Sodium Aluminate (Sigma Aldrich) were chosen as electrolytes as they are known [74] to possess strong passivating tendencies on valve metals and are often used in the PEO processing of titanium.

2.2. Experimentation

The experimental setup used in this research, along with the process parameters and characterization techniques, are described in this section.

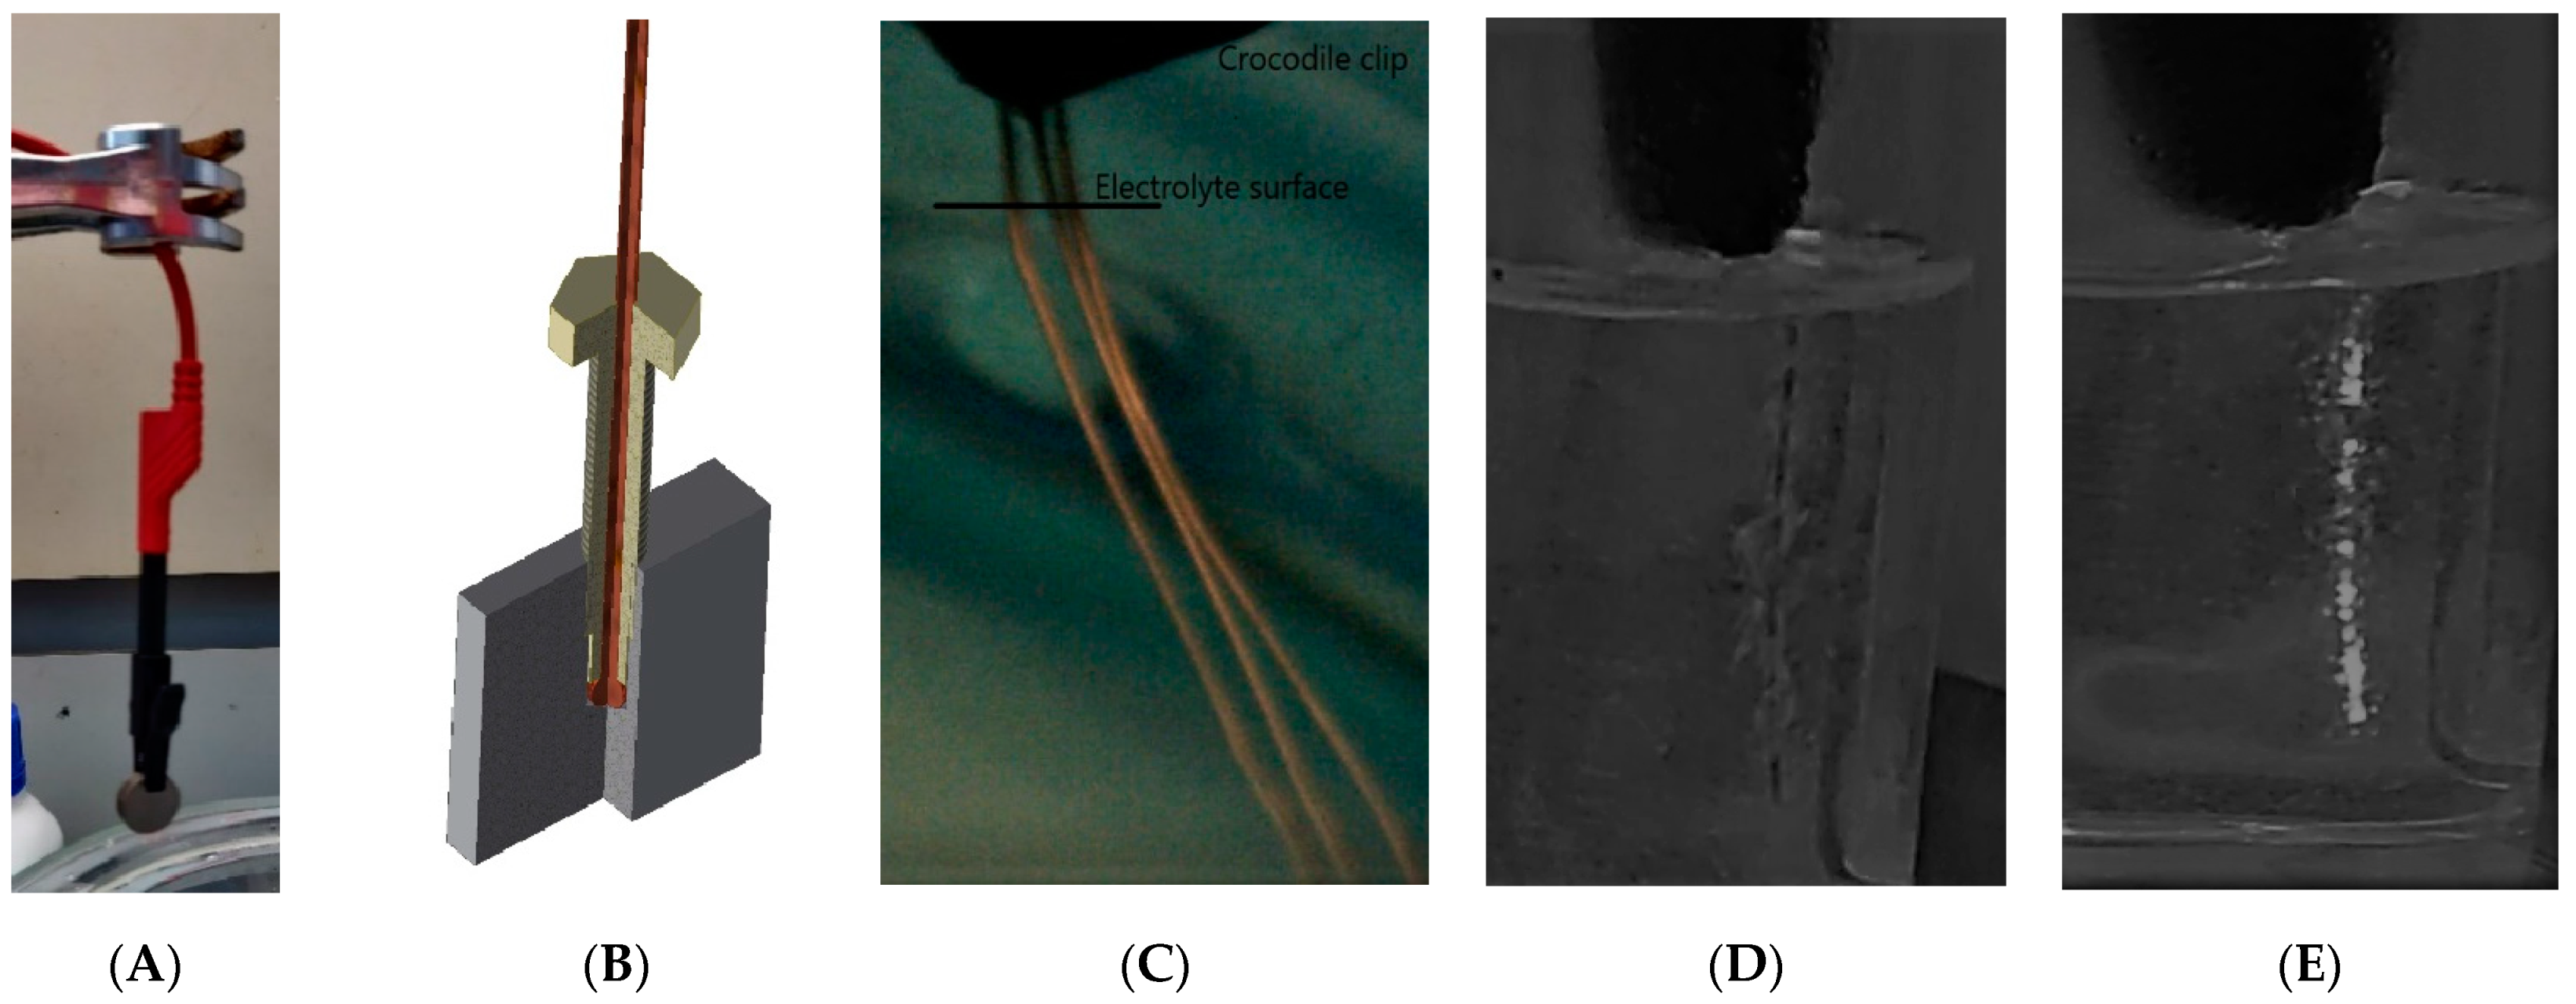
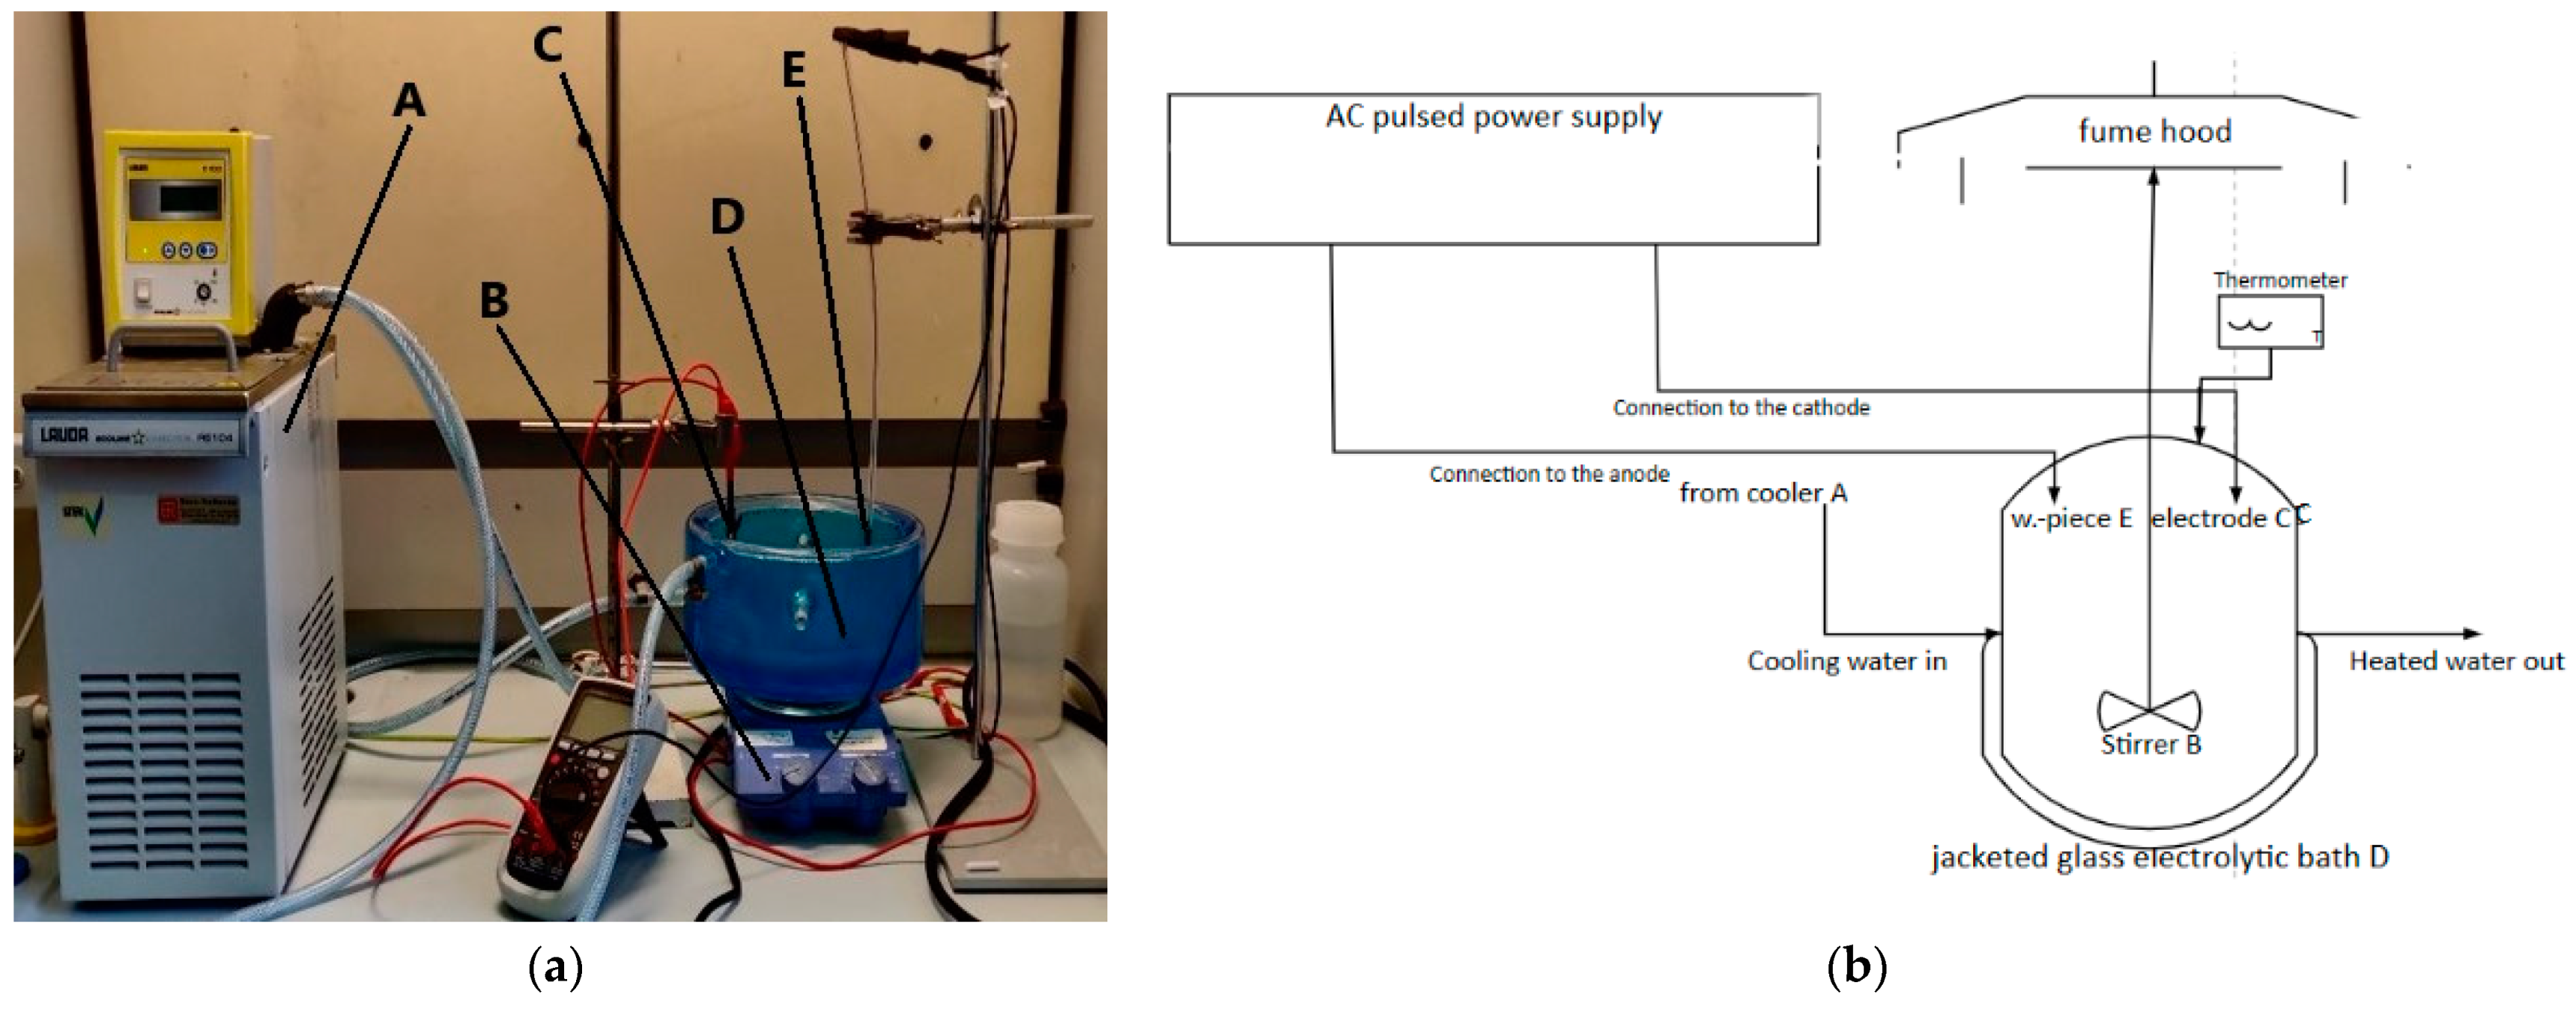
2.2.1. Experimental Setup

The experimental setup in this research is shown in Figure 2. The electrolytic bath (D) is jacketed, and its inlet and outlet were connected to a LAUDA Ecoline RE 104 thermostat (A), which functioned as a cooling system. In order to ensure uniform mixing and agitation of the electrolyte during the process, a magnetic stirrer (B) was used along with a suitably sized magnetic pellet. The electrical connections to the two terminals of the power supply were established by a Banana-Plug Crocodile-Clip connection for both the counter electrode (C) and the workpiece being coated (E). The counter electrode was a sheet of stainless steel of 5 × 3 cm2.
For considerably longer-lasting control of the temperatures reached in the electrolyte, the coolant passing through the tubes was preheated to 9 °C before the start of each experimental run to ensure sufficient potential for heat exchange between the electrolyte and the coolant. The electrolyte temperatures were measured using a Precision Multi-Thermometer prior to experimentation and after the termination of the process. Better thermal management, for instance, by using a larger electrolyte bath proportional to the input voltage and a more efficient cooling system, will prolong the controlled period of the PEO treatment, milden the micro-arc generation and enable more homogenous treatment of the sample surface. The power source utilized was an SPM SP300VAC AC power source rented from Caltest Instruments GmbH, Germany. It has a maximum power output of 2 kW and a maximum output voltage of 300 VAC. For the experiments, a maximum limit of 6.5 A was set for the output current. A block-flow diagram of the process is shown in Figure 2 (Right).

2.2.2. Design of Experiments

In designing and performing the experimentation, the surface area of the various types of samples was chosen to be treatable with the given specifications and limitations of the power supply unit in terms of the maximum output power of 2 kW and maximum output current of 6.5 A. Considering the power supply unit operated under constant potential, the applied potential had to be set with a lower and upper bounded value keeping in mind the limitations of current (6.5 A) and power (2 kW) while ensuring that the potential would be high enough to generate spark and plasma discharge. The tests performed were potentiostatic by applying a constant voltage while the current varied accordingly. During a particular experimental run, the current would fluctuate with time, and its value would be monitored to help set the lower and upper limits for the applied potential. The range of the applied process parameters is outlined in Table 3, where the samples with smaller surface area, like wires and wire bundles, for both titanium and zirconium, as well as the 3D structures, could be treated under a larger range of potentials.
Even though the 3D-printed structures were larger in size than the wires, their nonporous and hollow nature resulted in relatively low surface areas as opposed to the porous tube samples with relatively larger surface areas, which could only be treated at 200 V and 220 V. The increments in the applied voltage were 20 V, indicating that for a range of 200–260 V, tests were performed at 200 V, 220 V, 240 V, and 260 V, respectively. To investigate its impact on the current generated for a similar applied potential value and to see if it would have an impact on the coating structure, morphology, and composition, the power frequency was varied. This experimental design was selected to observe how the applied process parameters influence the coating’s structure, morphology, composition, and phase structure.

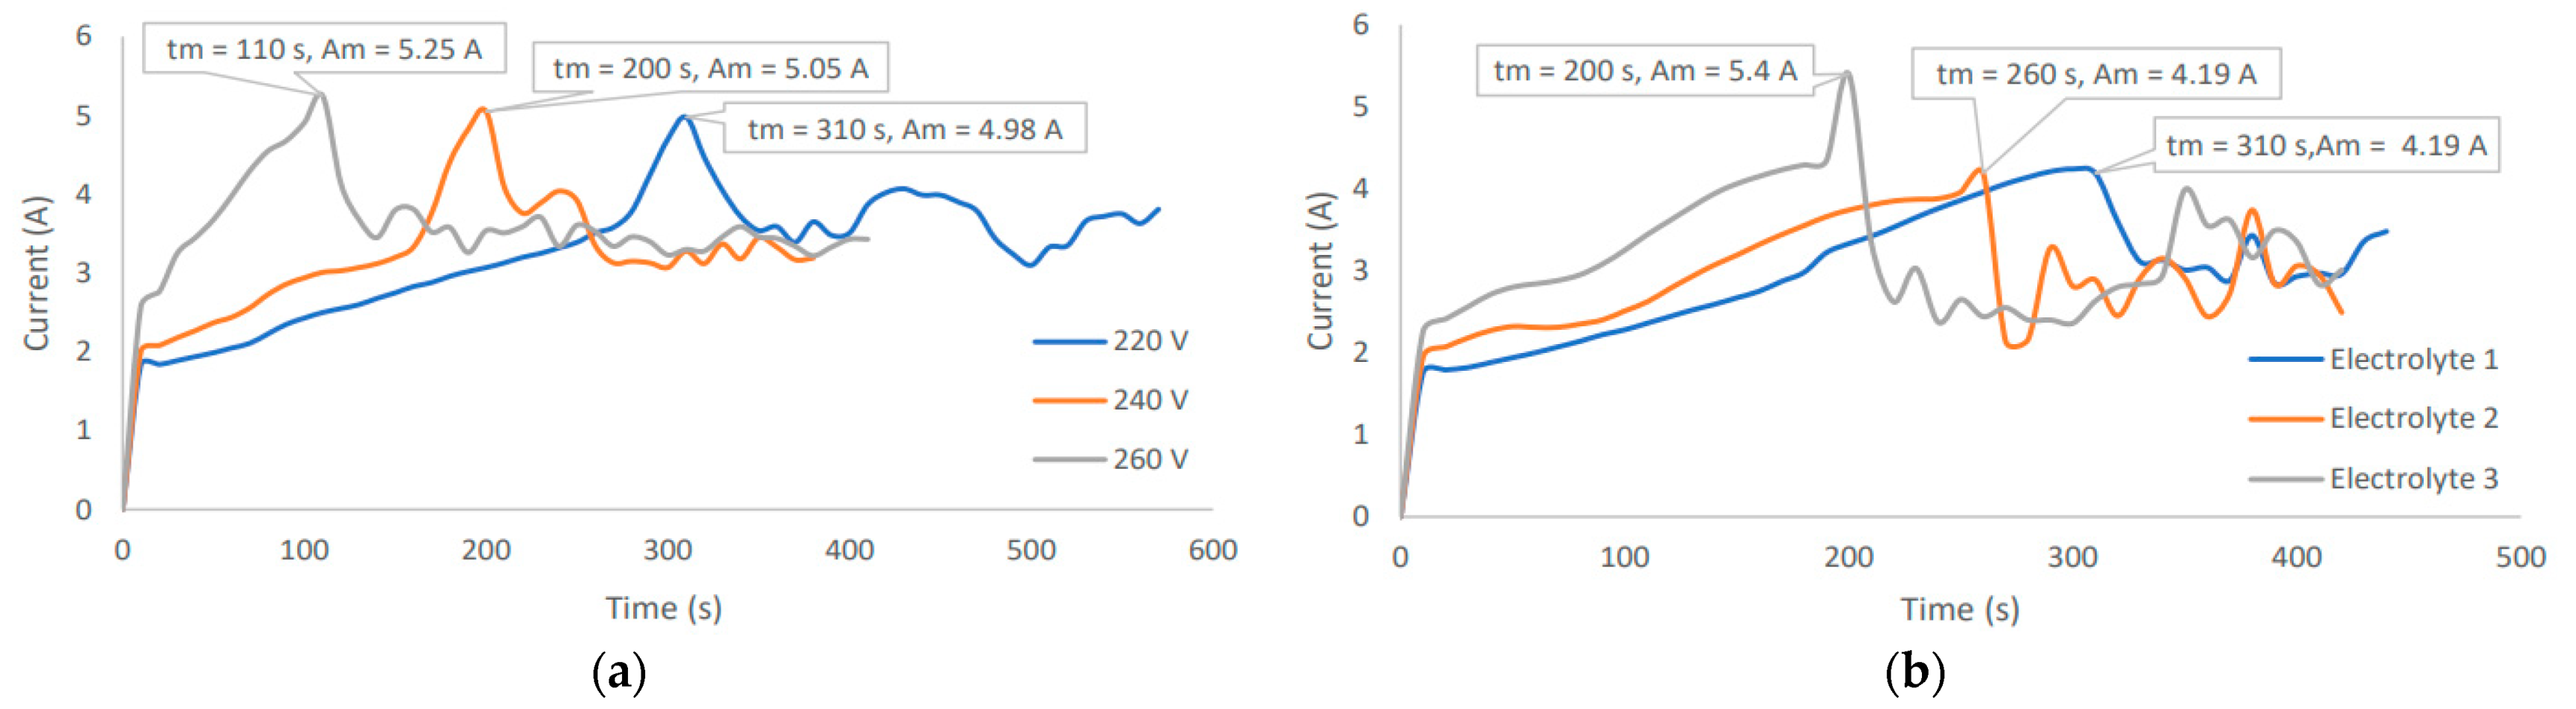
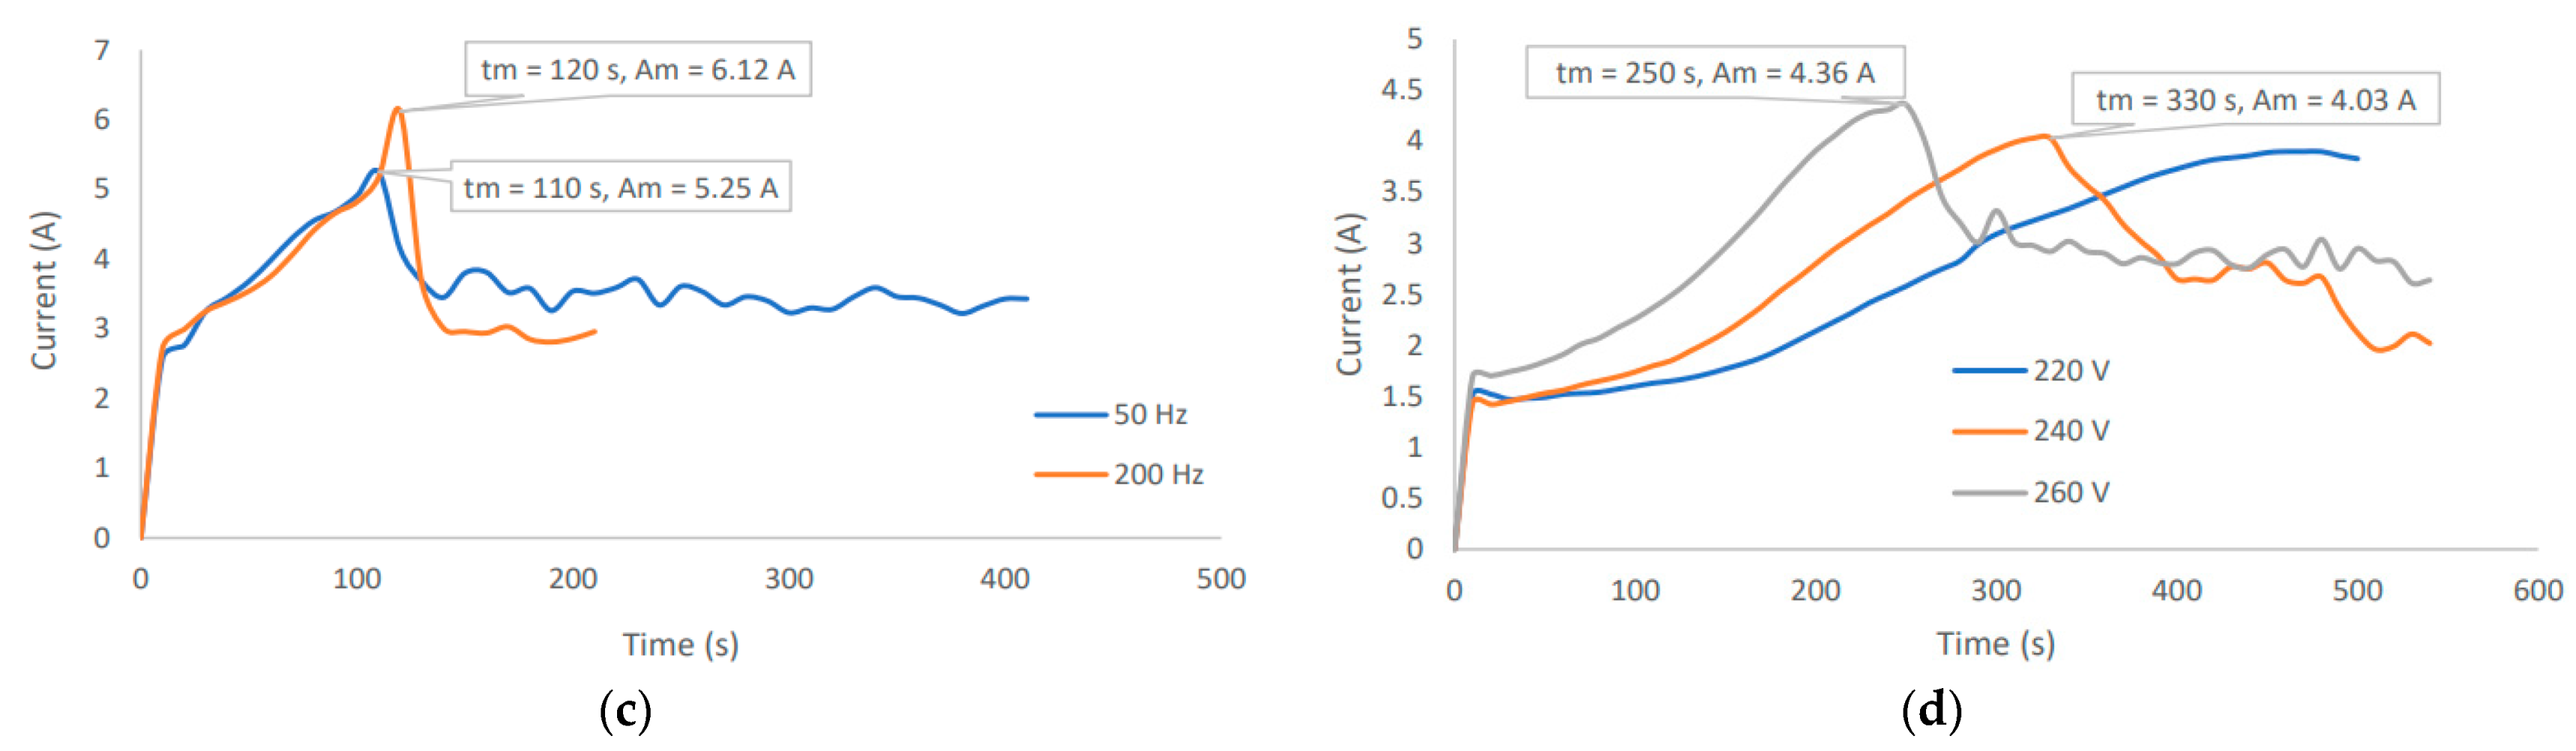
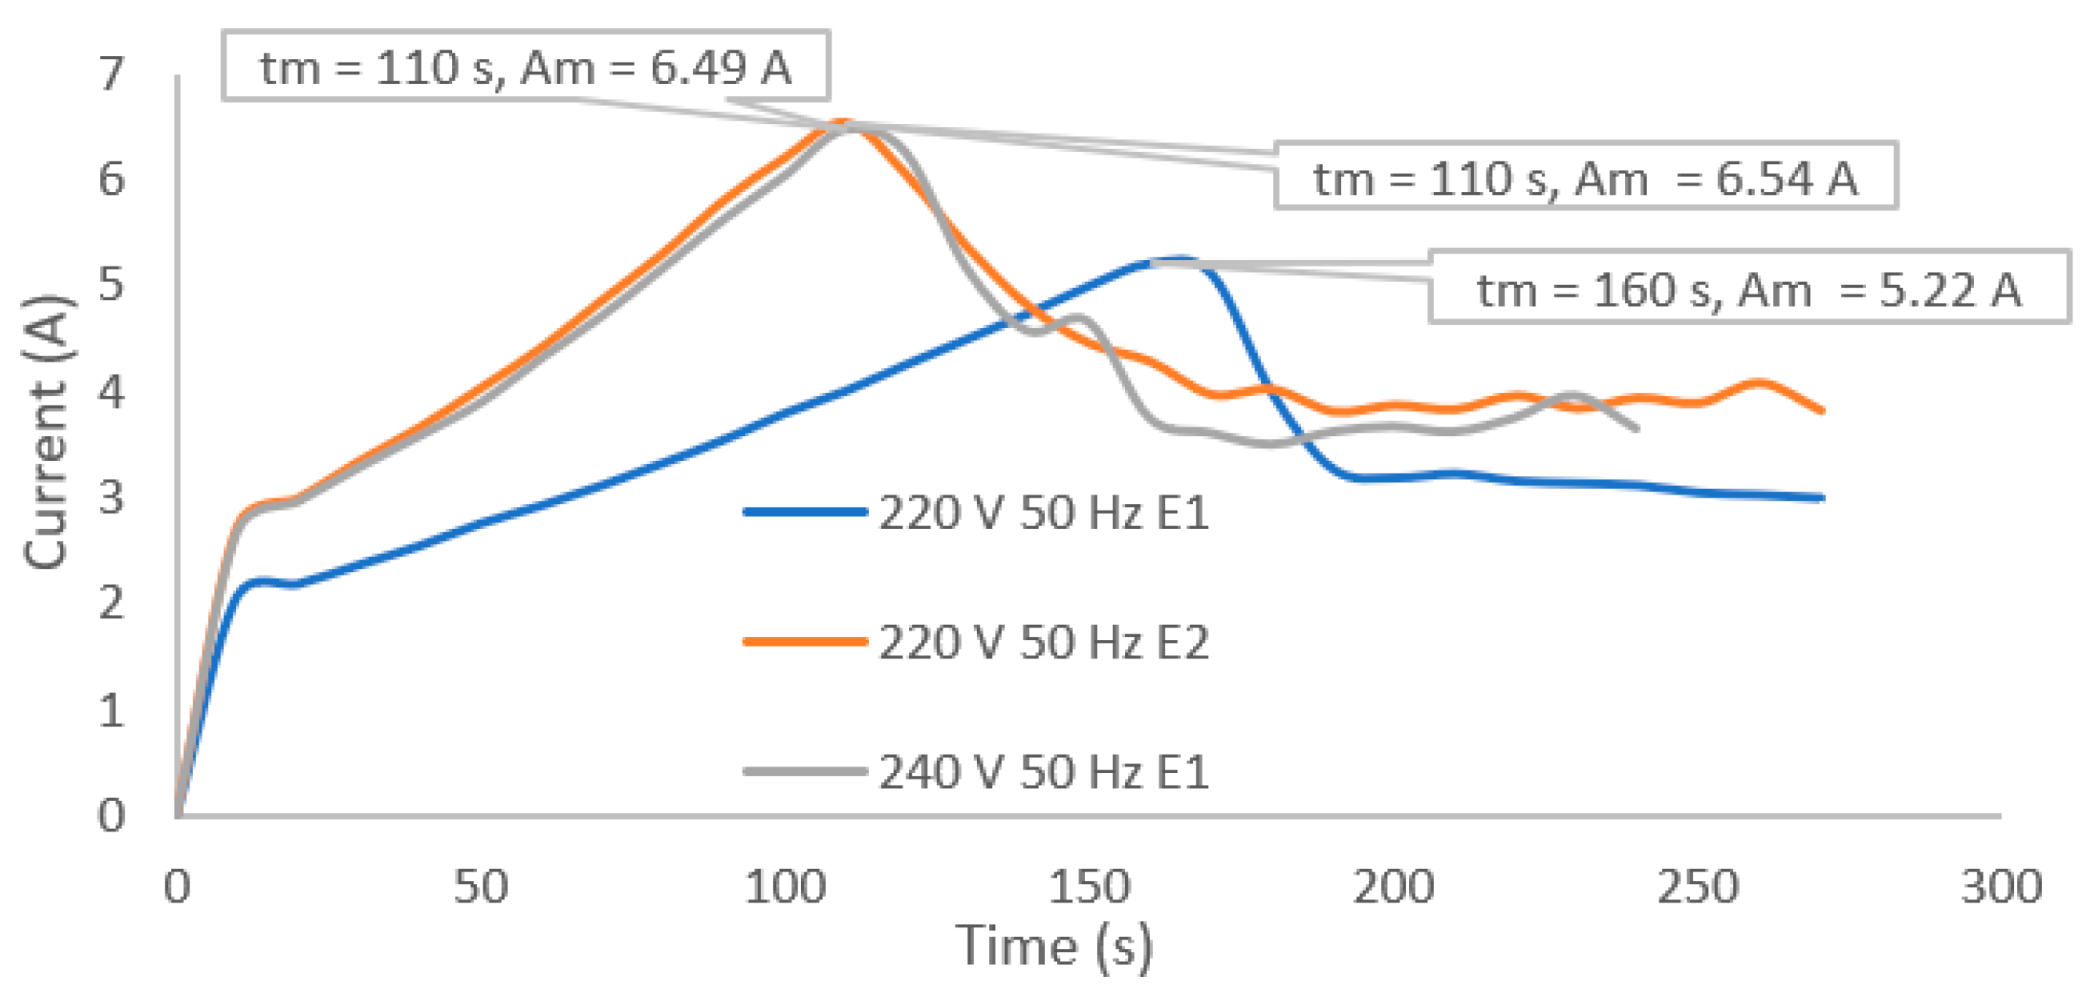
2.2.3. Current Profile Observation

It should be highlighted that the range of the applied potential can also be determined by tracking the current-time data for any experimental run, which is basically the recording of the fluctuating process parameter (AC current) with respect to the constant process parameter (voltage). During experimentation, a constant potential was applied, and the fluctuating AC current was observed on the display of the power supply unit. A typical analysis of recorded current time data is shown in Figure 3, where the sample treated was a 3D-printed scaffold sample.
The samples were treated at two different voltages (220 and 240) and two different silicate electrolytes, E1 and E2, whose compositions are given in Table 2. It was observed that the generated electric current increases along with the potential and electrolyte concentration. Furthermore, the sparking (maximum) current (Am) was reached at an earlier sparking time (tm) with increasing potential and electrolyte concentration. The maximum current was reached for the samples treated at 220 V E2 and 240 V E1, which indicated that the potential should not be further increased, nor the concentration. Further increasing these parameters would result in sparking time Am to appear even sooner, causing a loss in the potential, and very strong, uncontrolled energetic discharges, which could potentially damage the coating and the sample. The damage can be sustained in the form of cracking of the coated layer or breakage of the workpiece, especially the wires.

2.3. Surface Characterization

2.3.1. Surface Morphology

To observe and determine the degree of homogeneity of the coatings, the scanning electron microscopy (SEM) technique was used. This was performed using the Phenom ProX electron microscope at 15 kV mapping and a resolution of 64 × 64 pixels. To determine the extent of coatings formed on the treated samples and their homogeneity, multiple regions of the treated samples were analyzed, and the surface morphology and structure were studied using this technique. It was investigated whether PEO treatment had taken place as well as whether there were pores and electrolyte-deposited structures present on the treated surface. The porous surfaces host the catalyst or deposited catalytic layer. After being coated directly or indirectly, the porous layer covering the porous tube acted as a membrane layer to facilitate gas separation and permeation. The characteristics of the established porous treated layer had a significant impact on the performance of the resulting catalyst and membrane applications in terms of quantity and quality of the final coating affecting catalytic conversion and selectivity as well as membrane permeation.

2.3.2. Element Identification and Phase Composition

To determine the elemental composition on the surface of the treated samples, the regions of the samples that were characterized by SEM were also characterized by energy-dispersive X-ray spectrometry (EDX) for element identification via the Phenom ProX electron microscope. In this manner, several regions on the treated surface were characterized by EDX in order to correlate the results obtained from SEM. The primary aim of the correlation of SEM and EDX is to observe if a coating layer has been formed on the surface, which can be seen by SEM. This observation can be further confirmed by observing the corresponding EDX data to determine the elemental composition of that region of the coated sample, mostly by tracking the oxide content of the sample. EDX was performed using the backscattering detector (BSD) of the Phenom ProX. This detector was used to obtain a better visualization of the sample as the emissions originate from deeper regions of the PEO-treated sample. Due to the high temperatures and potential involved in PEO electrochemical process, it is expected that a large quantity of oxidation will be seen along with the presence of electrolyte components.
X-ray diffraction (XRD) was also performed to determine the phase composition of the treated surface and the established porous layers. Due to the high potential, it would be expected to observe crystalline phases across the treated surface. This is a characteristic feature of PEO that distinguishes it from conventional electrolysis techniques like anodization, in which coatings are largely amorphous across the treated surfaces. In the case of PEO treatment of titania over titanium and its alloys, anatase and rutile titania would be expected to be present [75]. These are the crystalline phases of titania, where anatase is the low-temperature phase, and rutile is a more stable crystalline phase formed at higher temperatures [29,70,71,72,75,76].

3. Results and Discussion
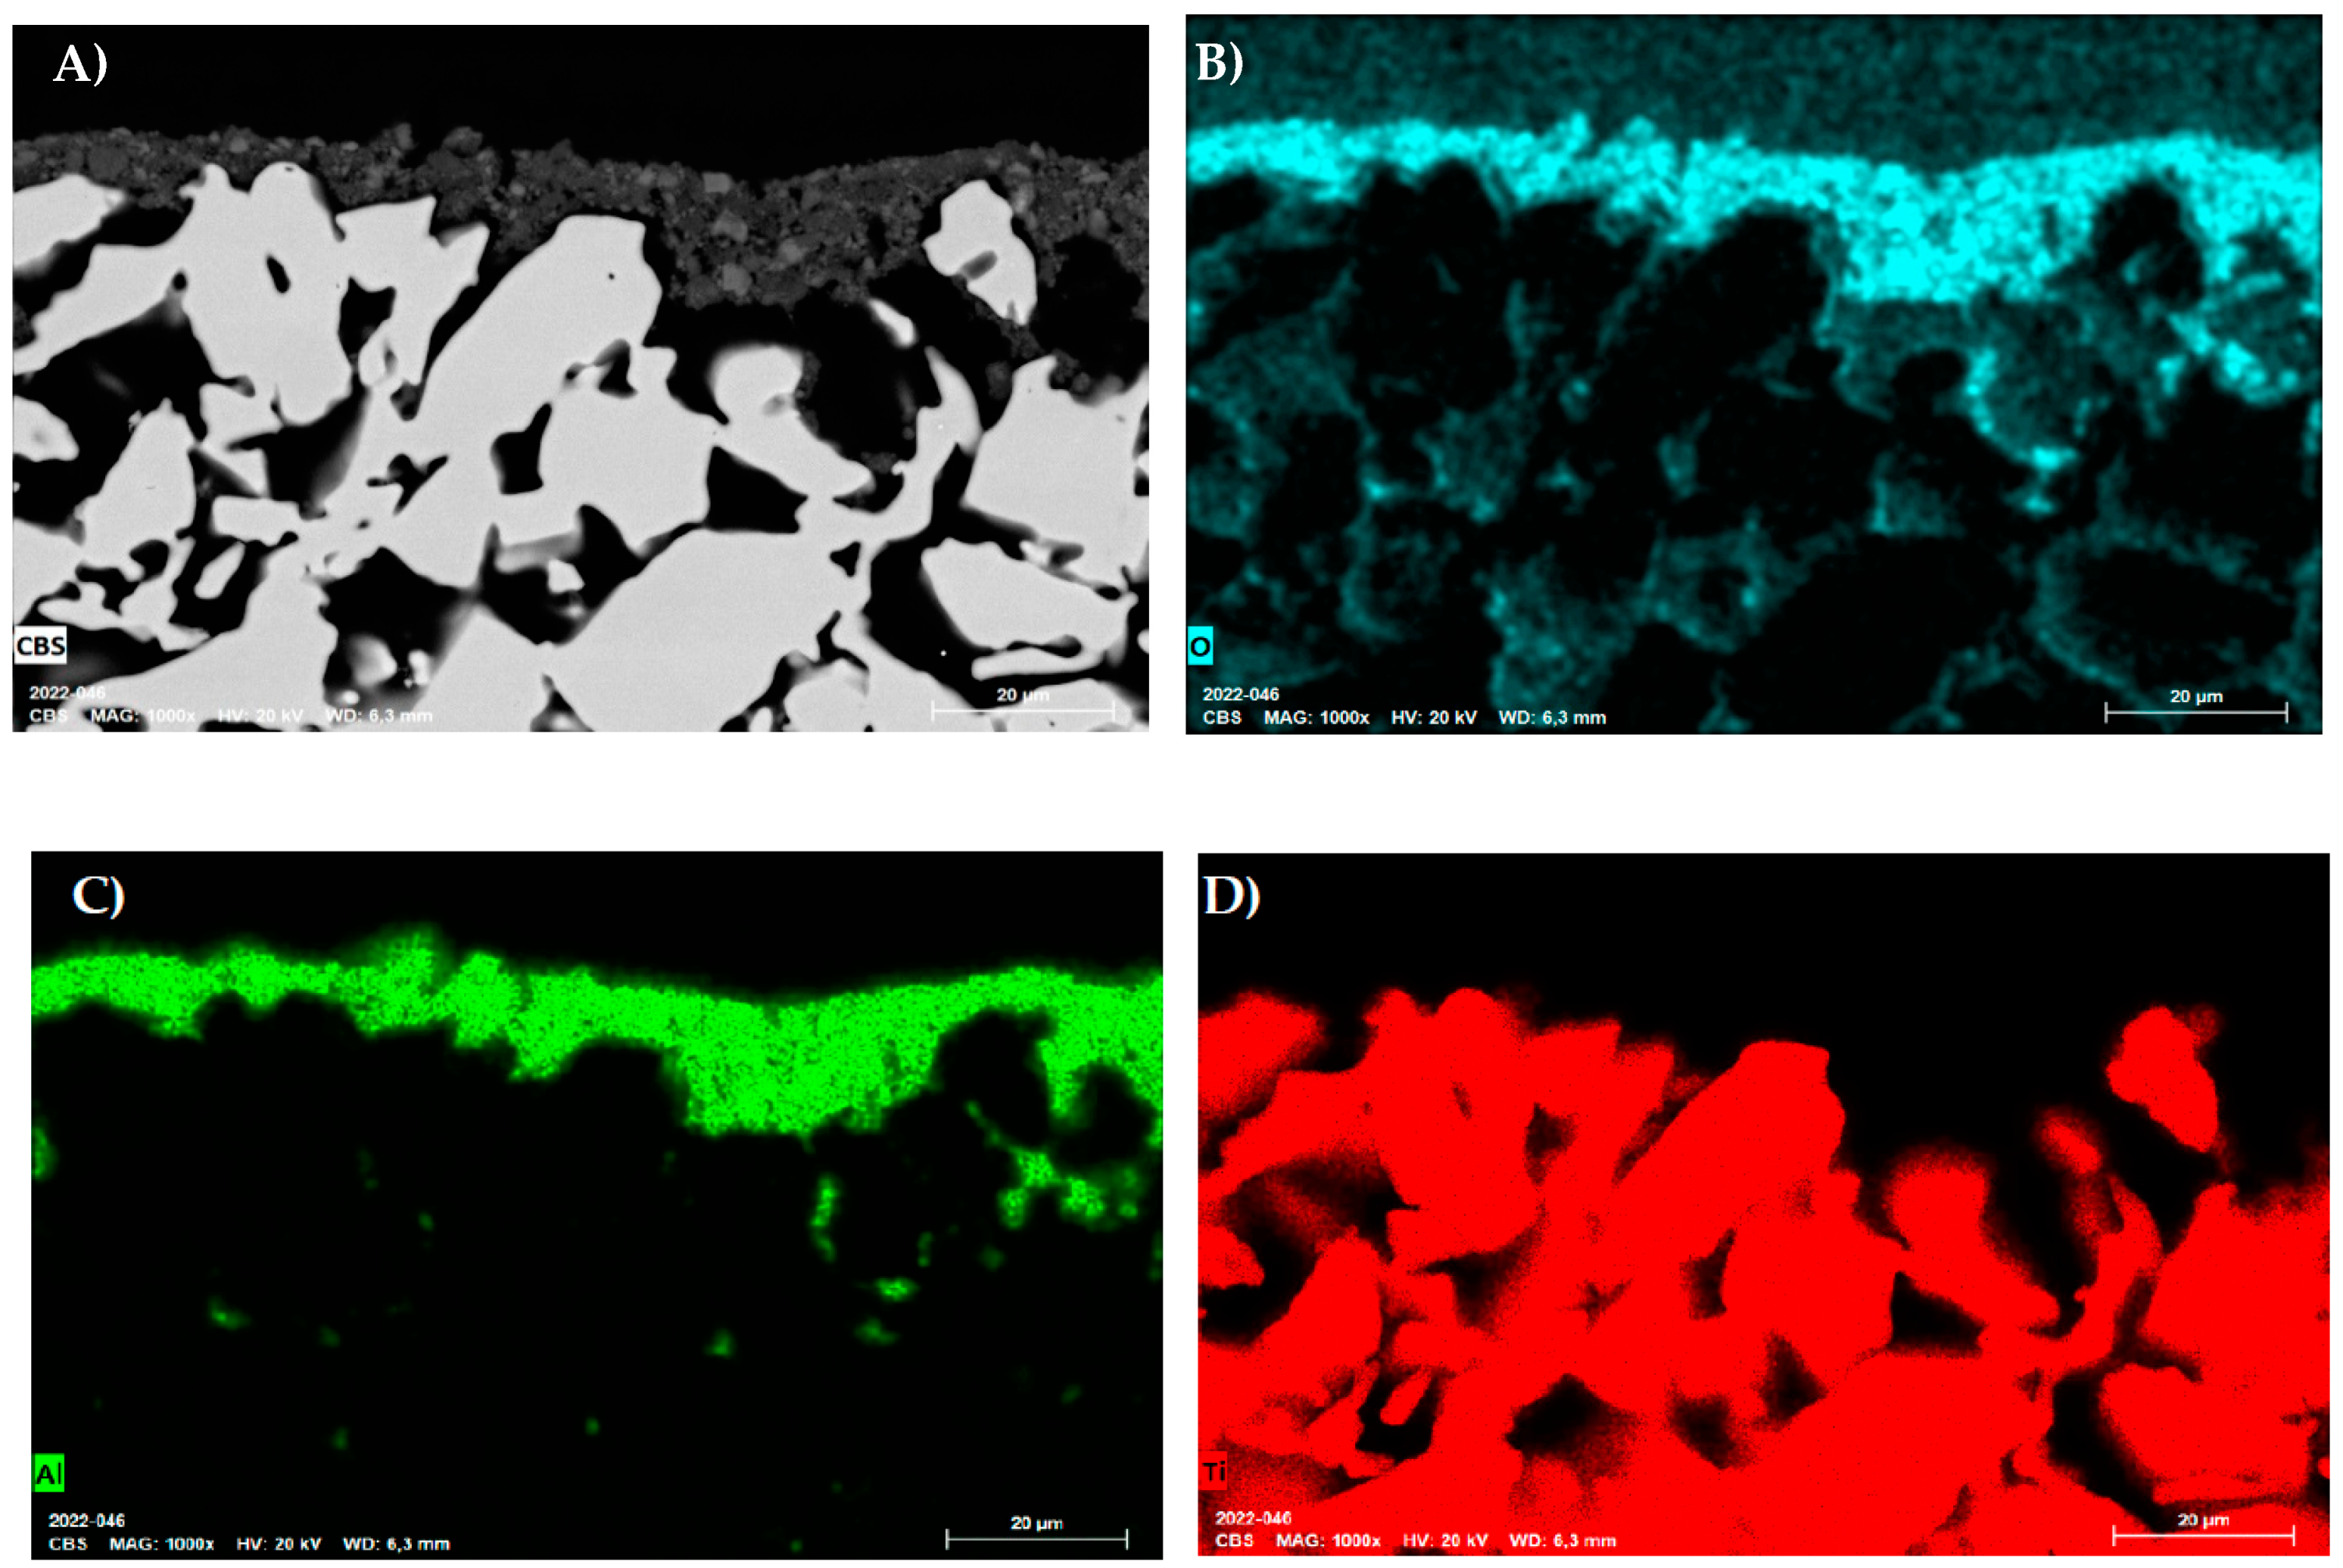
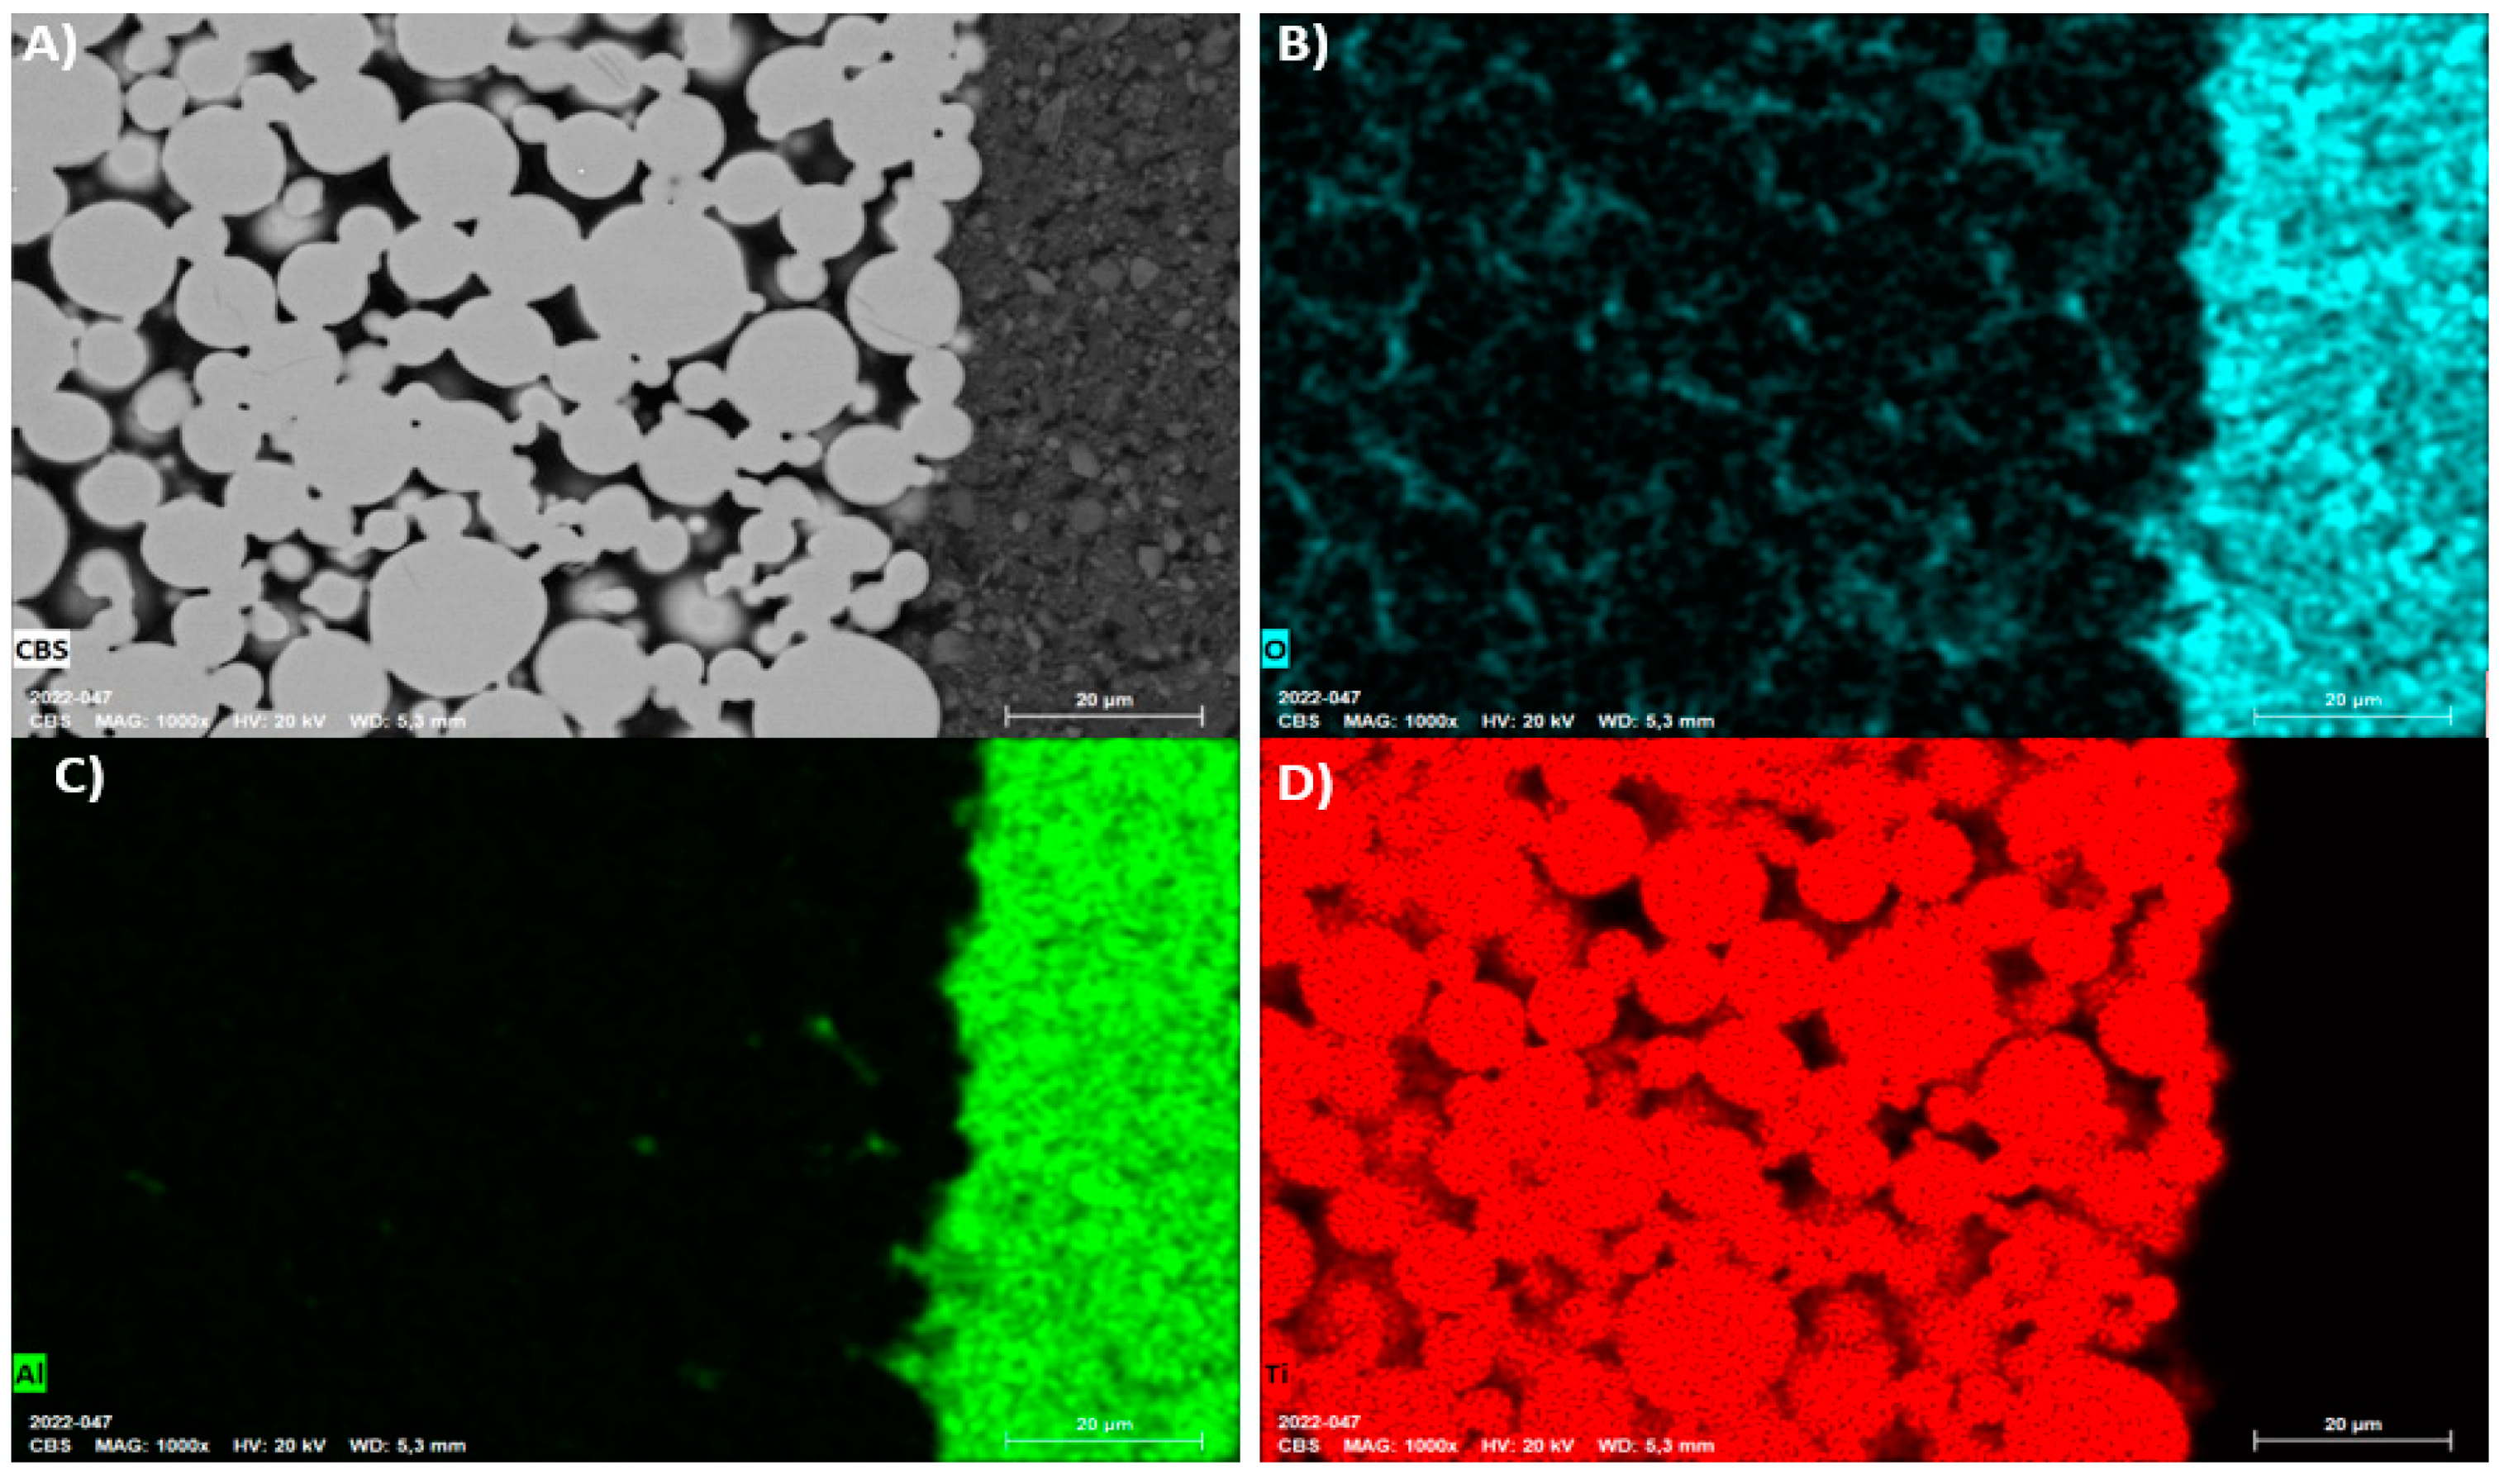
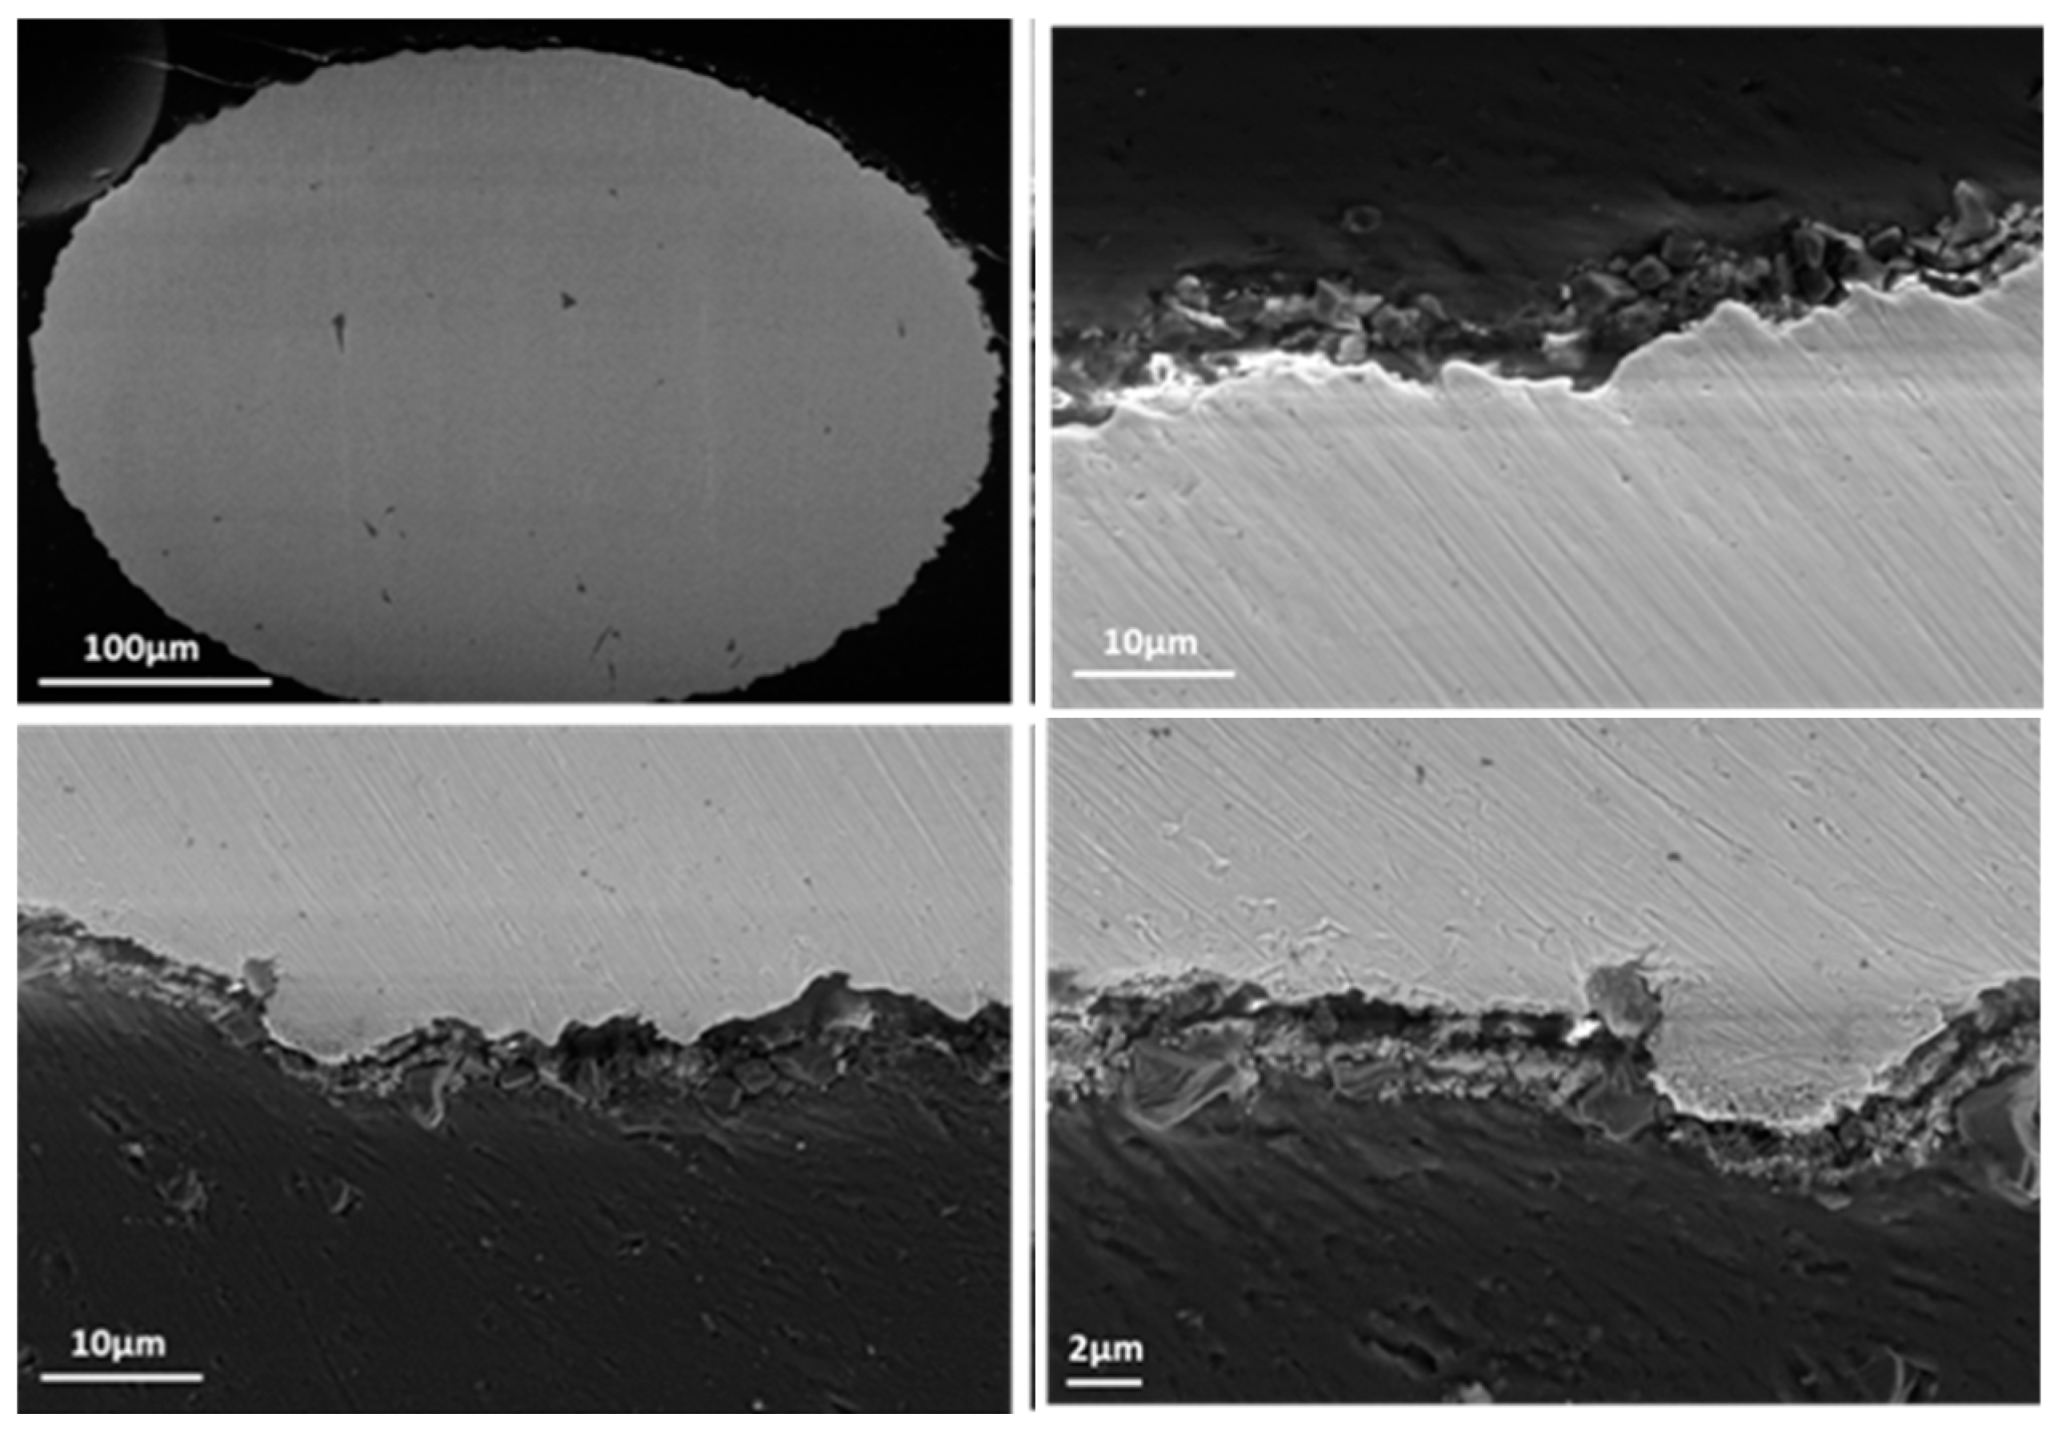
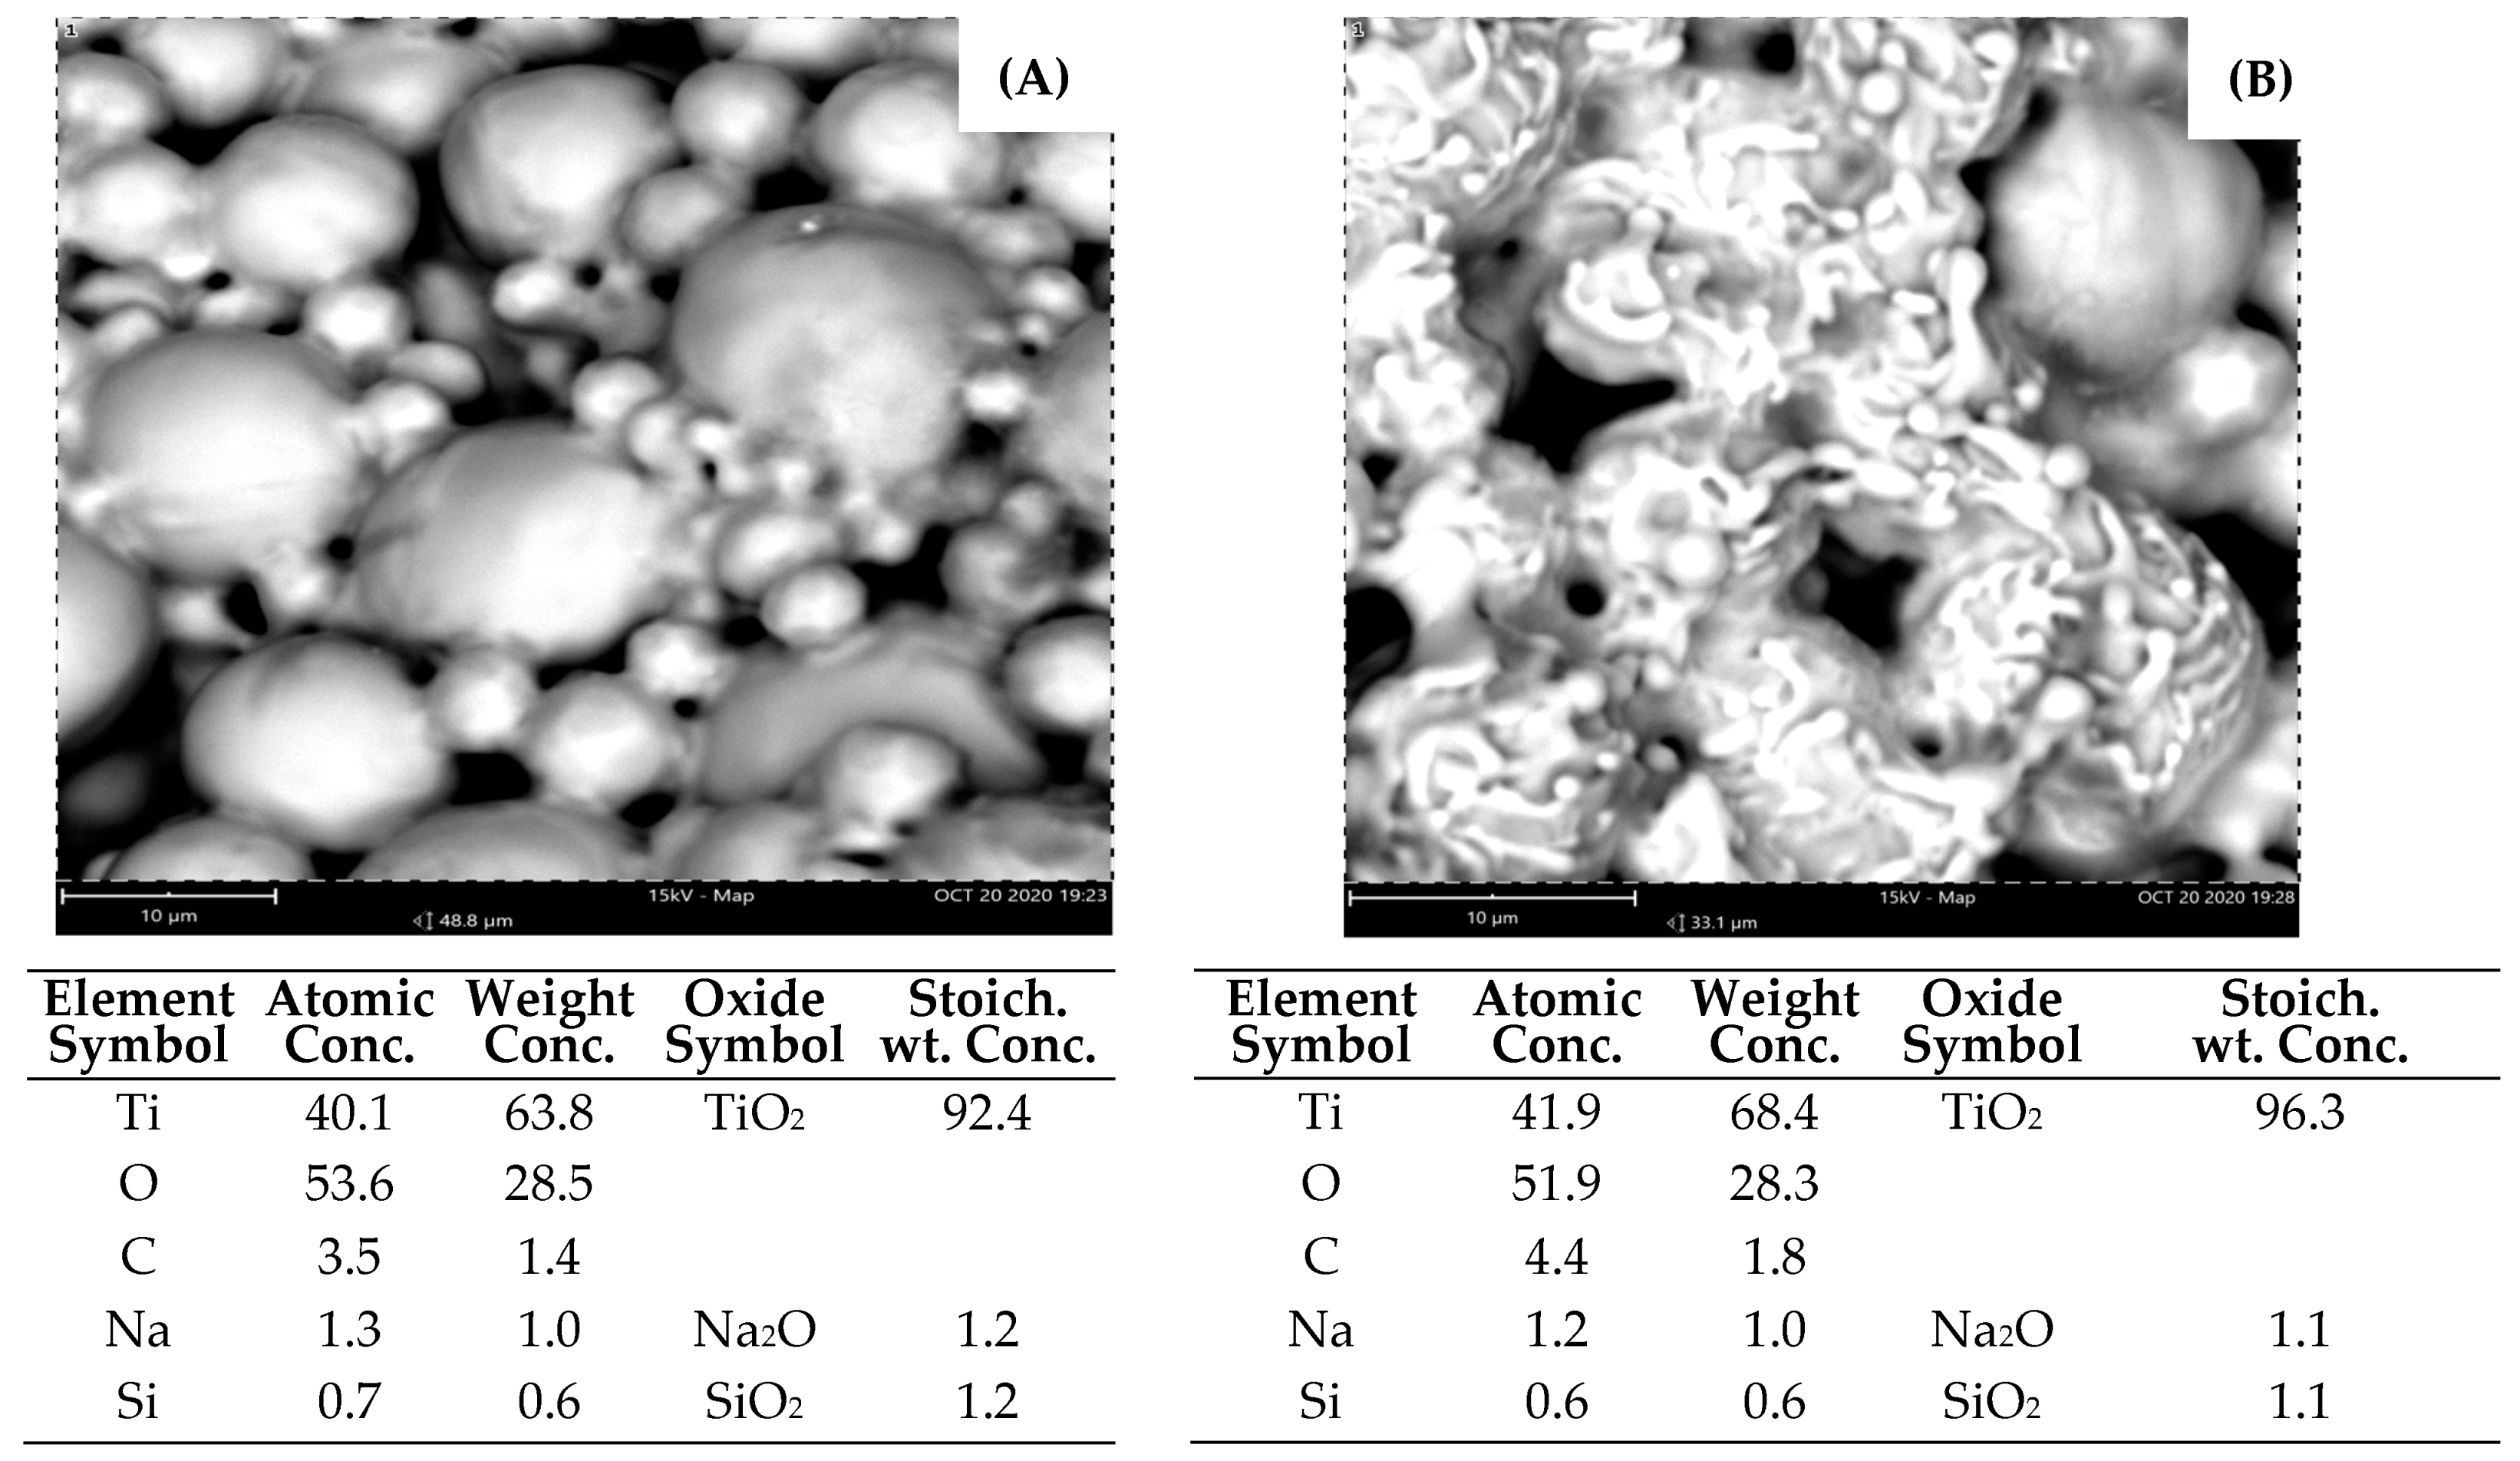
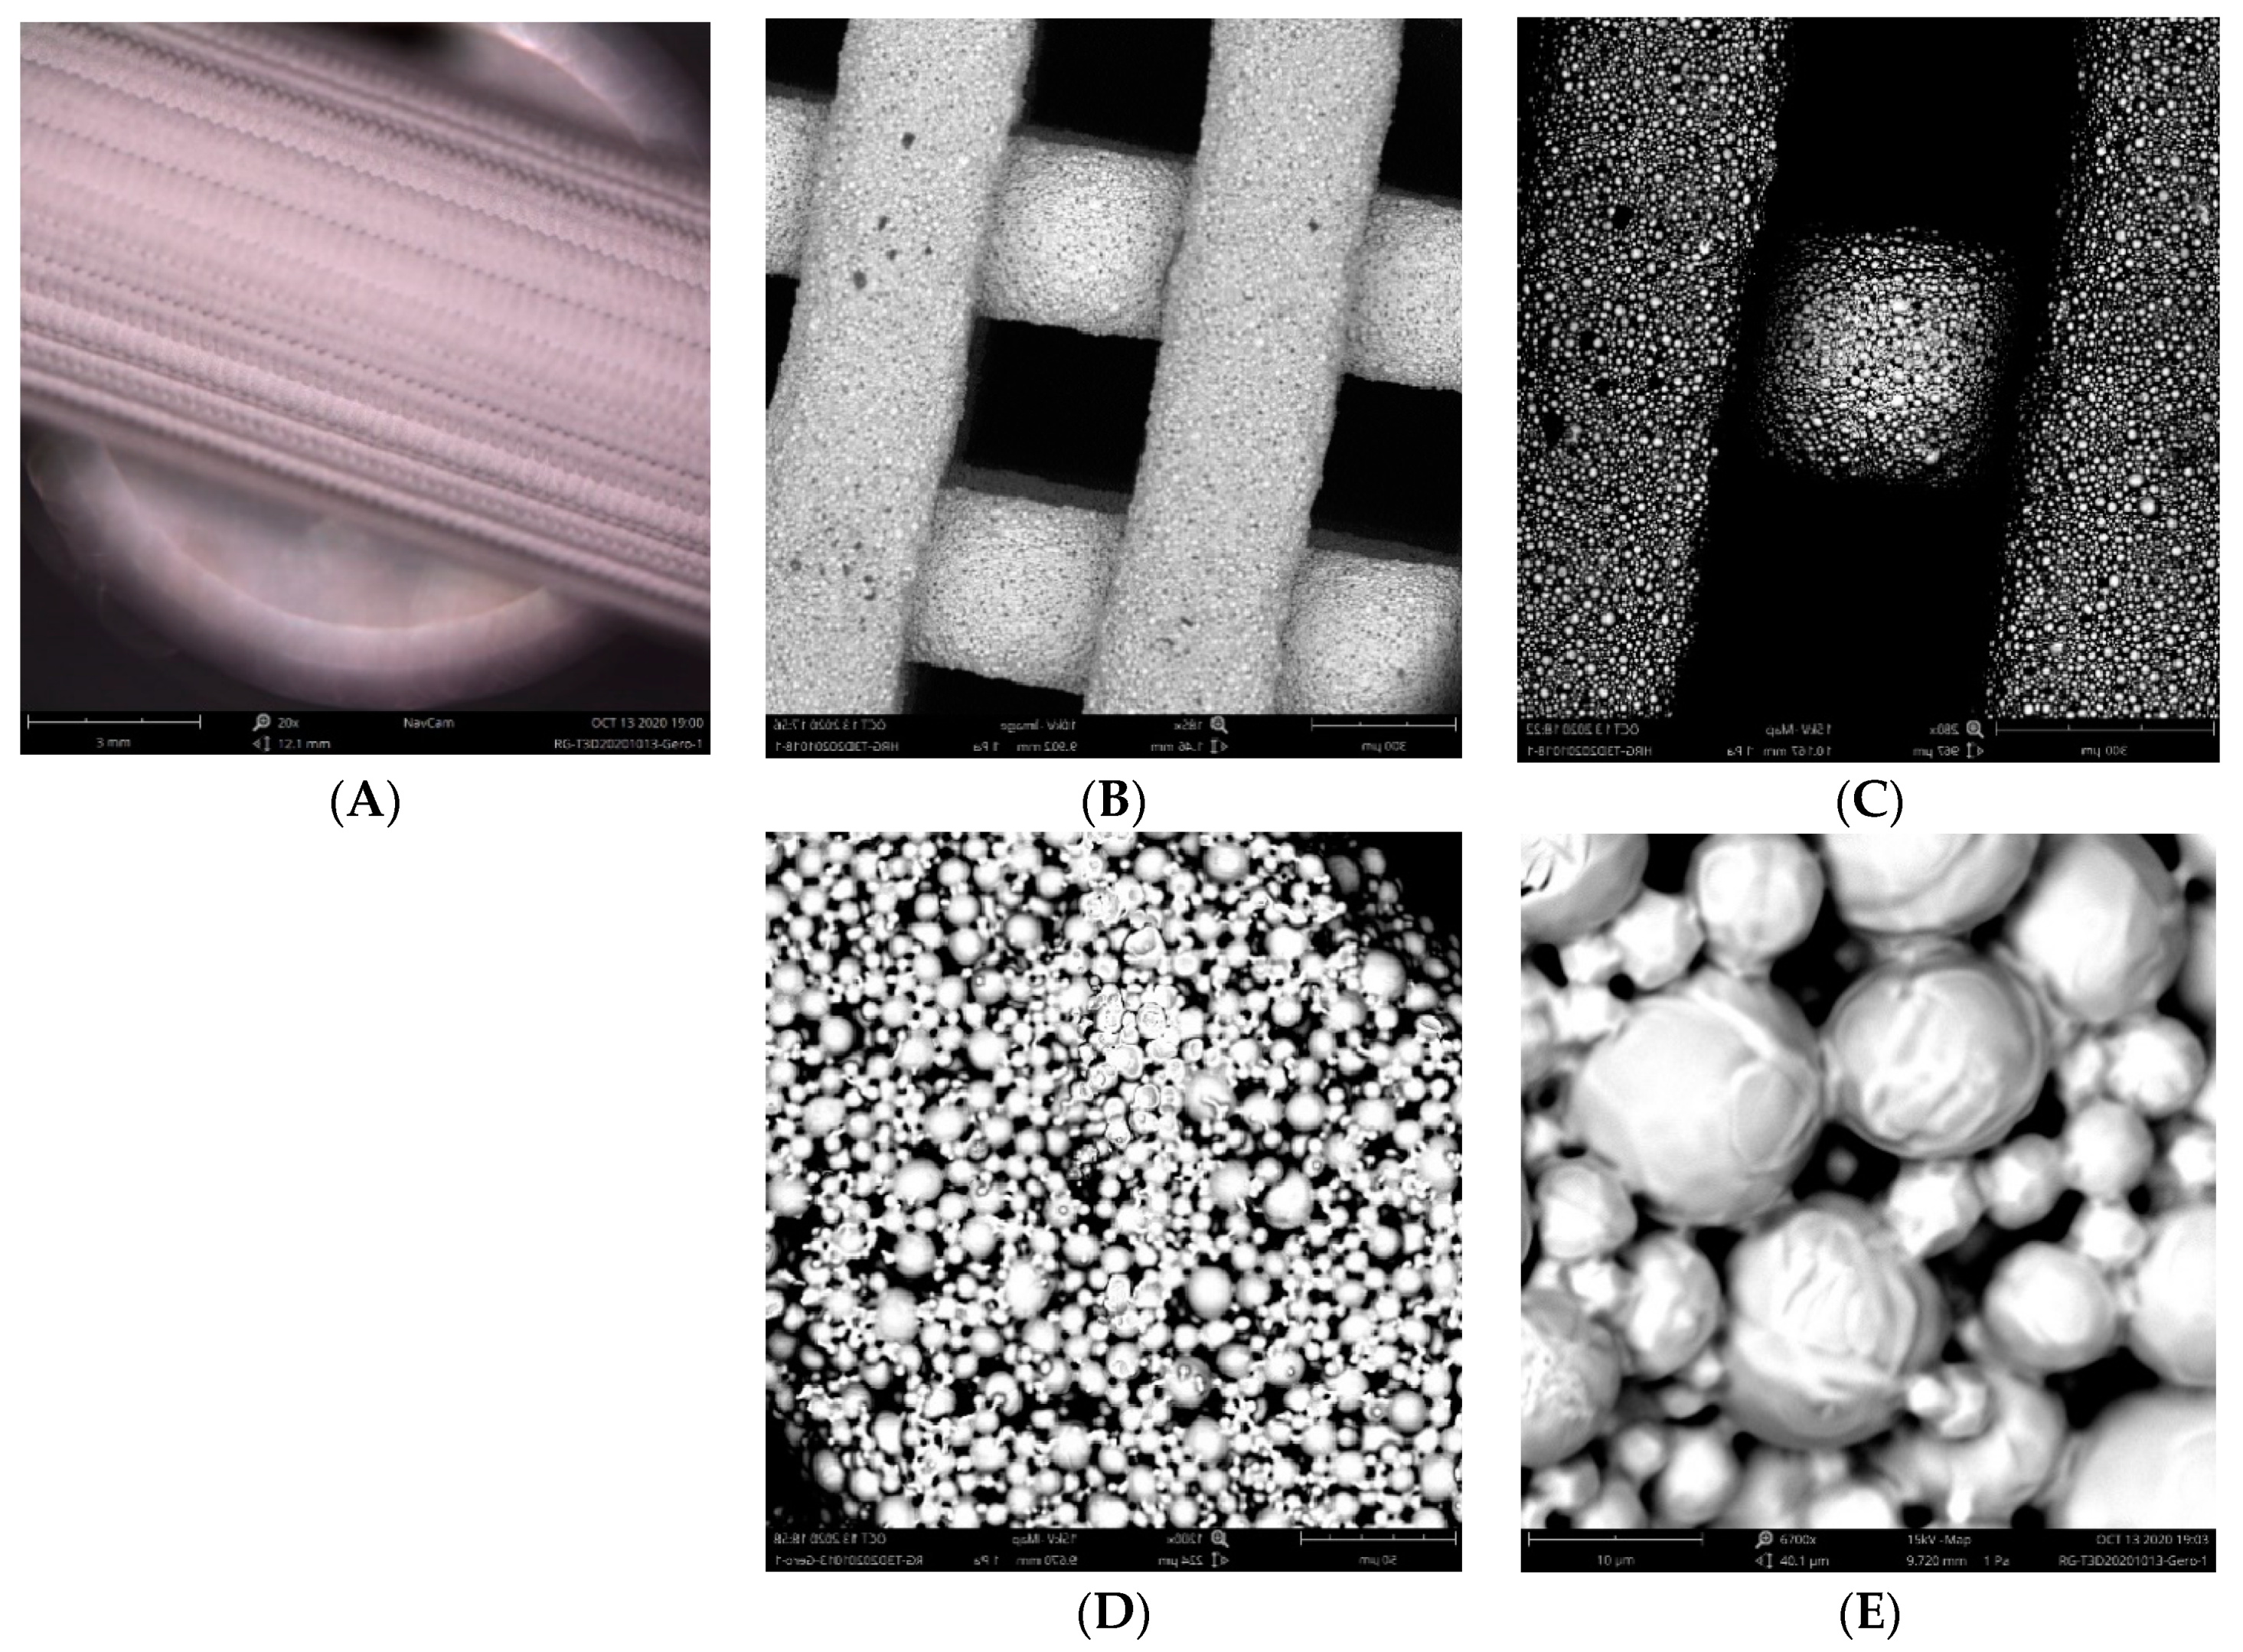
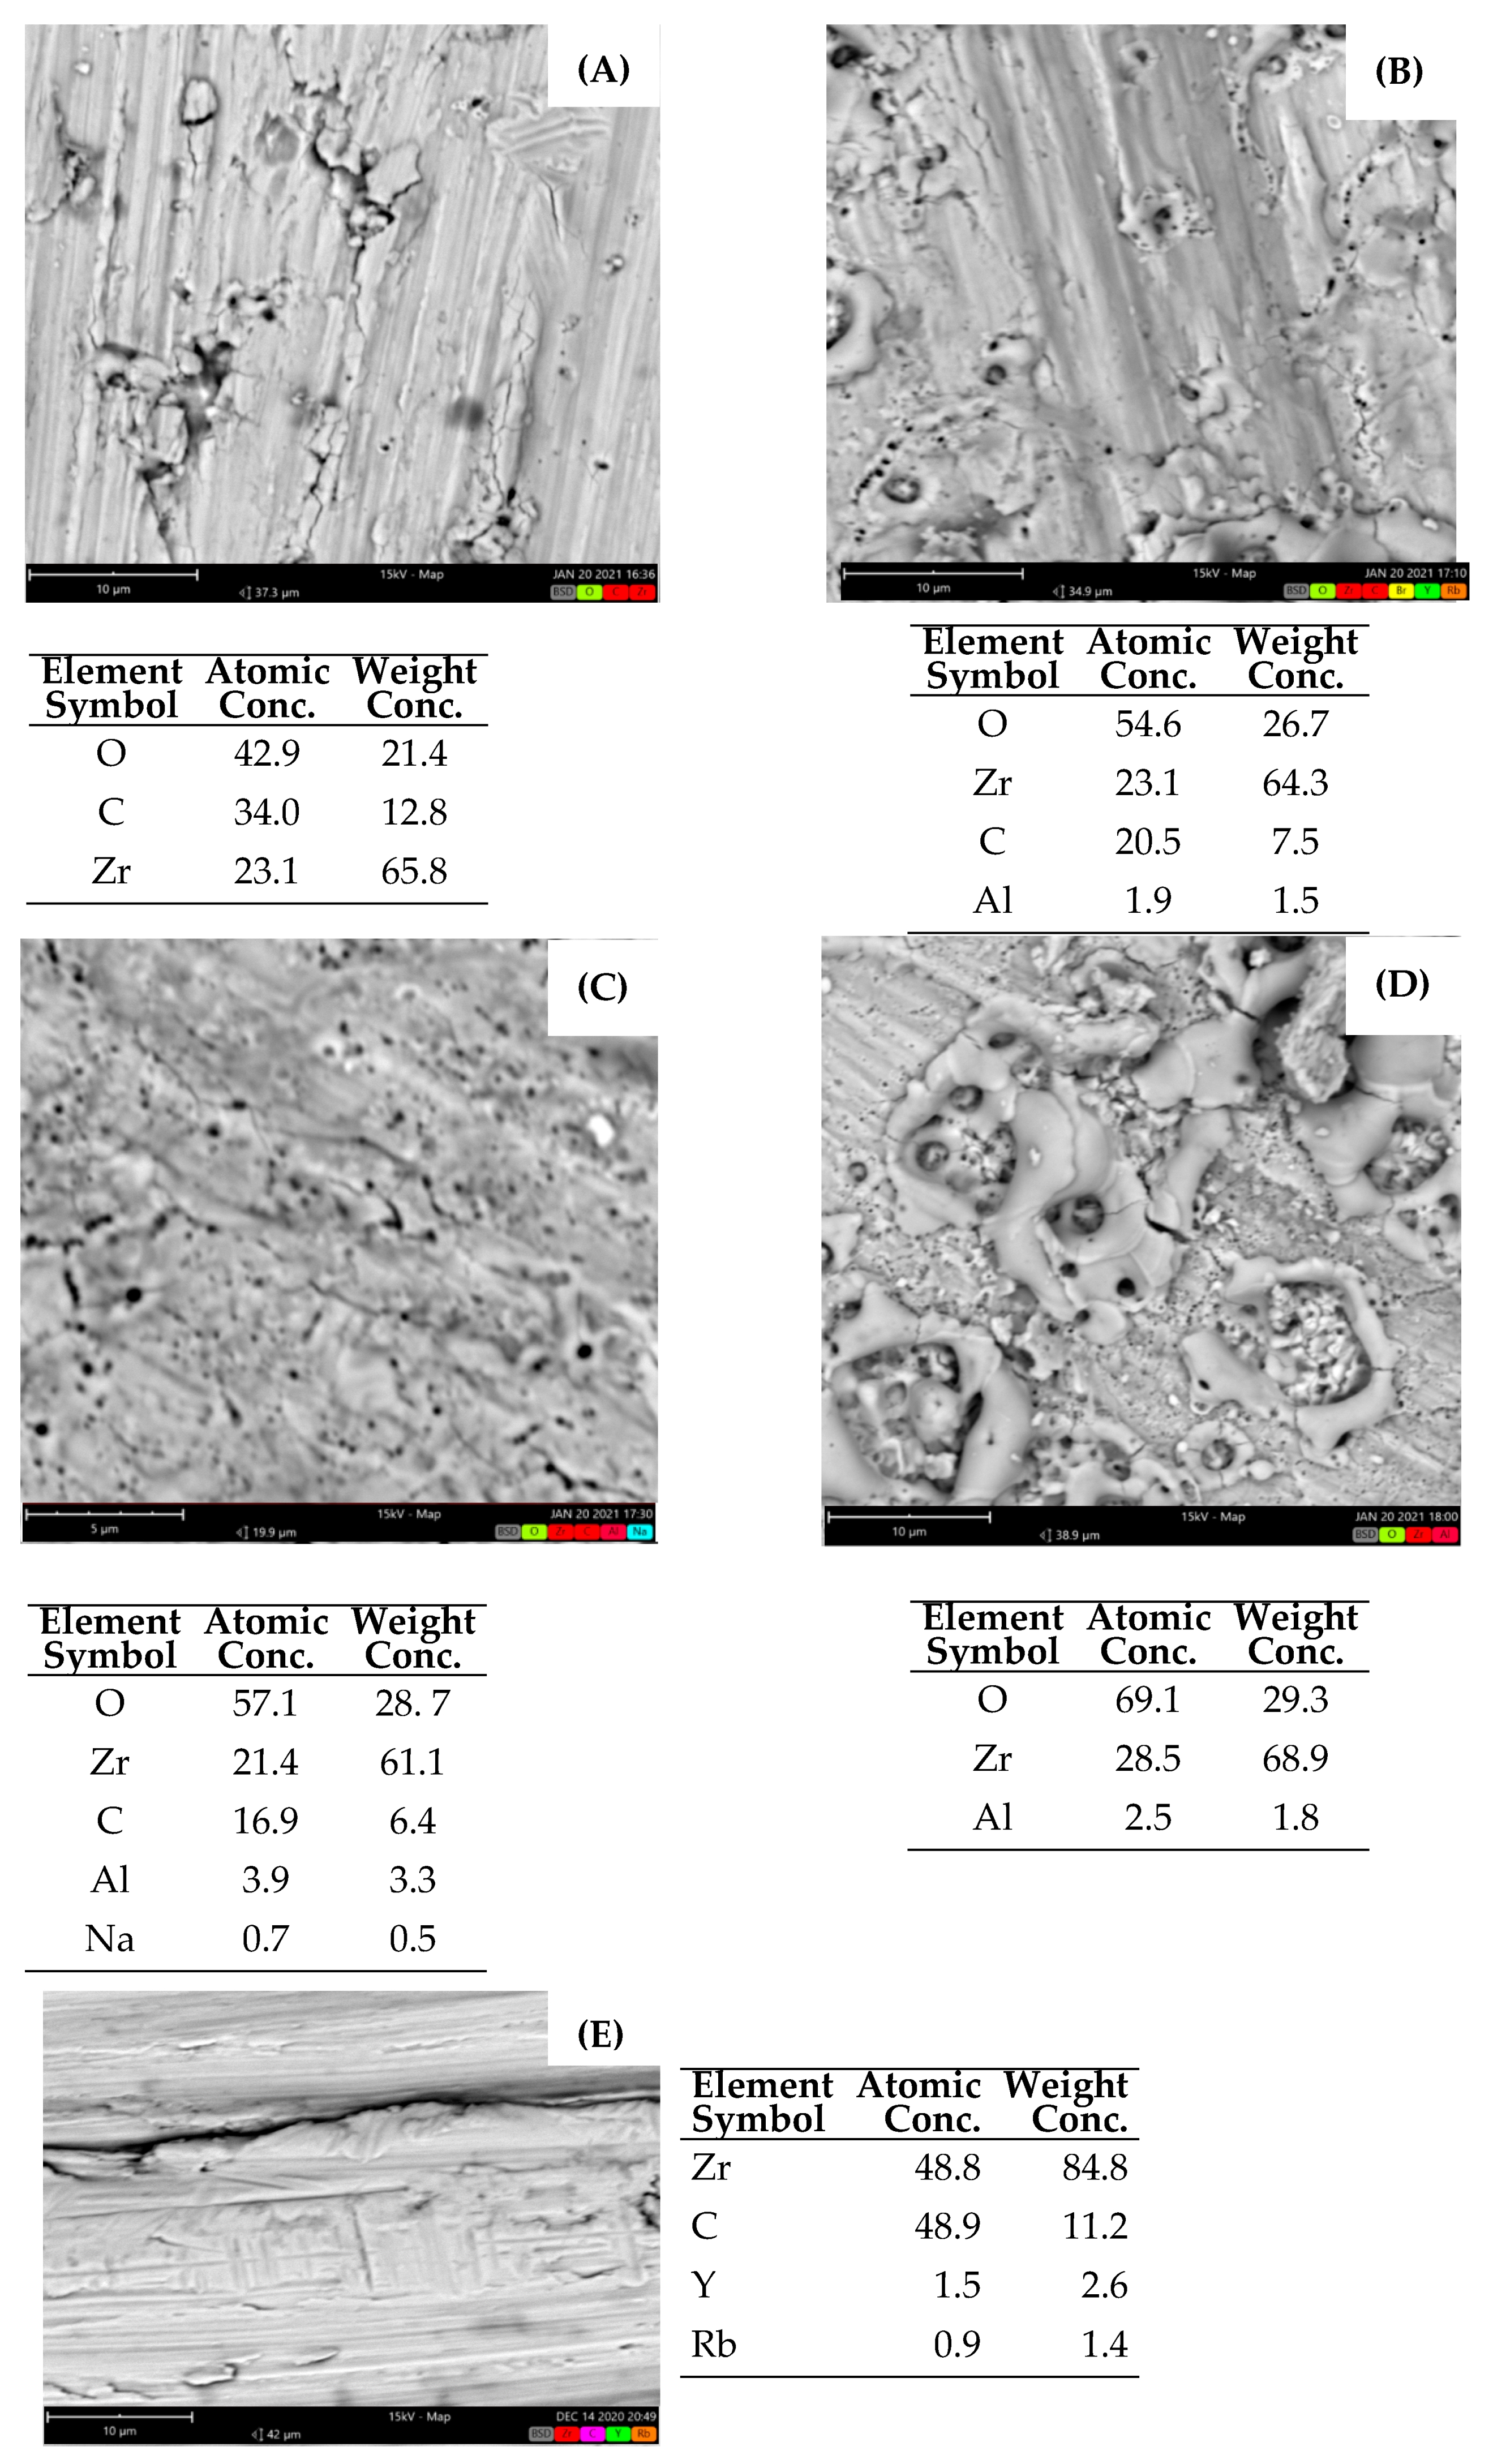
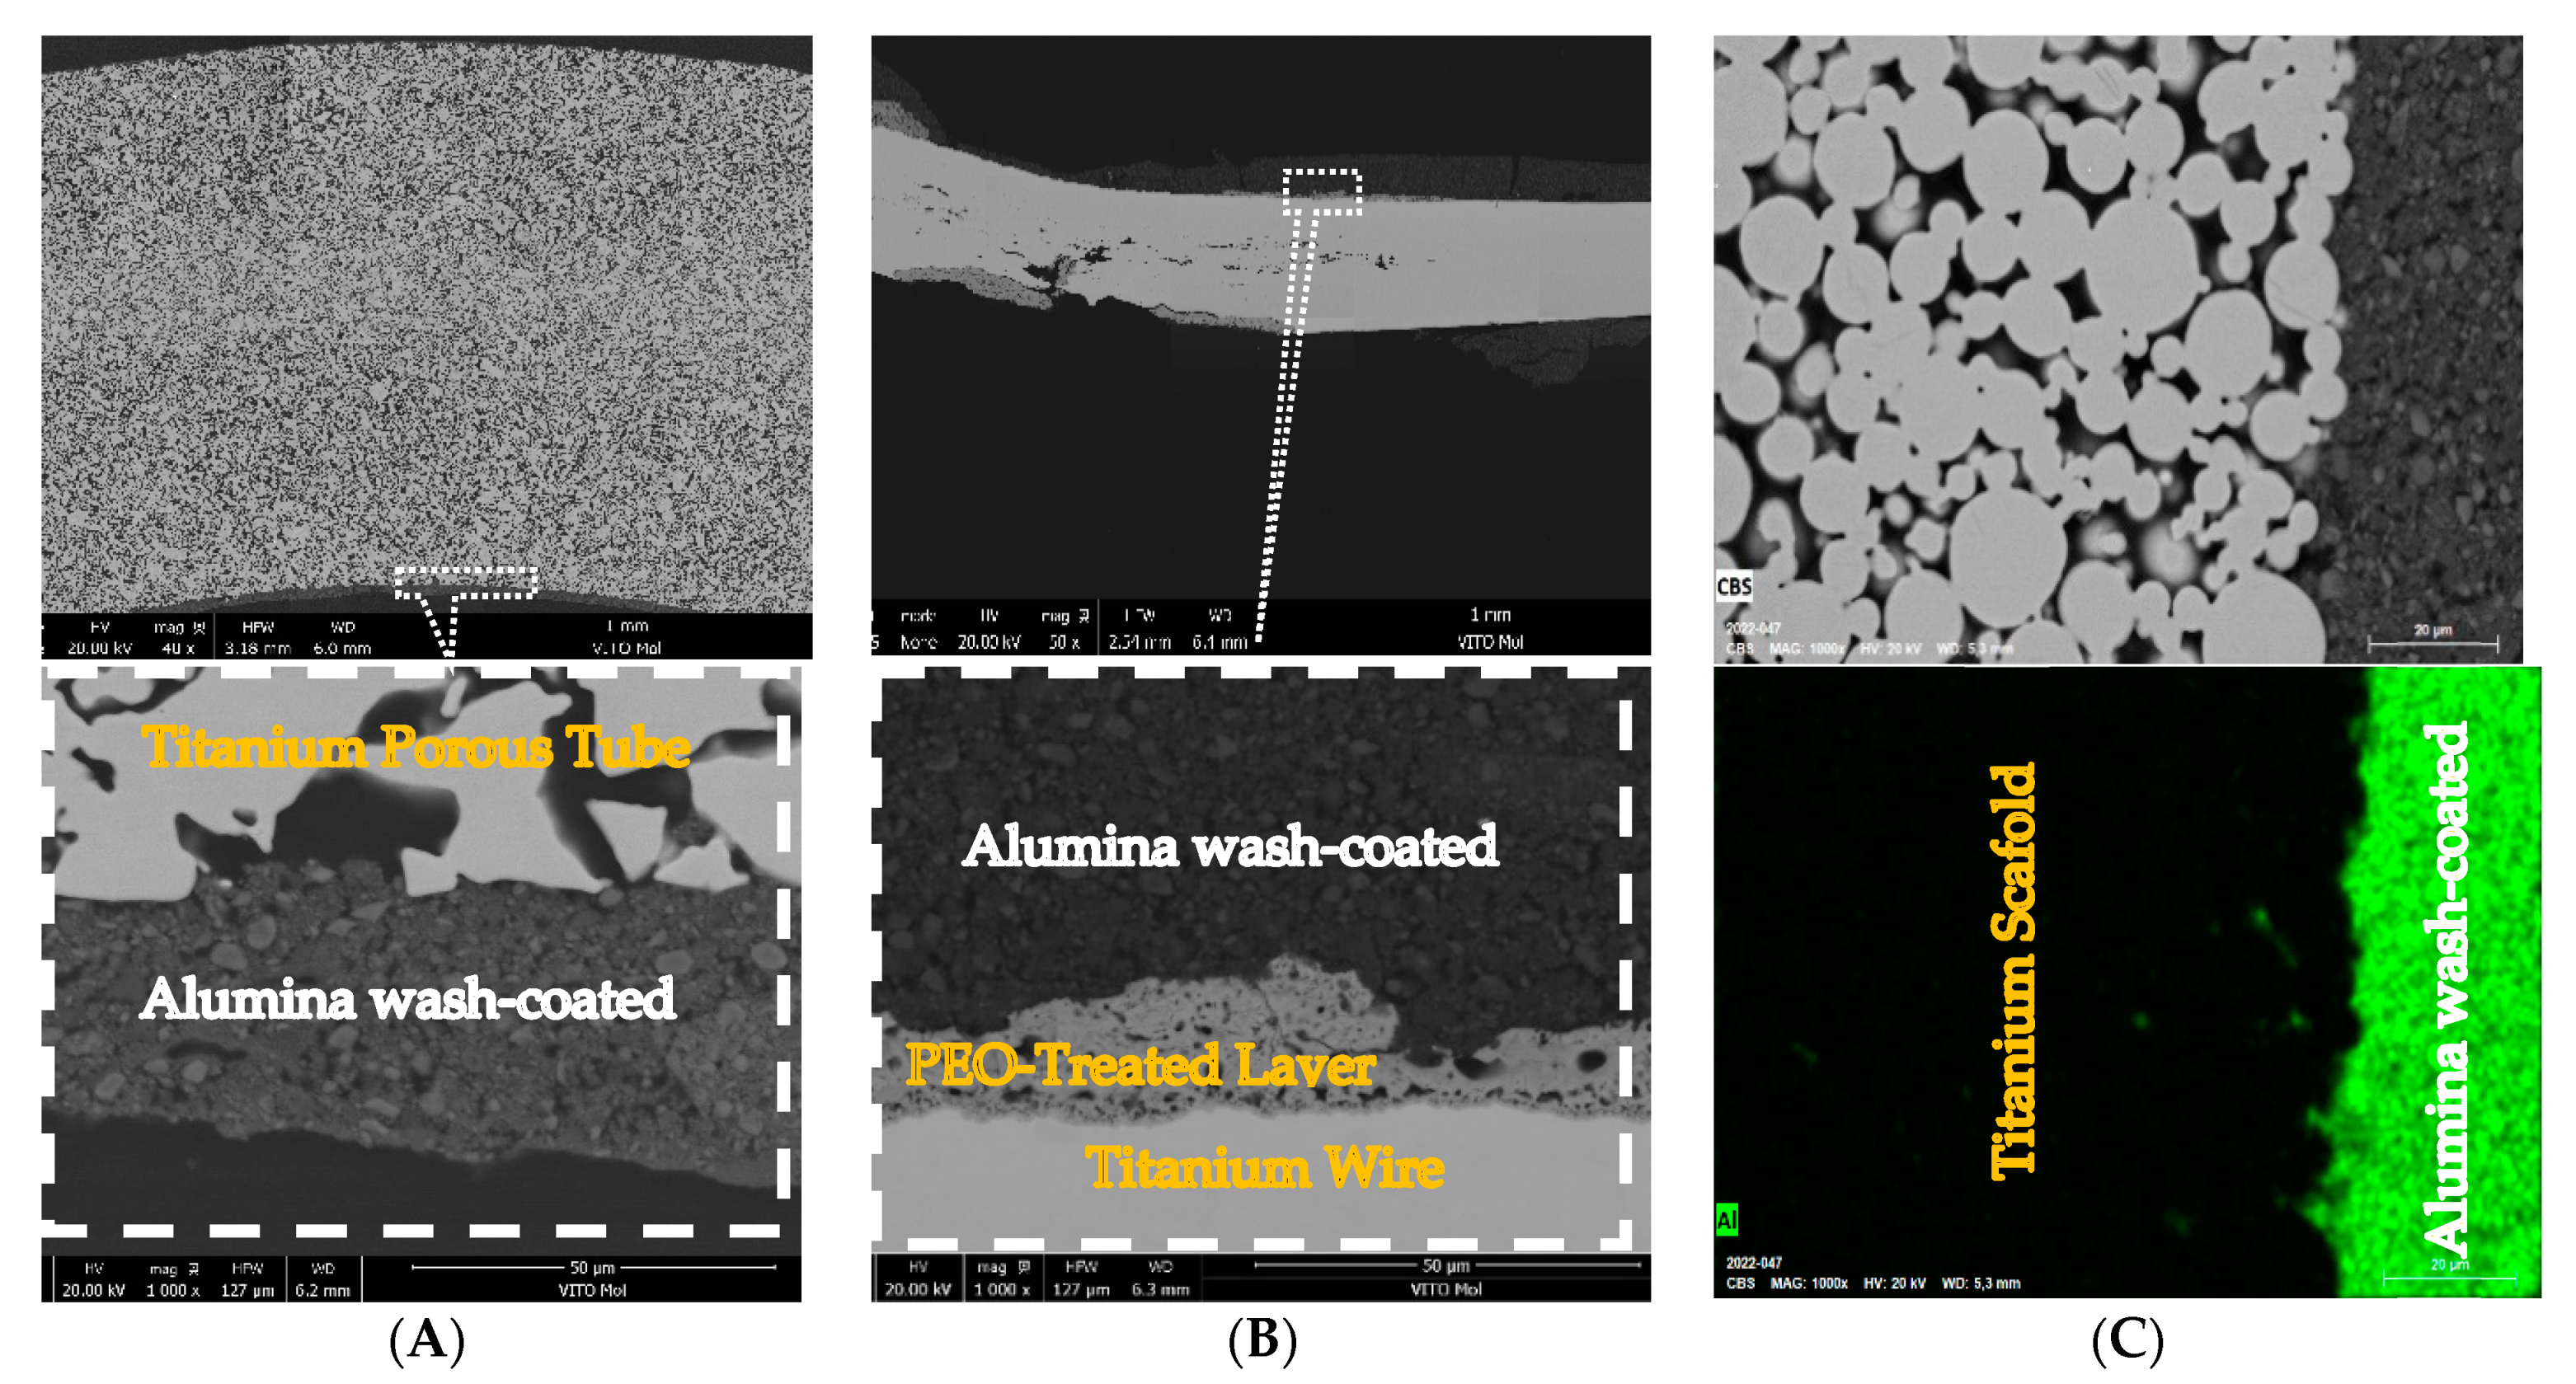
The PEO experiments were started using a titanium plate. The observed PEO behavior, in terms of the time-current intensity and the appearance of the arcs (typically visualized in Appendix A), was utilized to improve the configuration of the setup and tune the operating parameters. Subsequently, other sample types, namely porous tubes for the membrane application, 3D-printed scaffolds, as well as wire and wire bundles for catalyst applications, were treated using the PEO setup under the accordingly determined set of parameters. Each of the following subsections will report on the results of the respective sets of samples. The reported results include the SEM-EDX and XRD results of the treated samples under different sets of conditions. Finally, the selected results will demonstrate the coating–adhesion potential of the PEO-treated samples that will be used as catalysts or membrane supports.

3.1. SEM-EDX

3.1.1. D-Printed Titanium Scaffold

Different regions of interest (ROIs) of the 3D-printed scaffold samples were analyzed by SEM-EDX. For instance, region A and region B on the same 3D-printed titanium scaffold sample (treated under 200 V, 50 Hz, using Na2SiO3, E1) turned out to show different levels of treatment efficiency in terms of thickness and coverage of the treated layer as shown on the SEM images in Figure 4.
Utilizing EDX analysis, the material composition of the depositions at each ROI was evaluated, showing that there was considerable oxidation, with oxygen atomic concentrations in ROI A and B being 53.6 and 51.9%, respectively. In addition, the presence of other elements, including the oxide concentrations of Na and Si, was measured. TiO2, the predominant oxide component with significantly higher weight percent, was measured at ROIs A and B, showing 92.4 and 96.3 stoichiometric weight% of all oxides formed, indicating that the extent of oxidation on the same sample differed slightly and the surface coating composition exhibited minor inhomogeneities, even though the treatment in some regions could be visually distinguished from the others.
To visualize the scale, SEM images of a 3D-printed scaffold sample at different magnifications are shown in Figure 5.
The samples are porous owing to their strut-like structure (Figure 5B,C). Even at the microscopic level, at a map resolution of 10 µm (shown in Figure 5E), there are visible gaps between the particles indicating the presence of micro-porosity. These samples were immersed in the electrolyte so that their internal hollow surface areas with micro-meter space could be coated relatively easier with an oxide layer of TiO2 and electrolyte-deposited components. They have a high surface area with a controlled and well-stabilized coating due to their macro-channels and porous structure, which is made possible by PEO-treating the surface before coating it with the desired material, such as alumina, to impregnate or otherwise functionalize them for catalytic applications.

3.1.2. Porous Titanium Tube Samples

Figure 6 shows the SEM-EDX results for the porous tube sample at two different regions on the PEO-treated sample surface as well as on the surface of the fresh sample. In addition, during the PEO treatment of these samples, arc generation was relatively violent.
The occurrence of PEO can be confirmed by comparing the images and EDX analysis of the surface in regions (A), (B), and fresh sample (C). The SEM image and EDX data of the fresh sample (C, Figure 6) showed that the surface appearance of the post-PEO-treated samples in both regions (A and B) was different than in untreated samples. In addition, their surface oxygen content was significantly higher. The untreated samples possess some amount of oxygen content due to the presence of a passivating oxide layer unavoidably present on the metal surface.
The porous tube sample underwent PEO treatment, which led to a coating that was somewhat uneven in certain places. For instance, region (B)s EDX-scan revealed only titanium oxide, while region (A) revealed a combination of oxides. When PEO-treating such porous tubular workpieces, it is expected that some areas show different local electrical resistance, discharge, and intensity of the arc generation than other regions, especially because of the way it has been connected to the anode via wrapping with a titanium wire. For instance, relatively intense generated sparks resulted in relatively more oxygen content, although not all in titanium oxide form. Several cracks were visible on the SEM image and EDX data of the treated surface in region (A), Figure 6. In region (B), however, no deposition of the electrolyte was observed, indicating a homogenous layer adhered to the workpiece surface. An assembly mechanism was established in which the local resistances across the surface of the treated workpiece were similar, resulting in an enhanced PEO treatment in terms of the obtained homogenous treated layer through a better-controlled PEO process. Figure 6 shows the results of a 1 cm long porous titanium tubular sample wound with titanium wire and immersed completely in the aluminate electrolyte. This ensures that the entire sample surface is exposed to the electrolyte, in turn resulting in its entire surface being coated.

3.1.3. Titanium Wire Samples

The SEM-EDX results of three titanium wires samples treated under different voltages are shown in Figure 7. The results are for the samples processed in E2 aluminate-based electrolyte. As the electrolyte was the same, the effect of increasing the voltage could be tracked by following the images and data in Figure 7A–C, respectively, for the applied voltage of 220, 240, and 260 volts.
The extent of the targeted oxidation increased significantly with increasing the voltage in the circuit. In this manner, the stoichiometric weight percent of TiO2 was only 25% for sample (A) but 98% for sample (C), which had an applied voltage of 260 volts. In addition, a clearly declining trend of aluminum oxide was observed, indicating an increasing contribution of the surface to electrolytic components in the oxidation process.
Figure 7D depicts SEM-EDX data for a fresh (untreated) sample. It can be observed that the untreated sample had no oxidation content prior to PEO treatment. In fact, Figure 7A indicates that using the applied low voltage (220 V) and electrolyte concentration, there is more material deposited on the surface from the electrolyte than titanium converted to titanium oxide. The applied higher voltage in test (C) resulted in visible cracks being formed due to more energetic discharges and larger currents being generated on the sample’s surface.
In order to provide a better scale of visualization and a representative larger-scale view showing to what extent the treated surface is homogeneous, Figure 8 shows SEM images for different regions and magnifications of a titanium wire sample.
The morphology of the treated surface was found to be non-homogeneous, as can be seen in this figure. The non-homogeneity can be ascribed to the wild sparks generated during the process, and the local high temperatures, which were very difficult to control around the wire. The frequent seizing and re-starting of the intense sparking observed during the experimentation could also be a reason for the uneven treated/deposited layer over the wire surface. The surface of the sample was treated by immersing it in the electrolyte so as to form the least dense inner layer, even if there was no visual presence of electrolyte-deposited material or converted surface titanium to a titanium dioxide porous oxide layer.

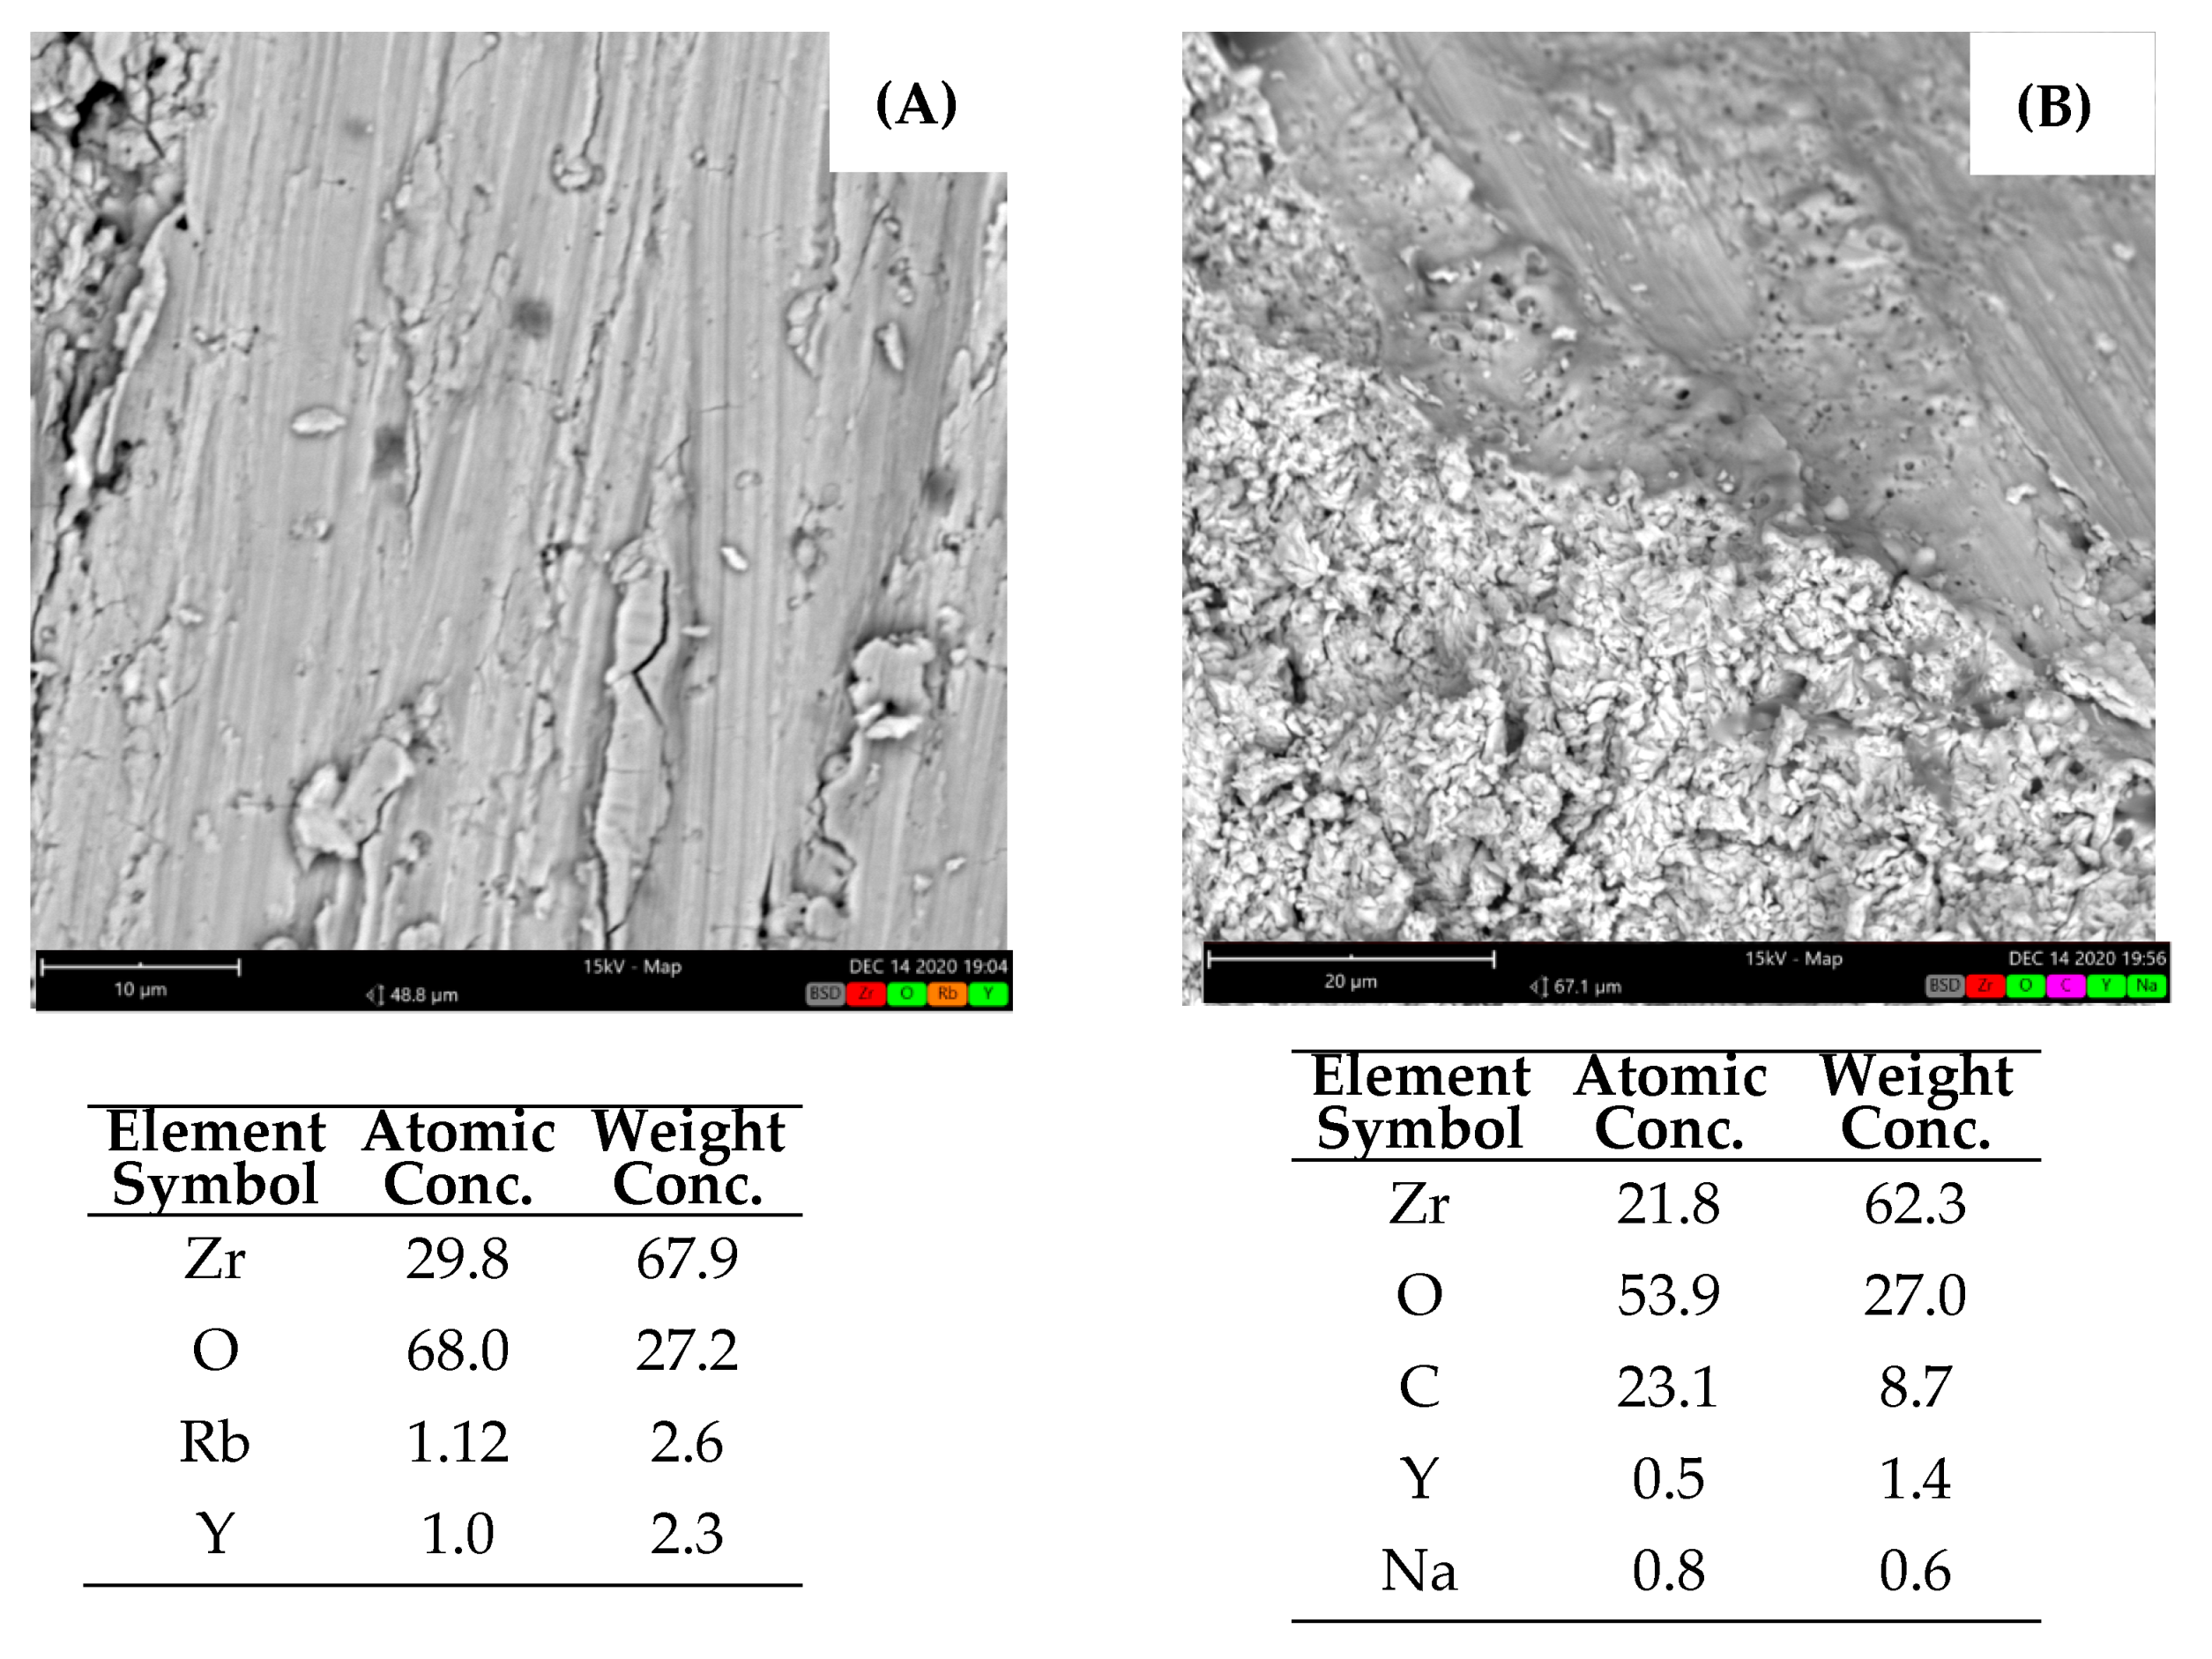
3.1.4. Zirconium Wire and Wire Bundle Samples

SEM-EDX results for zirconium wire samples are shown in Figure 9, where the samples were processed in the aluminate electrolyte. Figure 9A,B were treated at 220 V, and Figure 9C,D were treated at 240 V.
The 220 V treated samples possessed a relatively smoother surface indicating a denser and thinner coating. In Figure 9C,D, several pore-like structures can be seen on the surface, along with the presence of uneven lump-like structures. As expected, the oxygen and Zr content increased with increasing voltage from 42.9% and 23.1% to 69.06% and 28.5% atomic concentration. In comparison, Figure 9E, which depicts the SEM-EDX data for an untreated sample, shows no oxygen content on its surface prior to PEO application. This indicates that by applying PEO, an oxide coating (TiO2) was formed on the surface, including the deposition of lump-like structures which correspond to electrolyte-deposited components (Al).
Two different regions of a zirconium wire bundle sample were characterized by SEM-EDX; the results are shown in Figure 10.
Like the titanium wire samples, it was observed that the coatings over the entire sample surface were not fully homogeneous. The depicted region on the right of Figure 10 was, to a larger extent, covered by a raised, rough surface. The region shown on the left was smooth and dense, with a higher amount of zirconium. This is an indication that the region with the raised surface was exposed to increased amounts of intense sparking, resulting in an uneven surface with many cracks.
Considering the theoretical understanding of the mechanism involved, the following aspects should be highlighted in tracking the impacts of the operating parameters and explaining the observed experimental trends in the PEO treatment of different samples. Firstly, a higher applied voltage, while keeping the other set of conditions constant (i.e., same sample, electrolyte concentration, and frequency), basically means overcoming the given resistance in a shorter time and resulting in a higher current generation. Using a more concentrated electrolyte while the other conditions remain the same has a similar effect. These have been shown in Figure 3 for the 3D-printed scaffolds and in Figure A7a,b (Appendix C) for titanium wires.
On the other hand, increasing the applied frequency results in a slightly higher established current, as shown in Figure A7c (Appendix C).
Regarding the impact of substrate material under similar PEO treatment conditions examined in this research, compared to zirconium samples, a higher tendency of titanium to be oxidized was observed. This is evidenced by comparing the current-time graphs for Ti- and Zr-wires, where for a similar range of applied parameters in PEO treating of Ti wire samples, the current generated is higher, and the oxidation time (tm) is reached sooner. These have been typically shown in Figure A7a,d (Appendix C). These are in line with the general understanding of the primary steps of oxide layer generation in the PEO process and the relatively lower passivating tendency of zirconium [77,78].
The impact of surface area was highlighted in explaining the observed different morphologies on different substrate shapes. For instance, different observed morphologies on titanium porous tubes and titanium wire, which represent a high and low surface area, can be associated with (a) relatively higher resistances of the adjacent electrolyte, in particular at lower applied voltages, (b) lower level of oxidation of titanium to titanium oxide over the workpiece with larger surface areas. The latter was also confirmed via the reported results of the XRD analysis (Section 3.2.1), where it will be explained that the limited current over a larger surface area results in a lower extent of sub-stoichiometric oxidation.

3.2. XRD

The results of XRD analysis, utilized to study the surface phase transformation of different PEO-treated samples under different sets of conditions, are reported in this section.

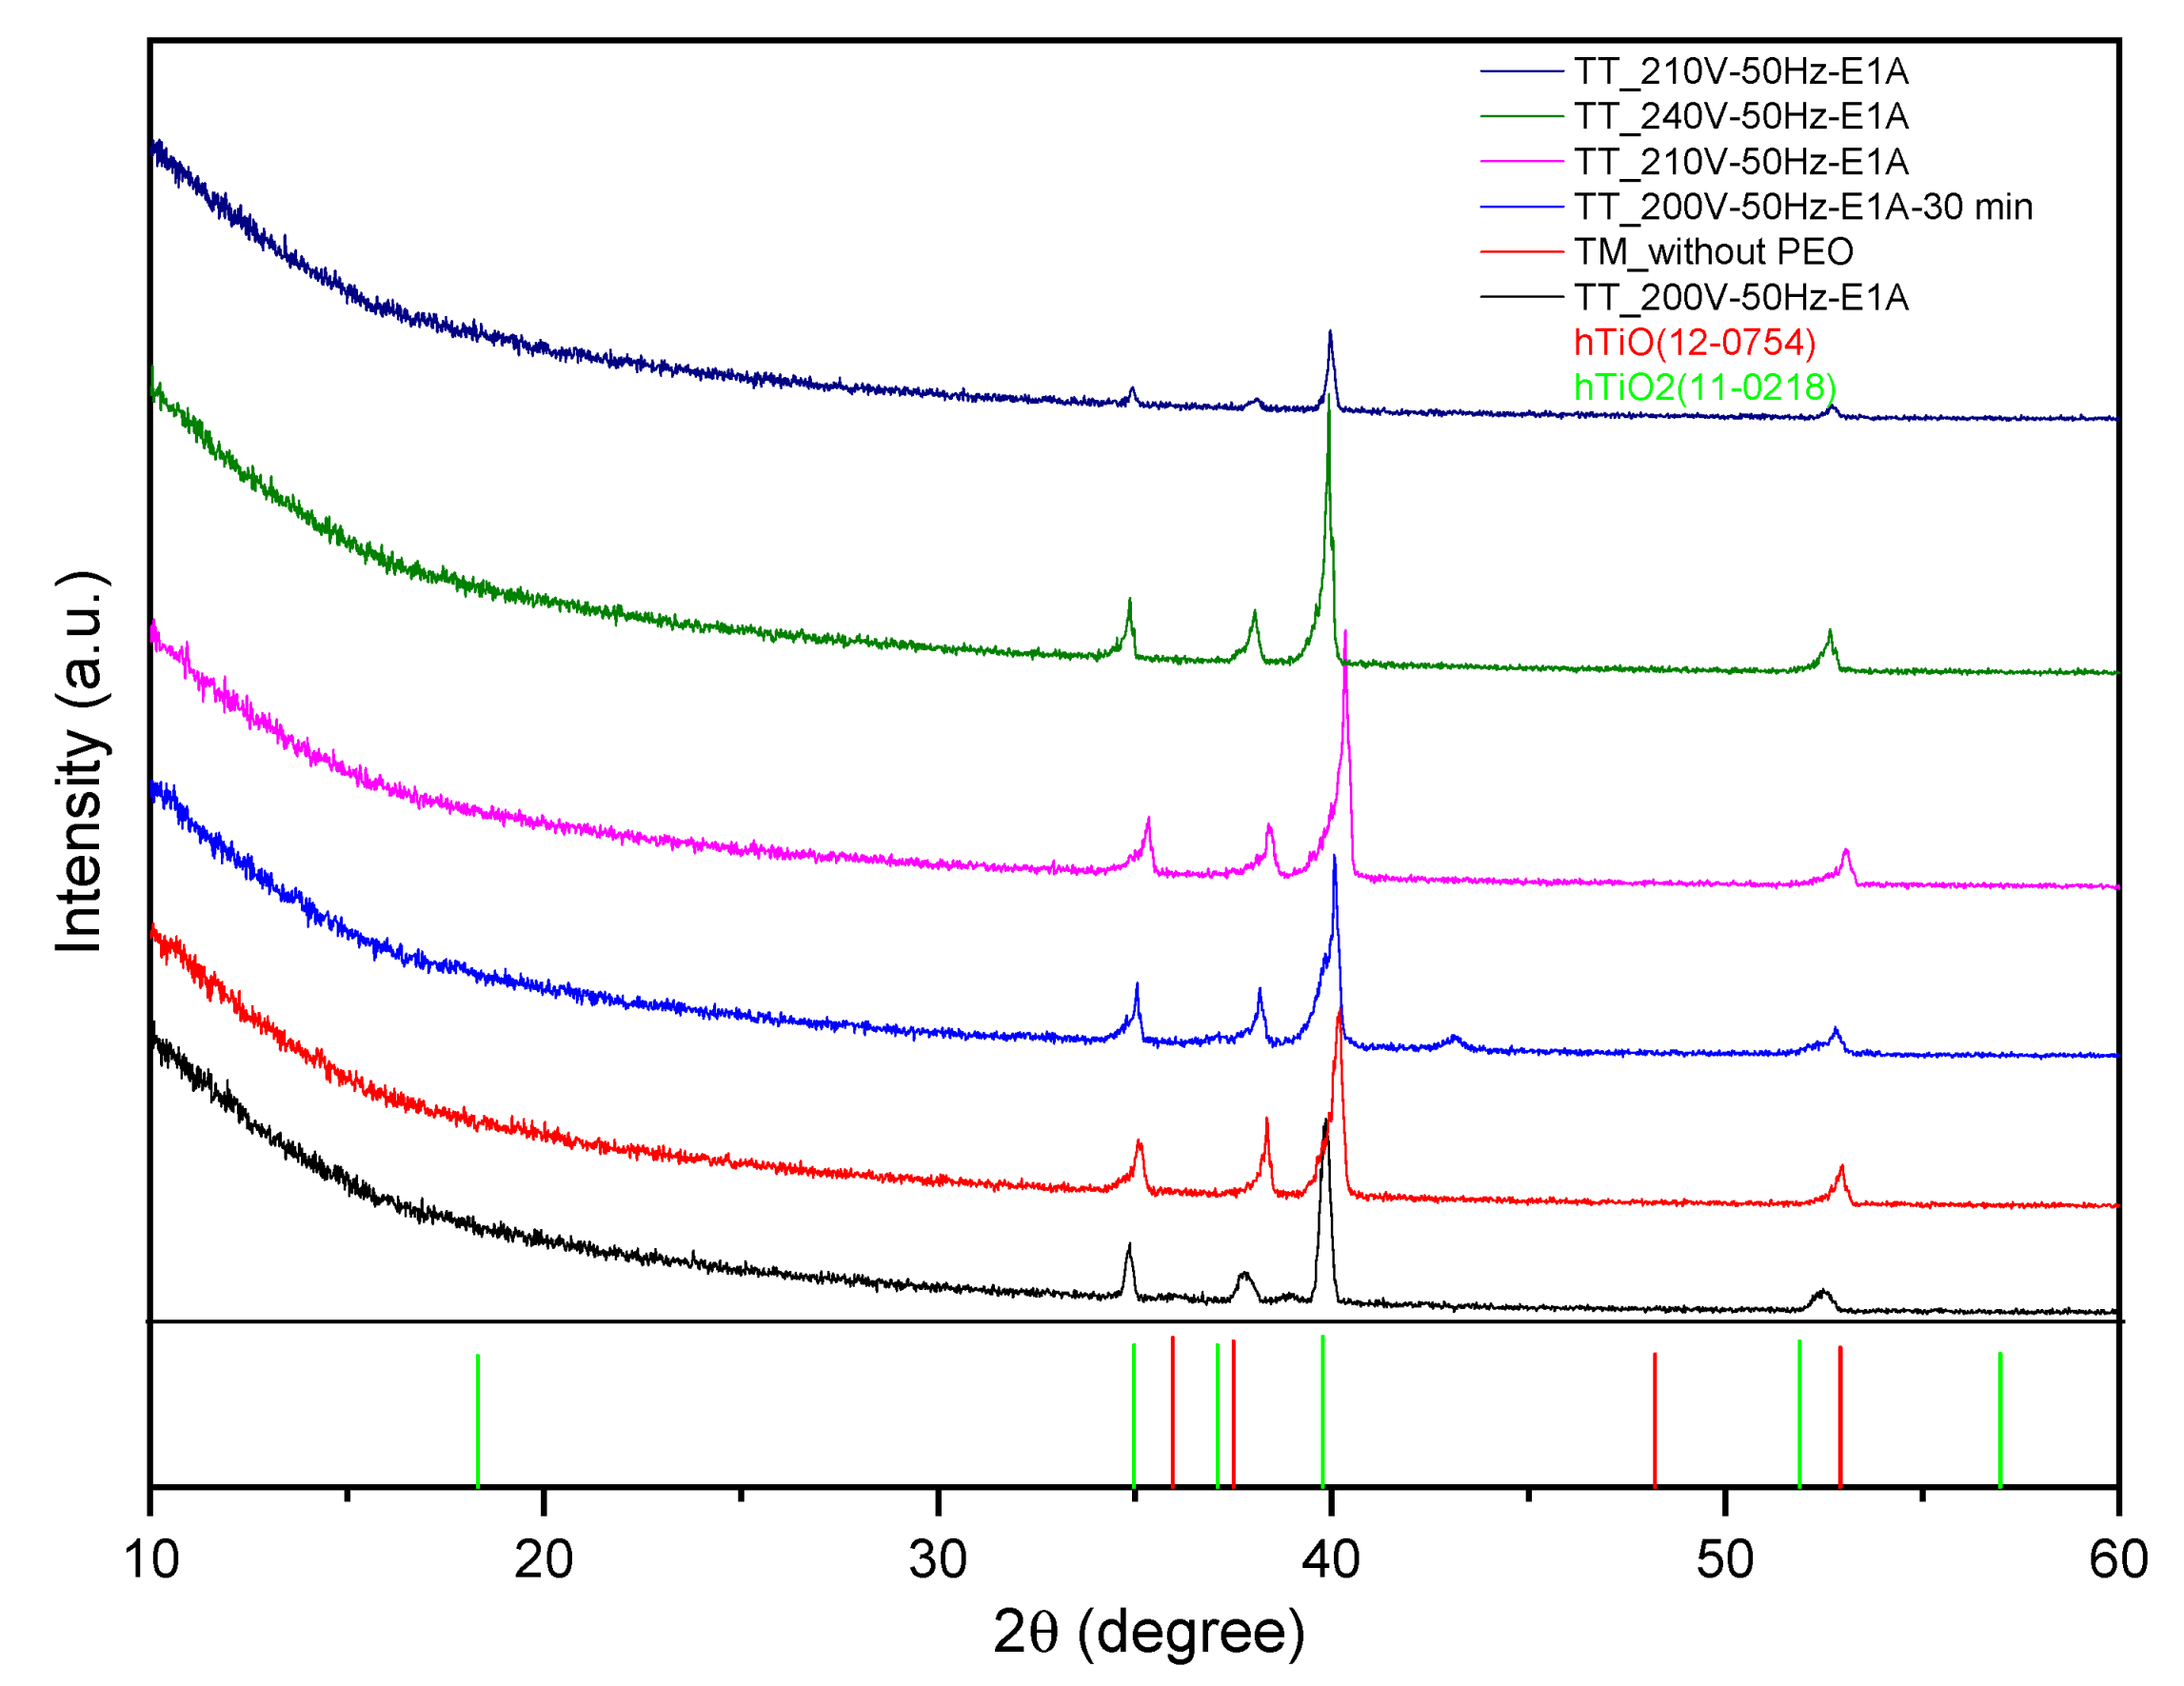
3.2.1. Porous Titanium Tube Samples

The XRD spectrum of several titanium porous tubular samples is shown in Figure 11. These include a fresh porous tube sample and four other tubular samples treated for a short time under different sets of conditions. The XRD spectrum of a porous tubular sample that was PEO-treated for a relatively long time (30 min) is also shown in this Figure. Such long-time PEO treatment was made possible by tuning the parameters in a way that smooth, mild arc generation was established over the sample surface.
Comparing all these spectrums indicates that only the surface of the sample that was PEO-treated for a long time (30 min) showed an oxide peak detectable by XRD. This indicated an even longer PEO treatment would be required to secure a completely treated surface. Even so, the detected oxide phases in the case of the sample with the long-time PEO treatment (e.g., TiO) are sub-stoichiometric in oxygen, which also indicates incomplete PEO treatment. This implies that even for tubular porous samples with a length of 1 cm, the process parameters (such as power, voltage, current, and oxidation time) were not sufficient to completely oxidize the sample surface. The parameters should therefore be optimized so that a prolonged controlled PEO treatment can be secured, which, in turn, would make it possible to establish titanium dioxide on the entire surface, for instance, in the form of a crystalline phase and ideally in the form of anatase. In particular, the limitation in obtaining the current from the power source should be addressed in this context. Due to the relatively large surface area of the tube samples, the current required to obtain a conventional current-time trend with plasma discharge was more than 6.5 A. Therefore, it would be necessary to use a higher-powered power source with a larger current output to efficiently coat such samples by PEO.

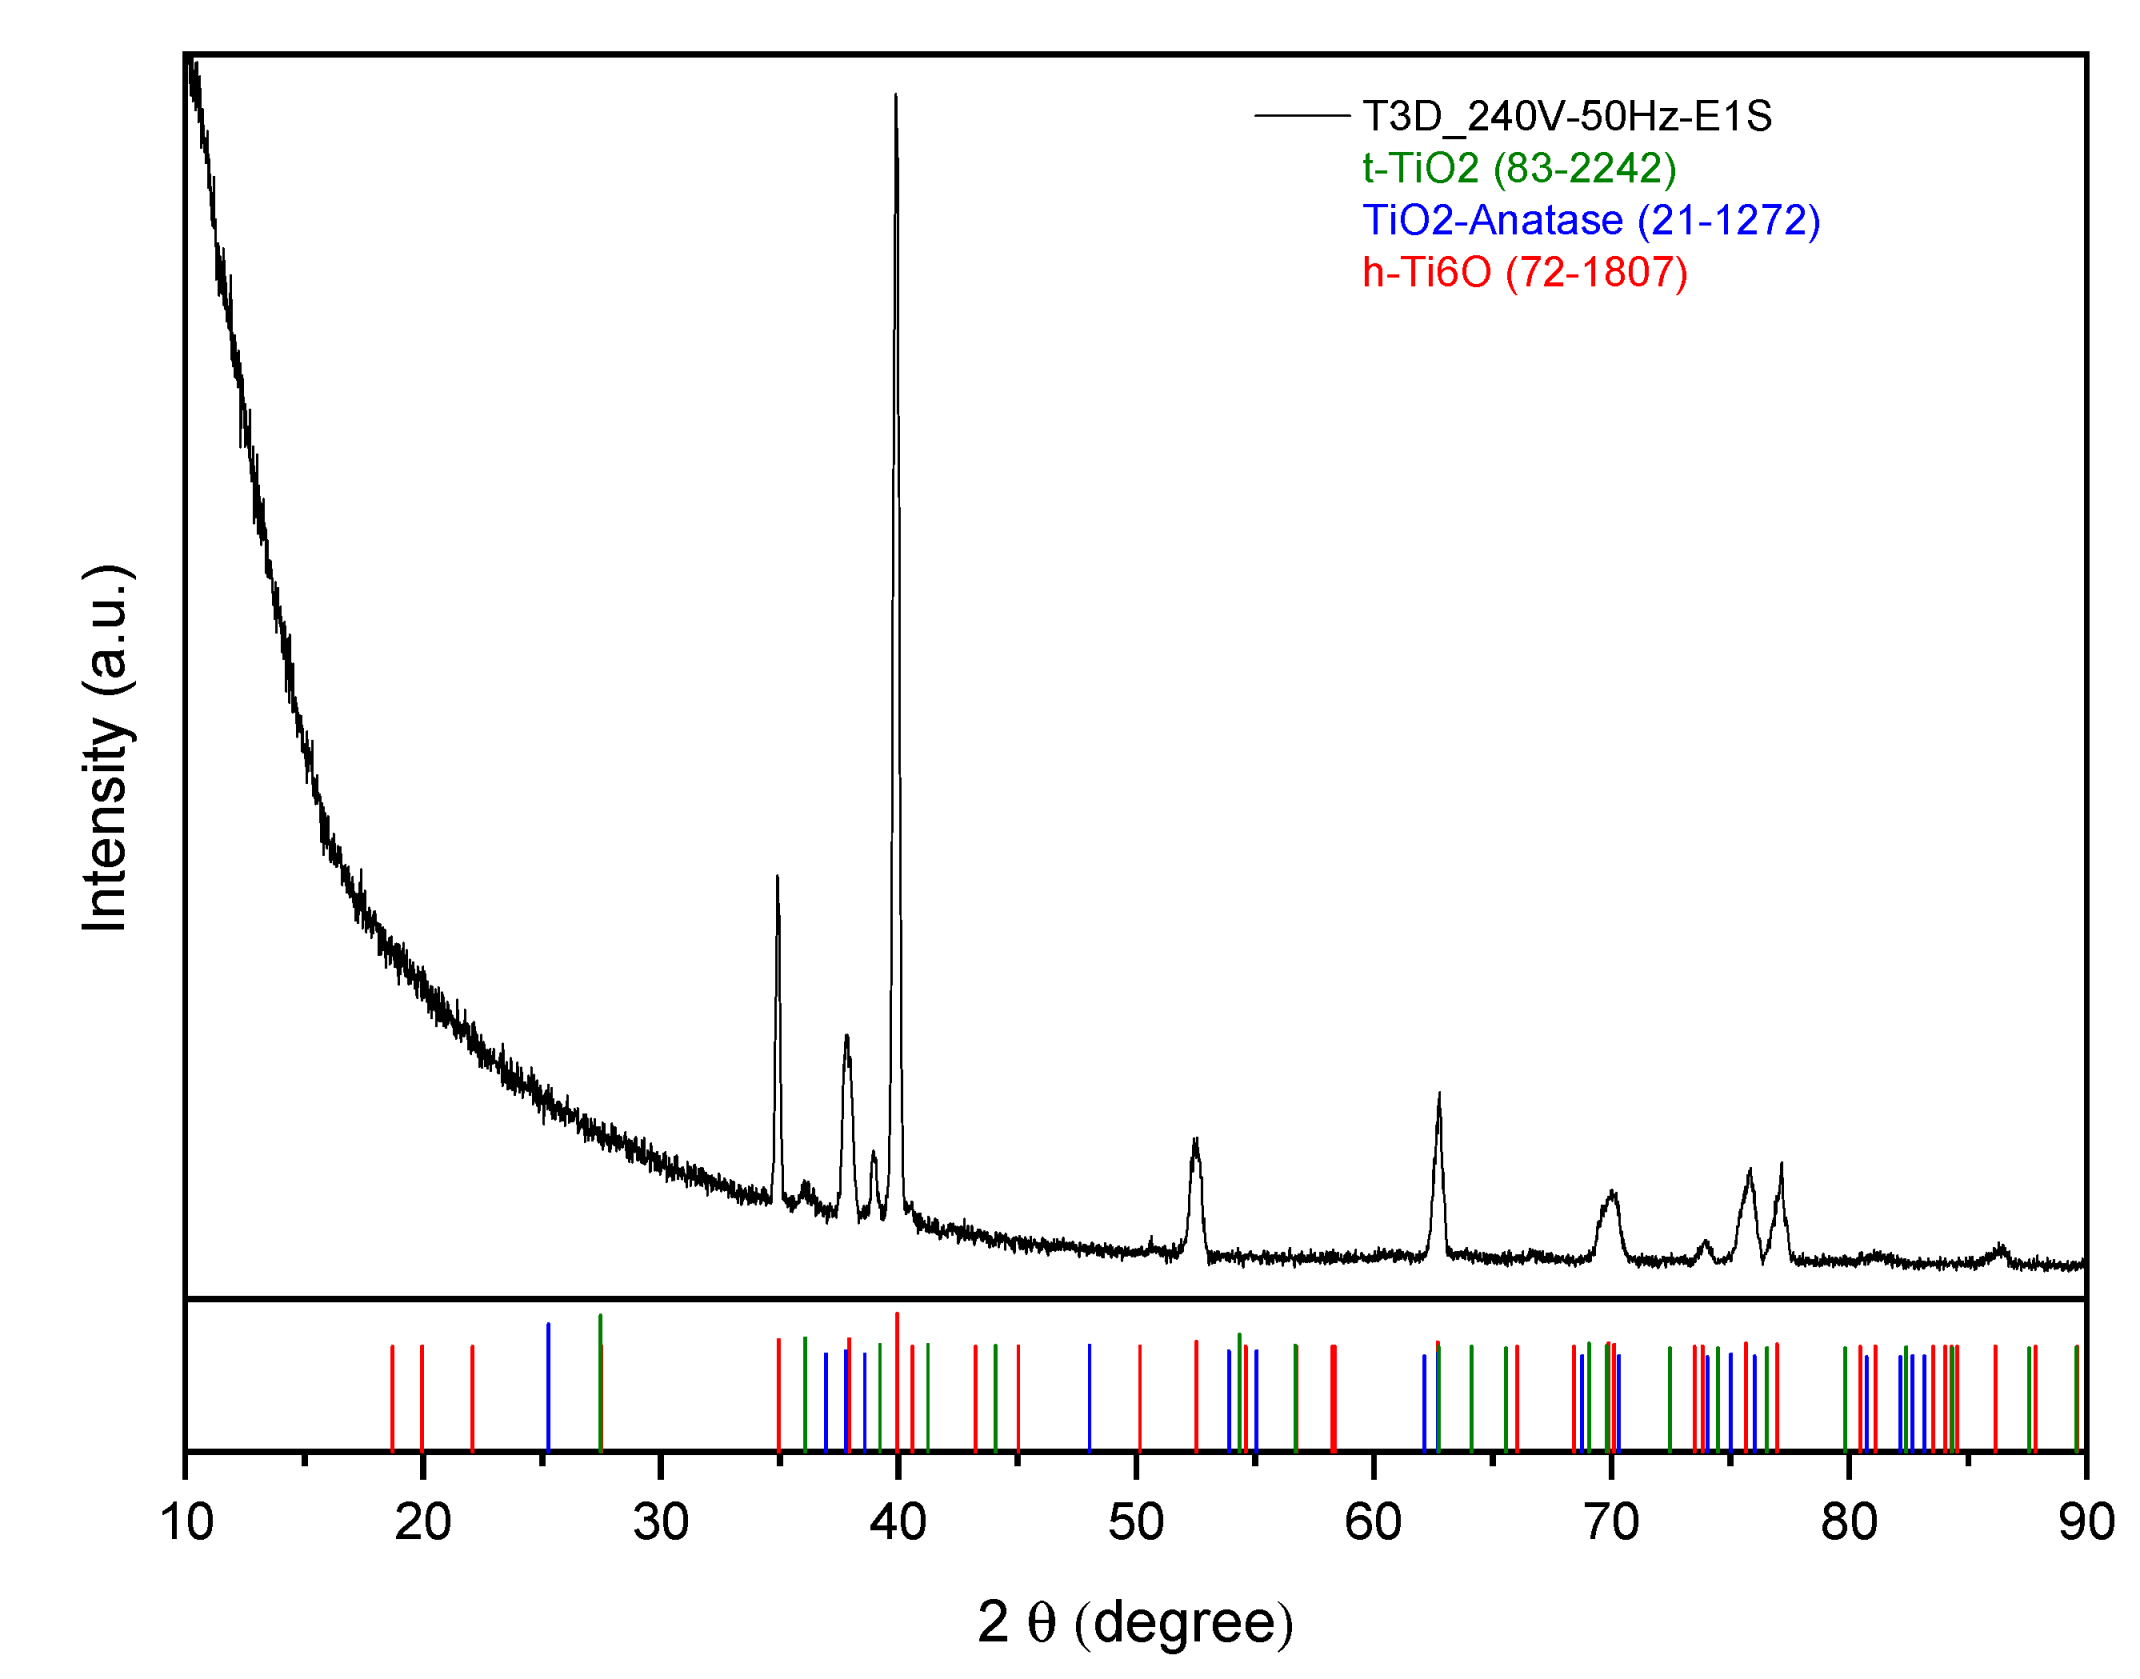
3.2.2. D-Printed Titanium Scaffold

The XRD spectra for the 3D-printed titanium scaffold sample are shown in Figure 12. Like the previously discussed porous tubular samples, the results of a short and incomplete PEO treatment can be tracked by the peaks of sub-stoichiometric titanium oxide (e.g., Ti6O). However, Figure 12 also shows that the anatase TiO2 phase has been created over the PEO-treated samples, which is promising for the scope of catalyst applications.
It was observed that the PEO-treated surface was covered with a metastable Titania phase (green line). Given the PEO-treated samples’ altered hue, it is expected that there are further oxidized phases on the surface, maybe in the form of a non-crystalline phase, which is to be fully identified by XRD. It is also expected that a longer PEO treatment with improved controlled discharge would result in more crystalline titanium dioxide (TiO2) coating.

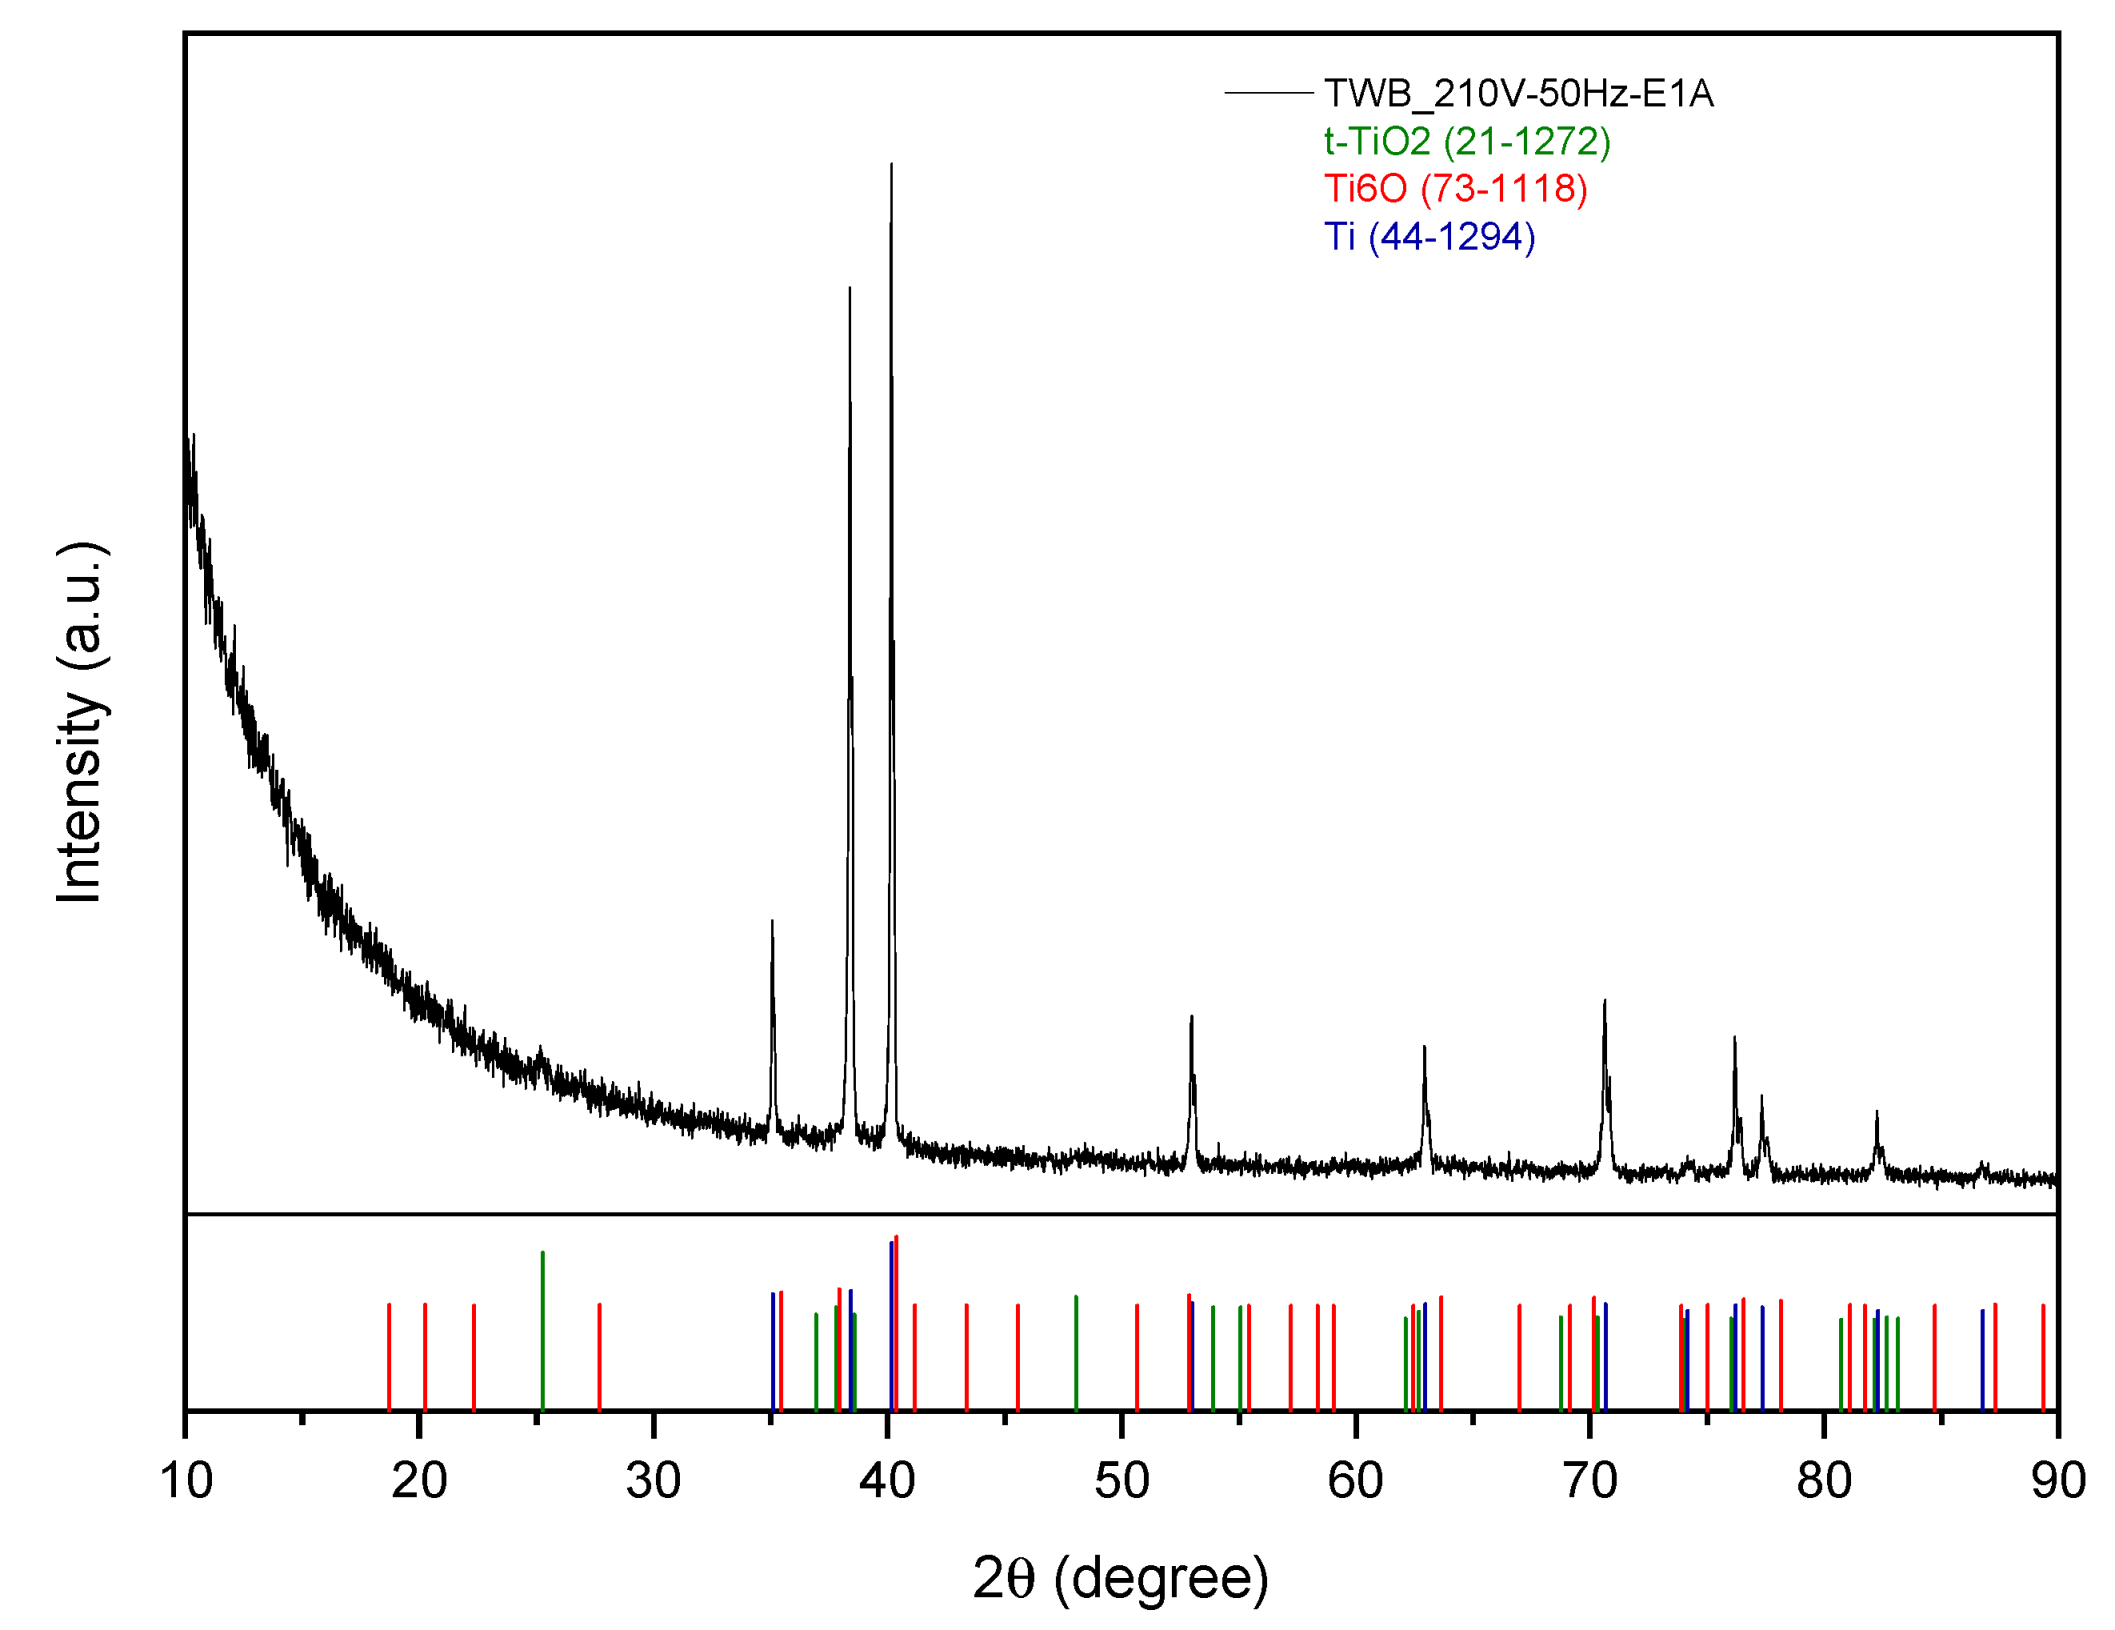
3.2.3. Titanium Wire Bundle

The XRD spectra for the titanium wire bundle sample shown in Figure 13 indicate that anatase TiO2 has been formed over the PEO-treated surface, although its peaks are mild.
Like the previously discussed samples, the sub-stoichiometric phase of titanium oxide (e.g., Ti6O), represented by the pink lines, was also present on the PEO-treated surface of these samples, indicating an incomplete PEO treatment. The presence of anatase indicated the potential of the PEO process to establish samples with stable crystalline titania over wire bundles, even though the process was not optimal. This indicates that fine-tuning the process parameters and better control over the electrolyte temperature would make it possible to obtain a treated surface with a higher degree of crystallinity.

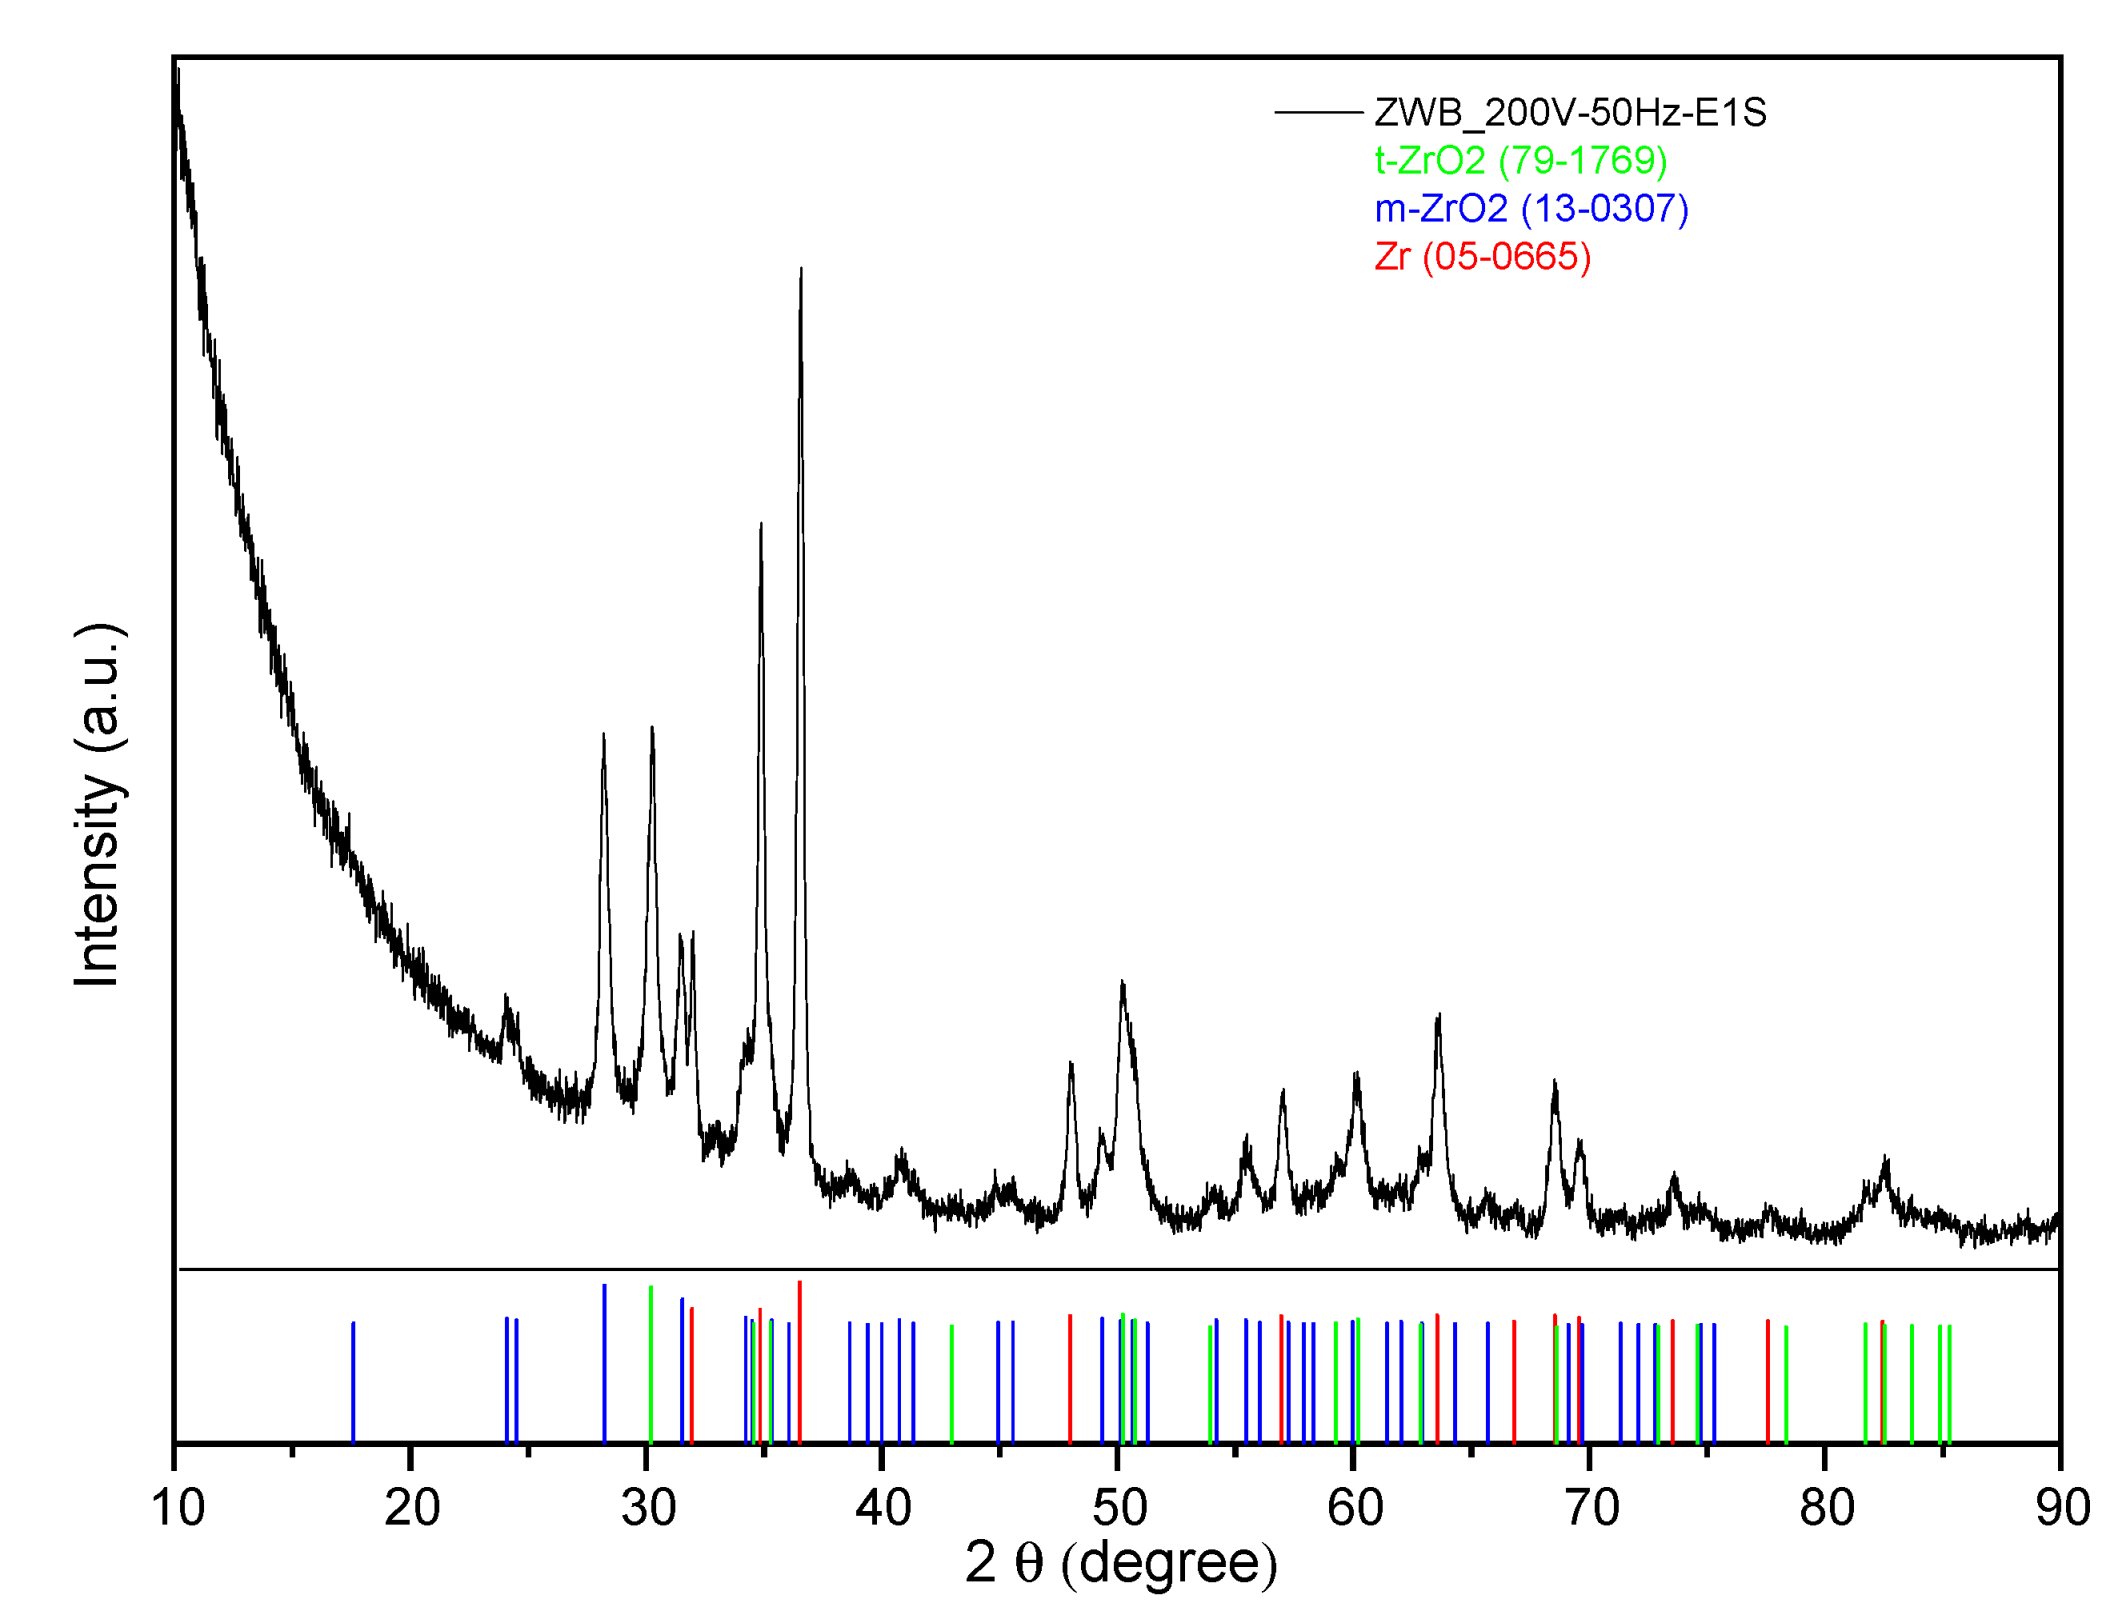
3.2.4. Zirconium Wire Bundles

There are several peaks in the XRD spectrum of the zirconium wire bundle sample depicted in Figure 14 that demonstrate a sizable amount of oxidation.
The recorded XRD result can be correlated to the observation of spark generation and PEO behavior in general. For instance, it was observed that the currents produced during the PEO treatment of zirconium wires and zirconium wire bundles were relatively lower compared to the titanium wire samples. This was accompanied by the observation of a mild-spark discharge during the PEO processing of the zirconium wire and zirconium wire bundle samples. As a result, the process could be run for longer periods of time under a controlled mild-spark discharge regime, which ultimately led to the appearance of a relatively intense crystalline ZrO2 phase across the treated sample identified by the XRD peaks.
Mild SiO2 peaks were found in addition to ZrO2, indicating the presence of a crystalline SiO2 phase that resulted from an electrolyte-deposited component in the treated surface together with the crystalline ZrO2.

3.3. Typical Coating Potential of the PEO Treated Samples

In order to study the coating-adhesion potential of the PEO-treated surface of the different workpieces, they were coated by conventional alumina wash-coating before and after being PEO treated. Figure 15 shows the successful coating of the PEO-treated samples, including the porous tubular, 3D-printed scaffold, and wire samples.
All samples could be coated, as observed in both millimeter and micrometer scales. Nevertheless, the specifications of the coating of some PEO-treated samples, in terms of thickness and adhesion strength of the coated layer, were different. These were observed visually and by removing the coated layer of the PEO-treated samples. For the samples with relatively larger surface areas, such as 3D-printed samples, and in particular tubular samples, the improvement in coating adhesion as a result of PEO treatment was less significant due to their porous nature and limited PEO treatment across the surface.
Coating procedures with a set of fine-tuned parameters could take better advantage of being combined with PEO treatment. For instance, 3D-printed samples without PEO treatment could be coated, but some of the channels were getting blocked completely. When the coating parameters are tuned to prevent this, the coating efficiency across the wall of the untreated samples could be significantly reduced, while the PEO-treated samples could still be coated sufficiently.
These results, along with additional data reported in detail in Appendix B, demonstrate the promising potential of PEO treatment of such samples, when combined with conventional coating techniques, to establish a structure with the targeted characteristics to be utilized in catalytic and membrane applications. The porous metal oxide layer established by PEO treatment could act as a support layer or a treated surface for coating an extra layer, either for catalytic material deposition or as a membrane layer to facilitate gas permeation and separation through it.
Reviewing the desired specifications of such targeted tailored membrane/catalytic systems applications enables further highlighting of the practical potentials of utilizing the knowledge in this research. In this context, distinguished specifications and the advantages of the PEO-treated titanium porous membrane for membrane reactor applications (e.g., OCM process) in comparison to the reported state-of-the-art membranes [49,79] for this application could be highlighted here. These are specifically the technical challenges of sealing and improving the mechanical resistances of ceramic membranes to the pressure and temperature shocks on the other side, as well as the challenges of establishing the desired permeation and minimizing the undesirable activity of metal membranes. These are among the main concerns regarding using state-of-the-art membranes for the OCM membrane reactor application. This could be addressed by directly using the PEO-treated titanium porous membrane over which the targeted tailored permeation has been established through fine-tuned PEO treatment. Such PEO-treated surfaces can also be coated using a ceramic layer (e.g., alumina) and then be utilized for such an application.
Moreover, the structured and 3D-printed titanium scaffolds could be successfully treated with PEO and coated to function as a catalyst support for different applications. For instance, its desired thermal characteristics (e.g., high thermal conductivity) could improve the thermal-reaction performance of the targeted systems. This has been previously demonstrated for several exothermic catalytic applications, including carbon monoxide oxidation [80], methanol synthesis [81,82,83], and other applications [84]. There are some reports comparing various synthesis–processing procedures, including plasma processing and PEO-treatment of supports, for even higher temperature catalytic applications [85], including gasification [86]. In particular, the PEO-treated zirconium and titanium wire bundles can be further coated/impregnated with active catalytic materials such as lanthanum oxide and utilized in this form in an OCM reactor. This enables addressing operating challenges such as hot-spot formation and securing an enhanced thermal-reaction performance.

4. Conclusions

Depending on the type of sample and its surface area, PEO was used to treat samples with various geometric configurations such as porous titanium tubes, titanium and zirconium wires and wire bundles, as well as titanium 3D-printed structures. Even though the samples were treated by a non-optimized PEO process, the coating–adhesion potential of the treated samples was shown to have been significantly improved. The porous metal oxide layer served as a support layer or a layer on top of which an additional layer of alumina could be applied effectively using a simple alumina wash-coating, resulting in a homogeneous and thick layer. These could be used either for further catalytic material deposition or as a membrane layer to facilitate controlled gas permeation and separation. In order to optimize the results of the PEO treatment, the design of the setup can be adjusted, including the specifications of the power supply, the dimension of the electrolyte bath, and the efficiency of the temperature control.
The characterization techniques SEM, EDX, and XRD were used to study the characteristics of the fresh, treated, and coated surfaces in terms of their structure, morphology, composition, and involved material phases. The process parameters, such as the applied voltage and frequency, as well as the electrolytic composition, were changed to conduct a number of sensitivity analyses. Two electrolytes, namely sodium metasilicate and sodium aluminate, were tested in three different electrolyte concentrations.
The SEM and EDX analyses showed that using the silicate electrolyte has resulted in more electrolyte deposition on the treated surface in the form of lump-like structures. Due to the higher conductivity of the electrolyte, the extent of oxidation was larger, resulting in larger currents being generated compared to the aluminate electrolyte. The wire samples were the most straightforward to be PEO treated owing to their simple geometry and relatively small surface area. For most of the wire samples, there were regions of the wire with significant surface modification and regions that were comparatively smooth, indicating a lesser extent of modification. Using a bundle of wires enables the creation of catalytic beds with a relatively well-distributed and treated support surface for catalytic material coating at the macro-scale. This was particularly advantageous for the exothermic catalytic system that was the subject of this study, in which the performance of the thermal reaction is significantly influenced by varying the reaction intensity across the catalytic bed.
Due to PEO treatment of the surface, plasma discharge was seen across the porous tube and 3D-printed samples. However, it was only at a sub-optimal level because of the size of the samples and their inadequate connections to the anode. This aspect needs to be optimized for future applications. The XRD results showed the presence of anatase TiO2, which is a crystalline phase of TiO2, in the titanium wire and 3D-printed samples, which is desirable for catalytic applications due to its more stable and ordered crystalline structure.

Author Contributions

H.R.G.: conceptualization, methodology, investigation, visualization, project management, formal analysis, data analysis, curation, validation, characterization, supervision, writing—original draft, review, and editing. A.V.P.: conceptualization, methodology, investigation, implementation, validation, data analysis, curation, writing—original draft, review, and editing. V.M.: conceptualization, material fabrication and characterization, partial project administration, investigation and implementation, methodology, review, and editing. O.G.: characterization, data analysis, curation, writing—review, and editing. S.L.: conceptualization, methodology, support with the assembly and experimentation, supervision, review, and editing. F.G.: conceptualization, supervision, resources and funding, project administration, data analysis, review, and editing. All authors have read and agreed to the published version of the manuscript.

Funding

This research received no external funding.

Data Availability Statement

The data presented in this study are available on request from the corresponding authors. The data are not publicly available as they need to be further refined and then provided in response to each particular request.

Acknowledgments

The authors are grateful to Vishnu Sureshkumar and Arash Rahimalimamaghani for their valuable and helpful input. We would like to thank Jo Verwimp and Raymond Kemps for their help with 3D printing and electron microscopy measurements, respectively. Nanjing Youtian Metal Technology Co. is sincerely thanked for providing the metal wires. The authors acknowledge the cooperative and supportive attitude of Caltest Instruments GmbH in providing the power supply source for the experimentation.

Conflicts of Interest

The authors declare no conflict of interest.

Abbreviations

Abbreviations Full Phrase
EDXEnergy-Dispersive X-Ray Spectroscopy
MAOMicro Arc Oxidation
OCMOxidative Coupling of Methane
PEOPlasma Electrolytic Oxidation
ROIRegion Of Interest
SEMScanning Electron Microscopy
TTTitanium (Porous) Tube
TW/TWBTitanium Wire/Titanium Wire Bundle Samples
T3DTitanium 3D-Printed Scaffold
XRDX-Ray Diffraction
ZW/ZWBZirconium Wire/Zirconium Wire Bundle Samples
Coatingrefers to coating them via the alumina wash-coating method
Treatmentrefers to PEO-treating the metal workpieces
Nomenclature Parameter Unit
AmSparking currentA
CCurrentA
DInter electrode distanceCm
ICurrent densityA.cm−2
PPotentialV
TOxidation time S
tmSparking timeS

Appendix A. Preliminary Experimentation and Observations

For the preliminary PEO experimentation, a titanium plate (purchased from Salomon’s Metalen B.V, Groningen, The Netherlands) was used, which was cut into rectangular and disc-shaped pieces with a thickness of 4 mm. The plate consisted of commercially pure titanium, grade 2. In order to connect the disc samples to one of the terminals of the power source, a 3 mm diameter threaded hole was drilled into its lateral surface. To ensure proper electrical contact between the power source and the workpiece, a nylon screw with a diameter of 3 mm was screwed into the threaded hole of the titanium disc. The electrical contact was made by means of a 0.5 mm copper wire which was passed through a hole made through the center of the screw. At the end of the screw, the copper wire was fashioned into a bulb, which formed the point of contact with the titanium disc samples. A picture of this connection is shown in Figure A1 (A: disc workpiece, B: rectangular workpiece). The other end of the copper wire is connected to one of the terminals of the power source by a crocodile clip. Similarly, the connection of wires to the electrode is shown in Figure A1, where the formation of gas bubbles around the workpiece before (D) and after arc generation (E) could be observed. Significant efforts were invested to establish a proper connection and a controlled general spark generation during the treatment.
Figure A1. Connection of workpieces with the electrode: (A) a photo of the connection of disc-workpiece, (B) 3D visualization of the connection of rectangular-workpiece, (C) a photo of the connection of wires, (D) a photo of the connection of a single titanium wire right before the arc starts to be generated, (E) a photo of the connection of the same titanium wire after arcs are generated.
Processes 11 01260 g0a1

Appendix B. Additional Results for Characterization of Treated/Coated Samples

The potential of coating the fresh and PEO-treated samples and their characterization were studied in VITO. The results were used to visually check how efficient the coating was and determine the elemental and phase distribution of the base metal (Titanium and Zirconium) as well as the oxide forms of the involved components, including the coating material (i.e., Aluminium).

Appendix B.1. Porous Tube Samples

Figure A2 shows the elemental distribution of oxygen, titanium, and aluminium on a PEO-treated alumina-coated porous tubular sample. It can be observed that the base-metal titanium (Figure A2D) can be identified on most parts of the sample, excluding the edge. Conversely, the coating can be observed on the edge of the sample as evidenced by the presence of aluminium (Figure A2C), mainly as a result of the conventional alumina wash-coating. This was confirmed by tracking the oxygen distribution present in the coated alumina as well as the titanium oxide, as shown in Figure A2B.
Figure A2. Characterization of the PEO-treated alumina-coated porous tubular sample for (A) Base sample; (B) Oxygen distribution; (C) Aluminium distribution; (D) Titanium distribution.
Processes 11 01260 g0a2

Appendix B.2. 3D-Printed Structures

Similar trends were observed in section C.1 for the porous tubular samples, as seen in Figure A3, where the elemental distribution of oxygen, titanium, and aluminium on a PEO-treated alumina-coated 3D-printed sample is shown.
Figure A3. Characterization of the PEO-treated alumina-coated 3D-printed sample for (A) Base sample; (B) Oxygen distribution; (C) Aluminium distribution; (D) Titanium distribution.
Processes 11 01260 g0a3
As explained in Section 3.3, applying the alumina wash-coating method on the fresh titanium 3D-printed scaffold resulted in a non-homogenous wall coating; the walls of some channels were coated, and the channels were blocked, as seen in Figure A4.
Figure A4. Visual representation of the coating of a fresh 3D-printed scaffold without PEO treatment. Left: mm-scale, Right: µm-scale].
Processes 11 01260 g0a4

Appendix B.3. Wire Samples

In addition to the provided SEM images and EDX analysis of the obtained morphology, the SEM images of the cross sections of a typical PEO-treated wire sample are provided here, along with the EDX analysis of the surface and depth of a titanium wire sample (Figure A5a,b). Moreover, the effective thickness of the PEO-treated layer samples can be estimated to be 2–3 µm on average along the wire, as shown in Figure A5b.
Figure A5. (a) Top Left: SEM images and Bottom Table: EDX analysis in atomic percentages of elements of the surface and cross-section of titanium wire; (b) Top Right: SEM images of the PEO treated wire, in which the thickness of the treated layer can be recognized; [PEO treating using Electrolyte 1, 200 V, 50 Hz].
Processes 11 01260 g0a5
The PEO-treated titanium wire sample was also cut and polished, and embedded in resin with an angle of 45°. The prepared cross-section in this way enabled getting a better visualization of the thin porous layer structure, which is shown in Figure A6.
Figure A6. SEM images of different areas of the titanium wire’s cross-section with different magnifications and views [PEO treated using Electrolyte 1, 200 V, 50 Hz].
Processes 11 01260 g0a6
In this figure, the SEM image of the delaminated coating visualizes the thickness of the porous PEO-treated oxide layer, which was also identified by EDX analysis and its atomic composition. It should be highlighted that the PEO-treated layer thickness around the circumference of the wire was observed to be different from place to place.

Appendix C. Additional Results for Characterization of Treated/Coated Samples

Experimental observations can be presented in the form of recorded current-time curves. Through such visualizations, the involved phenomena and the impacts of the operating conditions on the specifications of the PEO-treated samples under different sets of conditions for different materials in different shapes can be analyzed. Typical observations during PEO-treating the wire samples are shown in Figure A7a–d.
Figure A7. Analyzing the effects of (a) applied voltage while treating titanium wire [Electrolyte 3, 50 Hz]; (b) electrolyte concentration while treating titanium wire [220 V, 200 Hz]; (c) frequency while treating titanium wire [Electrolyte 3, 260 V]; (d) applied voltage while treating zirconium wire [Electrolyte 2, 50 Hz]; on the observed current-time behavior of wire samples during PEO treatment using aluminate electrolytes.
Processes 11 01260 g0a7aProcesses 11 01260 g0a7b
The impacts of different parameters, such as electrolyte type and concentration, the surface area of the sample, efficiency of the connection between the sample and anode-electrolyte, etc., on the morphology and intensity of PEO treatment were qualitatively explained in this paper. There are technical challenges/limitations for quantitatively analyzing these, and the contribution of each fraction of the total charge passed in oxidizing the surface metal, oxidizing the electrolyte components, and the portion getting lost. For instance, the calculated value of Faradic efficiency, which is an indicator of selective utilization of the total charge passed in the targeted electrochemical reaction [87], might be theoretically used for accounting for the charge resulting in the formation of titanium or zirconium oxide over the surface of the PEO-treated samples in this research. However, this could not be practically carried out in this research due to the following reasons:
(a) The real value of the effective current and, thereby, the total charge passed, and its lost portion could not be representatively monitored all the time and used for the calculation. (b) The experimental setup was not equipped with real-time gas collection and measurement systems to track down the contribution of the involved phenomena.

References

  1. Walsh, F.C.; Low, C.T.J.; Wood, R.J.K.; Stevens, K.T.; Archer, J.; Poeton, A.R.; Ryder, A. Plasma electrolytic oxidation (PEO) for production of anodised coatings on lightweight metal (Al, mg, Ti) alloys. Trans. Inst. Met. Finish. 2009, 87, 122–135. [Google Scholar] [CrossRef]
  2. Clyne, T.W.; Troughton, S.C. A review of recent work on discharge characteristics during plasma electrolytic oxidation of various metals. Int. Mater. Rev. 2018, 64, 127–162. [Google Scholar] [CrossRef]
  3. Rudnev, V.S.; Lukiyanchuk, I.V.; Kuryavyi, V.G. Electrolytic-plasma oxidation in borate electrolytes. Prot. Met. 2006, 42, 55–59. [Google Scholar] [CrossRef]
  4. Guan, Y.J.; Xia, Y. Correlation between discharging property and coatings microstructure during plasma electrolytic oxidation. Trans. Nonferrous Met. Soc. China 2006, 16, 1097–1102. [Google Scholar] [CrossRef]
  5. Khan, R.; Yerokhin, A.; Pilkington, T.; Leyland, A.; Matthews, A. Residual stresses in plasma electrolytic oxidation coatings on Al alloy produced by pulsed unipolar current. Surf. Coat. Technol. 2005, 200, 1580–1586. [Google Scholar] [CrossRef]
  6. Dehnavi, V.; Luan, B.L.; Shoesmith, D.W.; Liu, X.Y.; Rohani, S. Effect of duty cycle and applied current frequency on plasma electrolytic oxidation (PEO) coating growth behavior. Surf. Coat. Technol. 2013, 226, 100–107. [Google Scholar] [CrossRef]
  7. Sieber, M.; Simchen, F.; Morgenstern, R.; Scharf, I.; Lampke, T. Plasma Electrolytic Oxidation of High-Strength Aluminium Alloys—Substrate Effect on Wear and Corrosion Performance. Metals 2018, 8, 356. [Google Scholar] [CrossRef]
  8. Darband, G.B.; Aliofkhazraei, M.; Hamghalam, P.; Valizade, N. Plasma electrolytic oxidation of magnesium and its alloys: Mechanism, properties and applications. J. Magnes. Alloy. 2017, 5, 74–132. [Google Scholar] [CrossRef]
  9. Lu, X.; Blawert, C.; Huang, Y.; Ovri, H.; Zheludkevich, M.L.; Kainer, K.U. Plasma electrolytic oxidation coatings on Mg alloy with addition of SiO2 particles. Electrochim. Acta 2016, 187, 20–33. [Google Scholar] [CrossRef]
  10. Lu, X.; Sah, S.P.; Scharnagl, N.; Störmer, M.; Starykevich, M.; Mohedano, M.; Blawert, C.; Zheludkevich, M.L.; Kainer, K.U. Degradation behavior of PEO coating on AM50 magnesium alloy produced from electrolytes with clay particle addition. Surf. Coat. Technol. 2015, 269, 155–169. [Google Scholar] [CrossRef]
  11. Hussein, R.; Northwood, D.; Nie, X. The effect of processing parameters and substrate composition on the corrosion resistance of plasma electrolytic oxidation (PEO) coated magnesium alloys. Surf. Coat. Technol. 2013, 237, 357–368. [Google Scholar] [CrossRef]
  12. Hussein, R.; Northwood, D.; Nie, X. The influence of pulse timing and current mode on the microstructure and corrosion behaviour of a plasma electrolytic oxidation (PEO) coated AM60B magnesium alloy. J. Alloys Compd. 2012, 541, 41–48. [Google Scholar] [CrossRef]
  13. Petković, M.; Stojadinović, S.; Vasilić, R.; Zeković, L. Characterization of oxide coatings formed on tantalum by plasma electrolytic oxidation in 12-tungstosilicic acid. Appl. Surf. Sci. 2011, 257, 10590–10594. [Google Scholar] [CrossRef]
  14. Sowa, M.; Simka, W. Electrochemical Impedance and Polarization Corrosion Studies of Tantalum Surface Modified by DC Plasma Electrolytic Oxidation. Materials 2018, 11, 545. [Google Scholar] [CrossRef]
  15. Cheng, Y.; Cao, J.; Peng, Z.; Wang, Q.; Matykina, E.; Skeldon, P.; Thompson, G. Wear-resistant coatings formed on Zircaloy-2 by plasma electrolytic oxidation in sodium aluminate electrolytes. Electrochim. Acta 2014, 116, 453–466. [Google Scholar] [CrossRef]
  16. Wang, L.; Hu, X.; Nie, X. Deposition and properties of zirconia coatings on a zirconium alloy produced by pulsed DC plasma electrolytic oxidation. Surf. Coat. Technol. 2013, 221, 150–157. [Google Scholar] [CrossRef]
  17. Sandhyarani, M.; Rao, T.P.; Rameshbabu, N. Role of electrolyte composition on structural, morphological and in-vitro biological properties of plasma electrolytic oxidation films formed on zirconium. Appl. Surf. Sci. 2014, 317, 198–209. [Google Scholar]
  18. Xue, W.; Zhu, Q.; Jin, Q.; Hua, M. Characterization of ceramic coatings fabricated on zirconium alloy by plasma electrolytic oxidation in silicate electrolyte. Mater. Chem. Phys. 2010, 120, 656–660. [Google Scholar] [CrossRef]
  19. Aktug, S.L.; Durdu, S.; Aktas, S.; Yalcin, E.; Usta, M. Characterization and investigation of in vitro properties of antibacterial copper deposited on bioactive ZrO2 coatings on zirconium. Thin Solid Films 2019, 681, 69–77. [Google Scholar] [CrossRef]
  20. Aliasghari, S.; Skeldon, P.; Thompson, G. Plasma electrolytic oxidation of titanium in a phosphate/silicate electrolyte and tribological performance of the coatings. Appl. Surf. Sci. 2014, 316, 463–476. [Google Scholar] [CrossRef]
  21. Habazaki, H.; Tsunekawa, S.; Tsuji, E.; Nakayama, T. Formation and characterization of wear-resistant PEO coatings formed on β-titanium alloy at different electrolyte temperatures. Appl. Surf. Sci. 2012, 259, 711–718. [Google Scholar] [CrossRef]
  22. Zehra, T.; Kaseem, M.; Hossain, S.; Ko, Y.-G. Fabrication of a Protective Hybrid Coating Composed of TiO2, MoO2, and SiO2 by Plasma Electrolytic Oxidation of Titanium. Metals 2021, 11, 1182. [Google Scholar] [CrossRef]
  23. Hao, J.; Jie, W.; Chen, H.; Ye, Y. The effect of SiO32− on micro-arc oxidization ceramic layer of TiAl alloy. Xiyou Jinshu Cailiao Yu Gongcheng/Rare Met. Mater. Eng. 2005, 34, 1455–1459. [Google Scholar]
  24. Zhou, H.; Liu, Z.; Li, Z.; Du, J. Microarc oxidation coating and high-temperature oxidation resistant property on Ti alloy. Xiyou Jinshu Cailiao Yu Gongcheng/Rare Met. Mater. Eng. 2005, 34, 1835–1838. [Google Scholar]
  25. Yao, Z.; Jiang, Z.; Wang, F.; Hao, G. Oxidation behavior of ceramic coatings on Ti-6Al-4V by micro-plasma oxidation. J. Mater. Process. Technol. 2007, 190, 117–122. [Google Scholar] [CrossRef]
  26. Zhang, X.; Yao, Z.; Jiang, Z.; Zhang, Y.; Liu, X. Investigation of the plasma electrolytic oxidation of Ti6Al4V under single-pulse power supply. Corros. Sci. 2011, 53, 2253–2262. [Google Scholar] [CrossRef]
  27. Quintero, D.; Galvis, O.; Calderón, J.; Castaño, J.; Echeverría, F. Effect of electrochemical parameters on the formation of anodic films on commercially pure titanium by plasma electrolytic oxidation. Surf. Coat. Technol. 2014, 258, 1223–1231. [Google Scholar] [CrossRef]
  28. Fazel, M.; Salimijazi, H.R.; Shamanian, M.; Apachitei, I.; Zadpoor, A.A. Influence of hydrothermal treatment on the surface characteristics and electrochemical behavior of Ti6Al4V bio-functionalized through plasma electrolytic oxidation. Surf. Coat. Technol. 2019, 374, 222–231. [Google Scholar] [CrossRef]
  29. Friedemann, A.E.R.; Gesing, T.M.; Plagemann, P. Electrochemical rutile and anatase formation on PEO surfaces. Surf. Coat. Technol. 2017, 315, 139–149. [Google Scholar] [CrossRef]
  30. Karbowniczek, J.; Muhaffel, F.; Cempura, G.; Cimenoglu, H.; Czyrska-Filemonowicz, A. Influence of electrolyte composition on microstructure, adhesion and bioactivity of micro-arc oxidation coatings produced on biomedical Ti6Al7Nb alloy. Surf. Coat. Technol. 2017, 321, 97–107. [Google Scholar] [CrossRef]
  31. Han, Y.; Hong, S.-H.; Xu, K. Porous nanocrystalline titania films by plasma electrolytic oxidation. Surf. Coat. Technol. 2002, 154, 314–318. [Google Scholar] [CrossRef]
  32. Stojadinović, S.; Vasilić, R.; Petković, M.; Kasalica, B.; Belča, I.; Žekić, A.; Zeković, L. Characterization of the plasma electrolytic oxidation of titanium in sodium metasilicate. Appl. Surf. Sci. 2013, 265, 226–233. [Google Scholar] [CrossRef]
  33. Tong, H.; Jin, F.; Shen, L. Fabrication of porous ceramic coatings embedded nanograins on titanium alloys. J. Korean Phys. Soc. 2005, 46, 134. [Google Scholar]
  34. Bakhtiari-Zamani, H.; Saebnoori, E.; Hassannejad, H.; Hassanzadeh-Tabrizi, A. Comparing Morphology and Corrosion Behavior of Nanostructured Coatings Obtained via Plasma Electrolytic Oxidation with Direct and Pulse Currents on Commercial Titanium Substrate. Surf. Eng. Appl. Electrochem. 2019, 55, 667–678. [Google Scholar] [CrossRef]
  35. Shin, K.R.; Ko, Y.G.; Shin, D.H. Effect of electrolyte on surface properties of pure titanium coated by plasma electrolytic oxidation. J. Alloys Compd. 2011, 509, S478–S481. [Google Scholar] [CrossRef]
  36. Shokouhfar, M.; Dehghanian, C.; Montazeri, M.; Baradaran, A. Preparation of ceramic coating on Ti substrate by plasma electrolytic oxidation in different electrolytes and evaluation of its corrosion resistance: Part II. Appl. Surf. Sci. 2012, 258, 2416–2423. [Google Scholar] [CrossRef]
  37. Zhang, P.; Zhang, Z.; Li, W. Antibacterial TiO2 coating incorporating silver nanoparticles by microarc oxidation and ion implantation. J. Nanomater. 2013, 2013, 2. [Google Scholar]
  38. Blackwood, D.J.; Chooi, S. Stability of protective oxide films formed on a porous titanium. Corros. Sci. 2002, 44, 395–405. [Google Scholar] [CrossRef]
  39. Wu, H.; Lu, X.; Long, B.; Wang, X.; Wang, J.; Jin, Z. The effects of cathodic and anodic voltages on the characteristics of porous nanocrystalline titania coatings fabricated by microarc oxidation. Mater. Lett. 2005, 59, 370–375. [Google Scholar] [CrossRef]
  40. Wang, L.; Shi, L.; Chen, J.; Shi, Z.; Ren, L.; Wang, Y. Biocompatibility of Si-incorporated TiO2 film prepared by micro-arc oxidation. Mater. Lett. 2014, 116, 35–38. [Google Scholar] [CrossRef]
  41. Di, S.; Guo, Y.; Lv, H.; Yu, J.; Li, Z. Microstructure and properties of rare earth CeO2-doped TiO2 nanostructured composite coatings through micro-arc oxidation. Ceram. Int. 2015, 41, 6178–6186. [Google Scholar] [CrossRef]
  42. Li, H.; Zhang, J. Preparation of a Modified Micro-arc Oxidation Coating Using Al2O3 Particles on Ti6Al4V. J. Mater. Sci. Eng. 2017, 6, 1–6. [Google Scholar] [CrossRef]
  43. Lukiyanchuk, I.V.; Rudnev, V.S.; Tyrina, L.M. Plasma electrolytic oxide layers as promising systems for catalysis. Surf. Coat. Technol. 2016, 307, 1183–1193. [Google Scholar] [CrossRef]
  44. Patcas, F.; Krysmann, W. Efficient catalysts with controlled porous structure obtained by anodic oxidation under spark-discharge. Appl. Catal. A Gen. 2007, 316, 240–249. [Google Scholar] [CrossRef]
  45. Yu, X.; Chen, L.; Qin, H.; Wu, M.; Yan, Z. Formation process of in situ oxide coatings with high porosity using one-step plasma electrolytic oxidation. Appl. Surf. Sci. 2016, 366, 432–438. [Google Scholar] [CrossRef]
  46. Mirelman, L.K.; Curran, J.A.; Clyne, T.W. The production of anatase-rich photoactive coatings by plasma electrolytic oxidation. Surf. Coat. Technol. 2012, 207, 66–71. [Google Scholar] [CrossRef]
  47. Rahimalimamaghani, A.; Godini, H.R.; Mboussi, M.; Tanaka, A.P.; Tenco, M.L.; Gallucci, F. Tailored Carbon Molecular Sieve Membranes for Selective CO2–Separation at Elevated Temperatures and Pressures. J. CO2 Util. 2023, 68, 102378. [Google Scholar] [CrossRef]
  48. Godini, H.R.; Gili, A.; Görke, O.; Simon, U.; Hou, K.; Wozny, G. Performance Analysis of a Porous Packed Bed Membrane Reactor for Oxidative Coupling of Methane: Structural and Operational Characteristics. Energy Fuels 2014, 28, 877–890. [Google Scholar] [CrossRef]
  49. Sadjadi, S.; Simon, U.; Godini, H.; Görke, O.; Schomäcker, R.; Wozny, G. Reactor material and gas dilution effects on the performance of miniplant-scale fluidized-bed reactors for oxidative coupling of methane. Chem. Eng. J. 2015, 281, 678–687. [Google Scholar] [CrossRef]
  50. Gallucci, F.; Medrano, J.A.; Roses, L.; Brunetti, A.; Barbieri, G.; Viviente, J.L. Process Intensification via Membrane Reactors, the DEMCAMER Project. Processes 2016, 4, 16. [Google Scholar] [CrossRef]
  51. Vamvakeros, A.; Jacques, S.D.M.; Middelkoop, V.; Di Michiel, M.; Egan, C.K.; Ismagilov, I.Z.; Vaughan, G.B.M.; Gallucci, F.; van Sint Annaland, M.; Shearing, P.R.; et al. Real time chemical imaging of a working catalytic membrane reactor during oxidative coupling of methane. Chem. Commun. 2015, 51, 12752–12755. [Google Scholar] [CrossRef]
  52. Czuprat, O.; Schiestel, T.; Voss, H.; Caro, J. Oxidative Coupling of Methane in a BCFZ Perovskite Hollow Fiber Membrane Reactor. Ind. Eng. Chem. Res. 2010, 49, 10230–10236. [Google Scholar] [CrossRef]
  53. Song, J.; Hei, Y.; Li, C.; Yang, N.; Meng, B.; Tan, X.; Sunarso, J.; Liu, S. Dehydrogenation Coupling of Methane Using Catalyst-Loaded Proton-Conducting Perovskite Hollow Fiber Membranes. Membranes 2022, 12, 191. [Google Scholar] [CrossRef]
  54. Godini, H.R.; Kim, M.; Görke, O.; Khadivi, M.; Schomäcker, R.; Repke, J.-U. Membrane Engineering for the Treatment of Gases Volume 2: Gas-separation Issues Combined with Membrane Reactors. In Oxidative Coupling of Methane in Membrane Reactors; RSC (The Royal Society of Chemistry) Press: London, UK, 2018; ISBN 978-1-78801-219-5. [Google Scholar]
  55. Julbe, A.; Farrusseng, D.; Guizard, C. Limitations and potentials of oxygen transport dense and porous ceramic membranes for oxidation reactions. Catal. Today 2005, 104, 102–113. [Google Scholar] [CrossRef]
  56. Aseem, A.; Harold, M.P. C2 yield enhancement during oxidative coupling of methane in a nonpermselective porous membrane reactor. Chem. Eng. Sci. 2018, 175, 199–207. [Google Scholar] [CrossRef]
  57. Ramachandra, A.M.; Lu, Y.; Ma, Y.H.; Moser, W.R.; Dixon, A.G. Oxidative coupling of methane in porous Vycor membrane reactors. J. Memb. Sci. 1996, 116, 253–264. [Google Scholar] [CrossRef]
  58. Nozaki, T.; Hashimoto, S.; Omata, K.; Fujimoto, K. Oxidative coupling of methane with membrane reactors containing lead oxide. Ind. Eng. Chem. Res. 1993, 32, 1174–1179. [Google Scholar] [CrossRef]
  59. Salehi, M.-S.; Askarishahi, M.; Gallucci, F.; Godini, H.R. Selective CO2-Hydrogenation using a membrane reactor. Chem. Eng. Process. Process. Intensif. 2020, 160, 108264. [Google Scholar] [CrossRef]
  60. Julbe, A.; Farrusseng, D.; Guizard, C. Porous ceramic membranes for catalytic reactors—Overview and new ideas. J. Membr. Sci. 2001, 181, 3–20. [Google Scholar] [CrossRef]
  61. Hsieh, H.P. Inorganic membrane reactors—A review. AIChE Symp. Ser. 1989, 85, 53–67. [Google Scholar]
  62. Curran, J.; Clyne, T. Porosity in plasma electrolytic oxide coatings. Acta Mater. 2006, 54, 1985–1993. [Google Scholar] [CrossRef]
  63. Jayaraj, R.K.; Malarvizhi, S.; Balasubramanian, V. Optimizing the micro-arc oxidation (MAO) parameters to attain coatings with minimum porosity and maximum hardness on the friction stir welded AA6061 aluminium alloy welds. Def. Technol. 2017, 13, 111–117. [Google Scholar] [CrossRef]
  64. Karaji, Z.G.; Hedayati, R.; Pouran, B.; Apachitei, I.; Zadpoor, A.A. Effects of plasma electrolytic oxidation process on the mechanical properties of additively manufactured porous biomaterials. Mater. Sci. Eng. C 2017, 76, 406–416. [Google Scholar] [CrossRef] [PubMed]
  65. Zhou, R.; Wei, D.; Cheng, S.; Zhou, Y.; Jia, D.; Wang, Y.; Li, B. The effect of titanium bead diameter of porous titanium on the formation of micro-arc oxidized TiO2-based coatings containing Si and Ca. Ceram. Int. 2013, 39, 5725–5732. [Google Scholar] [CrossRef]
  66. Apachitei, I.; Leoni, A.; Riemslag, A.; Fratila-Apachitei, L.; Duszczyk, J. Enhanced fatigue performance of porous coated Ti6Al4V biomedical alloy. Appl. Surf. Sci. 2011, 257, 6941–6944. [Google Scholar] [CrossRef]
  67. Thukkaram, M.; Cools, P.; Nikiforov, A.; Rigole, P.; Coenye, T.; Van Der Voort, P.; Du Laing, G.; Vercruysse, C.; Declercq, H.; Morent, R.; et al. Antibacterial activity of a porous silver doped TiO2 coating on titanium substrates synthesized by plasma electrolytic oxidation. Appl. Surf. Sci. 2019, 500, 144235. [Google Scholar] [CrossRef]
  68. Gu, W.-C.; Lv, G.-H.; Chen, H.; Chen, G.-L.; Feng, W.-R.; Yang, S.-Z. PEO protective coatings on inner surface of tubes. Surf. Coat. Technol. 2007, 201, 6619–6622. [Google Scholar] [CrossRef]
  69. Gu, W.-C.; Lv, G.-H.; Chen, H.; Chen, G.-L.; Feng, W.; Zhang, G.-L.; Yang, S.-Z. Preparation of ceramic coatings on inner surface of steel tubes using a combined technique of hot-dipping and plasma electrolytic oxidation. J. Alloys Compd. 2007, 430, 308–312. [Google Scholar] [CrossRef]
  70. Tang, H.; Sun, Q.; Yi, C.G.; Jiang, Z.H.; Wang, F.P. High emissivity coatings on titanium alloy prepared by micro-arc oxidation for high temperature application. J. Mater. Sci. 2012, 47, 2162–2168. [Google Scholar] [CrossRef]
  71. Sun, J.; Wu, J.S.; Zhao, B.; Wang, F. Microstructure, wear and high temperature oxidation resistance of nitrided TiA1 based alloys. Mater. Sci. Eng. A 2002, 329, 713–717. [Google Scholar] [CrossRef]
  72. Xu, Y.; Yao, Z.; Jia, F.; Wang, Y.; Jiang, Z.; Bu, H. Preparation of PEO ceramic coating on Ti alloy and its high temperature oxidation resistance. Curr. Appl. Phys. 2010, 10, 698–702. [Google Scholar] [CrossRef]
  73. Rombouts, M.; Mullens, S.; Luyten, J.; Nuyts, P. The Production of Ti-6Al-4V Parts with Controlled Porous Architecture by Three-Dimensional Fiber Deposition in Innovative Developments in Design and Manufacturing (Book Chapter); Taylor Francis: Abingdon, UK, 2009. [Google Scholar]
  74. Jiang, B.L.; Wang, Y.M. Plasma electrolytic oxidation treatment of aluminium and titanium alloys. In Surface Engineering of Light Alloys; Elsevier: Amsterdam, The Netherlands, 2010; pp. 110–154. [Google Scholar] [CrossRef]
  75. Hanaor, D.A.H.; Sorrell, C.C. Review of the anatase to rutile phase transformation. J. Mater. Sci. 2010, 46, 855–874. [Google Scholar] [CrossRef]
  76. Jin, F.; Chu, P.K.; Wang, K.; Zhao, J.; Huang, A.; Tong, H. Thermal stability of titania films prepared on titanium by micro-arc oxidation. Mater. Sci. Eng. A 2008, 476, 78–82. [Google Scholar] [CrossRef]
  77. Sikdar, S.; Menezes, P.V.; Maccione, R.; Jacob, T.; Menezes, P.L. Plasma Electrolytic Oxidation (PEO) Process—Processing, Properties, and Applications. Nanomaterials 2021, 11, 1375. [Google Scholar] [CrossRef]
  78. Wang, L.; Fu, W.; Yi, G.; Chen, Z.; Gao, Z.; Pan, Q. Discharge Characteristics, Plasma Electrolytic Oxidation Mechanism and Properties of ZrO2 Membranes in K2ZrF6 Electrolyte. Membranes 2022, 12, 516. [Google Scholar] [CrossRef]
  79. Available online: https://www.aspire2050.eu/memere (accessed on 15 April 2023).
  80. Samadi, P.; Binczarski, M.J.; Pawlaczyk, A.; Rogowski, J.; Szynkowska-Jozwik, M.I.; Witonska, I.A. CO Oxidation over Pd Catalyst Supported on Porous TiO2 Prepared by Plasma Electrolytic Oxidation (PEO) of a Ti Metallic Carrier. Materials 2022, 15, 4301. [Google Scholar] [CrossRef]
  81. Montebelli, A.; Visconti, C.G.; Groppi, G.; Tronconi, E.; Cristiani, C.; Ferreira, C.; Kohler, S. Methods for the catalytic activation of metallic structured substrates. Catal. Sci. Technol. 2014, 4, 2846–2870. [Google Scholar] [CrossRef]
  82. Montebelli, A.; Visconti, C.G.; Groppi, G.; Tronconi, E.; Kohler, S. Optimization of compact multitubular fixed-bed reactors for the methanol synthesis loaded with highly conductive structured catalysts. Chem. Eng. J. 2014, 255, 257–265. [Google Scholar] [CrossRef]
  83. Visconti, C.G.; Montebelli, A.; Groppi, G.; Tronconi, E.; Kohler, S. Highly Conductive Structured Catalysts for the Intensification of Methanol Synthesis in Multitubular Reactors. In Methanol: Science and Engineering; Elsevier: Amsterdam, The Netherlands, 2018; pp. 519–538. [Google Scholar] [CrossRef]
  84. Specchia, S.; Ercolino, G.; Karimi, S.; Italiano, C.; Vita, A.S. Solution combustion synthesis for preparation of structured catalysts: A mini-review on process intensification for energy applications and pollution control. Int. J. Self-Propagating High-Temp. Synth. 2017, 26, 166–186. [Google Scholar] [CrossRef]
  85. Pauletto, G.; Vaccari, A.; Groppi, G.; Bricaud, L.; Benito, P.; Boffito, D.C.; Lercher, J.A.; Patience, G.S. FeCrAl as a Catalyst Support. Chem. Rev. 2020, 120, 7516–7550. [Google Scholar] [CrossRef]
  86. Jiang, X.; Zhang, L.; Wybornov, S.; Staedler, T.; Hein, D.; Wiedenmann, F.; Krumm, W.; Rudnev, V.; Lukiyanchuk, I. Highly Efficient Nanoarchitectured Ni5TiO7 Catalyst for Biomass Gasification. ACS Appl. Mater. Interfaces 2012, 4, 4062–4066. [Google Scholar] [CrossRef] [PubMed]
  87. Kempler, P.A.; Nielander, A.C. Reliable reporting of Faradaic efficiencies for electrocatalysis research. Nat. Commun. 2023, 14, 1158. [Google Scholar] [CrossRef] [PubMed]
Figure 1. Different samples used in experimentation (A) Complete porous titanium tube (10 cm); (B) Cut tube sample (2 cm); (C) Untreated 3D-printed structure; (D) Treated 3D-printed structure; (E) Titanium wire sample connection; (F) Titanium wire bundle sample.
Processes 11 01260 g001
Figure 2. Left (a): Experimental setup used for the PEO treatment, where the main items are (A) cooler, (B) magnetic stirrer, (C) stainless steel counter electrode, (D) electrolytic bath, (E) workpiece being coated (Titanium and Zirconium); Right (b): Schematic of the PEO process setup.
Processes 11 01260 g002
Figure 3. Typical current time pattern for partially immersed 3D-printed scaffold samples.
Processes 11 01260 g003
Figure 4. SEM-EDX for a cut 3D-printed titanium scaffold sample (200 V, 50 Hz, Na2SiO3, E1) for two different regions (A,B) on the same sample.
Processes 11 01260 g004
Figure 5. SEM images of a 3D-printed scaffold (A) lateral surface (20×); (B) top view of the struts (185×); (C) top view (280×); (D) structure of a single strut (1200×); (E) particle structure (6700×).
Processes 11 01260 g005
Figure 6. SEM-EDX of 1 cm long porous titanium tubes (200 V, 50 Hz, NaAlO2, E1) for two regions (A) (30 µm magnification) and (B) (10 µm magnification) of the same sample (C) untreated sample (10 µm magnification).
Processes 11 01260 g006
Figure 7. SEM-EDX analysis of titanium wire TW samples (50 Hz, NaAlO2, E2) at (A) 220 volts (10 µm magnification); (B) 240 volts (10 µm magnification); (C) 260 volts (10 µm magnification); (D) Untreated sample (5 µm magnification).
Processes 11 01260 g007
Figure 8. SEM images at different regions (AD) and magnifications of a titanium wire TW sample (260 V, 200 Hz, NaAlO2, E3).
Processes 11 01260 g008
Figure 9. SEM-EDX for zirconium wire samples (A,B) (220 V, 50 Hz, NaAlO2, E2) (10 µm magnification); (C) (5 µm magnification) and (D) (240 V, 50 Hz, NaAlO2, E2) (10 µm magnification); (E) Untreated sample.
Processes 11 01260 g009
Figure 10. SEM-EDX for zirconium wire bundle sample (200 V, 50 Hz, Na2SiO3, E1) showing two regions (A,B), Left: smooth, treated surface (10 µm magnification), Right: treated surface partially covered with deposited materials (20 µm magnification) Note 2: The reported amounts of Rubidium (Rb) and Yttrium (Y), are in fact Zr peaks as their spectra are very close and almost overlapping in EDX; no Rb or Y was present.
Processes 11 01260 g010
Figure 11. XRD spectrums for the 1 cm long porous titanium tubular samples, treated under different PEO conditions.
Processes 11 01260 g011
Figure 12. The recorded XRD spectra for 3D-printed titanium scaffold.
Processes 11 01260 g012
Figure 13. The recorded XRD spectra for the titanium wire bundle samples.
Processes 11 01260 g013
Figure 14. The observed XRD spectra for zirconium wire bundle samples.
Processes 11 01260 g014
Figure 15. Visual representation of the coating of the PEO-treated samples (A) porous titanium tube [Top: mm-scale, Bottom: µm-scale]; (B) titanium wire [Top: mm-scale, Bottom: µm-scale]; (C) 3D-printed scaffold [Top: visualized coating, Bottom: alumina identified coated layer].
Processes 11 01260 g015
Table 1. Specifications of the porous fresh titanium tube substrates.
MaterialLength (cm)Outer Diameter (mm)Wall Thickness (mm)Purity (%)Filter Rating (µm)
Commercial Titanium10132Min. 99.5% titanium0.45
Table 2. Specifications of the electrolytes.
Sodium Metasilicate (Na2SiO3)Sodium Aluminate (NaAlO2)
ClassificationCompositionClassificationComposition
Na2SiO3 (g/L)Na2SiO3 (M)KOH (g/L)NaAlO2 (g/L)NaAlO2 (M)KOH (g/L)
Electrolyte1 (E1S)6.10.052Electrolyte1 (E1A)8.20.12
Electrolyte2 (E2S)100.081Electrolyte2 (E2A)100.122
Electrolyte3 (E3S)12.20.10.5Electrolyte3 (E3A)12.30.152
Table 3. Variation of process parameters for different types of treated workpieces.
Sample TypeApplied Potential Range (V)Current (A)Power Frequency (Hz)
Wires and wire bundles220–2606.550 and 200
Porous titanium tubes200 and 2206.550 and 200
3D-printed structures200–2406.550 and 200
Disclaimer/Publisher’s Note: The statements, opinions and data contained in all publications are solely those of the individual author(s) and contributor(s) and not of MDPI and/or the editor(s). MDPI and/or the editor(s) disclaim responsibility for any injury to people or property resulting from any ideas, methods, instructions or products referred to in the content.

