Article

Experimental Study on Mechanical Properties of Concrete Containing Waste Glass and Its Application on Concrete-Filled Steel Tubular Columns

1
School of Architecture and Civil Engineering, Xihua University, Chengdu 610039,China
2
Chengdu Tianfu International Airport, Chengdu 641419, China
3
Faculty of Civil Engineering and Geosciences, Delft University of Technology, 2628 CN Delft, The Netherlands
*
Author to whom correspondence should be addressed.
Processes 2023, 11(4), 975; https://doi.org/10.3390/pr11040975
Submission received: 19 February 2023 / Revised: 16 March 2023 / Accepted: 21 March 2023 / Published: 23 March 2023

Abstract

:
Waste glass (WG), as a nonbiodegradable material, poses a threat to environmental protection. The reuse of WG as a raw material to replace cement or aggregate in concrete production is gaining attention for recycling purposes. However, the optimal proportion of WG in concrete mixtures and its particle size distribution are hard to determine. Large glass particles are prone to leading to the undesirable alkali–silica reaction (ASR) in concrete. Therefore, in this study, cement and aggregate in concrete mixtures are partially replaced by combinations of glass powder (<30 μm) and glass beads (0.2–1.7 mm), respectively. Glass concretes (GCs) containing waste glass at various replacement ratios (0, 10, 15, 20, and 30%) are prepared, and their flowability and compressive strength are evaluated and compared. Finally, steel tubes filled by ordinary concrete (OCFSTs) and steel tubes filled by glass concrete (GCFSTs) are fabricated and tested in axial compression. The test results show that the slump and slump flow increase when the replacement ratio is lower than 20%, and the maximum slump value (250 mm) is achieved for concrete with the use of 20% waste glass. With regard to compressive strength, as the glass replacement percentage is increased, the compressive strength of GC continues to reduce. The maximum decrease of compressive strength (merely 70% of compressive strength for original concrete) is observed in GC mixed with 20% glass, which might be attributed to the smooth surface of glass, consequently weakening the interfacial bond strength between the glass and matrix. In terms of the bearing capacity of GCFSTs, the axial compressive strength of GCFSTs decreases as more GC is used. However, no obvious reduction is observed compared to OCFSTs (less than 10% for GCFSTs containing 30% GP). Moreover, GCFSTs show greater (no less than 25% more) deformational ability at peak strength over OCFST columns, demonstrating that GC is a promising alternative for normal concrete. Finally, the feasibility of existing design codes (AISC, EC4, and GB50936-2014) to assess the bearing capacity of GCFSTs is evaluated by comparing the test and calculated results. The current codes, in general, give a conservative prediction and EC4 provides the closest value (predicted to experimental peak load ratio is 0.9).

1. Introduction

Due to increasing demand of glass in our daily lives, the amount of waste glass (WG) is rising and the disposal of WG becomes a major concern, as it is difficult to biodegrade and endangers the natural environment [1]. Therefore, rather than the application of WG as a landfill material, or melting the glass aiming for reproduction, which will respectively lead to space and energy consumption, reuse of WG has become popular in recent years [2]. For example, in China, about 20 million tons of waste glass is produced, and more than 50% of waste glass has been collected for recycling until 2017 [3]. Furthermore, rather than being limited to waste glass, other recycling materials, such as marble and coal bottom ash, have validated their effectiveness in overcoming environmental issues such as air and water pollution, as well as improving material properties and structural performance [4,5,6,7]. In terms of WG, there are various forms of recycling due to the advanced processing and manufacturing technology currently available. For example, glass fibers can be extracted from WG after processing, and then used to improve the mechanical performance of concrete, as reported by Małek et al. [8,9]. In addition, reuse of WG as a construction material, by replacing cement or aggregate, for concrete production is also very promising [10,11,12]. The use of WG as a component of concrete mixture reduces the utilization of sand and cement, thereby reducing CO2 emissions.
Dating back to last century, studies have already been conducted to investigate the performance of glass concrete (GC) when WG is used to replace cement as a gel material, or aggregate as granular material [13]. In terms of compressive strength, the optimal replacement ratio varies in different studies, generally ranging from 10% to 40% for glass–cement replacement [14,15,16,17,18,19], and around 20% for glass–aggregate replacement [20,21,22,23,24]. For example, Elaqra and Rustom [16] found that after 90 days, the compressive strength of GC, with both 10% and 20% cement replacement, was higher than that of ordinary concrete (OC). Du et al. [25] observed that GC with less than 30% cement replacement does not decrease its compressive strength. In addition, in the study conducted by Zeybek et al. [26], it was observed that the workability and compressive strength would be nearly unaffected if cement particles were replaced by less than 20% glass powder. A reasonable partial replacement of both cement and aggregate with WG can even improve the mechanical properties of GC. With regard to aggregate replacement with WG, as summarized by Qaidi [27], a general conclusion for the effect of glass particles substituting aggregate on the mechanical properties of concrete is still indecisive, but glass particles are a qualified alternative to aggregate if the replacement proportion is controlled. Bisht and Ramana [21] used WG as fine aggregate in concrete, and obtained the highest compressive strength when 21% glass replacement, with particle sizes ranging from 150 to 600 µm, is adopted. Çelik et al. [28] replaced fine and coarse aggregate with crushed waste glass and found that the addition of glass particles decreased the compressive and splitting tensile strength, while improve the flexural strength of GC.
Although waste glass shows great potential as a substitution for cement or aggregate in manufacturing concrete, alkali–silica reaction (ASR) expansion is prone to occur in GC due to the existence of active silica in the glass [29,30,31]. As a result, internal tensile stress is generated and possible cracking may occur, which is undesirable and restricts the application of WG in concrete [32]. However, it is found that the ASR rate in GC is closely linked with the particle size of WG [33]. Unlike coarse glass particles, which generally lead to a high degree of ASR, fine glass powder will densify the microstructure of the concrete and, therefore, inhibit the ASR. As observed by Gorospe et al. [34], replacing aggregate with fine glass particles has no significant effect, or even mitigates the ASR in hardened concrete due to pozzolanic characteristics. In contrast, Ling and Poon [35] added glass particles less than 5 mm in size and serious ASR damage occurred in the concrete. Therefore, not only should the replacement ratio of glass to cement/aggregate be considered, but also the size of the glass particles should be taken into consideration for the quality control of GC.
In spite of the possible adverse ASR in GC, one promising application of GC is to fill a steel tube, combined as a composite [36]. By combining the advantages of both concrete and steel, concrete-filled steel tubes (CFSTs) have already been widely used in concrete structures by virtue of their superior compressive strength, high fire and seismic resistance, better energy absorption ability, etc. [37,38]. The outer steel tube infilled with concrete is able to provide confinement for the concrete, improve the compressive strength, and overcome the brittleness of concrete. Therefore, it benefits the use of GC in CFSTs as the confining effect from the steel tube will restrain the expansion induced by both the ASR and the action of external load, such as axial force. However, until now, only a few studies have investigated the performance of CFSTs containing GC. Yu et al. [36] tested the ultimate bearing capacity of CFSTs with different aggregates, in which one type of concrete is developed by replacing the aggregate with WG. The test results showed that the CFSTs with waste glass had comparable or even better performances than CFST columns made of OC.
As mentioned previously, it is generally acknowledged that glass powder and fine glass, as substitutions for cement and aggregate in GC, will improve its mechanical properties, while coarse glass might damage concrete due to the effect of the ASR [39]. The mechanical performance of WG, by simply substituting only cement or aggregate, has been sufficiently investigated. However, there has not been extensive study in terms of the combination of WG with varied particle sizes as a replacement for both cement and aggregate, and research regarding the structural performance of CFSTs with GC is still limited. Therefore, in this study, in order to make full use of WG with various particle sizes, glass powder with a maximum size less than 23 μm, and fine glass with particle sizes between 0.2 and 1.7 mm were mixed to replace cement and natural sand, respectively, for GC production. Flowability and compressive strength of GC with different replacement ratios (maximal 30%) were evaluated. Thereafter, GCFSTs made with GC of various replacement ratios were tested for compression, and their performances were analyzed and compared. Finally, the applicability of existing theoretical methods for CFSTs was examined by comparing predicted values and test results.

2. Experimental Program

2.1. Material Component and Mix Proportion of GC

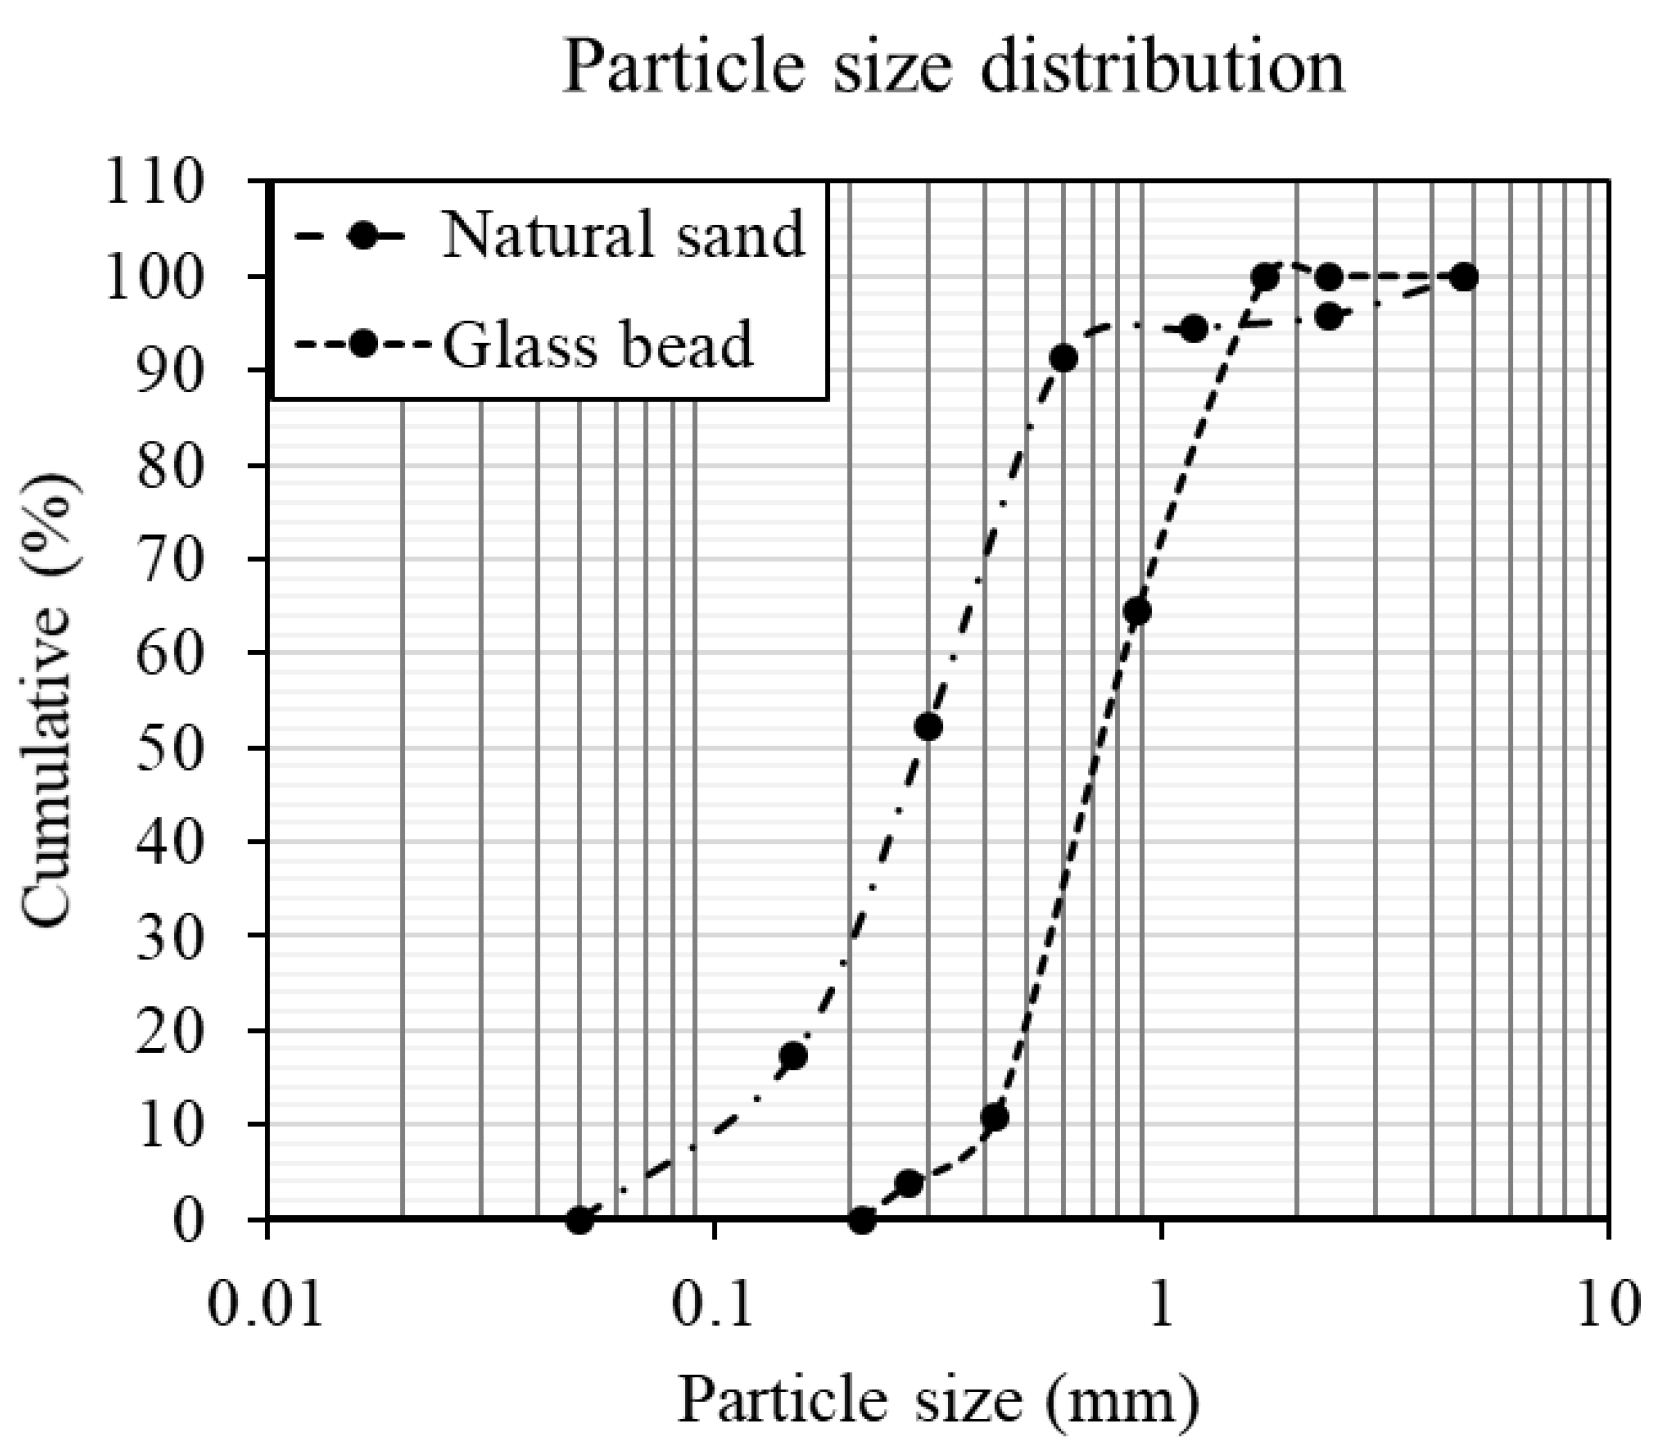
In this study, two kinds of glass particles (shown in Figure 1), namely, glass powder and glass beads, were used as partial substitutions for cement and natural sand, respectively, and both of them were made from local crushed glass sheets using different methods. The glass powder was obtained by grinding to a particle size less than 30 μm. In order to produce glass beads without the initial flaws of crushing, the waste glass was heated to a molten state, and then tiny glass beads, with a diameter ranging from 0.2 to 1.7 mm, were formed under surface tension forces. In addition, compound silicate cement PC 32.5R (from Lafarky Cement Plant), together with natural sand (mainly composed of fine sand with a particle size less than 0.3 mm) and coarse aggregate, having a maximum particle size less than 20 mm, were used for both OC and GC mixtures. Finally, superplasticizers mixed with water were added to achieve the workability of fresh concrete. The particle size distribution of glass beads and natural sand is presented in Figure 2.
In general, in order to keep material properties comparable to OC, the optimal glass replacement ratio in the concrete mixtures was within 30% [26]. Therefore, as presented in Table 1, concrete mixtures designed with various glass replacement ratios (ranging from 0% to 30%) were used in this study. OC without the addition of glass was developed to have a high slump value without segregation, and then was used as a reference mixture for comparison. For GC, glass powder and beads with a mass ratio of 0.61 were mixed to separately replace cement and natural sand. Although different glass replacement ratios were used in the mixture designs, the total mass of the cement and glass powder was kept constant at 450 kg/m3, and the overall weight of the natural sand and glass beads remained the same (i.e., 680 kg/m3) for different GC mixtures. Moreover, it should be noted that the volume of the superplasticizer was fixed in the different mixtures, in order to avoid its influence on the fresh and mechanical properties.

2.2. Flowability and Compressive Strength Test

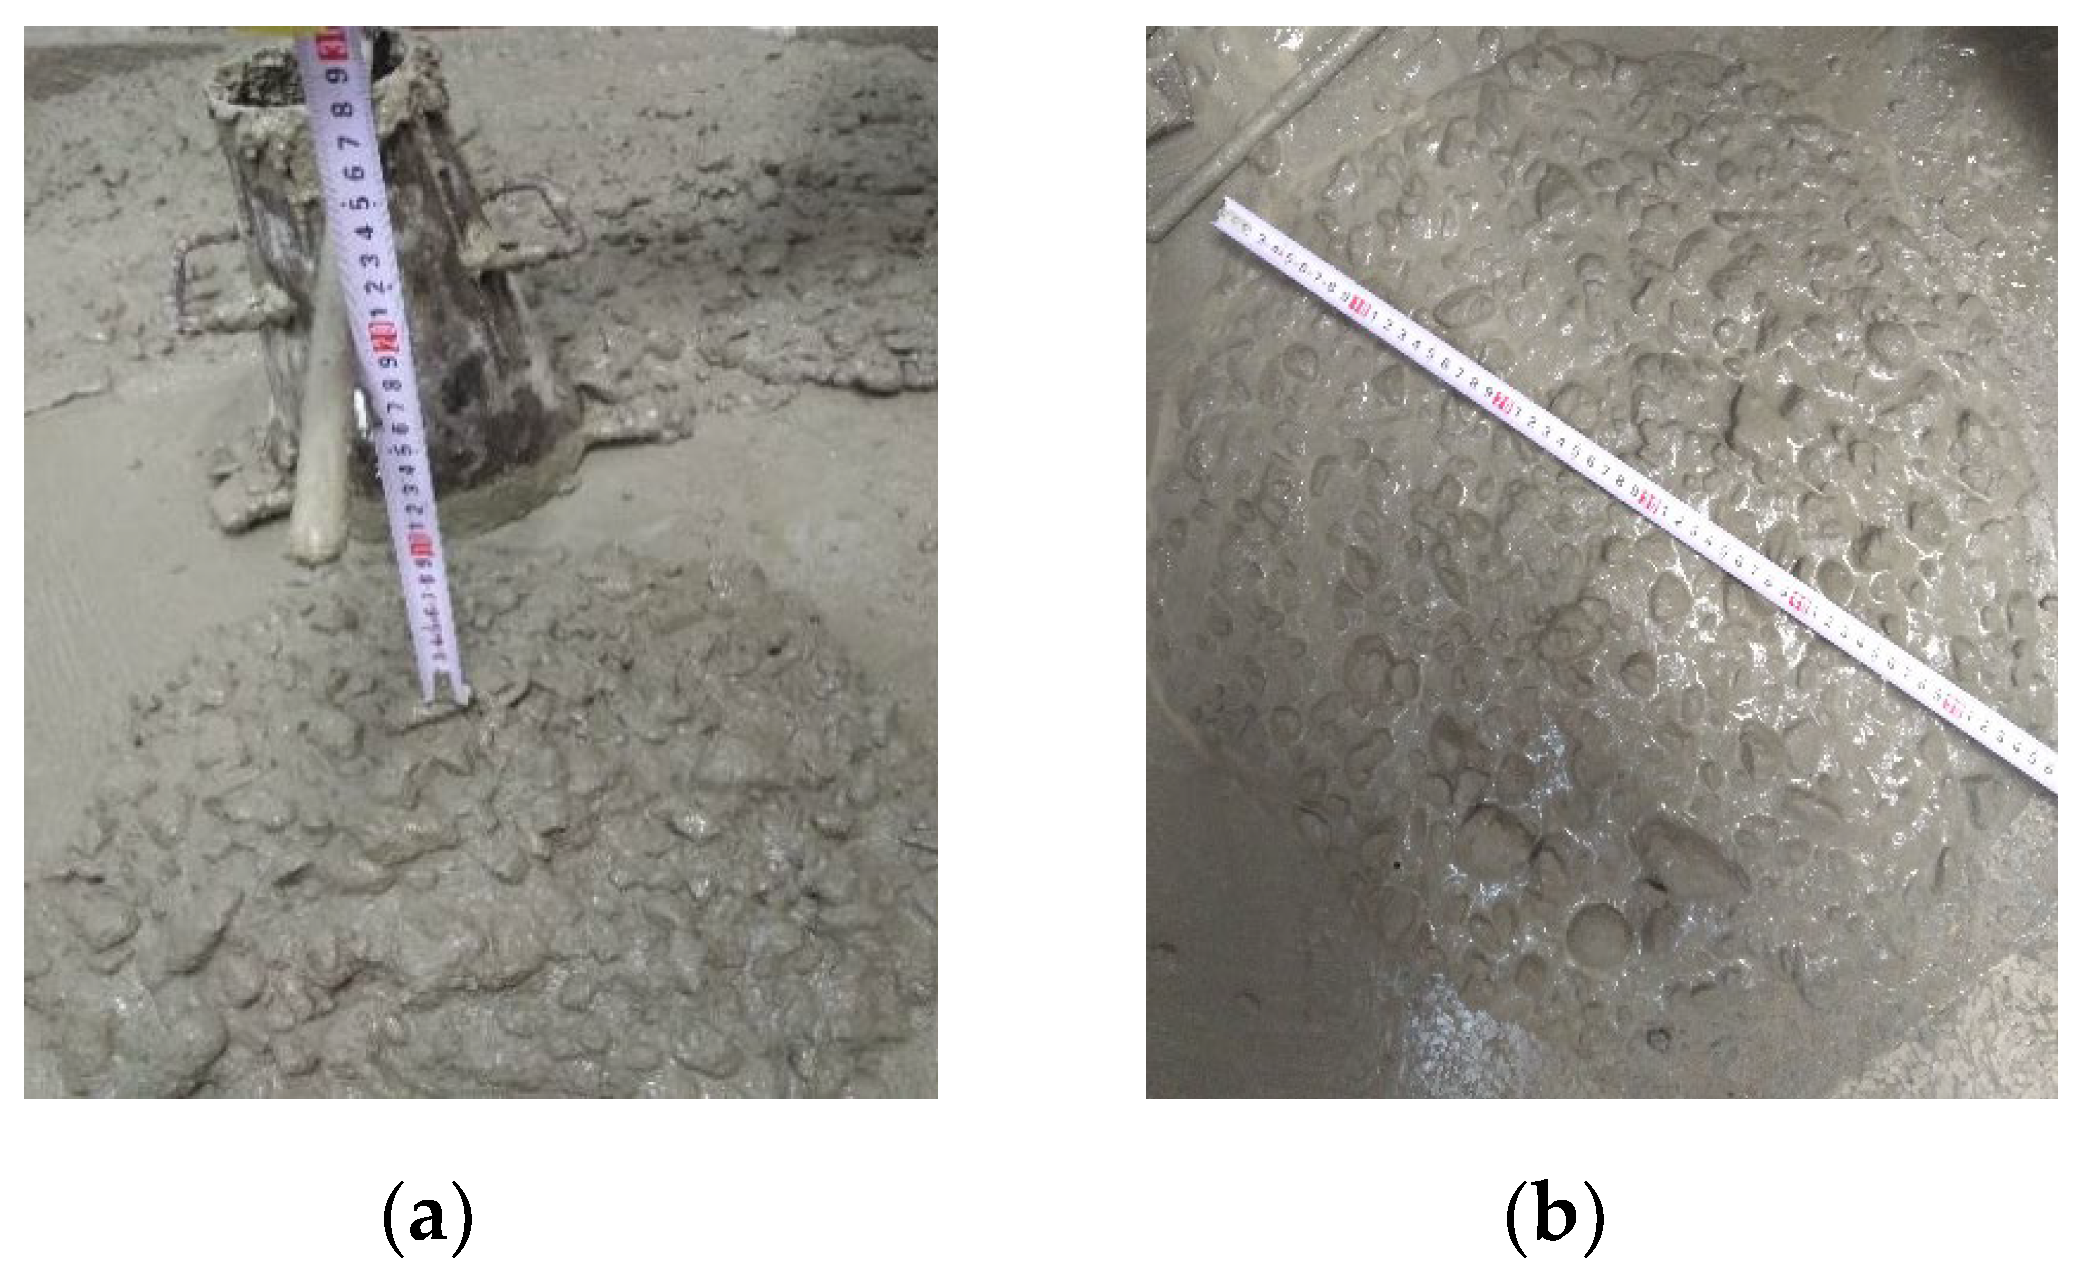
The flowability and compressive strength of each mixture were evaluated, since the concrete’s workability governs its successful application, and the axial performance of a CFST mainly depends on the compressive strength in terms of concrete. As shown in Figure 3, the slump and slump flow tests were performed in accordance with the procedures of the Chinese standard for performance test methods of ordinary concrete mixtures (GB/T 50080-2016) [40]. Defined as slump and slump flow, the height difference between the mold and concrete, and the average diameter of the concrete, respectively, were recorded.
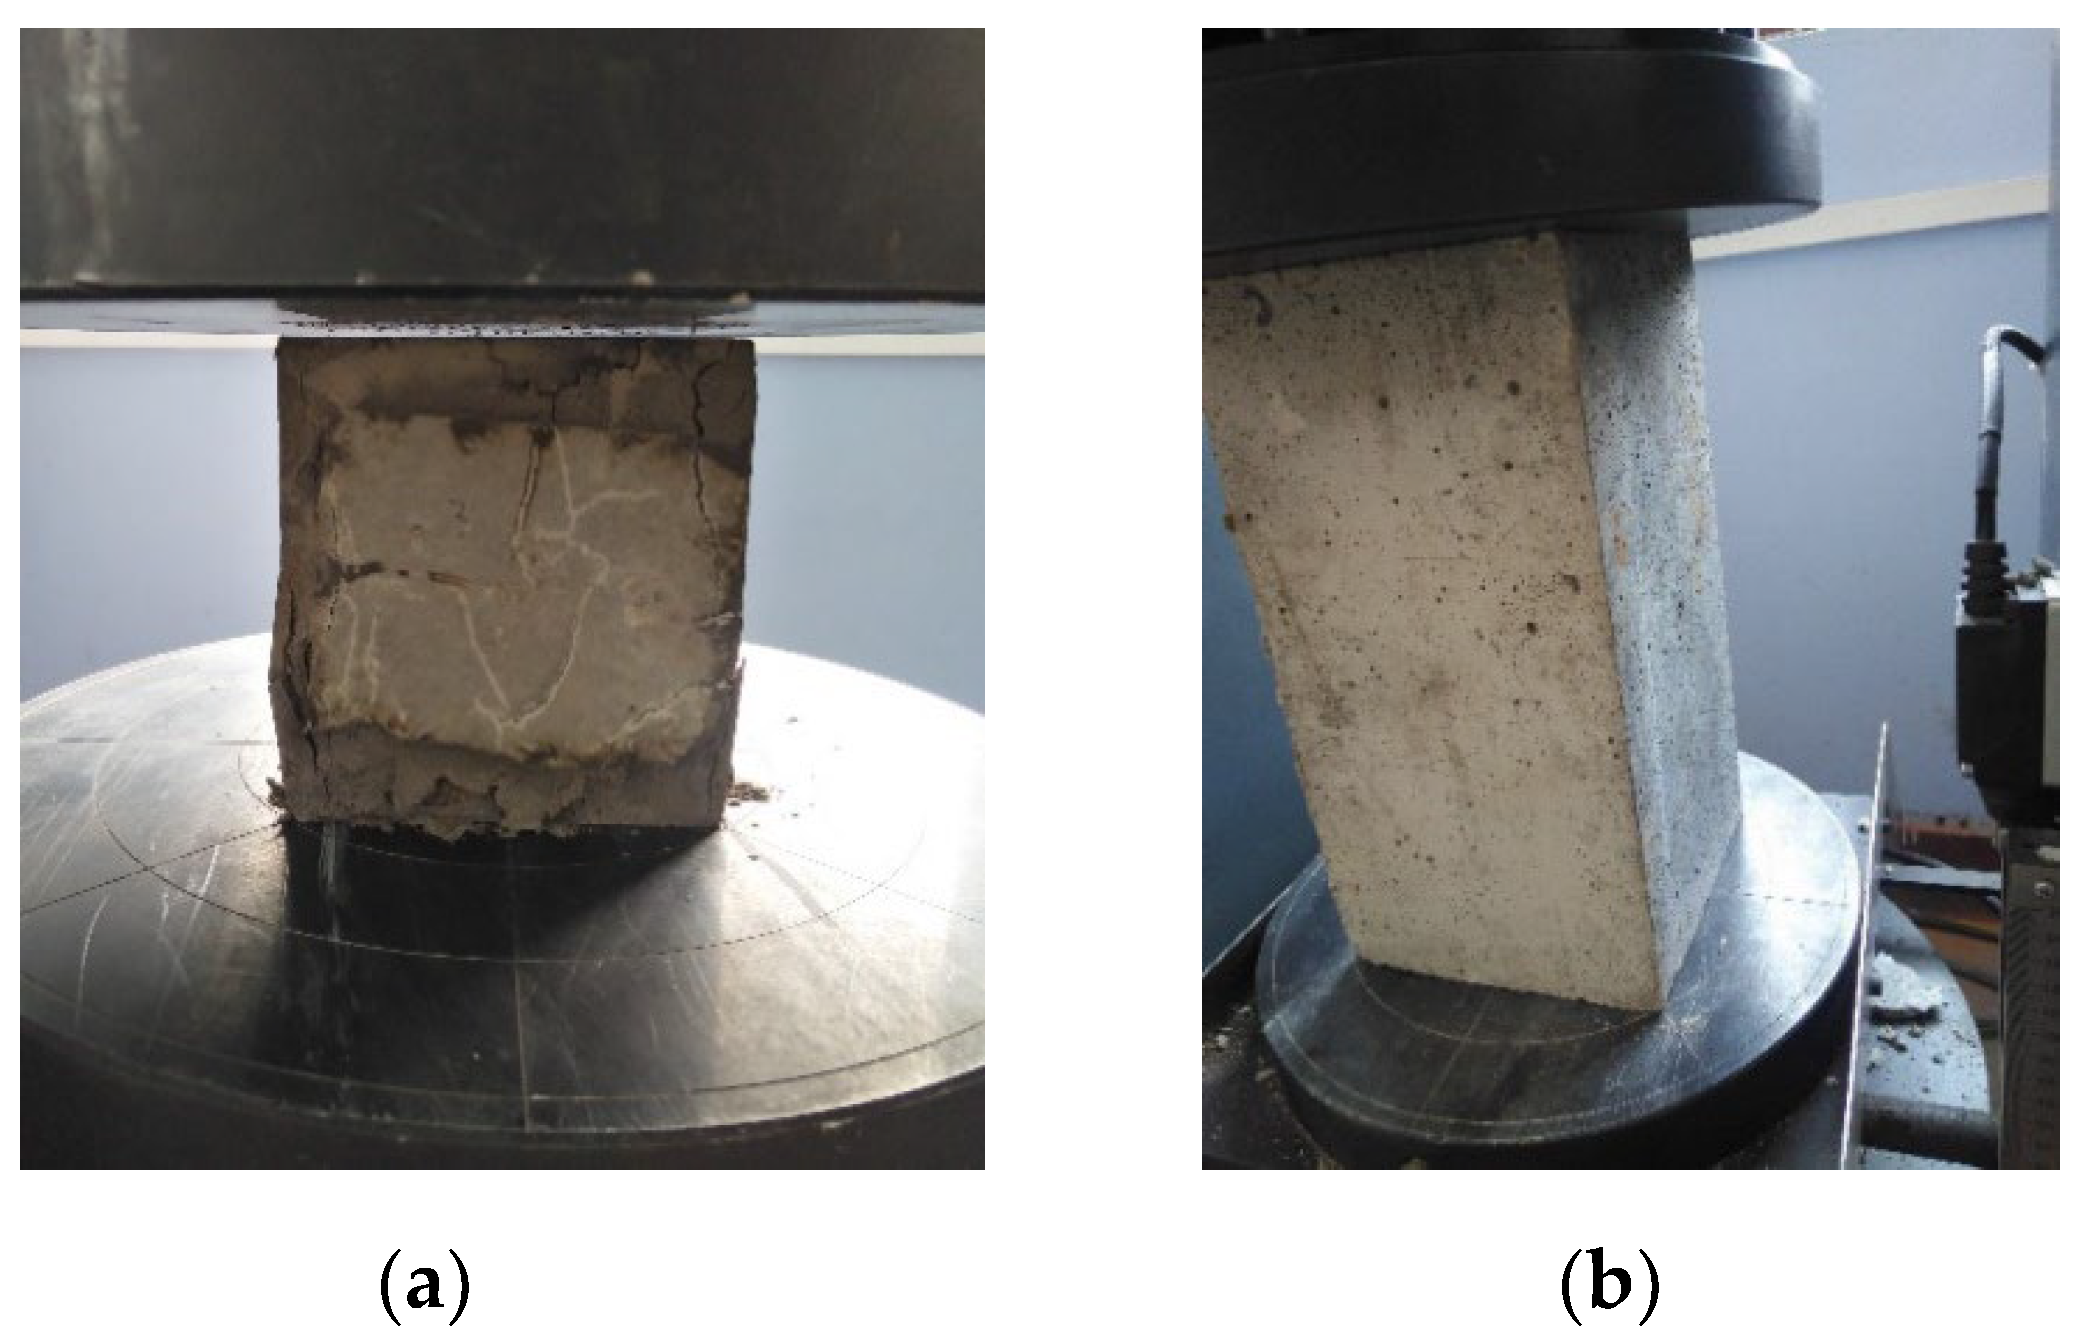
In order to measure the compressive strength of OC and GC, three concrete cubes with a length of 100 mm, and three prisms with the dimensions of 150 × 150 × 300 mm3, were cast for each mixture. After 28 days of curing under lab conditions, the compressive strength test (Figure 4) was conducted based on the Chinese standard GB/T 50081-2002 [41]. Each specimen was tested with a loading rate of 0.5 MPa/s until the failure of the sample.

2.3. Glass Concrete-Filled Steel Tubes (GCFSTs) Test

To investigate the influence of the replacement ratio of glass (0, 10%, 15%, 20%, and 30%) on the mechanical behavior of GCFSTs, column specimens filled by different GC mixtures were tested in axial compression. For each mixture, three specimens were prepared and tested in order to minimize the specimen’s individual differences. Therefore, a total of 15 circular specimens were fabricated, with a constant L/D ratio of 3. As shown in Table 2, all specimens were designed with the same dimensions, in which the steel tube has a length of 400 mm, an outer diameter circular cross section of 133 mm, a 4.75 mm thickness, and the core concrete has a diameter of 123.5 mm. The steel used in this study is seamless Q235B and its yield strength, ultimate strength, and E-modulus are 338 MPa, 442 MPa, and 206 GPa, respectively.
Prior to filling with concrete, the bottom end of the tube specimen was mounted with a cover plate to avoid leakage of the concrete. Then, the concrete was poured until reaching the same length of the steel tube, and the concrete was levelled to keep a flat surface for uniform loading. In order to guarantee a good bond between the concrete and the steel tube, the dust on the inner surface of the steel tube was wiped out. It should be noted that all specimens had a smooth inner steel surface to exclude the influence of interface treatment, and were cured under the same curing conditions as the concrete cubes and prisms.
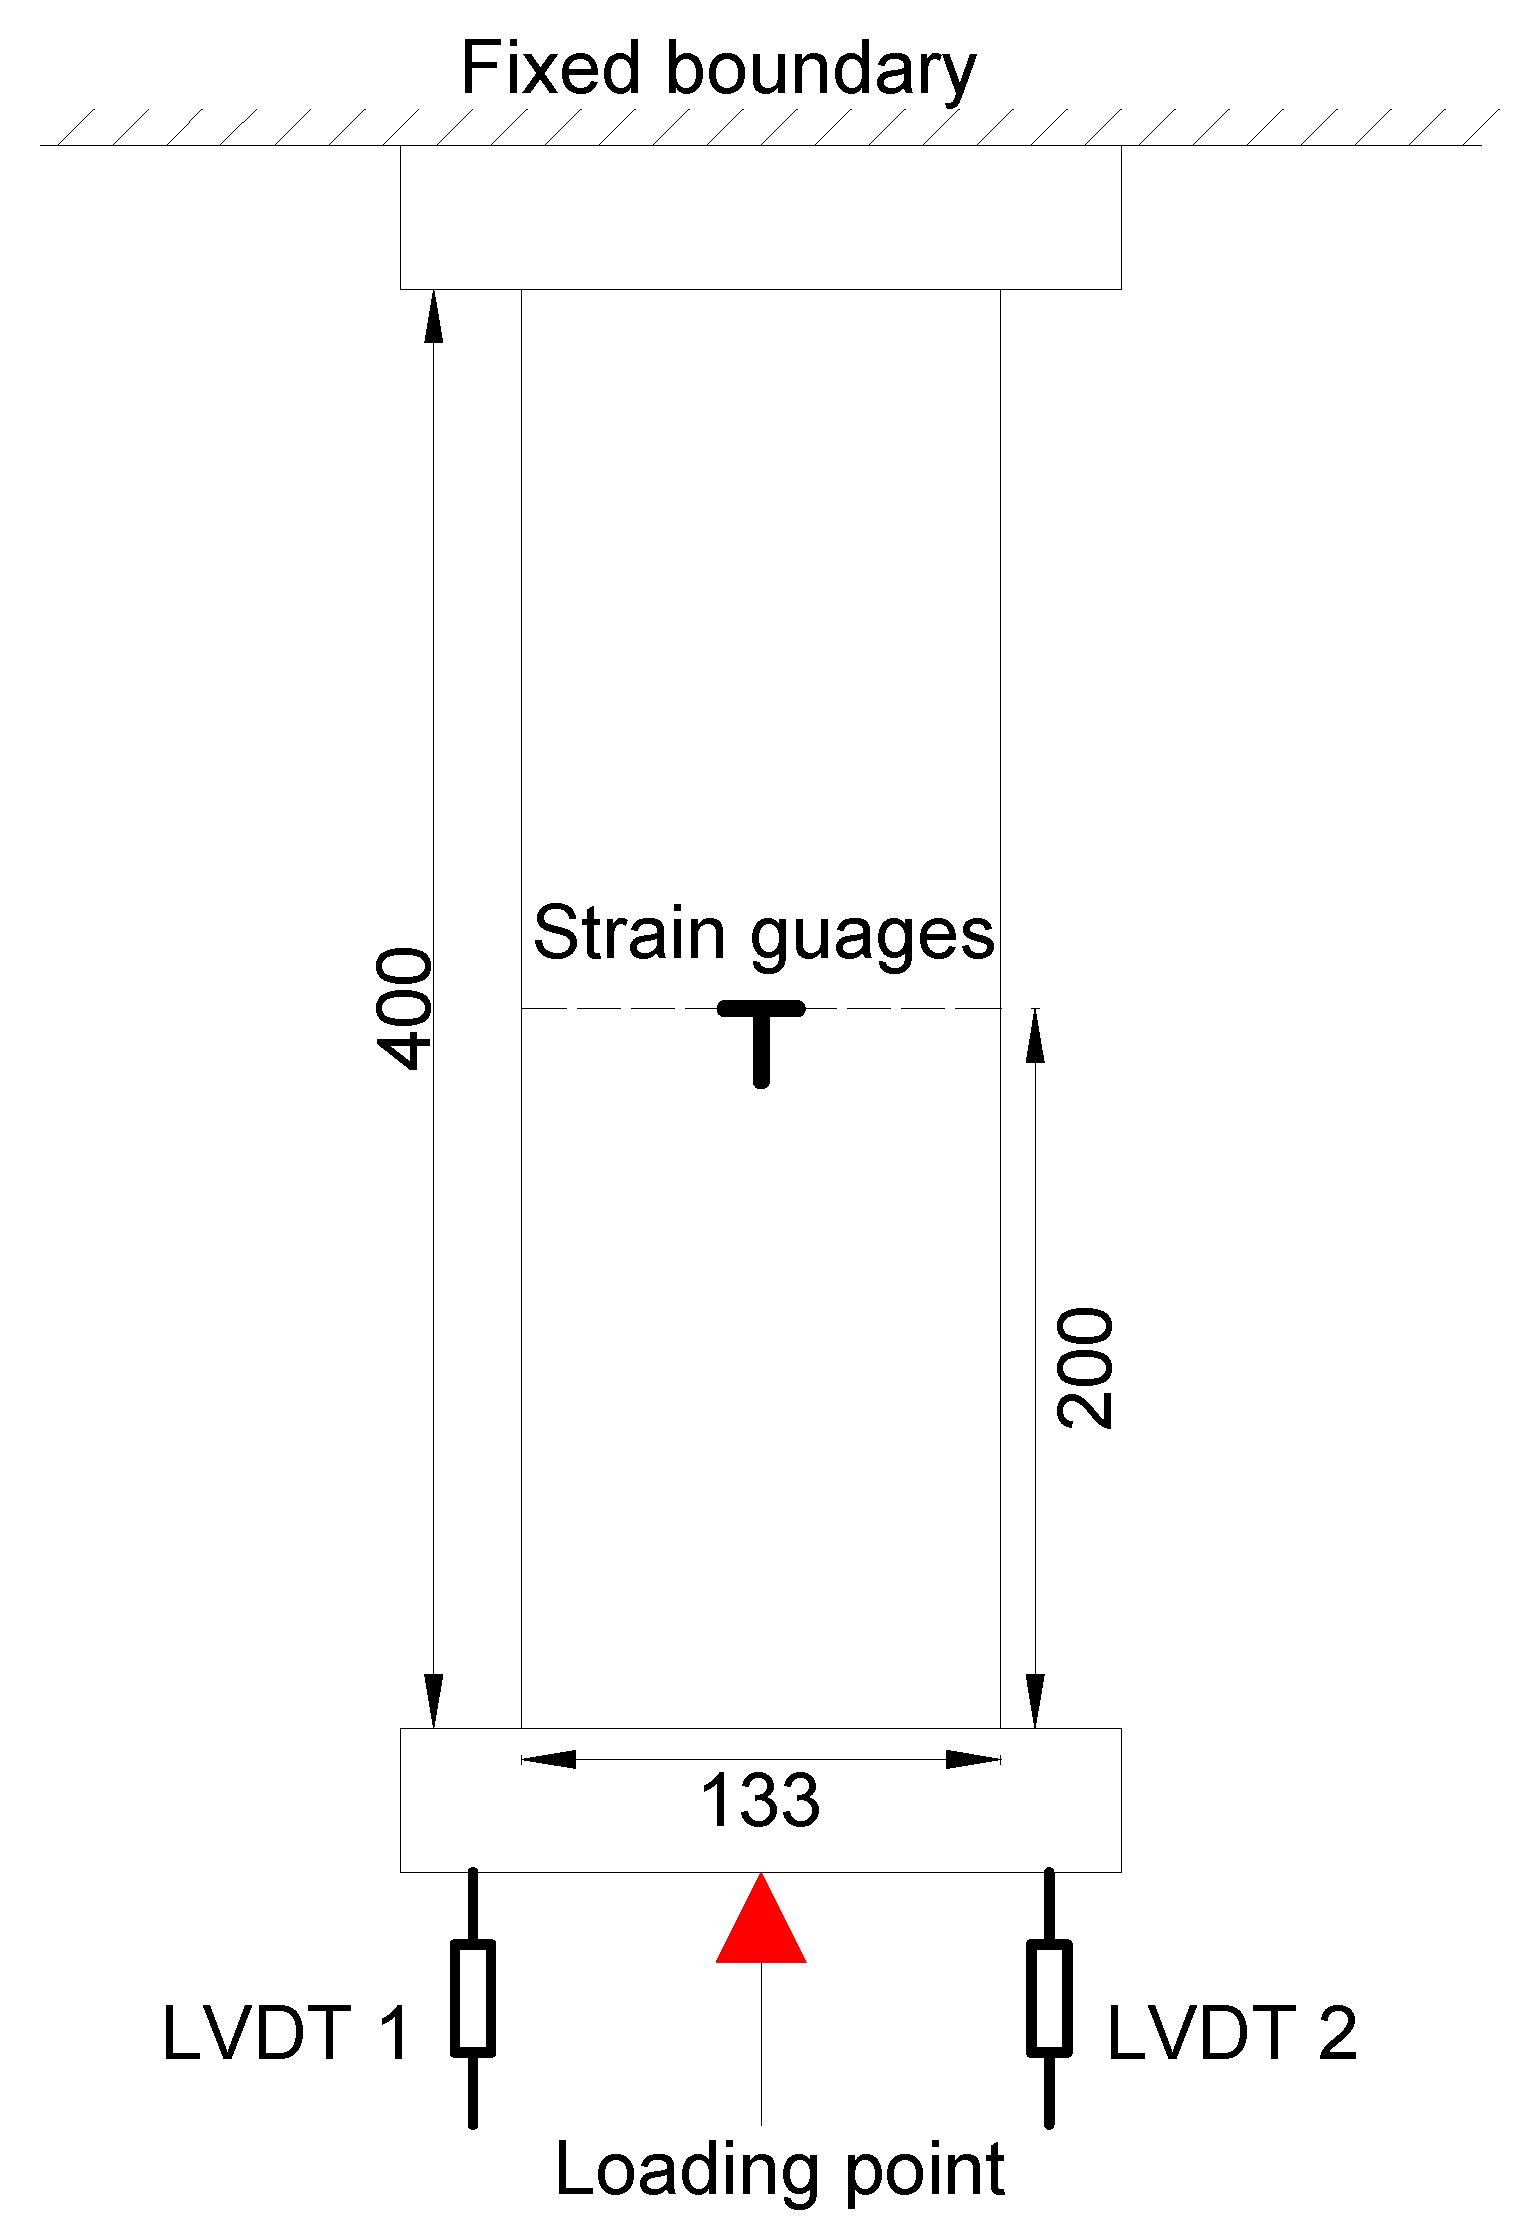
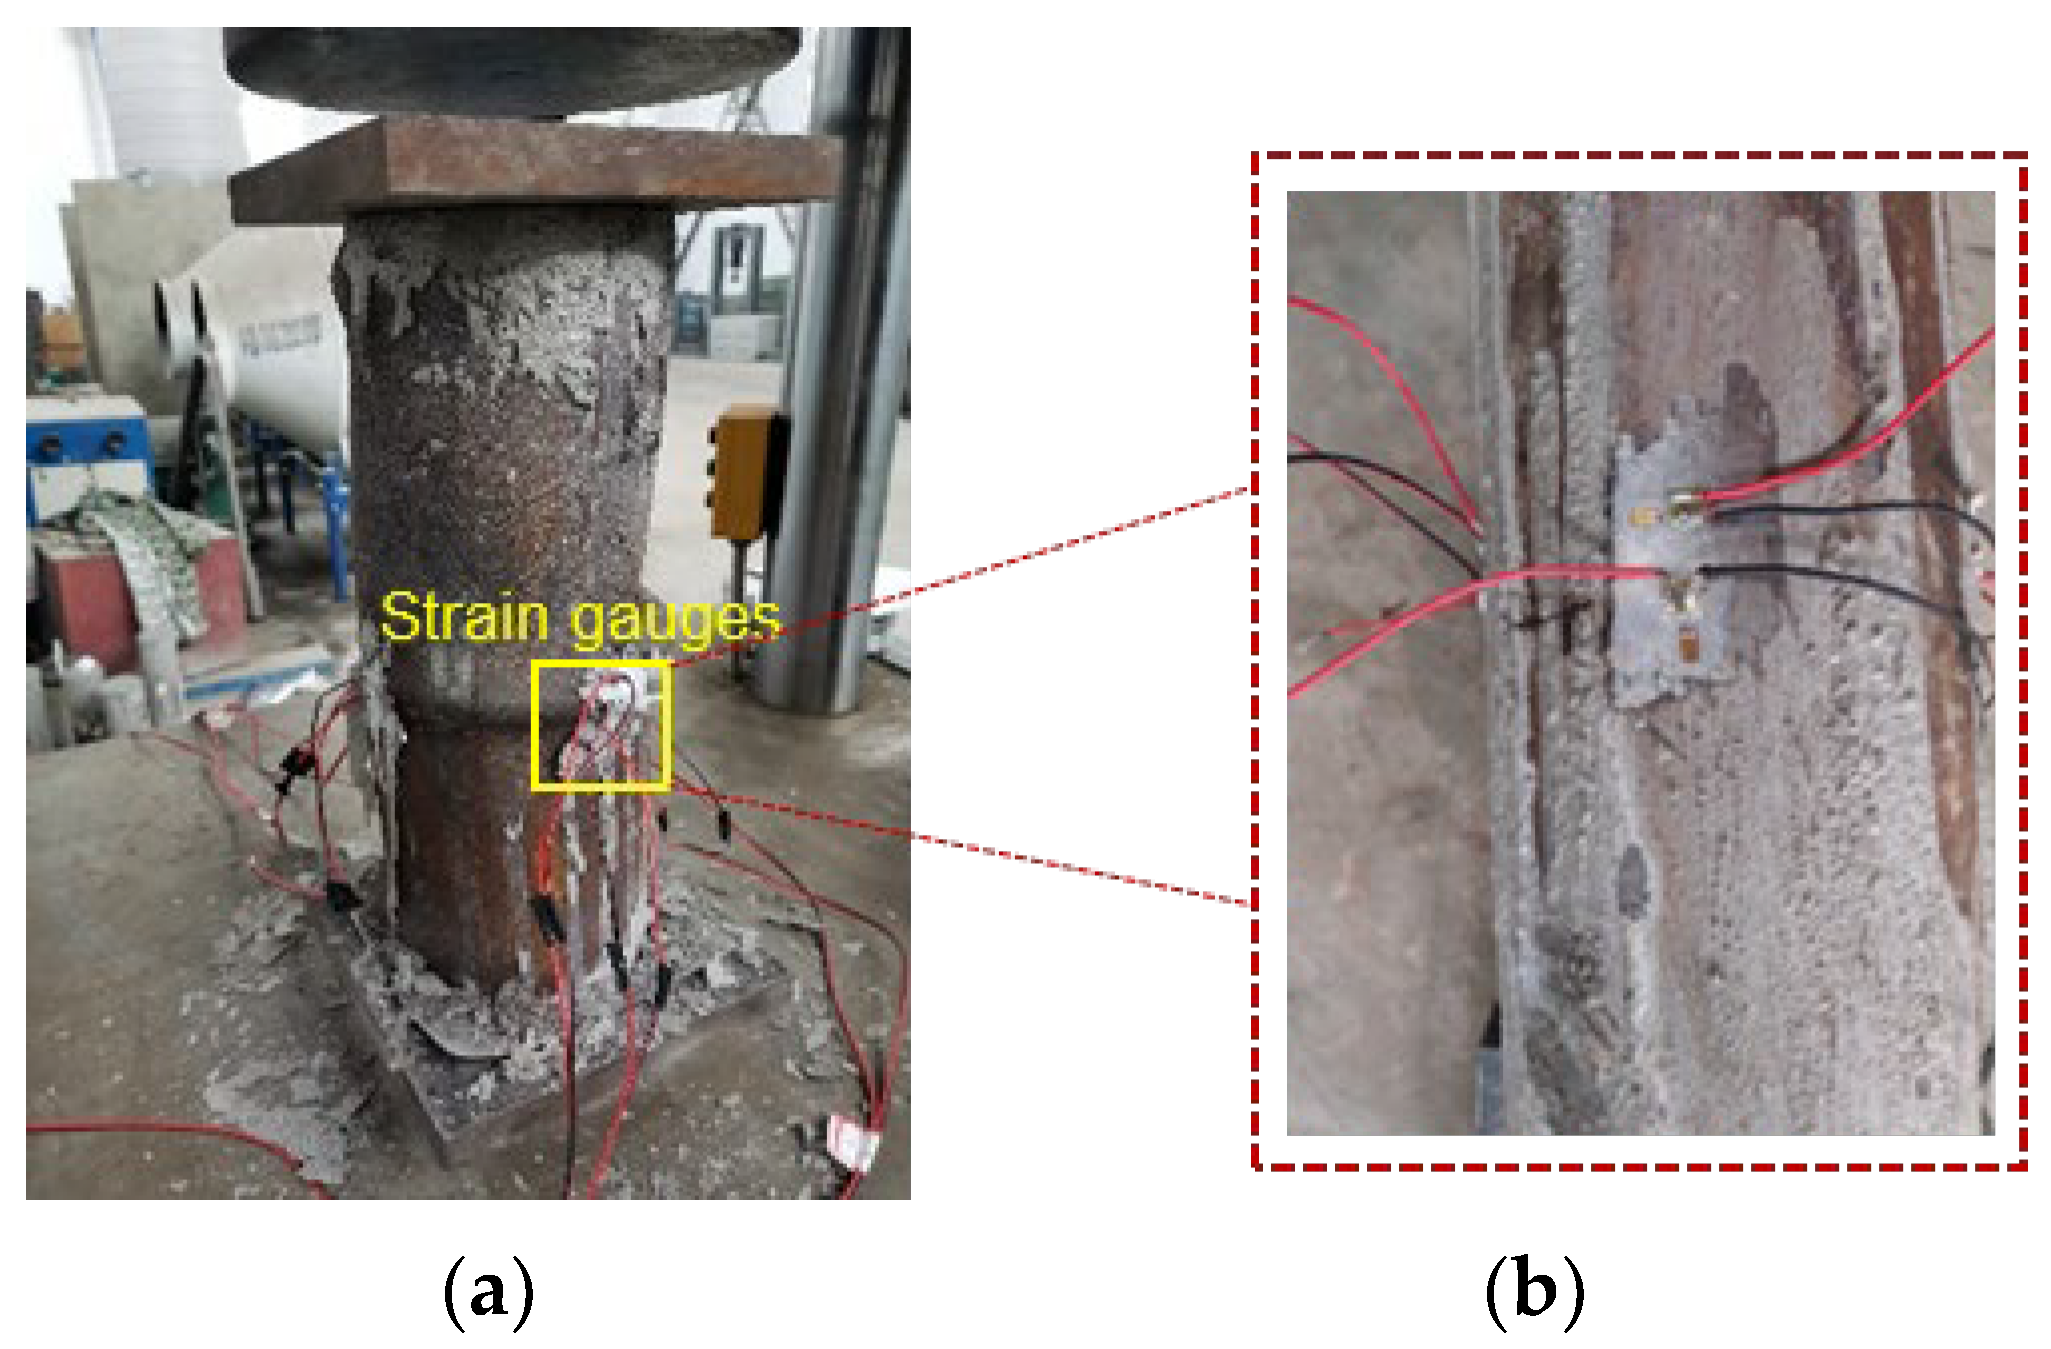
Before testing, as shown in Figure 5, strain gauges and linear variable differential transducers (LVDTs) were applied to obtain the strain in the longitudinal and transverse directions, and the deformation of the specimen for the whole loading process. For one specimen, eight strain gauges were symmetrically glued to its four sides; each side had two strain gauges vertically and horizontally glued to the center of the specimen. Moreover, two LVDTs were installed to measure the average axial displacement of the specimen.
After measurement preparation, all tubular specimens were placed in the center of the loading device and were loaded under axial compression (Figure 6). The specimen was initially preloaded to eliminate the gap between the specimen and the loading device, and then tested to failure under deformation control with a loading rate of 0.4 mm/min. Setting a relatively low loading speed is not only appropriate to record the static load–displacement behavior prior to the peak load, but also helps to capture the post-peak behavior of the specimen beyond the ultimate load [42].

3. Test Results and Discussion

3.1. Material Properties

3.1.1. Slump and Slump Flow of OC and GC Mixtures

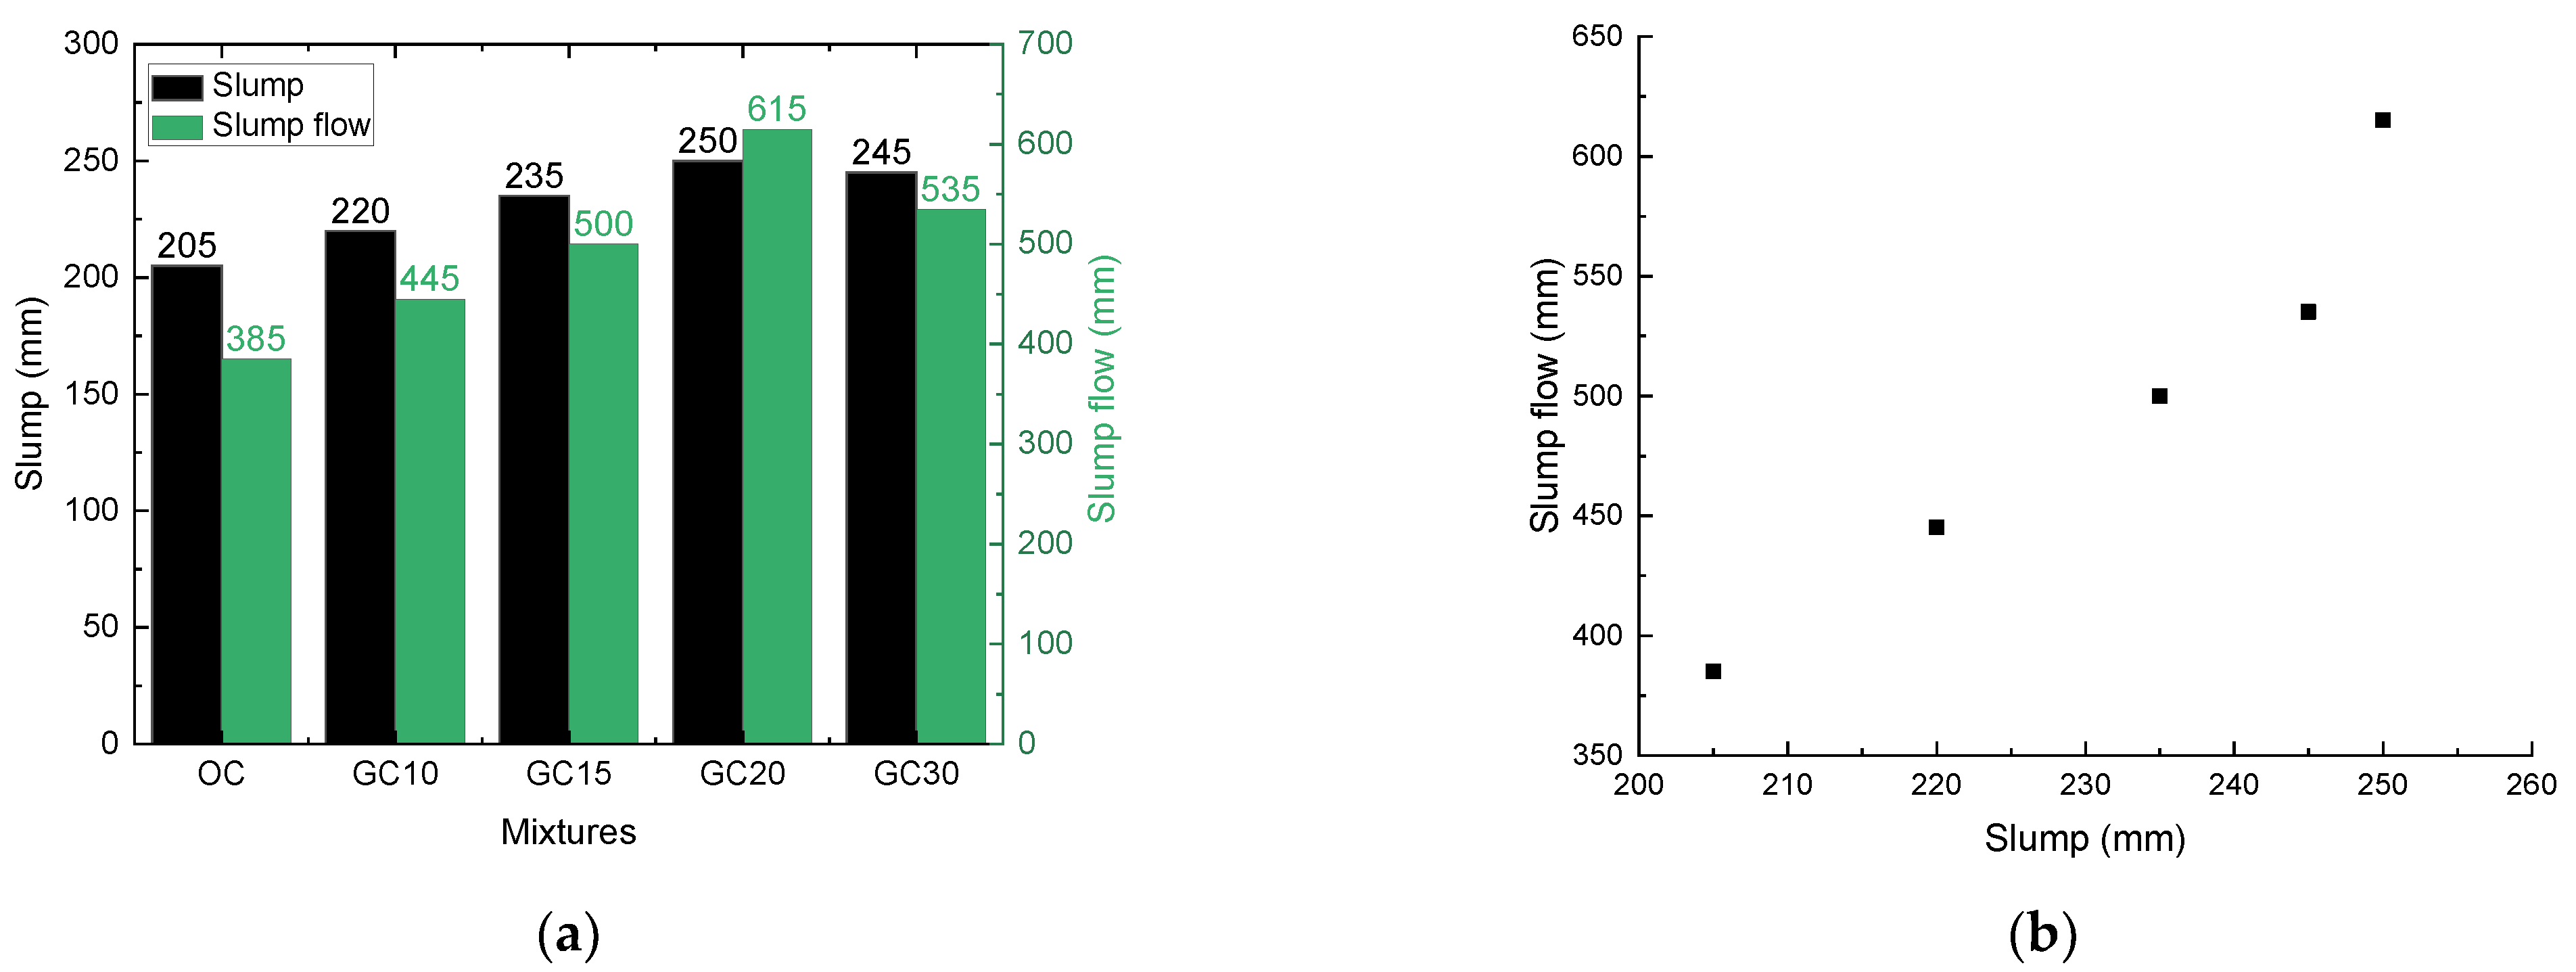
The slump and slump flow of the studied concrete mixtures are presented in Figure 7. As depicted in Figure 7a, the slump and slump flow increase as more glass particles are added to the concrete, when the replacement ratio is lower than 20%. However, when more than 20% glass (as such in GC30) is used as the raw material, decreases in slump and slump flow are observed, though the corresponding GC30 mixture is still flowable. The reduction of flowability might be because compared to the cement particles, a sharper edge and higher specific area of the glass powder will harm the workability of the concrete mixtures as more glass powders replace the cement, which is in agreement with the finding in [43,44]. Compared to OC, the slump and slump flow values of all GC mixtures are higher, since the smooth surface of the glass beads enables a lower cohesion with the contacted particles. The addition of the glass powder to replace the cement reduces the water absorption of the concrete mixtures, and hence increases the fluidity, as also found in [45,46]. The highest slump and slump flow values are achieved when the replacement ratio is 20%, which are 20% and 60% higher than the control OC mixture, respectively. Figure 7b shows the relationship between slump and slump flow, and it is found that the slump and slump flow, in general, exhibit a linear function for all of the mixtures, except for GC20. GC20 shows a sharp increase in the slump flow, which might lead to bleeding in fresh concrete, which is not favorable for the concrete quality.

3.1.2. Compressive Strength of OC and GC Mixtures

The cubic compressive strengths at the ages of 7 days and 28 days, as well as the 28 days’ prismatic compressive strengths for the mixtures in the current study are shown in Figure 8. It is observed that the compressive strength in general decreased with the addition of more glass in the concrete mixtures. When more than 15% glass particles are used, the compressive strength of the GC is only around 70% of the original concrete mixture. Although similar test results are also found in [26] when glass particles are used to substitute cement, the compressive strength of the GC increases if glass particles are a substitute for cement and aggregate together, which is contrary to the findings in the current study, which is possibly due to the differences in particle size and shape. Therefore, though the best workability is seen in GC with 20% glass, the compressive strength of such a mixture is not promising, which is possibly due to concrete bleeding [43], the reduced bond between the glass beads and the matrix [47], as well as the reduced amount of cement [48]. However, comparing 28 days’ cubic and prismatic test results, the reduction of compressive strength is not obvious when the glass replacement is no more than 15%. The pozzolanic reaction of glass powder could help to densify the microstructure of the concrete [49], and therefore improve its compressive strength and mitigate the strength reduction from the glass beads substituting the aggregate, although there is an upper bound for strength improvement [25]. In addition, compared to OC, the compressive strength of GC increases at a higher rate if more curing time is provided. This is because the existence of fine glass powder, generally, will gradually consume a large quantity of Ca(OH)2, and thus lead to significant pozzolanic activity, which is confirmed by the strength gain exhibited in GC as the curing time increases.

3.2. Structural Behaviour of CFST

3.2.1. Failure Patterns

Based on the experimental observations, all of the tubular specimens, with or without the addition of glass particles, show similar damage processes and failure modes. In order to provide a clear understanding of the failure process, the failure mode of specimen GCFST-10 is chosen for deep analysis, as presented in Figure 9. The damage process could be divided into three stages: (a) linear-elastic stage, (b) plastic deformation stage, and (c) post-peak failure stage. In the first stage, as the load increases, only slight deformation and no obvious surface damage are observed. However, when the load is increased to around 80% of the peak load, the specimen starts to expand in the lateral direction, and slippage (Figure 9a) appears along the axial direction of the steel–concrete column. When it enters the post-peak failure stage, local buckling occurs at the mid-height of the specimen, and a drum-type failure is exhibited (Figure 9a). It should be mentioned that after the peak load, rather than sudden brittle fracture, the specimen behaves in a ductile damage process until the final failure. After steel yields, it still possesses enough strain-hardening capacity before reaching its peak strength. Therefore, in the current study, the test is terminated and the failure load is obtained when the obvious outward drum-type deformation is observed in the test specimen. However, when the specimen continues to deform after the peak load, the compatibility between the steel tube and the concrete filling starts to decrease, since a higher plastic deformation occurs in the steel column. The difference in transverse displacement between the steel and the concrete will gradually weaken their composite action to resist the external load, as proved by the concrete peeling in Figure 9b.

3.2.2. Load–Deformation Response

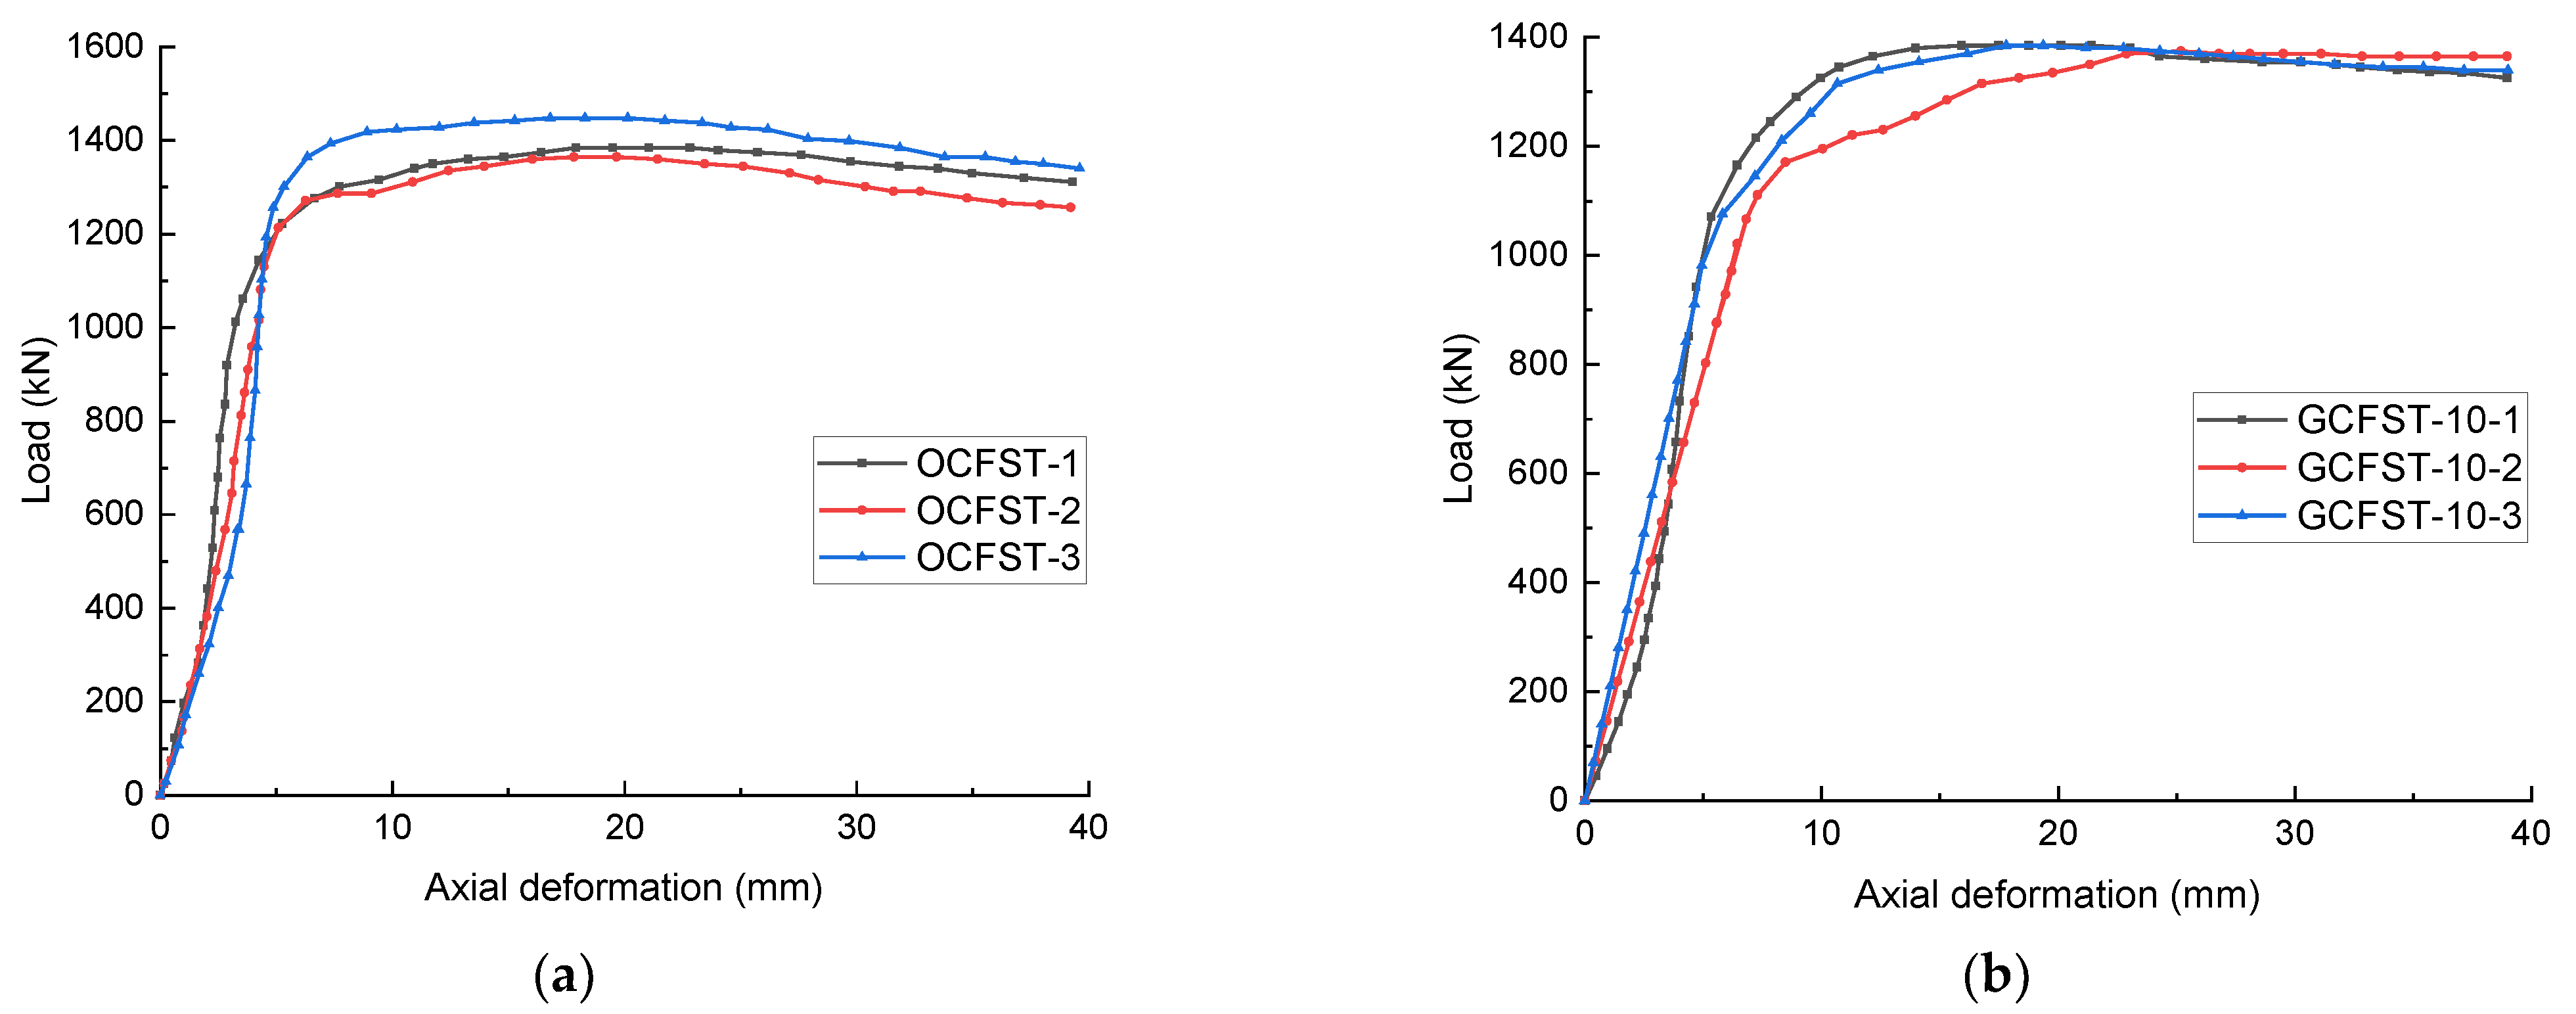
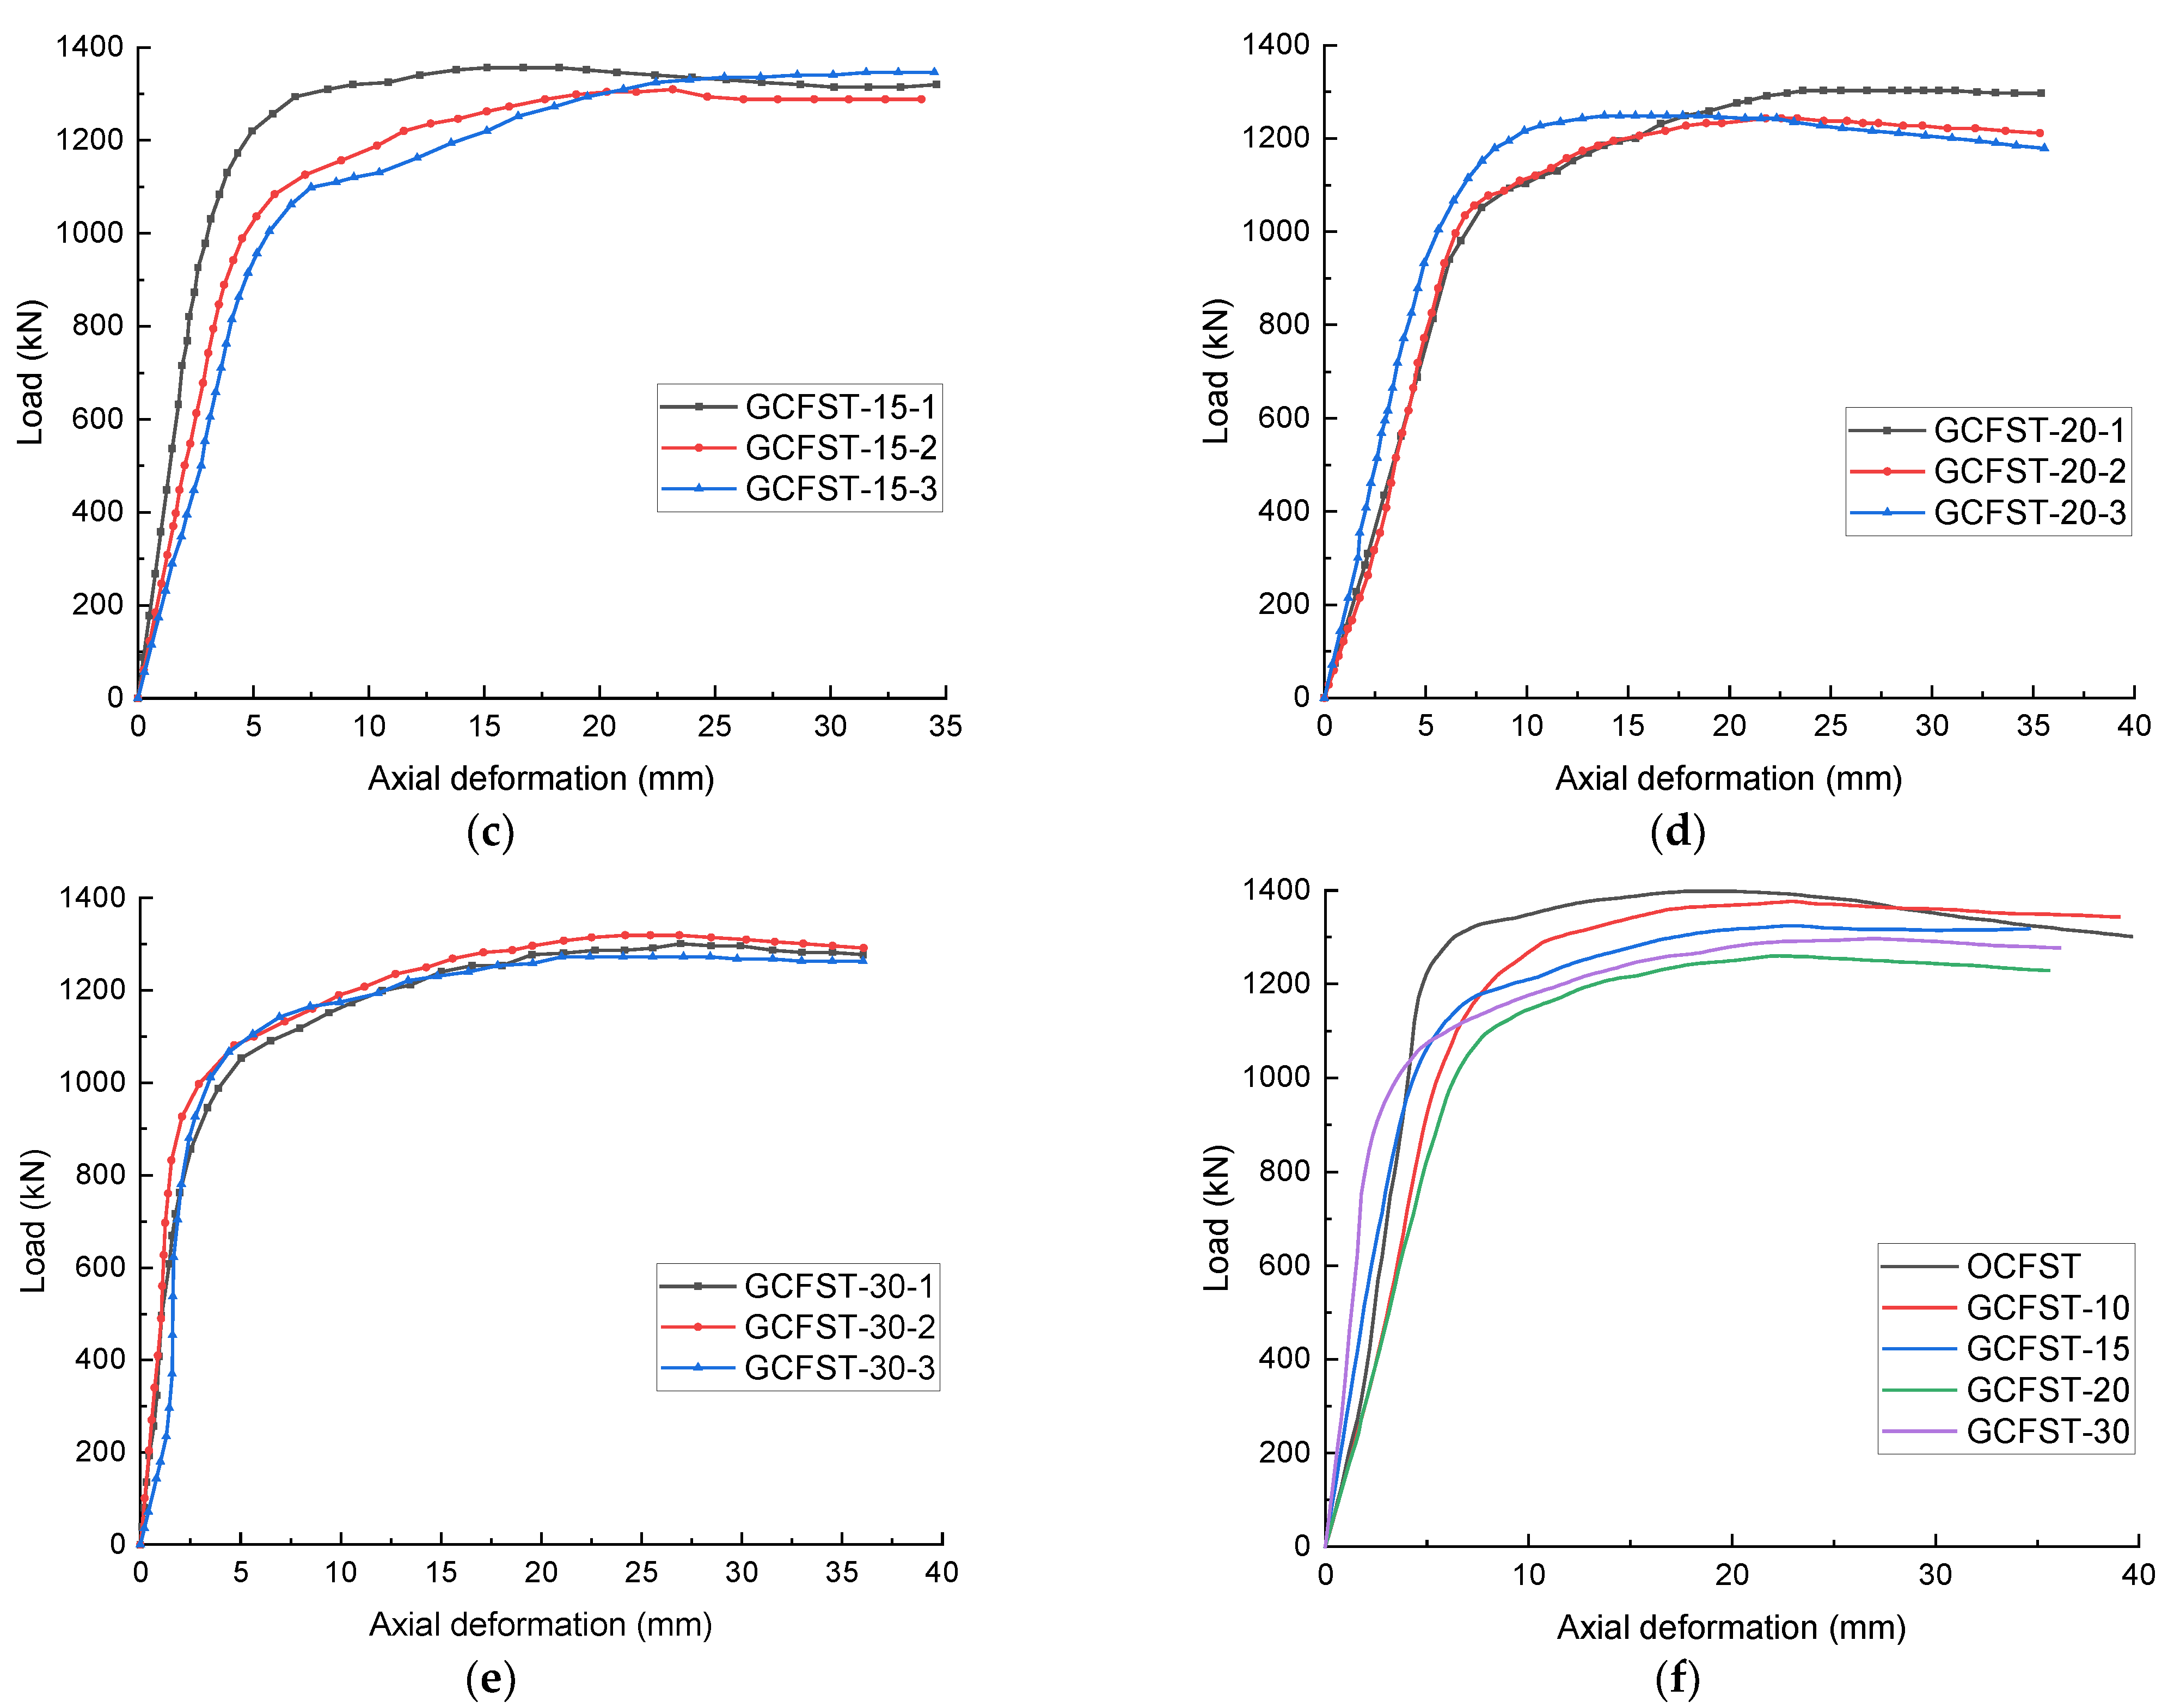
The load versus deformation (obtained by averaging measurements from two LVDTs) in the axial direction for specimens with different concrete mixtures, together with the comparison of the average load–deformation relationship, are presented in Figure 10, and Table 3 summarizes the average experimental results for all of the tested specimens. As shown in Figure 10, similar to the damage process, there are three phases in the load–axial deformation response for all of the specimens. In the first phases (linear-elastic phase), the deformation is linearly increasing at a low rate as the load increases. Afterwards, when more than 80% of the axial compressive load is applied (second phase), plastic deformation occurs and the axial displacement rapidly grows. After reaching the peak load, due to the continuous confining effect from the outer steel tube, the specimen’s ultimate bearing capacity only slightly decreases (within 10% of the ultimate strength), followed by a remarkable deformational ability (the deflection when the specimen fails is at least 1.3 times the deflection at the peak load).
When the average load–deformation responses for CFSTs filled with different concrete mixtures are compared (Figure 10f), it is observed that compared to the reference OCFST, all GCFST specimens exhibit quicker stiffness degradation prior to reaching their peak loads, though the GCFST with less than 20% glass shows slightly higher initial stiffness. As depicted in Table 3, in terms of the bearing capacity of CFSTs, with the addition of more glass particles, the peak load continues to decrease, which is owing to the compressive strength reduction of GC, as described in Section 3.1.2. The lowest bearing capacity is observed in GCFST-20, which might be a result of the highest cubic compressive strength reduction of GC20 due to the possible concrete bleeding. When the deformation of the tested specimen is compared, it is found that the addition of glass particles enables a higher deformational ability (Δp) at the peak load, which leads to a slightly lower ultimate deformation Δu when the specimen fails. In order to further evaluate the ductility capacity, the ductility coefficient ( ξ ) [50] is denoted as:
ξ = Δ u Δ p
where Δu and Δp are displacement at the peak load and displacement when the specimen fails, respectively. Therefore, it is demonstrated that GC leads to the decrease of peak strength and a lower ductility coefficient ξ of GCFST in the current study. However, the maximal peak load reduction is merely 7% for GCFST-30, and there is a negligible reduction of ultimate deformation Δu, which proves that GC is still a promising alternative to OC as a filling material in CFSTs.
In addition, in order to evaluate the confinement contribution of steel tubes on the structural performance of CFSTs [51], the confining factor is introduced and defined as follows:
θ = A s f y A c f c
where A s , A c , f y , and f c are the sectional area of the steel tube, sectional area of the concrete, yield strength of the steel, and compressive strength of the concrete prism, respectively. The calculated results are summarized in Table 3 as well. It is found that the confining factor increases with more glass inside the concrete, demonstrating that compared to OCFSTs, GCFSTs show a more significant confinement action of the steel tube. This is possibly because the steel tube is able to restrict the glass concrete expansion induced by the ASR, and thus avoid cracking of the concrete. Therefore, it shows great potential for the application of GC in CFSTs because the steel tube could mitigate the adverse expansive effect of GC, enhance the combined action between GC and the outer steel tube, and therefore improve the bearing capacity of GCFSTs.

3.2.3. Load–Strain Relationship

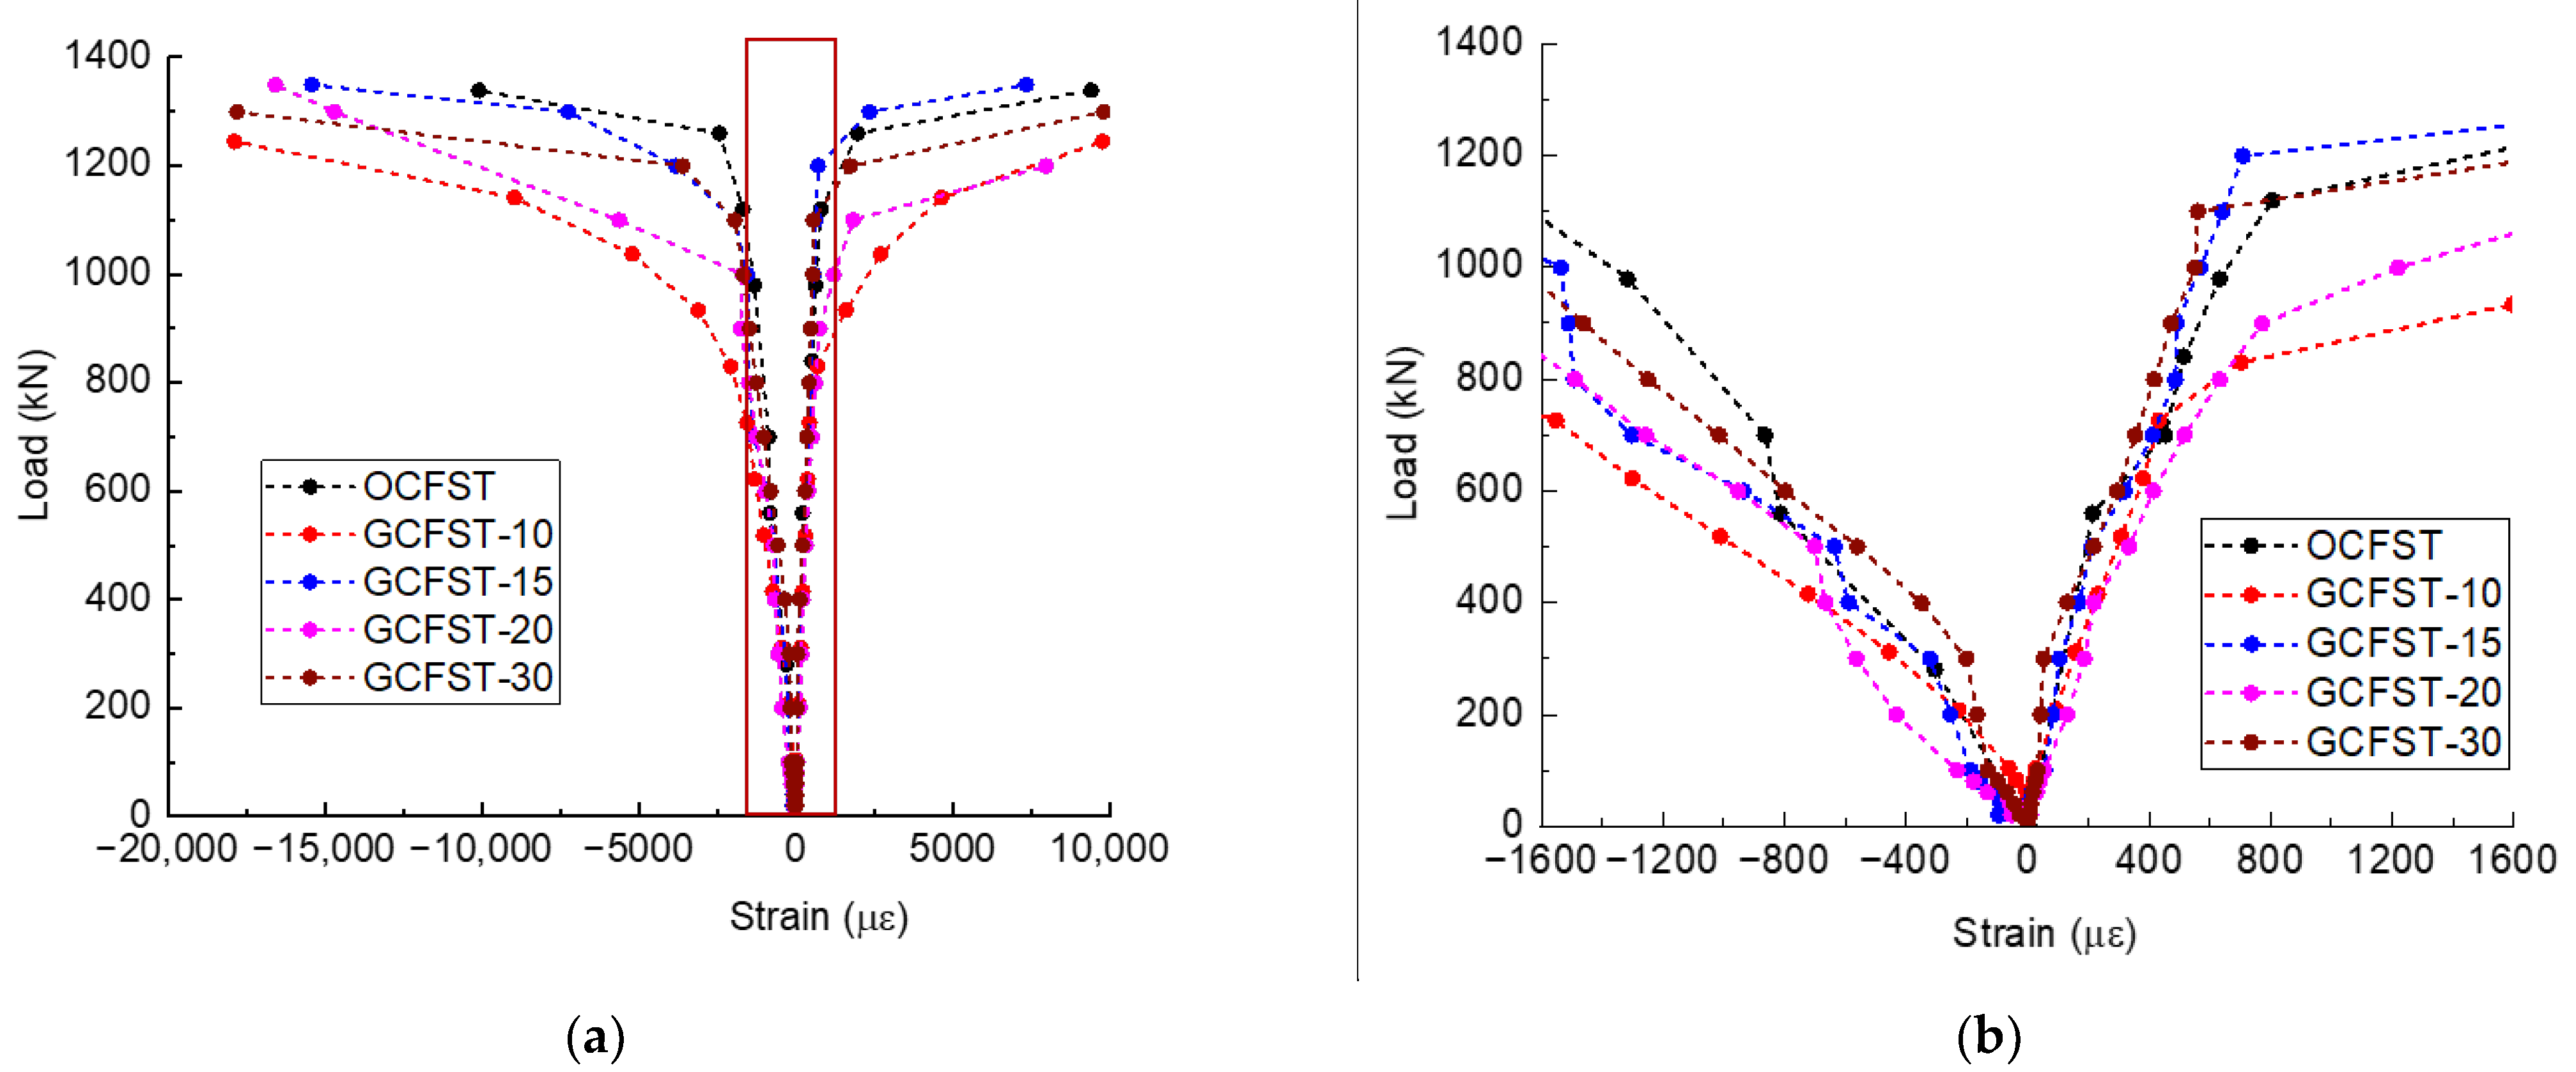
The load–strain (both axial and lateral strain) relationship for tubular specimens with different concrete mixtures is plotted in Figure 11, in which the negative strain value represents the compressive strain in the axial direction, and the positive value indicates the tensile strain in the transverse direction at the mid-height of the specimen. As shown in Figure 11a, in the initial elastic stage, both the compressive and tensile strains increase slowly with linearly increasing load. When it enters the elastic-plastic stage (after the yield strength of the steel), the strain dramatically increases with the continuously added applied load. Finally, in the plastic deformation stage, the strain increases without strength enhancement of the specimens. Figure 11b presents the strain variation before the steel yields, and it is shown that the axial strain increases quicker than the corresponding value of the lateral strain at the same load level. This is because the transverse deformation is generated due to the Poisson effect, which is generally 0.2–0.3 of axial deformation for normal concrete.
When the strain variation for specimens filled by different concrete mixtures are compared, it is found that compared to OCFSTs, the addition of glass particles enables GCFSTs to exhibit a higher axial strain capacity while still keeping comparable strain limits in the lateral direction. Therefore, it is demonstrated that the GCFSTs in general show better deformational ability in the axial direction under compressive load before the local buckling (indicated by the lateral deformation) occurs.

4. Evaluation of Existing Methods for Ultimate Strength Prediction

Based on the comparison of both the material properties for OC and GC (focusing on the workability and compressive strength) and the structural behavior of OCFSTs and GCFSTs in Section 3, it is reasonable to conclude that with less than 20% of glass substitution in concrete, the GC is a comparable material to OC, and is promising as a filling concrete in CFSTs. However, most of the existing methods in the current design codes are primarily focused on the performance evaluation of OCFSTs, and it remains unclear whether these calculation methods are feasible for GCFSTs. Therefore, in this section, the commonly used standards, including AISC 360-16 [52], EC4 [53], and Chinese specifications GB50936-2014 [54], will be adopted to predict the ultimate strength of GCFSTs.
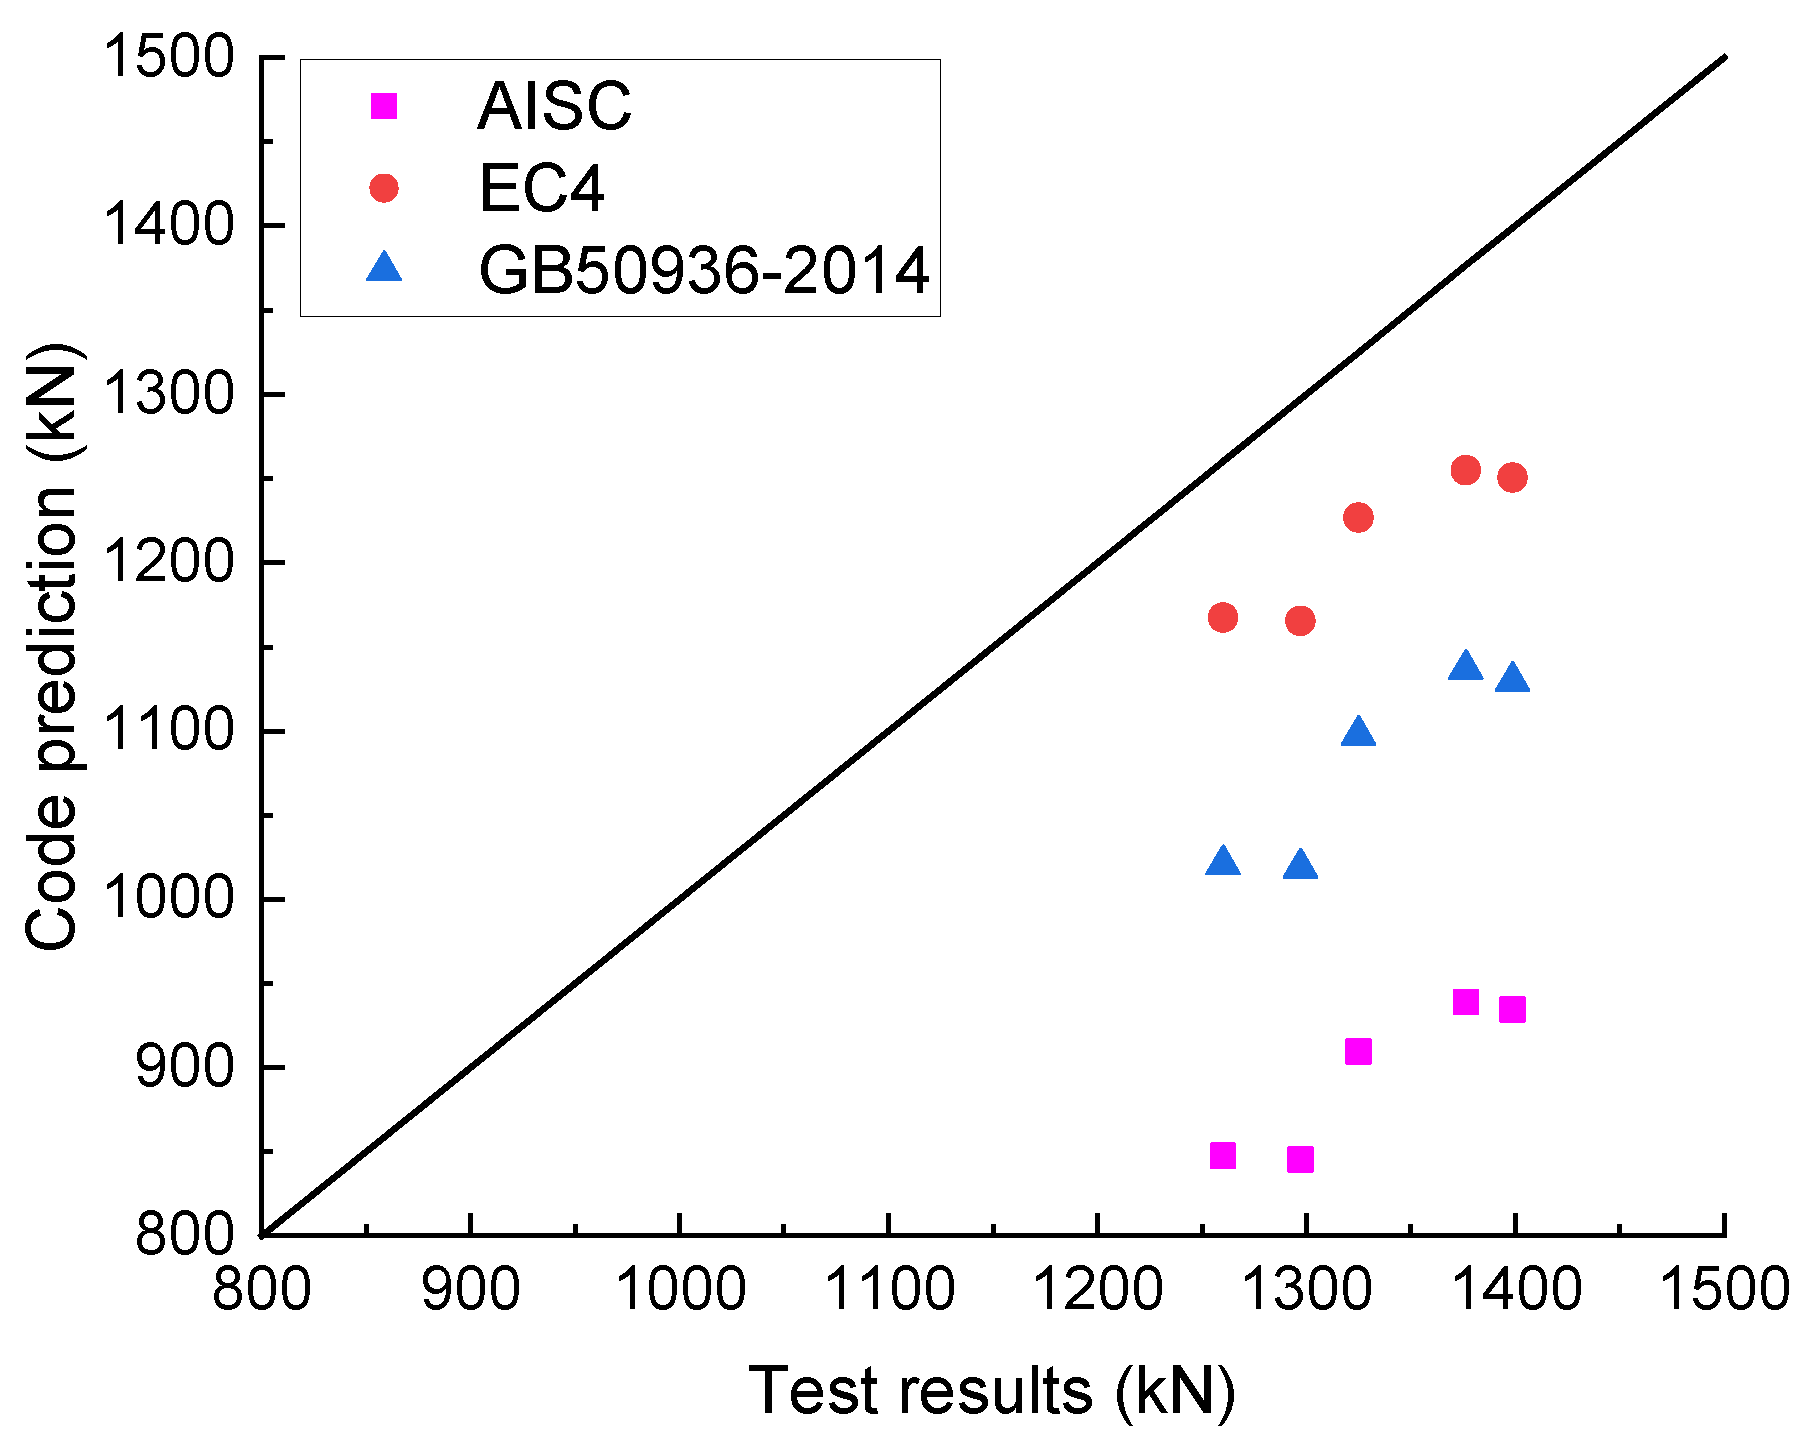
Table 4 presents the main equations for different codes used in the current study, the test results, as well as the predicted strength. Figure 12 compares the ultimate strength between the experimental results and the code prediction from AISC, EC4, and GB50936-2014. It is found that all three of these specifications underestimate the column capacity compared to the test results. However, it is inferred that EC4 gives a closer prediction compared to the other two codes, based on the fact that the ratio of predicted to experimental results is around 0.9 for EC4, while it is only 0.67 and 0.8 for AISC and GB50936-2014, respectively. This is because, in EC4, the enhancement of concrete compressive strength gained from the confining effect of the steel tube is taken into account, while AISC gives the most conservative results, as the compressive strength of the core concrete can only reach 0.95 f c for the circular column specified in AISC. For GB50936-2014, the concrete-filled steel column is simply regarded as a unified material, and the empirical formula is built based on the regression of a large amount of experimental data. However, the variability of material properties and the neglected interaction between the concrete and the steel might lead to large discrepancies compared to experimental results.
In summary, all three of these codes could provide a safe design for circular steel columns incorporated with glass concrete, due to their relatively conservative predicted results. However, the existing codes still need further evaluation due to the limited test results in the current study, and the development of new calculation methods is encouraged, in order to consider the complicated action between the steel and the concrete core in CFSTs, and the material constitutive law of glass concrete.

5. Conclusions

In this study, a series of tests (material test and CFST structural test) are conducted to investigate the material properties of GC and the structural performance of CFSTs incorporated with GC. The effect of glass with different particle sizes and varying ratios on the flowability and compressive strength of GC are evaluated. Then, the structural behavior of ordinary CFSTs and GCFSTs, with the application of different GC mixtures under axial compression, are compared in terms of the failure patterns, load–deflection response, and load–strain relationship. Finally, the applicability of existing codes for the ultimate strength prediction of GCFSTs is examined. Based on the test results in this study, the following conclusions could be drawn:
  • The addition of glass particles (powders and beads) will increase the flowability of the concrete due to reduced particle cohesion resulting from the smooth surface of the glass beads, and higher w/c ratio as a consequence of cement substitution. The highest slump and slump flow are achieved at a 20% glass replacement ratio, exhibiting an increase of 20% and 60%, respectively, compared to ordinary concrete. Beyond a 20% replacement ratio, a decrease in slump and slump flow was observed due to the sharp edges and higher specific area of the glass powder.
  • The compressive strength of concrete will continuously decrease as more glass particles are added to the concrete mixture, which might be owing to the decrease of cement hydration and weak bonds between the glass beads and the matrix. However, the reduction of prismatic compressive strength (within 10%) is not obvious if less than 20% glass is applied, due to the pozzolanic reaction of the glass powder. Moreover, compared to OC, more curing time is required for GC to fully develop its strength. Overall, the use of glass particles in concrete mixtures requires careful consideration of the desired properties, and the appropriate proportion of glass particles to avoid the reduction of the mechanical properties. When both workability and compressive strength are taken into consideration, it is recommended to use less than 20% glass particles for combined cement and aggregate replacement.
  • Compared to OCFSTs, GCFSTs exhibit a similar damage process (i.e., linear-elastic stage, plastic deformation stage, and post-peak failure stage) and drum-type failure patterns at the mid-height of the column. Though GC has lower compressive strength compared to OCFSTs, less than a 10% decrease of the ultimate strength is observed in GCFSTs due to more significant confinement from the outer steel tube, which further restricts the expansion induced by possible adverse ASRs in GC.
  • GCFSTs exhibit a higher deformational ability at peak load (1.25 times higher than OCFSTs), and comparable ultimate deformation at failure load compared to their OCFST counterparts, which is possibly due to the enhanced composite action of GC and the steel tube, which shows potential for the application of GC in CFSTs.
  • Compared to OCFSTs, the addition of glass particles in GCFSTs enables it to have a higher axial strain capacity while still maintaining comparable strain limits in the lateral direction. Therefore, GCFSTs exhibit better deformational ability in the axial direction under compressive load.
  • The experimental results are compared to the predicted ultimate bearing capacity based on existing design codes (AISC, EC4, and GB50936-2014). It is demonstrated that all of the design codes, in general, provide conservative and safe predictions for circular GCFSTs, and that the EC4 gives the closest prediction (predicted to experimental peak load ratio is 0.9), while the AISC underestimates the actual compressive capacity to a great extent.
In summary, this study indicates that the addition of glass particles improves the flowability of glass concrete. However, a reasonable replacement ratio (less than 20% replacement ratio in the current study) needs to be taken into consideration in order to avoid a reduction in mechanical properties. With the application of GC in CFSTs, GCFSTs show great potential for structural applications, such as high-rise buildings, bridges, tunnels, and other infrastructure, due to its enhanced composite action and deformational ability. However, the long-term behavior of GCFSTs, considering the combined action of mechanical load and environmental condition, needs to be examined in future studies. Finally, the current design codes generally provide conservative and safe predictions for GCFSTs. In order to reliably predict the bearing capacity of GCFSTs, it is recommended to develop new calculation methods regarding the interaction between steel and concrete, as well as taking into consideration the material constitutive law of glass concrete.

Author Contributions

Conceptualization, Y.D. and Y.H.; methodology, Y.D., L.C. and Y.H.; software, Y.D. and L.C.; validation, Y.D. and Y.H.; formal analysis, Y.D., L.C. and Y.H.; investigation, Y.D. and L.C.; resources, Y.D.; data curation, L.C. and Y.H.; writing—original draft preparation, Y.D. and Y.H.; writing—review and editing, L.C. and Y.H.; supervision, Y.D.; project administration, Y.D.; funding acquisition, Y.D. All authors have read and agreed to the published version of the manuscript.

Funding

This work is financially supported by the Chunhui Plan from the Ministry of Education (14206499) and the Key Project of Xihua University (Z1220637). Yitao Huang would like to acknowledge the funding support from the China Scholarship Council (CSC) under the grant CSC No. 201906950087. The APC is funded by Delft University of Technology.

Data Availability Statement

The data supporting this study’s findings are available from the corresponding author upon reasonable request.

Conflicts of Interest

The authors declare no conflict of interest.

References

  1. Nodehi, M.; Taghvaee, V.M. Sustainable Concrete for Circular Economy: A Review on Use of Waste Glass. Glas. Struct. Eng. 2021, 7, 3–22. [Google Scholar] [CrossRef]
  2. Dhir, R.K.; De Brito, J.; Ghataora, G.S.; Lye, C.Q. Sustainable Construction Materials: Glass Cullet; Woodhead Publishing: Sawston, UK, 2018; ISBN 9780081009840. [Google Scholar]
  3. Department of Distribution Industry. Development Report of China Renewable Resources Recycling Industry 2018; The Ministry of Commerce (MOFCOM): Beijing, China, 2018. [Google Scholar]
  4. Basaran, B.; Kalkan, I.; Aksoylu, C.; Özkılıç, Y.O.; Sabri, M.M.S. Effects of Waste Powder, Fine and Coarse Marble Aggregates on Concrete Compressive Strength. Sustainability 2022, 14, 14388. [Google Scholar] [CrossRef]
  5. Karalar, M.; Bilir, T.; Çavuşlu, M.; Özkiliç, Y.O.; Sabri, M.M.S. Use of Recycled Coal Bottom Ash in Reinforced Concrete Beams as Replacement for Aggregate. Front. Mater. 2022, 9, 1064604. [Google Scholar] [CrossRef]
  6. Karalar, M.; Özkılıç, Y.O.; Aksoylu, C.; Sabri, M.M.S.; Beskopylny, A.N.; Stel’Makh, S.A.; Shcherban, E.M. Flexural Behavior of Reinforced Concrete Beams Using Waste Marble Powder towards Application of Sustainable Concrete. Front. Mater. 2022, 9, 1068791. [Google Scholar] [CrossRef]
  7. Qaidi, S.; Al-Kamaki, Y.; Hakeem, I.; Dulaimi, A.F.; Özkılıç, Y.; Sabri, M.; Sergeev, V. Investigation of the Physical-Mechanical Properties and Durability of High-Strength Concrete with Recycled PET as a Partial Replacement for Fine Aggregates. Front. Mater. 2023, 10, 1101146. [Google Scholar] [CrossRef]
  8. Małek, M.; Jackowski, M.; Łasica, W.; Kadela, M. Influence of Polypropylene, Glass and Steel Fiber on the Thermal Properties of Concrete. Materials 2021, 14, 1888. [Google Scholar] [CrossRef]
  9. Małek, M.; Jackowski, M.; Łasica, W.; Kadela, M.; Wachowski, M. Mechanical and Material Properties of Mortar Reinforced with Glass Fiber: An Experimental Study. Materials 2021, 14, 698. [Google Scholar] [CrossRef]
  10. Mohajerani, A.; Vajna, J.; Cheung, T.H.H.; Kurmus, H.; Arulrajah, A.; Horpibulsuk, S. Practical Recycling Applications of Crushed Waste Glass in Construction Materials: A Review. Constr. Build. Mater. 2017, 156, 443–467. [Google Scholar] [CrossRef]
  11. Wright, J.R.; Cartwright, C.; Fura, D.; Rajabipour, F. Fresh and Hardened Properties of Concrete Incorporating Recycled Glass as 100% Sand Replacement. J. Mater. Civ. Eng. 2014, 26, 04014073. [Google Scholar] [CrossRef]
  12. Yousefi, A.; Tang, W.; Khavarian, M.; Fang, C.; Wang, S. Thermal and Mechanical Properties of Cement Mortar Composite Containing Recycled Expanded Glass Aggregate and Nano Titanium Dioxide. Appl. Sci. 2020, 10, 2246. [Google Scholar] [CrossRef] [Green Version]
  13. Shi, C.; Zheng, K. A Review on the Use of Waste Glasses in the Production of Cement and Concrete. Resour. Conserv. Recycl. 2007, 52, 234–247. [Google Scholar] [CrossRef]
  14. Elaqra, H.A.; Al-Afghany, M.J.; Abo-Hasseira, A.B.; Elmasry, I.H.; Tabasi, A.M.; Alwan, M.D. Effect of Immersion Time of Glass Powder on Mechanical Properties of Concrete Contained Glass Powder as Cement Replacement. Constr. Build. Mater. 2019, 206, 674–682. [Google Scholar] [CrossRef]
  15. Khan, Q.S.; Sheikh, M.N.; McCarthy, T.J.; Robati, M.; Allen, M. Experimental Investigation on Foam Concrete without and with Recycled Glass Powder: A Sustainable Solution for Future Construction. Constr. Build. Mater. 2019, 201, 369–379. [Google Scholar] [CrossRef]
  16. Elaqra, H.; Rustom, R. Effect of Using Glass Powder as Cement Replacement on Rheological and Mechanical Properties of Cement Paste. Constr. Build. Mater. 2018, 179, 326–335. [Google Scholar] [CrossRef]
  17. Omran, A.F.; Etienne, D.M.; Harbec, D.; Tagnit-Hamou, A. Long-Term Performance of Glass-Powder Concrete in Large-Scale Field Applications. Constr. Build. Mater. 2017, 135, 43–58. [Google Scholar] [CrossRef]
  18. Du, H.; Tan, K.H. Properties of High Volume Glass Powder Concrete. Cem. Concr. Compos. 2017, 75, 22–29. [Google Scholar] [CrossRef]
  19. Soliman, N.A.; Tagnit-Hamou, A. Development of Ultra-High-Performance Concrete Using Glass Powder—Towards Ecofriendly Concrete. Constr. Build. Mater. 2016, 125, 600–612. [Google Scholar] [CrossRef]
  20. Arabi, N.; Meftah, H.; Amara, H.; Kebaïli, O.; Berredjem, L. Valorization of Recycled Materials in Development of Self-Compacting Concrete: Mixing Recycled Concrete Aggregates—Windshield Waste Glass Aggregates. Constr. Build. Mater. 2019, 209, 364–376. [Google Scholar] [CrossRef]
  21. Bisht, K.; Ramana, P.V. Sustainable Production of Concrete Containing Discarded Beverage Glass as Fine Aggregate. Constr. Build. Mater. 2018, 177, 116–124. [Google Scholar] [CrossRef]
  22. Hendi, A.; Mostofinejad, D.; Sedaghatdoost, A.; Zohrabi, M.; Naeimi, N.; Tavakolinia, A. Mix Design of the Green Self-Consolidating Concrete: Incorporating the Waste Glass Powder. Constr. Build. Mater. 2018, 199, 369–384. [Google Scholar] [CrossRef]
  23. Rashid, K.; Hameed, R.; Ahmad, H.A.; Razzaq, A.; Ahmad, M.; Mahmood, A. Analytical Framework for Value Added Utilization of Glass Waste in Concrete: Mechanical and Environmental Performance. Waste Manag. 2018, 79, 312–323. [Google Scholar] [CrossRef] [PubMed]
  24. Fathi, H.; Lameie, T.; Maleki, M.; Yazdani, R. Simultaneous Effects of Fiber and Glass on the Mechanical Properties of Self-Compacting Concrete. Constr. Build. Mater. 2017, 133, 443–449. [Google Scholar] [CrossRef]
  25. Du, H.; Tan, K.H. Waste Glass Powder as Cement Replacement in Concrete. J. Adv. Concr. Technol. 2014, 12, 468–477. [Google Scholar] [CrossRef] [Green Version]
  26. Zeybek, Ö.; Özkılıç, Y.O.; Karalar, M.; Çelik, A.İ.; Qaidi, S.; Ahmad, J.; Burduhos-Nergis, D.D.; Burduhos-Nergis, D.P. Influence of Replacing Cement with Waste Glass on Mechanical Properties of Concrete. Materials 2022, 15, 7513. [Google Scholar] [CrossRef] [PubMed]
  27. Qaidi, S.; Najm, H.M.; Abed, S.M.; Özkılıç, Y.O.; Al Dughaishi, H.; Alosta, M.; Sabri, M.M.S.; Alkhatib, F.; Milad, A. Concrete Containing Waste Glass as an Environmentally Friendly Aggregate: A Review on Fresh and Mechanical Characteristics. Materials 2022, 15, 6222. [Google Scholar] [CrossRef] [PubMed]
  28. Çelik, A.İ.; Özkılıç, Y.O.; Zeybek, Ö.; Karalar, M.; Qaidi, S.; Ahmad, J.; Burduhos-Nergis, D.D.; Bejinariu, C. Mechanical Behavior of Crushed Waste Glass as Replacement of Aggregates. Materials 2022, 15, 8093. [Google Scholar] [CrossRef] [PubMed]
  29. Guo, S.; Dai, Q.; Sun, X.; Xiao, X. X-ray CT Characterization and Fracture Simulation of ASR Damage of Glass Particles in Alkaline Solution and Mortar. Theor. Appl. Fract. Mech. 2017, 92, 76–88. [Google Scholar] [CrossRef]
  30. Cota, F.P.; Melo, C.C.D.; Panzera, T.H.; Araújo, A.G.; Borges, P.H.R.; Scarpa, F. Mechanical Properties and ASR Evaluation of Concrete Tiles with Waste Glass Aggregate. Sustain. Cities Soc. 2015, 16, 49–56. [Google Scholar] [CrossRef]
  31. Shao, Y.; Lefort, T.; Moras, S.; Rodriguez, D. Studies on Concrete Containing Ground Waste Glass. Cem. Concr. Res. 2000, 30, 91–100. [Google Scholar] [CrossRef]
  32. Sanchez, L.F.M.; Fournier, B.; Jolin, M.; Mitchell, D.; Bastien, J. Overall Assessment of Alkali-Aggregate Reaction (AAR) in Concretes Presenting Different Strengths and Incorporating a Wide Range of Reactive Aggregate Types and Natures. Cem. Concr. Res. 2017, 93, 17–31. [Google Scholar] [CrossRef]
  33. Saccani, A.; Bignozzi, M.C. ASR Expansion Behavior of Recycled Glass Fine Aggregates in Concrete. Cem. Concr. Res. 2010, 40, 531–536. [Google Scholar] [CrossRef]
  34. Gorospe, K.; Booya, E.; Ghaednia, H.; Das, S. Effect of Various Glass Aggregates on the Shrinkage and Expansion of Cement Mortar. Constr. Build. Mater. 2019, 210, 301–311. [Google Scholar] [CrossRef]
  35. Ling, T.C.; Poon, C.S. A Comparative Study on the Feasible Use of Recycled Beverage and CRT Funnel Glass as Fine Aggregate in Cement Mortar. J. Clean. Prod. 2012, 29–30, 46–52. [Google Scholar] [CrossRef]
  36. Yu, X.; Tao, Z.; Song, T.Y. Effect of Different Types of Aggregates on the Performance of Concrete-Filled Steel Tubular Stub Columns. Mater. Struct. 2015, 49, 3591–3605. [Google Scholar] [CrossRef]
  37. Thumrongvut, J.; Seangatith, S.; Siriparinyanan, T.; Wangrakklang, S. An Experimental Behaviour of Cellular Lightweight Concrete-Filled Steel Square Tube Columns under Axial Compression. Mater. Sci. Forum 2016, 860, 121–124. [Google Scholar] [CrossRef]
  38. Han, L.H.; Li, W.; Bjorhovde, R. Developments and Advanced Applications of Concrete-Filled Steel Tubular (CFST) Structures: Members. J. Constr. Steel Res. 2014, 100, 211–228. [Google Scholar] [CrossRef]
  39. Guo, P.; Meng, W.; Nassif, H.; Gou, H.; Bao, Y. New Perspectives on Recycling Waste Glass in Manufacturing Concrete for Sustainable Civil Infrastructure. Constr. Build. Mater. 2020, 257, 119579. [Google Scholar] [CrossRef]
  40. GB/T 50080-2016; Standard for Test Method of Performance on Ordinary Fresh Concrete. China Architecture and Building Press: Beijing, China, 2016.
  41. GB/T 50081-2002; Standard for Test Method of Mechanical Properties on Ordinary Concrete. China Architecture and Building Press: Beijing, China, 2002.
  42. Wang, F.; Young, B.; Gardner, L. Compressive Testing and Numerical Modelling of Concrete-Filled Double Skin CHS with Austenitic Stainless Steel Outer Tubes. Thin-Walled Struct. 2019, 141, 345–359. [Google Scholar] [CrossRef]
  43. Taha, B.; Nounu, G. Utilizing Waste Recycled Glass as Sand/Cement Replacement in Concrete. J. Mater. Civ. Eng. 2009, 21, 709–721. [Google Scholar] [CrossRef]
  44. Aslam, F.; Zaid, O.; Althoey, F.; Alyami, S.H.; Qaidi, S.M.A.; de Prado Gil, J.; Martínez-García, R. Evaluating the Influence of Fly Ash and Waste Glass on the Characteristics of Coconut Fibers Reinforced Concrete. Struct. Concr. 2022. [Google Scholar] [CrossRef]
  45. Ali, E.E.; Al-Tersawy, S.H. Recycled Glass as a Partial Replacement for Fine Aggregate in Self Compacting Concrete. Constr. Build. Mater. 2012, 35, 785–791. [Google Scholar] [CrossRef]
  46. Terro, M.J. Properties of Concrete Made with Recycled Crushed Glass at Elevated Temperatures. Build. Environ. 2006, 41, 633–639. [Google Scholar] [CrossRef]
  47. Tan, K.H.; Du, H. Use of Waste Glass as Sand in Mortar: Part I—Fresh, Mechanical and Durability Properties. Cem. Concr. Compos. 2013, 35, 109–117. [Google Scholar] [CrossRef]
  48. De Castro, S.; De Brito, J. Evaluation of the Durability of Concrete Made with Crushed Glass Aggregates. J. Clean. Prod. 2012, 41, 7–14. [Google Scholar] [CrossRef]
  49. Shi, C.; Wu, Y.; Riefler, C.; Wang, H. Characteristics and Pozzolanic Reactivity of Glass Powders. Cem. Concr. Res. 2005, 35, 987–993. [Google Scholar] [CrossRef]
  50. Ma, D.Y.; Han, L.H.; Zhao, X.L. Seismic Performance of the Concrete-Encased CFST Column to RC Beam Joint: Experiment. J. Constr. Steel Res. 2018, 154, 134–148. [Google Scholar] [CrossRef]
  51. Xue, J.Q.; Briseghella, B.; Chen, B.C. Effects of Debonding on Circular CFST Stub Columns. J. Constr. Steel Res. 2012, 69, 64–76. [Google Scholar] [CrossRef]
  52. ANSI/AISC 360-16; Specification for Structural Steel Buildings. American Institute of Steel Construction: Chicago, IL, USA, 2016.
  53. EN 1994-1-1; Eurocode 4: Design of Composite Steel and Concrete Structures—Part 1.1: General Rules and Rules for Buildings. European Committee for Standardization: Brussels, Belgium, 2004.
  54. GB 50936-2014; Technical Code for Concrete Filled Steel Tubular Structures. China Architecture and Building Press: Beijing, China, 2014.
Figure 1. Glass particles: (a) glass powder; (b) glass beads.
Processes 11 00975 g001
Figure 2. Particle size distribution of natural sand and glass beads.
Processes 11 00975 g002
Figure 3. Flowability measurement: (a) slump; (b) slump flow.
Processes 11 00975 g003
Figure 4. Compressive strength test: (a) cubes; (b) prisms.
Processes 11 00975 g004
Figure 5. Measurement layout (front view).
Processes 11 00975 g005
Figure 6. CFST testing under compressive loading: (a) experimental setup; (b) strain gauges (enlarged).
Processes 11 00975 g006
Figure 7. Slump and slump flow for different mixtures: (a) slump and slump flow values; (b) relationship between slump and slump flow.
Processes 11 00975 g007
Figure 8. Compressive strength of different mixtures.
Processes 11 00975 g008
Figure 9. Failure modes of the GCFST-10 specimen under axial compression: (a) surface damage; (b) fracture inside the specimen.
Processes 11 00975 g009
Figure 10. Load–deformation response for all specimens: (a) OCFST specimens; (b) GCFST-10 specimens; (c) GCFST-15 specimens; (d) GCFST-20 specimens; (e) GCFST-30 specimens; (f) comparison of average load–deformation response for different specimens.
Processes 11 00975 g010aProcesses 11 00975 g010b
Figure 11. Load–strain (both axial and lateral strain) relationship for tubular specimens with different concrete mixtures: (a) load–strain response during the whole loading process; (b) load–strain response prior to the yield strain of the steel (enlarged view of the selected region shown in (a)).
Processes 11 00975 g011
Figure 12. Test results vs code prediction of the ultimate strength of CFSTs.
Processes 11 00975 g012
Table 1. Mix proportions of OC and GC (kg/m3).
Mix IDReplacement RatioCementWaterNatural SandAggregateGlass PowderGlass BeadsSuperplasticizer
OC04501656801105001.29
GC1010405165612110545681.29
GC15153831655781105681021.29
GC20203601655441105901361.29
GC303031516547611051352041.29
Table 2. Details of column specimens.
Specimen IDNumber of SpecimensGlass Replacement Ratio (%)Dimension of Steel Tube
L × D × t   ( m m 3 )
Dimension of Concrete Core
L × d   ( m m 3 )
OCFST30400 × 133 × 4.75400 × 123.5
GCFST-10310400 × 133 × 4.75400 × 123.5
GCFST-15315400 × 133 × 4.75400 × 123.5
GCFST-20320400 × 133 × 4.75400 × 123.5
GCFST-30330400 × 133 × 4.75400 × 123.5
Notes: L, D, and t represent the length, outer diameter, and thickness of the steel tube, while d represents the diameter of the concrete core.
Table 3. Summary of the test results.
Specimen ID Peak   Load   F u (kN) Residual Bearing Capacity   F r e (kN) Deflection at Peak Load Δp (mm)Ultimate Deflection at the Failure of Specimen Δu (mm) Ductility Coefficient ( ξ = Δ u Δ p ) Confining Factor ( θ = A s f y A c f c )
OCFST1398.81301.717.939.62.22.096
GCFST-101376.61343.322.939.01.72.059
GCFST-151325.01318.123.134.61.52.288
GCFST-201260.21228.722.335.61.62.990
GCFST-301297.31277.226.936.11.33.017
Notes: A s , A c , f y , and f c represent the sectional area of the steel tube, sectional area of the concrete, yield strength of the steel, and compressive strength of the concrete prism, respectively.
Table 4. Comparison of test results and code predictions.
TestAISCEC4GB50936-2014
F u ( kN ) P A I S C ( kN ) P E C 4 ( kN ) P G B 50936 2014 ( kN )
Equation--For compact circular CFST: P A I S C = P n o [ 0.658 P n o P e ]   , when   P n o P e 2.25 ; P n o = A s f y + 0.95 f c A c ; P e = π 2 ( E I ) e L 2 ; ( E I ) e = E s I s + C 3 E c I c ; C 3 = 0.6 + 2 [ A s A s + A c ] 0.9 For circular CFST: P E C 4 = η a A s f y + A c f c ( 1 + η c t D f y f c ) ; η a = 0.25 ( 3 + 2 λ ) 1.0 ; η c = 4.9 18.5 λ + 17 λ 2 0 ; λ = N p l , R d N c r ; N p l , R d = A s f y + A c f c ; N c r = π 2 ( E I ) e L 2 ; ( E I ) e = E s I s + 0.6 E c I c ; E c = 22000 ( f c + 8 10 ) 0.3 For circular CFST: N G B 50936 2014 = ( 1.212 + B θ + C θ 2 ) f c A s c ; B = 0.176 f y / 213 + 0.974 ; C = 0.104 f c / 14.4 + 0.031 ; θ = A s f y A c f c
OCFST1398.8934.31250.41129.6
GCFST-101376.6938.81254.71136.6
GCFST-151325.0909.51226.61097.7
GCFST-201260.2847.61167.31020.8
GCFST-301297.3845.31165.11018.7
Notes: P A I S C , P E C 4 , and P G B 50936 2014 represent the ultimate strength prediction from AISC, EC4, and GB50936-2014, respectively. For AISC prediction, P n o and P e are the nominal capacity and the plastic resistance of the column cross section, respectively; ( E I ) e , E s , E c , I s , and I c denote the effective stiffness of the composite cross section, elastic modulus of the steel and the concrete, and moment of inertia of the steel tube and the concrete, respectively. For EC4 prediction, η a , η c , λ , N p l , R d , and N c r are the reduction factor for steel, enhancement factor for concrete, relative slenderness of the column, plastic resistance, and critical buckling load of the column, respectively. For GB50936-2014 prediction, B and C are coefficients considering the contribution from steel and concrete, respectively; A s c and θ represent the total cross sectional area and confinement factor, considering the confining effect from the outer steel tube, respectively.
Disclaimer/Publisher’s Note: The statements, opinions and data contained in all publications are solely those of the individual author(s) and contributor(s) and not of MDPI and/or the editor(s). MDPI and/or the editor(s) disclaim responsibility for any injury to people or property resulting from any ideas, methods, instructions or products referred to in the content.