
Numerical Investigation of Air Flow in Goaf While Mapping Its Flow Parameters

Strata Mechanics Research Institute of The Polish Sciences Academy, Reymonta 27, 30-059 Kraków, Poland
Processes 2023, 11(4), 987; https://doi.org/10.3390/pr11040987
Submission received: 15 February 2023
/
Revised: 20 March 2023
/
Accepted: 21 March 2023
/
Published: 24 March 2023
(This article belongs to the Special Issue Simulation, Measurements, and Analysis of Mass and Energy Transport in HVAC Systems)
Abstract
:Recent work has presented a numerical model of a longwall ventilated by a U-system, considering the real shape of an adjacent goaf in addition to parameters characterizing the distribution of porosity and permeability. Analogous distributions are used in the two-dimensional model implemented in VentZroby software. A comparison of the results of the three-dimensional flow calculations with the two-dimensional calculations can be used to verify the simpler description and evaluate the impact of simplifications on the simulation results. Air flow calculations were carried out using the selected turbulence model. The obtained results present the possibility of conducting extensive numerical calculations for flow problems in underground mines, considering more precise descriptions and the interpretation of the calculation results carried out using a simpler description.
1. Introduction
The correct performance of a numerical simulation is primarily associated with the appropriate representation of the tested model [1,2,3,4] and the consideration of all parameters that may affect the results of the simulation [5,6]. When carrying out numerical studies on flow phenomena occurring in vicinity of a longwall with a goaf, it is crucial to specify the appropriate parameters that characterize the properties of the goaf. Knowledge of these parameters determines the adequacy of the obtained simulation results with respect to the real situation.
Roof rocks collapse as a result of the mining progress, which create empty volumes located between the rubble. The roof rocks exert pressure on the rubble, sealing it. Therefore, the loose arrangement of the caving rocks tightens as the distance from the wall front increases. As a result, porosity and permeability are not constant throughout the goaf area. The highest values of porosity and permeability in a goaf are in the vicinity of the longwall caving line, and they decrease along the longwall extension.
If the rock mass in which the exploitation is carried out contains methane, it is also present in the goaf and migrates towards the longwall workings. The air and methane mixture poses an explosive hazard; therefore, various methods of preventing the risk are used during exploitation. In their development, computer simulations of methane migration in goafs and longwalls are used, among others [7]. The VentZroby software was developed for the purposes of such simulations. It is a variation of the flow simulator in ventilation networks and is based on a one-dimensional approximation, (Figure 1). The VentZroby model takes into account the variable height of the goaf, porosity, and permeability, according to data from the literature. The goaf is divided into rectangular volumes with variable properties in which the flow is treated as a specific variant of the two-dimensional description. The flow area is replaced with a grid of perpendicular branches that represents the flow in the corresponding directions. The lengths, cross-sections and resistances of these branches are calculated using the formulas presented in [8].
The significance of this article is to provide relevant knowledge regarding the correctness of conducting numerical calculations for mining ventilation issues. One of the stages of this work is to demonstrate the influence of implementing the function of porosity and permeability distribution in the excavations on the obtained results of the calculations.
The paper presents the results of work aimed at comparing the simplified model used in the VentZroby software with the three-dimensional flow model. The calculations were carried out using the finite volume method implemented in Ansys Fluent 2021 R2, Ansys Inc., Canonsburg, USA. Using the new capabilities in Ansys Fluent, it was possible to reflect the changes in porosity and permeability parameters in a goaf as a function of the distance from the longwall front using the Expressions function [10].
2. Numerical Research
2.1. Geometry of Numerical Model
The geometry model took into account the presence of a longwall, maingate and tailgate (Figure 2). Since the purpose of the numerical research was not to study the flow phenomena in this part of numerical model, these parts of the model were presented as a straight section with a rectangular cross-section (Table 1).
2.2. Computational Grid
The authors decided to use mesh with different sizes of cells due to the areas with laminar flow (goaf) and turbulent flow (mine drifts). The entire process of imposing a computational grid using the size function was widely described in [10].
In the area with turbulent flow, the size of the 4 mesh was from 7.0 cm to 20 cm, with a growth rate of 1.2. On the other hand, in the area with laminar flow, the size of the mesh was from 50.0 cm to 200 cm, with a growth rate of 1.2. In the first step, the non-structural tetrahedral mesh was applied. In turn, this was converted in the Ansys Fluent software into a polyhedral mesh consisting of approximately 5 million cells (Figure 4).
2.3. Boundary Conditions
A developed velocity profile with an average velocity of 1.0 m/s, generated during initial calculations on a straight geometry model of a mine drift, was set as a main boundary condition. The velocity profile provided 75,240 m3/h of fresh air inflow to the model.
The outlet was defined as outflow, corresponding to the outflow model in which it does not define the velocity or pressure conditions [12]. The floor, arches, longwall face and sheerer were defined as wall surfaces. Inequalities in the floor in the model were treated as roughness with a height of 0.05 m and, in the case of arches, rails and pipelines, a roughness with a height of 0.001 m [13,14].
Part of the numerical model, the goaf, was defined as a porous media with a variable porosity, determined using the approximation functions presented in the monograph [8]. Changes in porosity in the surface perpendicular to the coal face are represented by the function:
where —goaf coordinate in the x-axis direction;
—goaf maximum height coordinate;
—goaf’s porosity at a distance ;
—porosity in the sealed goaf zone.
The coefficient is determined by the formula:
where —intermediate goaf porosity at a distance ;
—distance from the longwall fall line in the goaf: the beginning of the sealed zone.
Porosity distribution changes in the surface parallel to the coal face are presented in the form:
where —longwall length;
—goaf coordinate in the y-axis direction.
The ay coefficient determines the shape variable of Function (3):
where —time constant of the ay function;
—initial value that fulfills the conditions
Based on the literature [15], it was assumed:
;
—porosity at the beginning of the goaf, for ;
—porosity at distance from the longwall fall line;
—porosity in the sealed goaf zone.
The porosity distribution in the goaf is the product of Functions (1) and (3):
where –coefficient that scales the value of the porosity distribution correction.
Using the Formula (5) and assuming that , the distribution of porosity in the goaf was determined and is shown in Figure 5.
Permeability changes in the surface perpendicular to the coal face are represented by the function:
where —goaf permeability at a distance ;
—permeability in the sealed goaf zone;
—have the same meaning as before.
The coefficient is determined by the formula:
where —intermediate goaf permeability at a distance ;
—has the same meaning as before.
Permeability distribution changes in the surface parallel to the coal face are presented in the form:
where —have the same meaning as before.
Based on the literature [15], it was assumed:
;
—the permeability at the beginning of goafs for ;
—permeability at a distance from the longwall fall line;
—permeability in the sealed goaf zone;
The permeability distribution in the goafs presents the product of Functions (6) and (8):
where has the same meaning as before.
Using Formula (9) and assuming that , the distribution of permeability in the goaf was determined and is shown in Figure 6.
In order to assess to what extent the variability in the properties of the goaf affects the image of the flow in the goaf, calculations were also carried out assuming constant parameters:
—the porosity;
—the permeability.
In order to be able to present the differences in the air flow velocities in the goaf for the model with constant variable parameters of porosity and permeability, three measurement lines running parallel to the longwall, LP1, LP2, LP3, were defined (Figure 7). All three lines were located at half the longwall’s height (1.45 m). The LP1 line was located 8 m after the inlet to the longwall, the LP2 line was located in the middle of the longwall (44.0 m), and the LP3 line was located 8 m before the outflow of the longwall.
Due to the size of the mode and the set flow parameters in goaf, the k-e model, which is a baseline two-transport-equation model that solves for kinetic energy k and the turbulent dissipation e was chosen. The k-e turbulence model, chosen for numerical calculations, guaranteed that the correct results were obtained in the shortest calculation time which, given the complexity and size of the tested model, was the key criterion for selecting the appropriate turbulence model. Overall, the k-e model is a good choice for numerical calculations that involve complex flows with significant separation or swirling motion, as well as flows with adverse pressure gradients.
Calculations were carried out for a transient state with a time step of 0.1 s.
2.4. Numerical Calculations
In earlier years, due to the lack of availability of high-performance computers, numerical calculations on such complex models required a significant amount of time. To obtain calculation results for a large geometric model with a detailed numerical mesh, it takes approximately 1300 h of computation on a typical computing unit with a dual-core 3.4 GHz processor and 128 GB of RAM. Presently, there is the possibility of using supercomputers, which significantly reduce the time required for complex numerical calculations. The calculations presented in the article were performed using the ARES supercomputer, which was built from computing servers with Intel processors (Xeon Platinum model) divided into three groups:
- A total of 532 servers equipped with 192 GB of RAM each;
- A total of 256 servers with 384 GB of RAM each;
- A total of 9 servers with 8 NVIDIA Tesla V100 cards each.
The theoretical performance of the CPU part is over 3.5 PFlops, and the theoretical performance of the GPU part is over 500 TFlops. The supercomputer has 37,824 computing cores and 147.7 TB of RAM.
The use of the ARES supercomputer allowed for a reduction of the computation time for the presented results by approximately 70%, providing new knowledge on the impact of including variable flow conditions in goafs.
2.5. Results of Air Flow Numerical Simulation in the Area of the Longwall and Goafs
The presented numerical calculation results are an average of 500 s of calculations from the moment of air flow fluctuation stabilization in mine drifts and the goaf.
During the analysis of the presented velocity contours, changes in the air flow distribution velocity behind 50 m of the goaf length should be noticed. In the model with variable porosity and permeability parameters, the air flow decreased much faster compared to the model with constant parameters for entire area of the goaf. The lowest observed velocities in the model with variable parameters should be observed at 100 m of goaf length along the entire longwall length, reaching a value of 3.4 × 10⁻⁷ m/s (Figure 8). In the case of a model with constant parameters, the smallest velocities are also located at 100 m of goaf length. Not over the entire longwall length, but between 0–10 m and 60–88 m of a longwall, the air flow velocities reach 4.0 × 10⁻⁶ m/s (Figure 9). The analysis of the velocity contours in the vicinity of the longwall fall line showed slight differences in the air flow velocity between the two models.
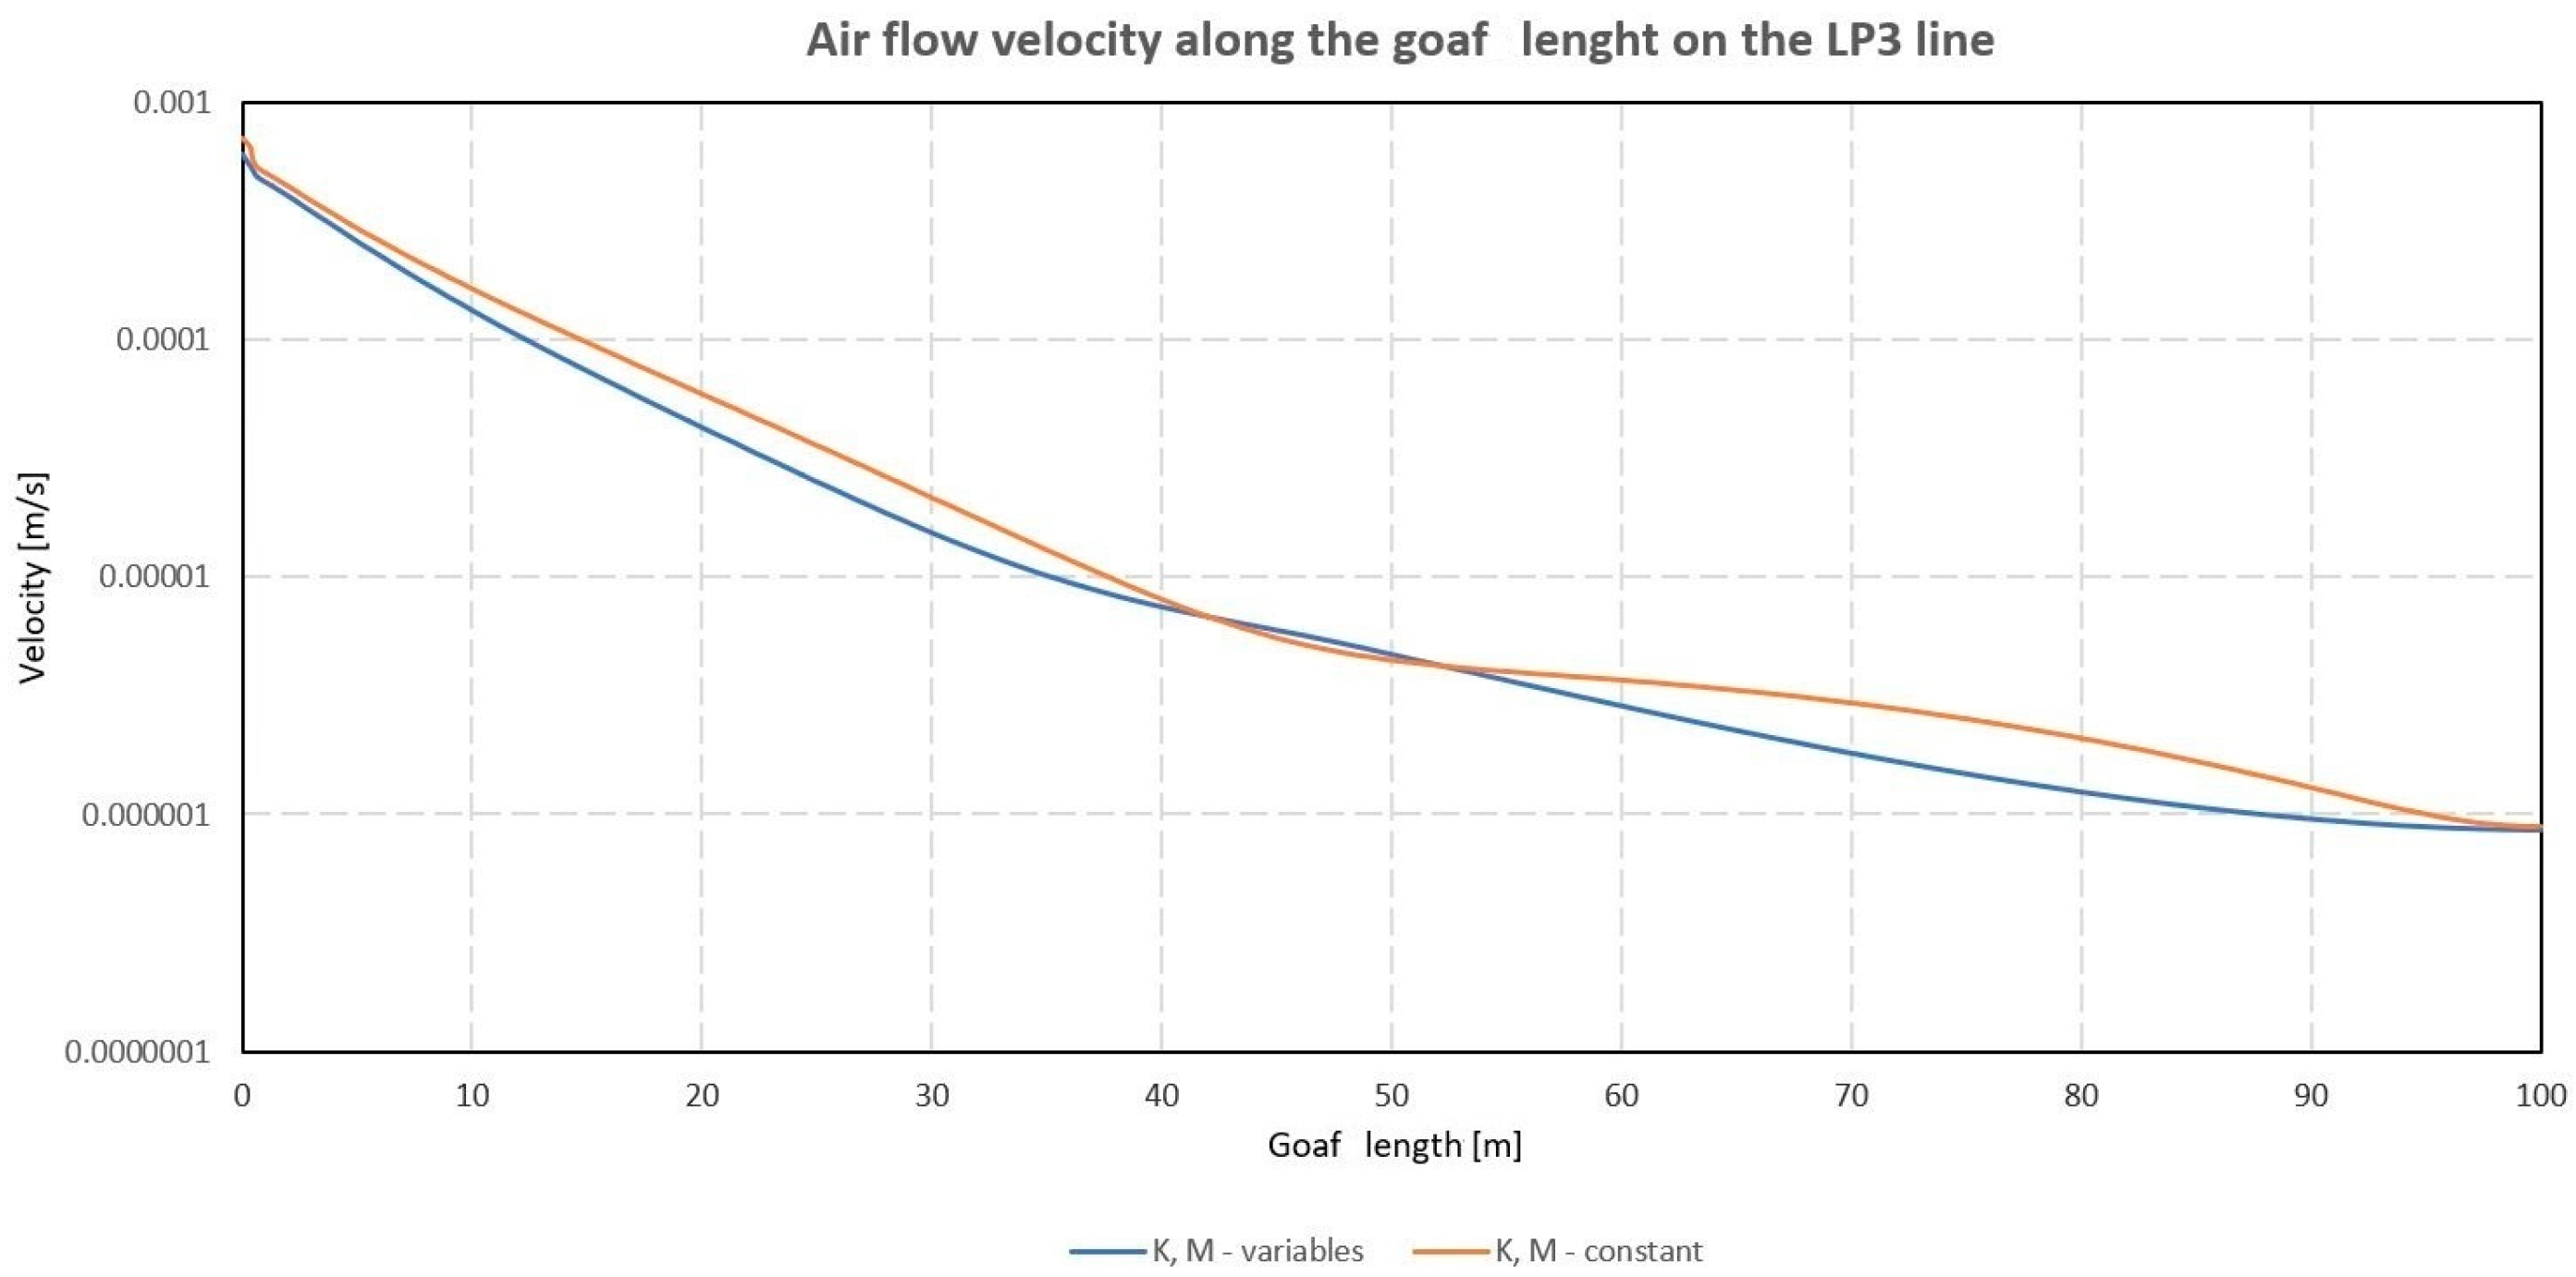
On the following logarithmic scale graphs, the 500 s averaged airflow velocity along the goaf length on lines LP1, LP2 and LP3 for models with constant and variable values of porosity and permeability are presented (Figure 10). Analyzing the porosity and permeability function, it should be noted that their constant value is observed within a distance of 50 m from the goaf length, followed by a sharp decrease according to the assumptions presented in Section 2.3. The recorded airflow velocity in the goaf shows the influence of introducing the function of parameters that characterize the distribution of porosity and permeability in the goaf. Within a distance of 50 m from the goaf length, a uniform decrease in airflow velocity occurs which is identical for both models on the LP1 line. After 50 m, due to a sharp decrease in permeability and porosity, the velocity for the model with variable flow parameters in the goaf decreases faster compared to the model with constant parameters. In the case of the LP2 line drawn halfway through the longwall, the calculation results match up to 20 m from the goaf length, after which the airflow is blocked for the model with constant flow parameters. On the other hand, for the LP3 line along the entire goaf length, there are small differences in airflow velocity for both models, which are related to its location near the liquidated tailgate.
3. Conclusions
This article is a continuation of the research begun in 2020, during which the longwall area was designed with consideration for the longwall equipment and goaf. The results of the work were published in [11].
The presented article is the next stage of work aimed at presenting the possibility of a numerical simulation of the air–methane mixture flow in the vicinity of the longwall, taking into account all elements of geometry and flow parameters occurring in real conditions.
The results of the airflow through the longwall area and goaf numerical calculations were presented. Due to the research concentration on the air flow in the goaf, the designed numerical model reflects the shape of the goaf in accordance with the literature and considers the change parameters of porosity and permeability. The remining elements of the geometric model, such as the scraper conveyor, roof support sheerer and arch yielding support, have been maximally simplified. The authors also decided to present the calculation results for a numerical model that takes into account the constant parameters of porosity and permeability in the entire goaf area.
The results obtained thus far make it possible to assess to what extent the variability of goaf properties affects the air flow in the goaf. The use of the function that adds variability to the porosity and permeability distribution creates significant changes that should not be ignored in this type of numerical research.
The prepared model, together with the obtained numerical calculations, can be compared with calculations on simpler two-dimensional models. Such possibilities are provided by the VentZroby software, which is used to simulate flows in mine ventilation networks, taking into account the interaction between the network of mine drifts and the goafs adjacent to them.
Funding
This paper was financed from the statutory funds of the Strata Mechanics Research Institute of the Polish Sciences Academy in year 2021.
Data Availability Statement
Not applicable.
Acknowledgments
This research was supported in part by PLGrid Infrastructure.
Conflicts of Interest
The author declares no conflict of interest.
References
- Yi, H.; Kim, M.; Lee, D.; Park, J. Applications of Computational Fluid Dynamics for Mine Ventilation in Mineral Development. Energies 2022, 15, 8405. [Google Scholar] [CrossRef]
- Vives, J.; Bascompta, M.; Felipe, J.J.; Sanmiquel, L. Computational Fluid Dynamics (CFD) study to optimize the auxiliary ventilation system in an underground mine. DYNA 2022, 89, 84–91. [Google Scholar] [CrossRef]
- Jiang, W.; Xu, X.; Wen, Z.; Wei, L. Applying the similarity theory to model dust dispersion duringcoal-mine tunneling. Process Saf. Environ. Prot. 2021, 148, 415–427. [Google Scholar] [CrossRef]
- Janus, J. Assessment of the possibilities of using laser scanning for numerical models constructions. Trans. Strat. Mech. Res. Inst. 2015, 17, 1–2. [Google Scholar]
- Skotniczny, P. Three-Dimensional Numerical Simulation of the Mass Exchange Between Longwall Headings and Goafs, in the Presence of Methane Drainage in A U-Type Ventilated Longwall. Arch. Min. Sci. 2013, 58, 3. [Google Scholar]
- Biswal, P.K.; Parida, D.; Mishra, G.; Sahoo, A.K. Study of air flow pattern in mine model gallery and its validation using CFD modelling. World Sci. News 2019, 130, 1–24. [Google Scholar]
- Lolon, S.; Brune, J.F.; Bogin Jr, G.E.; Grubb, J.W.; Juganda, A. Understanding Gob Outgassing Associated with Pressure Disturbances in Longwall Mine. In Proceedings of the 16th North American Mine Ventilation Symposium, Golden, CO, USA, 17–22 July 2017. [Google Scholar]
- Dziurzyński, W. Prognozowanie Procesu Przewietrzania Kopalni Głębinowej w Warunkach Pożaru Podziemnego; Instytut Gospodarki Surowcami Mineralnymi i Energią PAN: Kraków, Poland, 1998. [Google Scholar]
- Janus, J. Air flow modeling in longwall area. Trans. Strat. Mech. Res. Inst. 2020, 22, 1–4. [Google Scholar]
- Ansys Inc. Ansys Fluent Theory Guide; Ansys Inc.: Canonsburg, PA, USA, 2019. [Google Scholar]
- Janus, J. Air flow modeling on the geometry reflecting the actual shape of the longwall area and goafs. Arch. Min. Sci. 2021, 66, 4. [Google Scholar]
- Pokorný, j.; Brumarová, L.; Kučera, P.; Martinka, J.; Thomitzek, A.; Zapletal, P. The effect of Air Flow Rate on Smoke Stratification in Longitudinal Tunnel Ventilation. Acta Montan. Slovaca 2019, 24, 3. [Google Scholar]
- Ren, T.; Balusu, R.; Claassen, C. Computational Fluid Dynamics Modelling of Gas Flow Dynamics in Large Longwall Goaf Areas. In Proceedings of the 35th APCOM Symposium, Wollongong, Australia, 24–30 September 2011. [Google Scholar]
- Wala, M.A.; Vytla, S.; Taylor, C.D.; Huang, G. Mine face ventilation: A comparison of CFD results against benchmark experiments for the CFD code validation. Min. Eng. 2007, 59, 49–55. [Google Scholar]
- Szlązak, J. Wpływ Uszczelniania Chodników Przyścianowych na Przepływ Powietrza Przez Zroby. Ph.D. Thesis, AGH Kraków, Kraków, Poland, 1980. [Google Scholar]
Figure 1.
The diagram of the longwall area with goafs in the VentZroby software, [9].
Figure 1.
The diagram of the longwall area with goafs in the VentZroby software, [9].

Figure 2.
Geometry of numerical model.

Figure 3.
Goaf height distribution—perspective view.

Figure 4.
Computational grid before and after the process of conversion from tetrahedral mesh to polyhedral mesh.
Figure 4.
Computational grid before and after the process of conversion from tetrahedral mesh to polyhedral mesh.
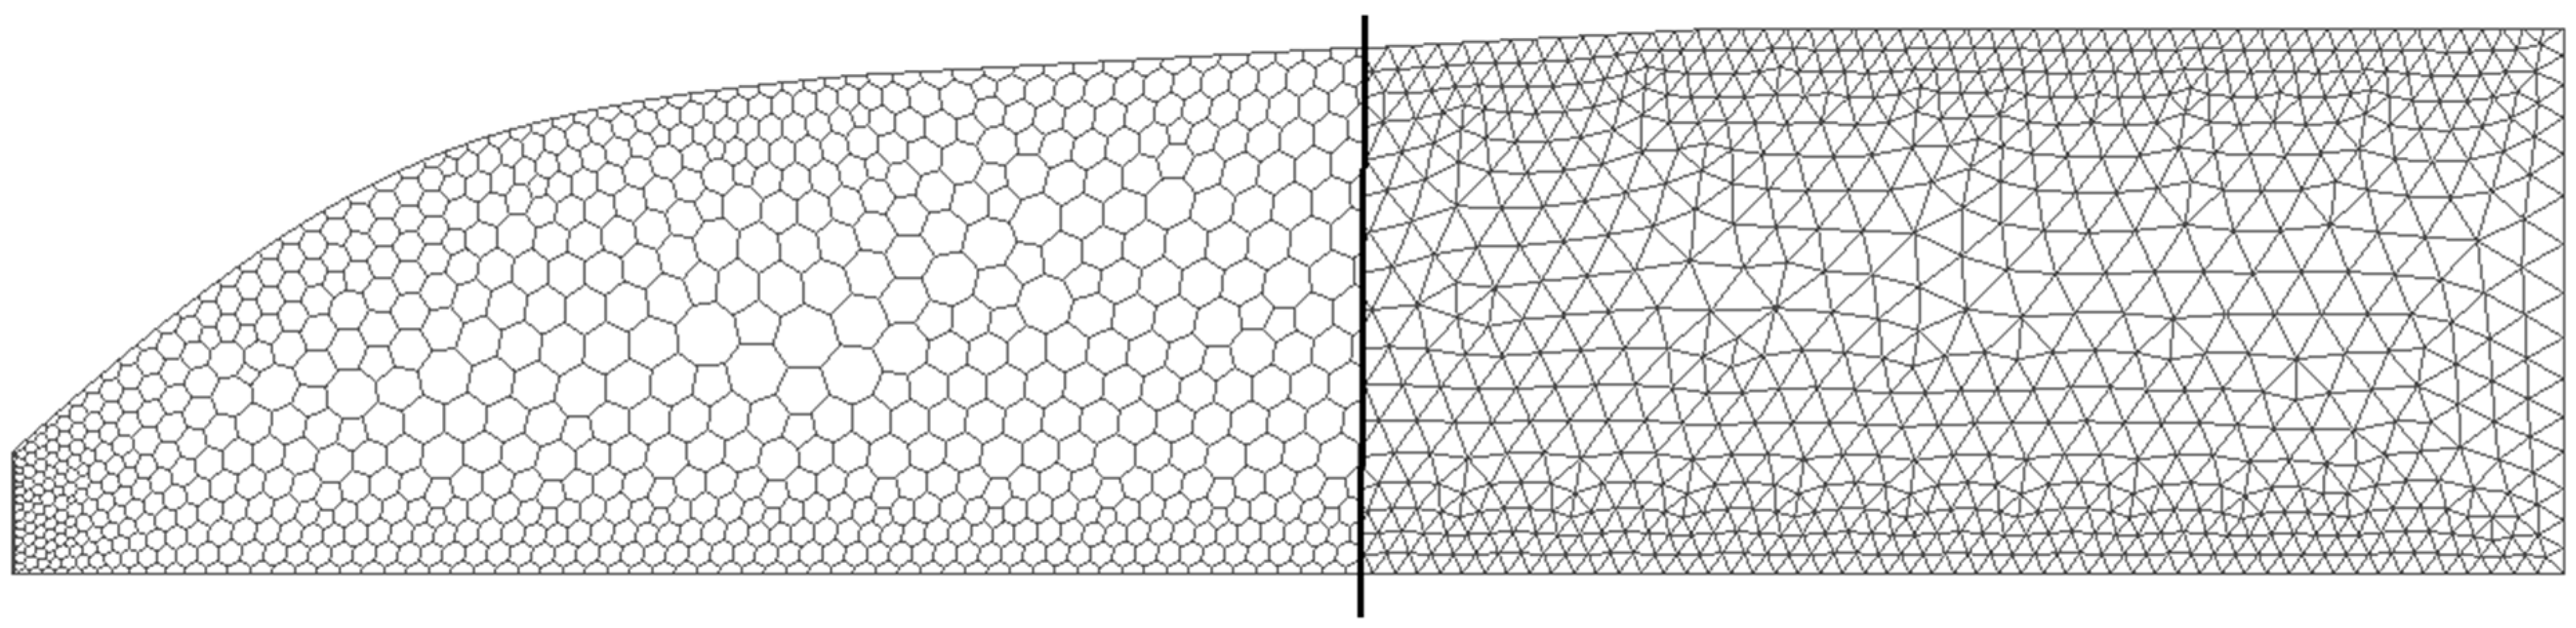
Figure 5.
Porosity distribution—perspective view.

Figure 6.
Permeability distribution—perspective view.
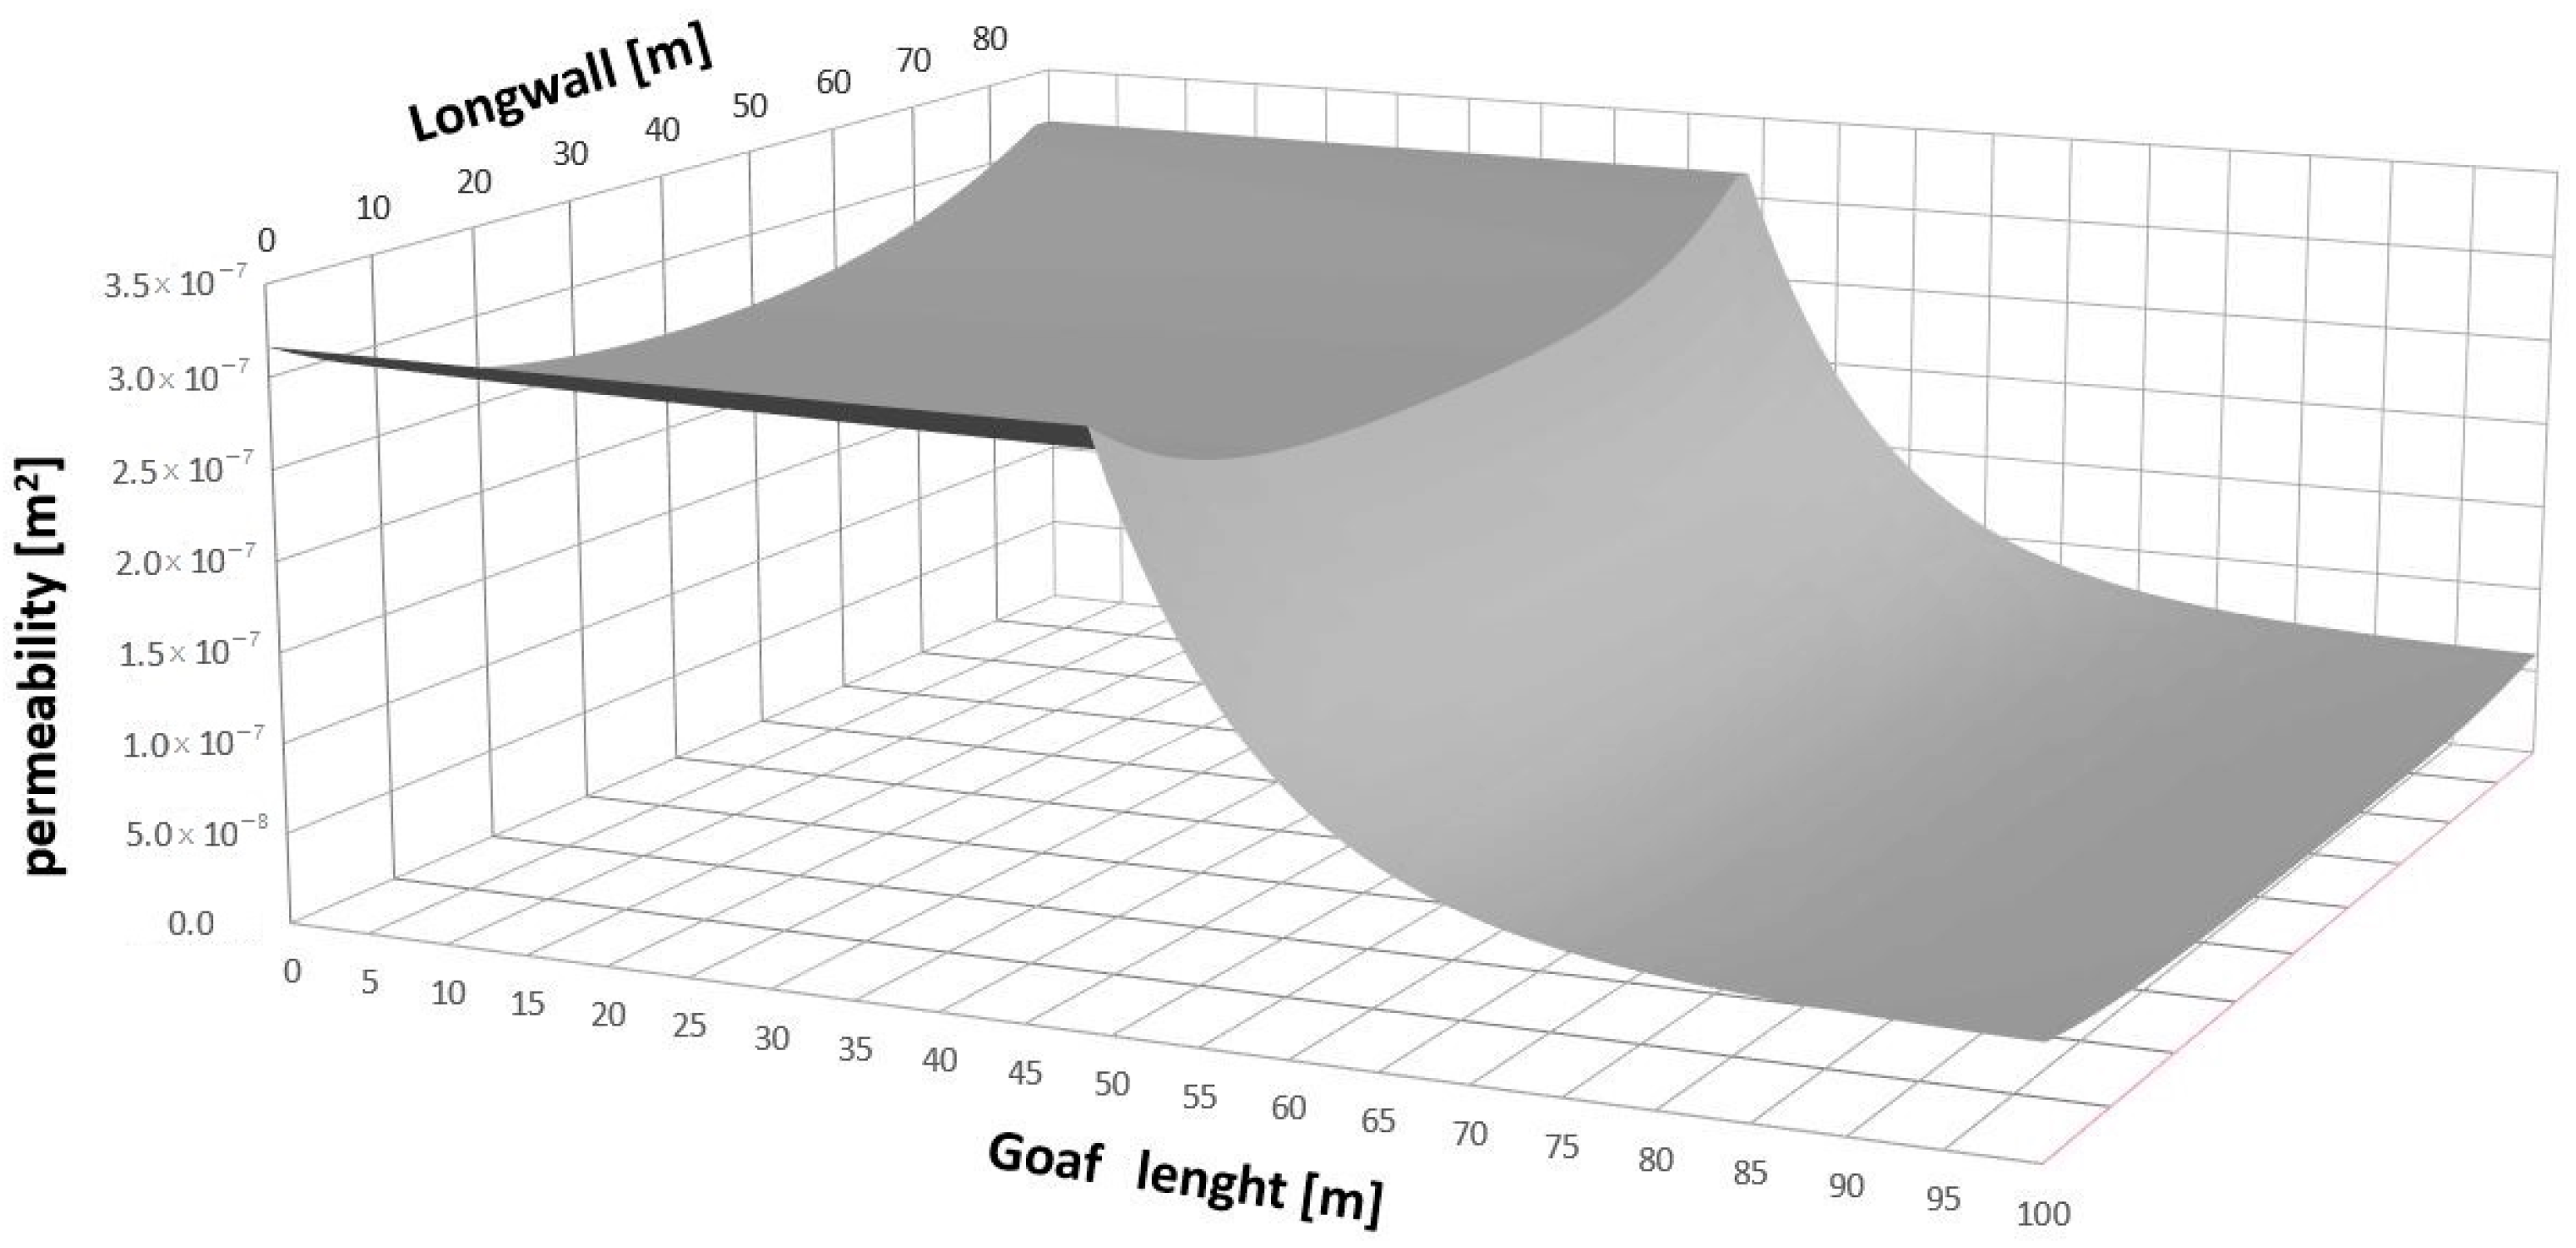
Figure 7.
The location of measuring lines in goaf.
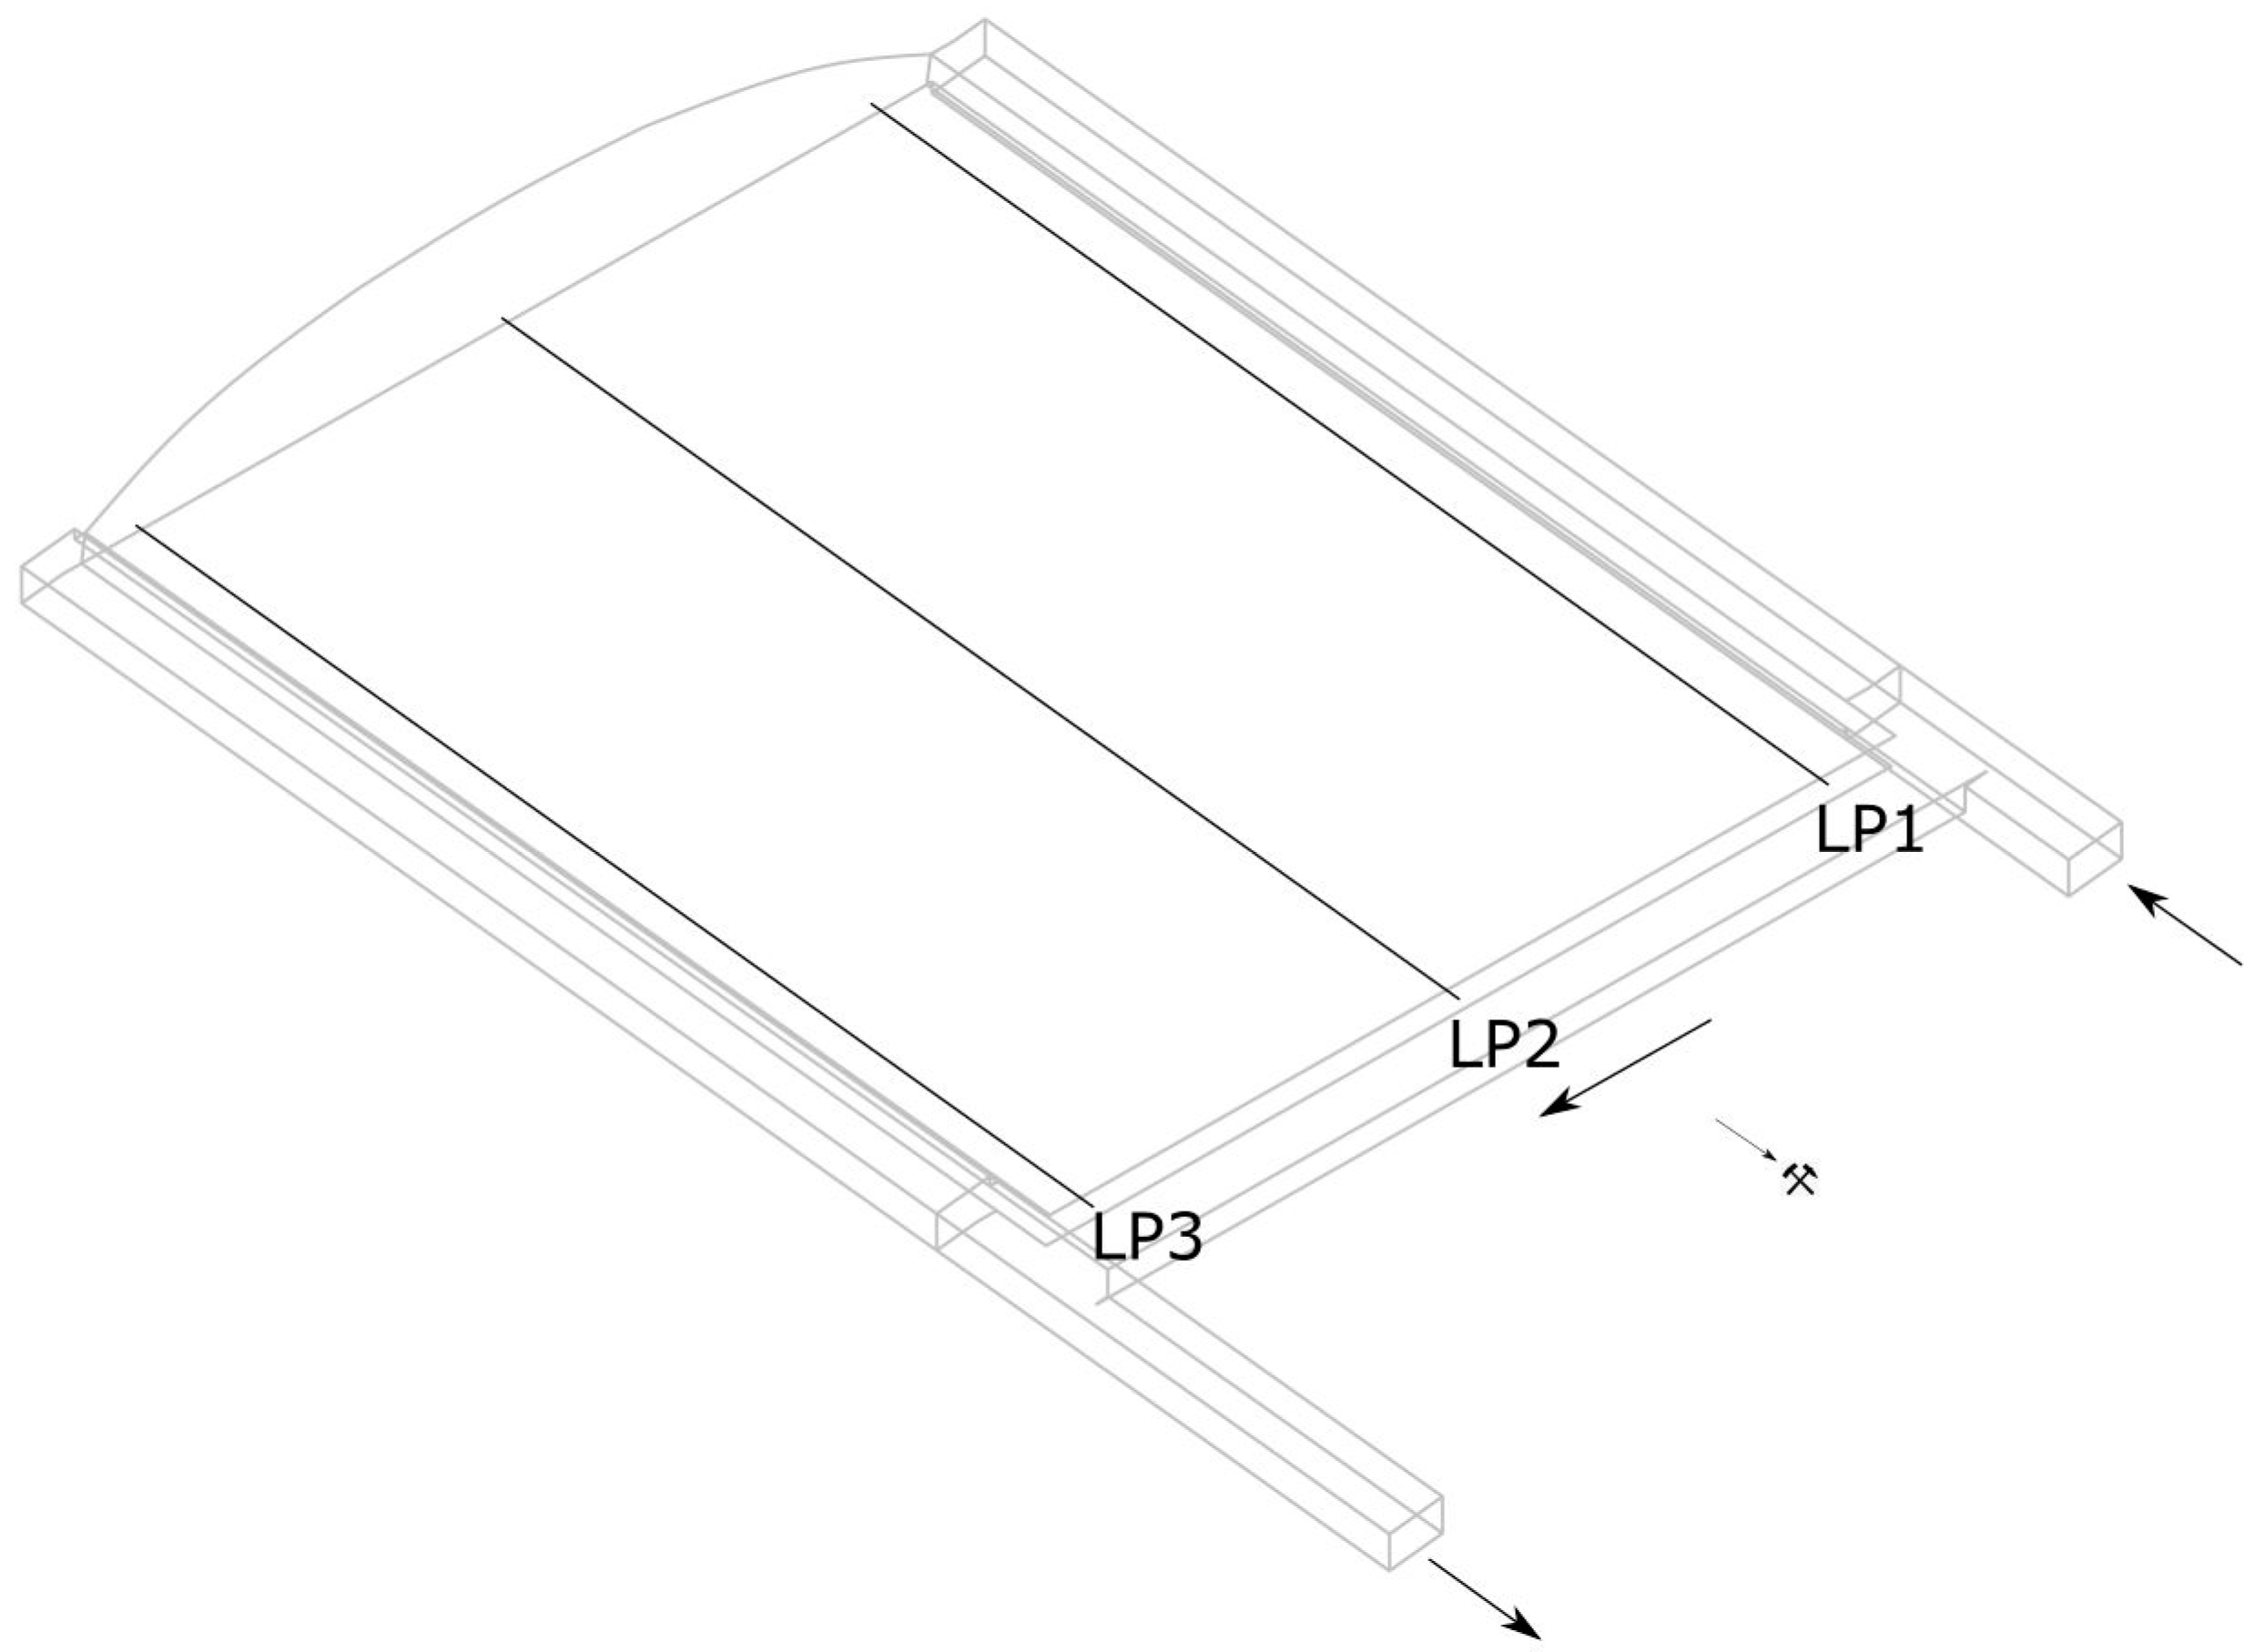
Figure 8.
Velocity contours on a logarithmic scale in the range from 1.0 × 10⁻⁷ m/s to 0.02 m/s for a model with variable parameters of porosity and permeability in the goaf.
Figure 8.
Velocity contours on a logarithmic scale in the range from 1.0 × 10⁻⁷ m/s to 0.02 m/s for a model with variable parameters of porosity and permeability in the goaf.
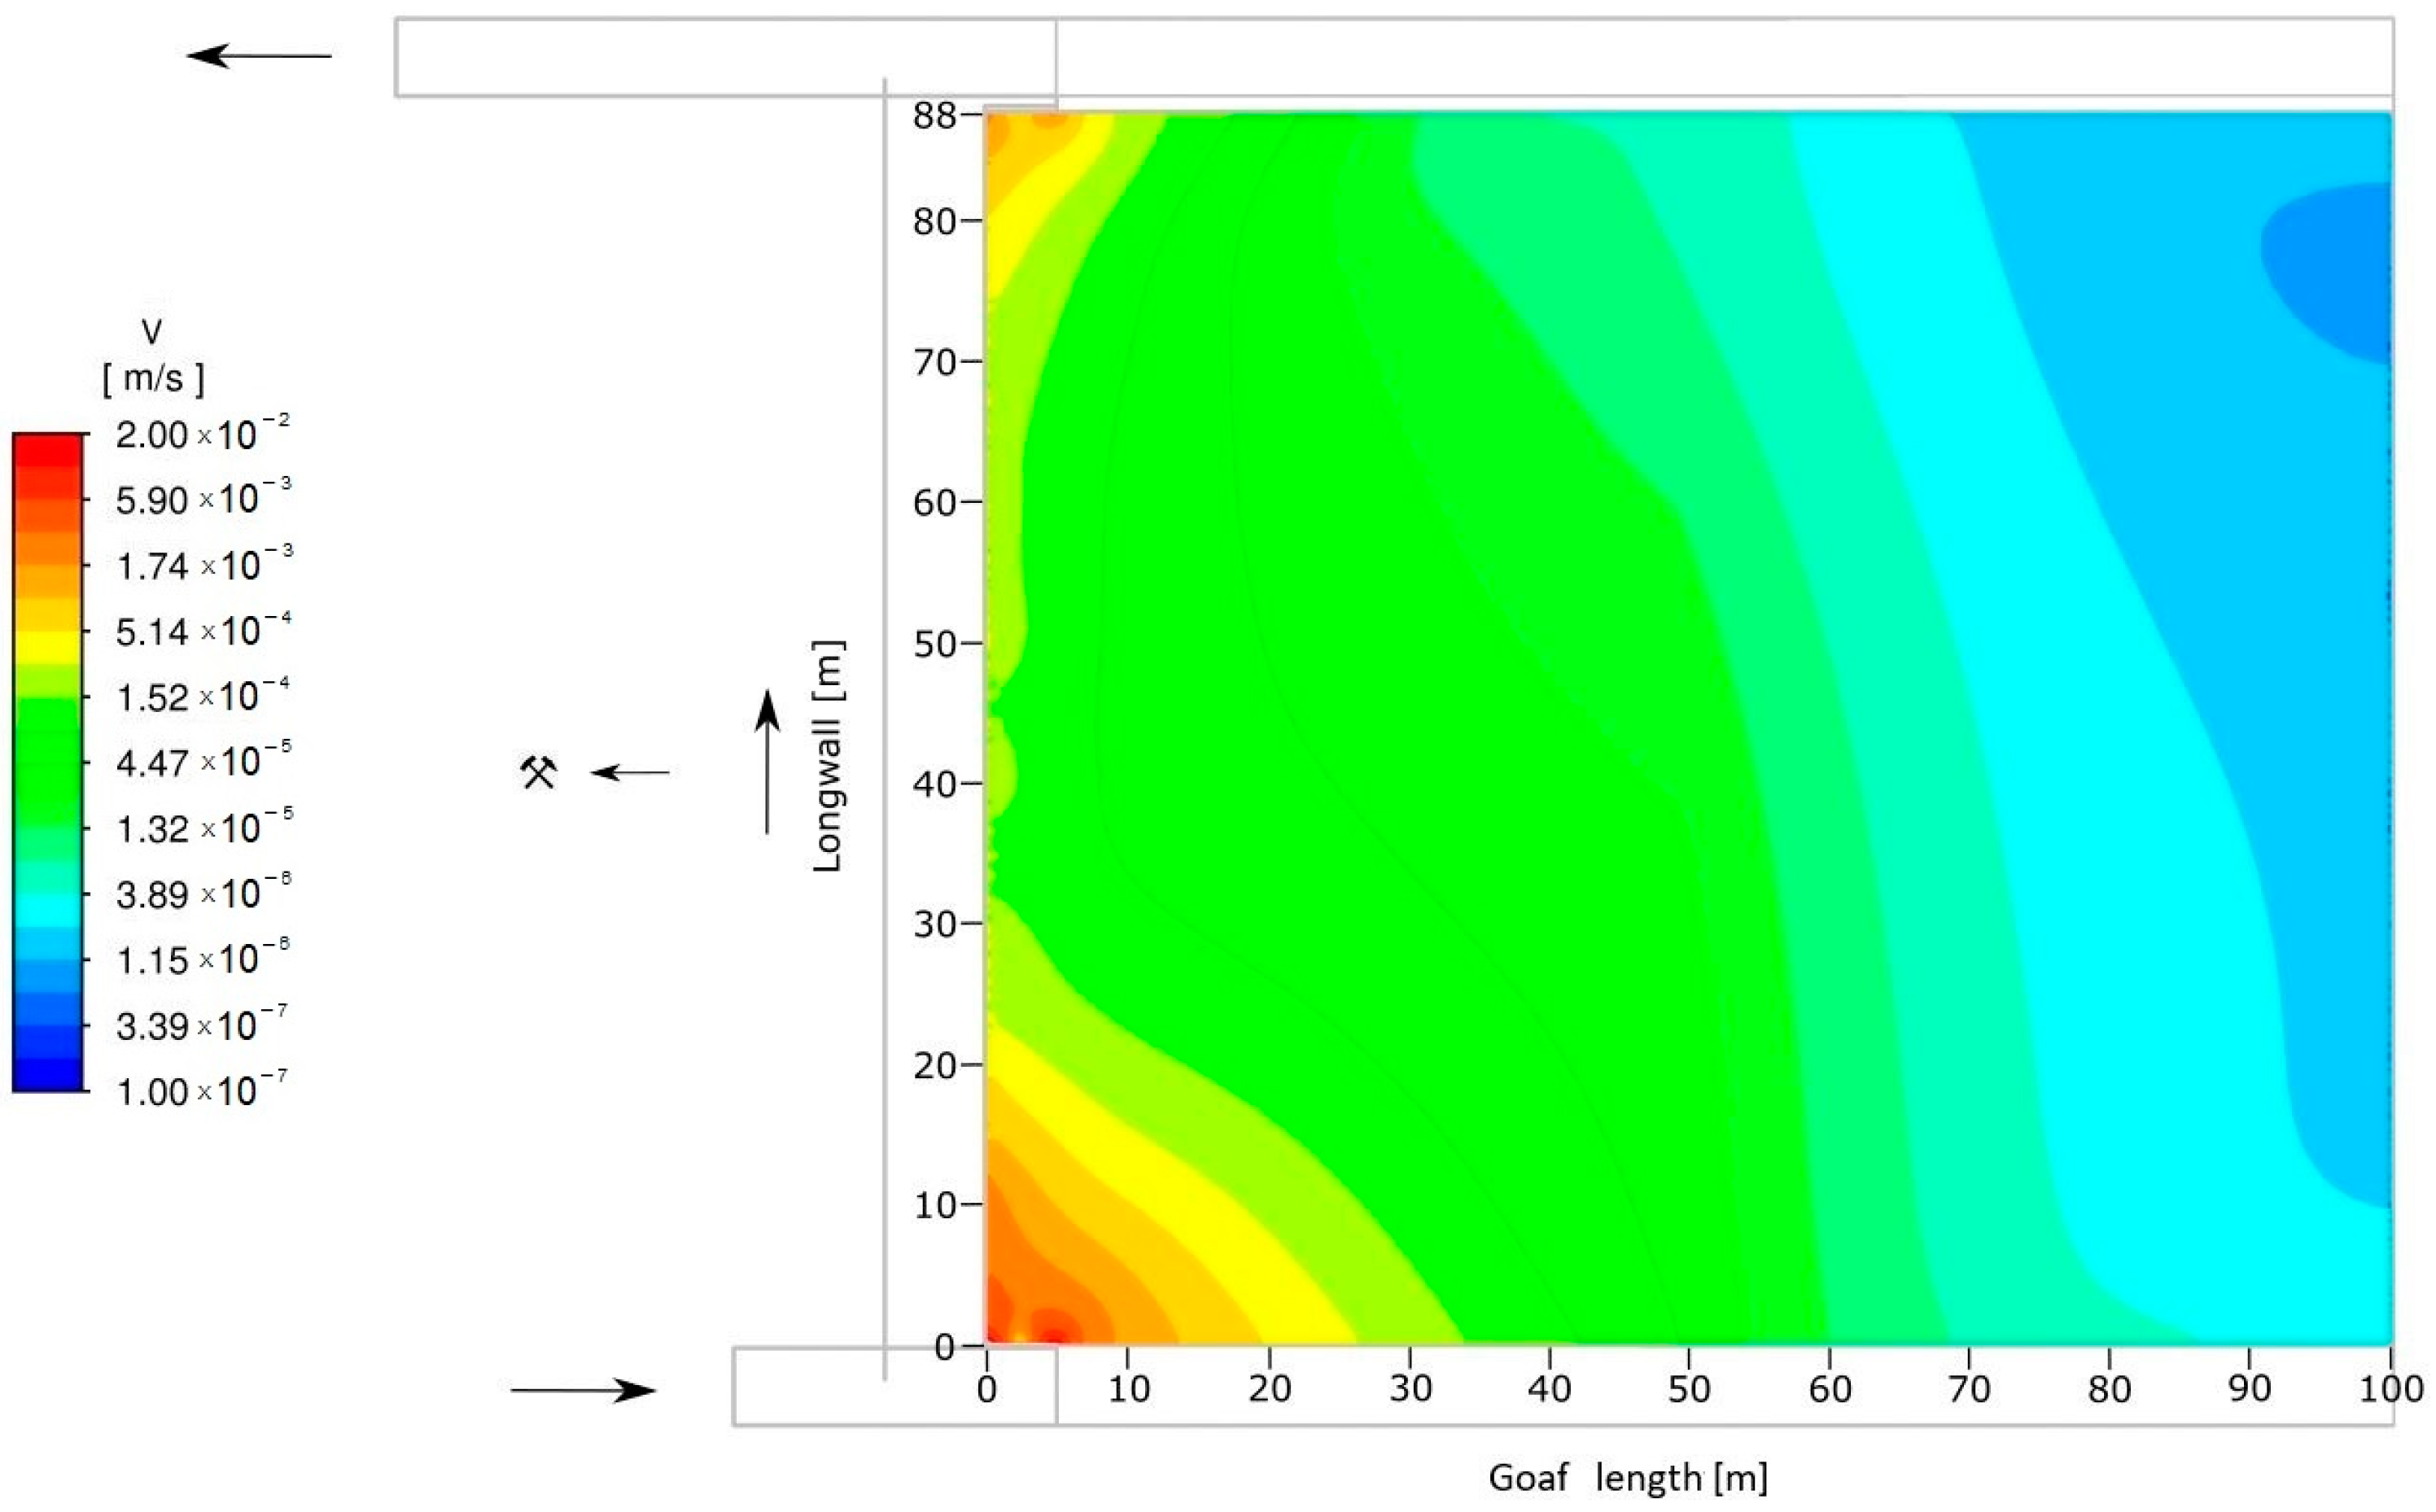
Figure 9.
Velocity contours on a logarithmic scale in the range from 1.0 × 10⁻⁷ m/s to 0.02 m/s for a model with constant parameters of porosity and permeability in the goaf.
Figure 9.
Velocity contours on a logarithmic scale in the range from 1.0 × 10⁻⁷ m/s to 0.02 m/s for a model with constant parameters of porosity and permeability in the goaf.
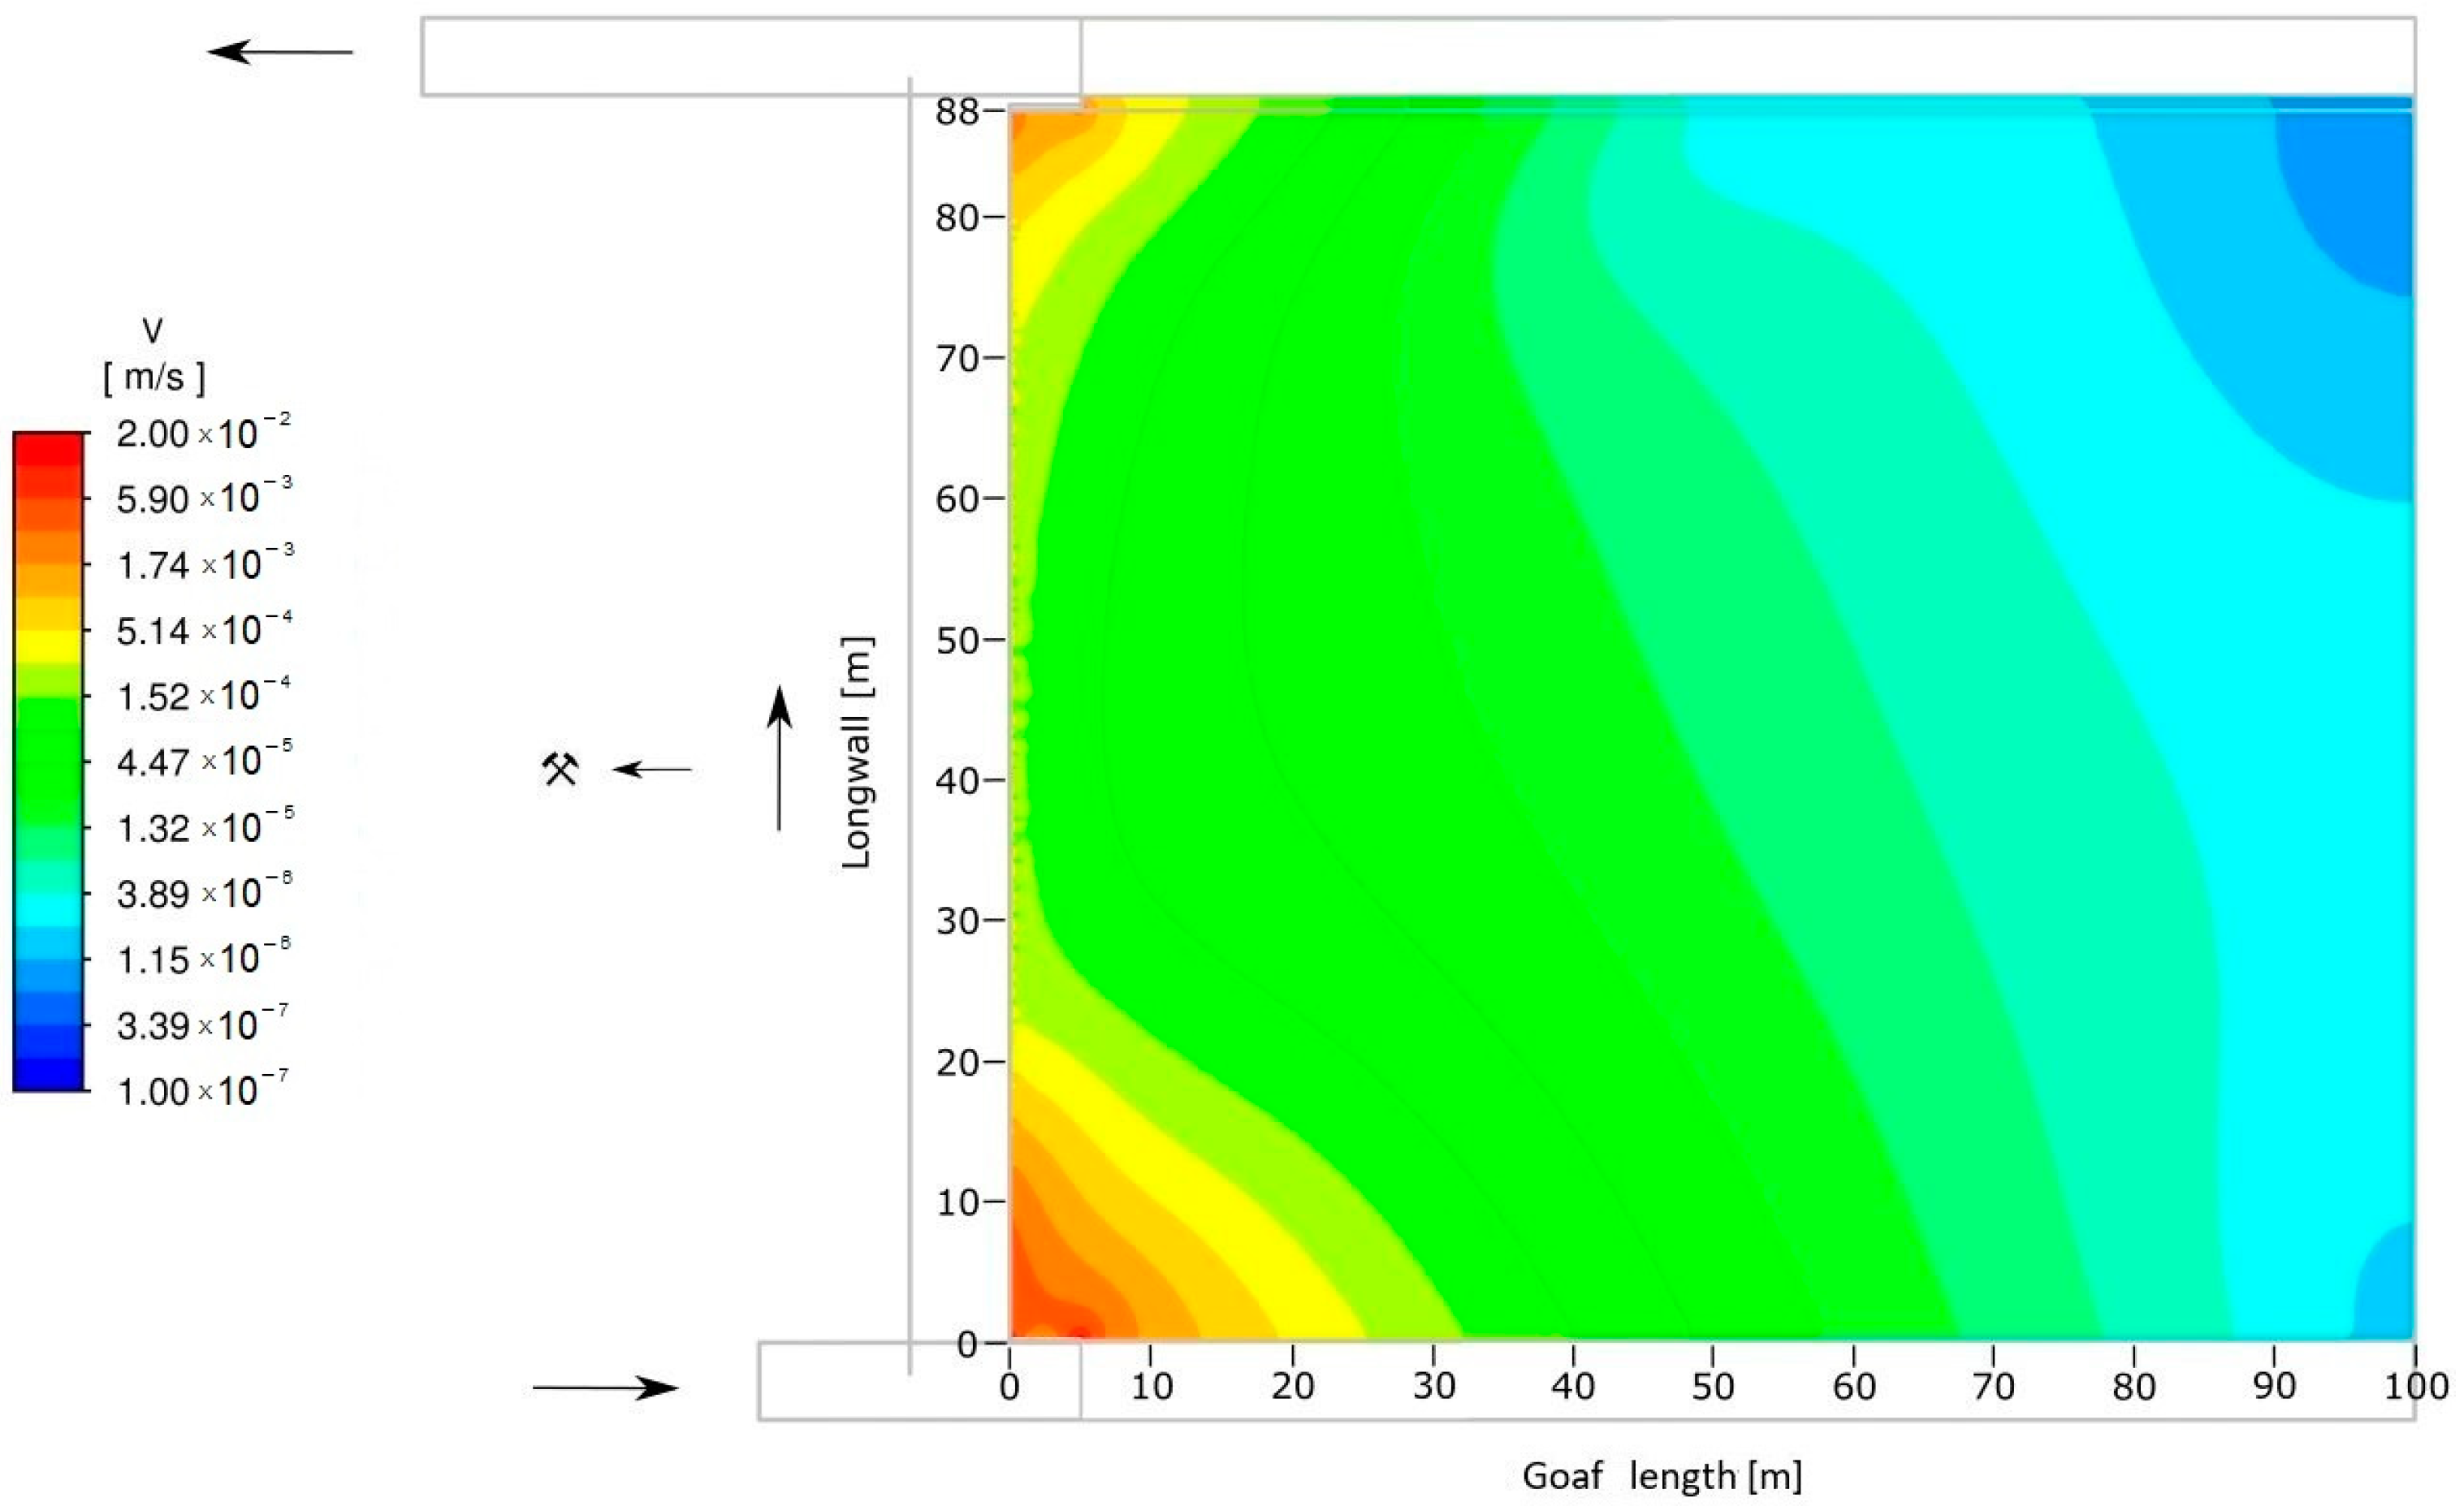
Figure 10.
Air flow distribution along the measurement lines on a logarithmic scale for the model with constant and carriable values of porosity and permeability in goafs.
Figure 10.
Air flow distribution along the measurement lines on a logarithmic scale for the model with constant and carriable values of porosity and permeability in goafs.


Table 1.
Dimensions of the numerical model geometry.
| Height [m] | Width [m] | Length [m] | Slope [°] | |
|---|---|---|---|---|
| Maingate | 3.8 | 5.5 | 29.0 | – |
| Longwall | 2.9 | 6.6 | 88.0 | 8.0 |
| Tailgate | 3.8 | 5.5 | 29.0 | – |
| Goafs | 12.4 | 88.0 | 100.0 | 8.0 |
Disclaimer/Publisher’s Note: The statements, opinions and data contained in all publications are solely those of the individual author(s) and contributor(s) and not of MDPI and/or the editor(s). MDPI and/or the editor(s) disclaim responsibility for any injury to people or property resulting from any ideas, methods, instructions or products referred to in the content. |
© 2023 by the author. Licensee MDPI, Basel, Switzerland. This article is an open access article distributed under the terms and conditions of the Creative Commons Attribution (CC BY) license (https://creativecommons.org/licenses/by/4.0/).
Share and Cite
MDPI and ACS Style
Janus, J. Numerical Investigation of Air Flow in Goaf While Mapping Its Flow Parameters. Processes 2023, 11, 987. https://doi.org/10.3390/pr11040987
AMA Style
Janus J. Numerical Investigation of Air Flow in Goaf While Mapping Its Flow Parameters. Processes. 2023; 11(4):987. https://doi.org/10.3390/pr11040987
Chicago/Turabian StyleJanus, Jakub. 2023. "Numerical Investigation of Air Flow in Goaf While Mapping Its Flow Parameters" Processes 11, no. 4: 987. https://doi.org/10.3390/pr11040987
Note that from the first issue of 2016, this journal uses article numbers instead of page numbers. See further details here.