1. Introduction
The high-speed shear wet granulator, a critical piece of equipment in the pharmaceutical industry, has the advantages of a good mixing effect, high efficiency, low energy consumption, and being fully enclosed. Despite increasing research on high-speed shear wet granulation in recent years, the granulation process is still considered one of the most complex and variable pharmaceutical processes [
1,
2,
3]. Therefore, conducting high-speed shear wet granulation breakage studies for pharmaceutical process research is crucial.
High-speed shear wet granulation through the actions of the binder and powder kneading each other to form soft materials and stirring results in particles shearing into a uniform size. The process is divided into the following three stages [
4]: (1) wetting and nucleation (2) consolidation and granule growth, and (3) breakage and attrition. Most current wet granulation models are based on computational fluid dynamics (CFD) theory. Although the Euler–Euler (continuous particle flow) and Euler–Lagrange (discrete particle) models are the two most commonly used simulation strategies [
5,
6], the discrete element simulation method (DEM) treats the gas as a continuous phase and the particles as a discrete phase, which is more accurate for the description of particle rotation and collision. Graziano Frungieri et al. [
7] used CFD-DEM simulations to study the breakup dynamics of solid agglomerates in a polymer compounding operation, correlated DEM breakup data and viscous stress distribution through a first-passage-time statistic, and used this to calibrate the population balance model. Kumar Ashish et al. [
8] incorporated models of liquid bridge formation, fracture, and the effect of liquid bridges on intersegmental forces, and analyzed the temporal evolution of particle flow and interparticle liquid distribution leading to agglomerate formation. Barrasso Dana et al. [
9] proposed a new mechanistic model for the wet granulation process, combining the techniques of population balance modeling and discrete element methods to predict the key quality attributes of granular products. Tamrakar Ashutosh et al. [
10] investigated the difference between wet binder addition (WBA) and dry binder addition (DBA) and found that in both systems, the different viscosities of the surface liquids resulted in different strengths and number of liquid bridges formed between the particles as well as different velocities of the particles. Jiménez-Herrera et al. [
11] analyzed particle breakage using three models: the bonded-particle model (BPM), the particle replacement model (PRM), and the fast-breakage model (FBM) and demonstrated the potential of the three models in describing particle size reduction. Hideya Nakamura et al. [
12] proposed a new DEM-PBM coupling method with a deterministically calculated agglomeration kernel (DAK), which was used to simulate the wet granulation process of calcium carbonate powder by the rotary drum method, and verified the effectiveness of the DEM–DAK–PBM coupling method. Kulju Timo et al. [
13] used the discrete element method (DEM) and the interaction of the particle stage with the overall equilibrium (PB) to calculate the flow inside the granulator and validate the DEM-PB model. De SimoneVeronica et al. [
14] analyzed nozzles of different aperture sizes and used this to introduce the granulating liquid in high-shear wet granulation using different process parameters. Existing papers have preliminarily explored the mechanism of particle breakage in the high-speed shear wet granulation process and achieved certain results, but the research mainly focused on verifying these stages with experiments and did not explore more deeply the flow state of pharmaceutical powder particles in the simulation process and the influence of this on the breakage efficiency. The process of the breakage of pharmaceutical powder particles in granulation is related to several factors and shows diversity. The question is how to comprehensively analyze the agglomerates of pharmaceutical powder particles. The process of breaking become the key to the study of powder particle breakage in granulation.
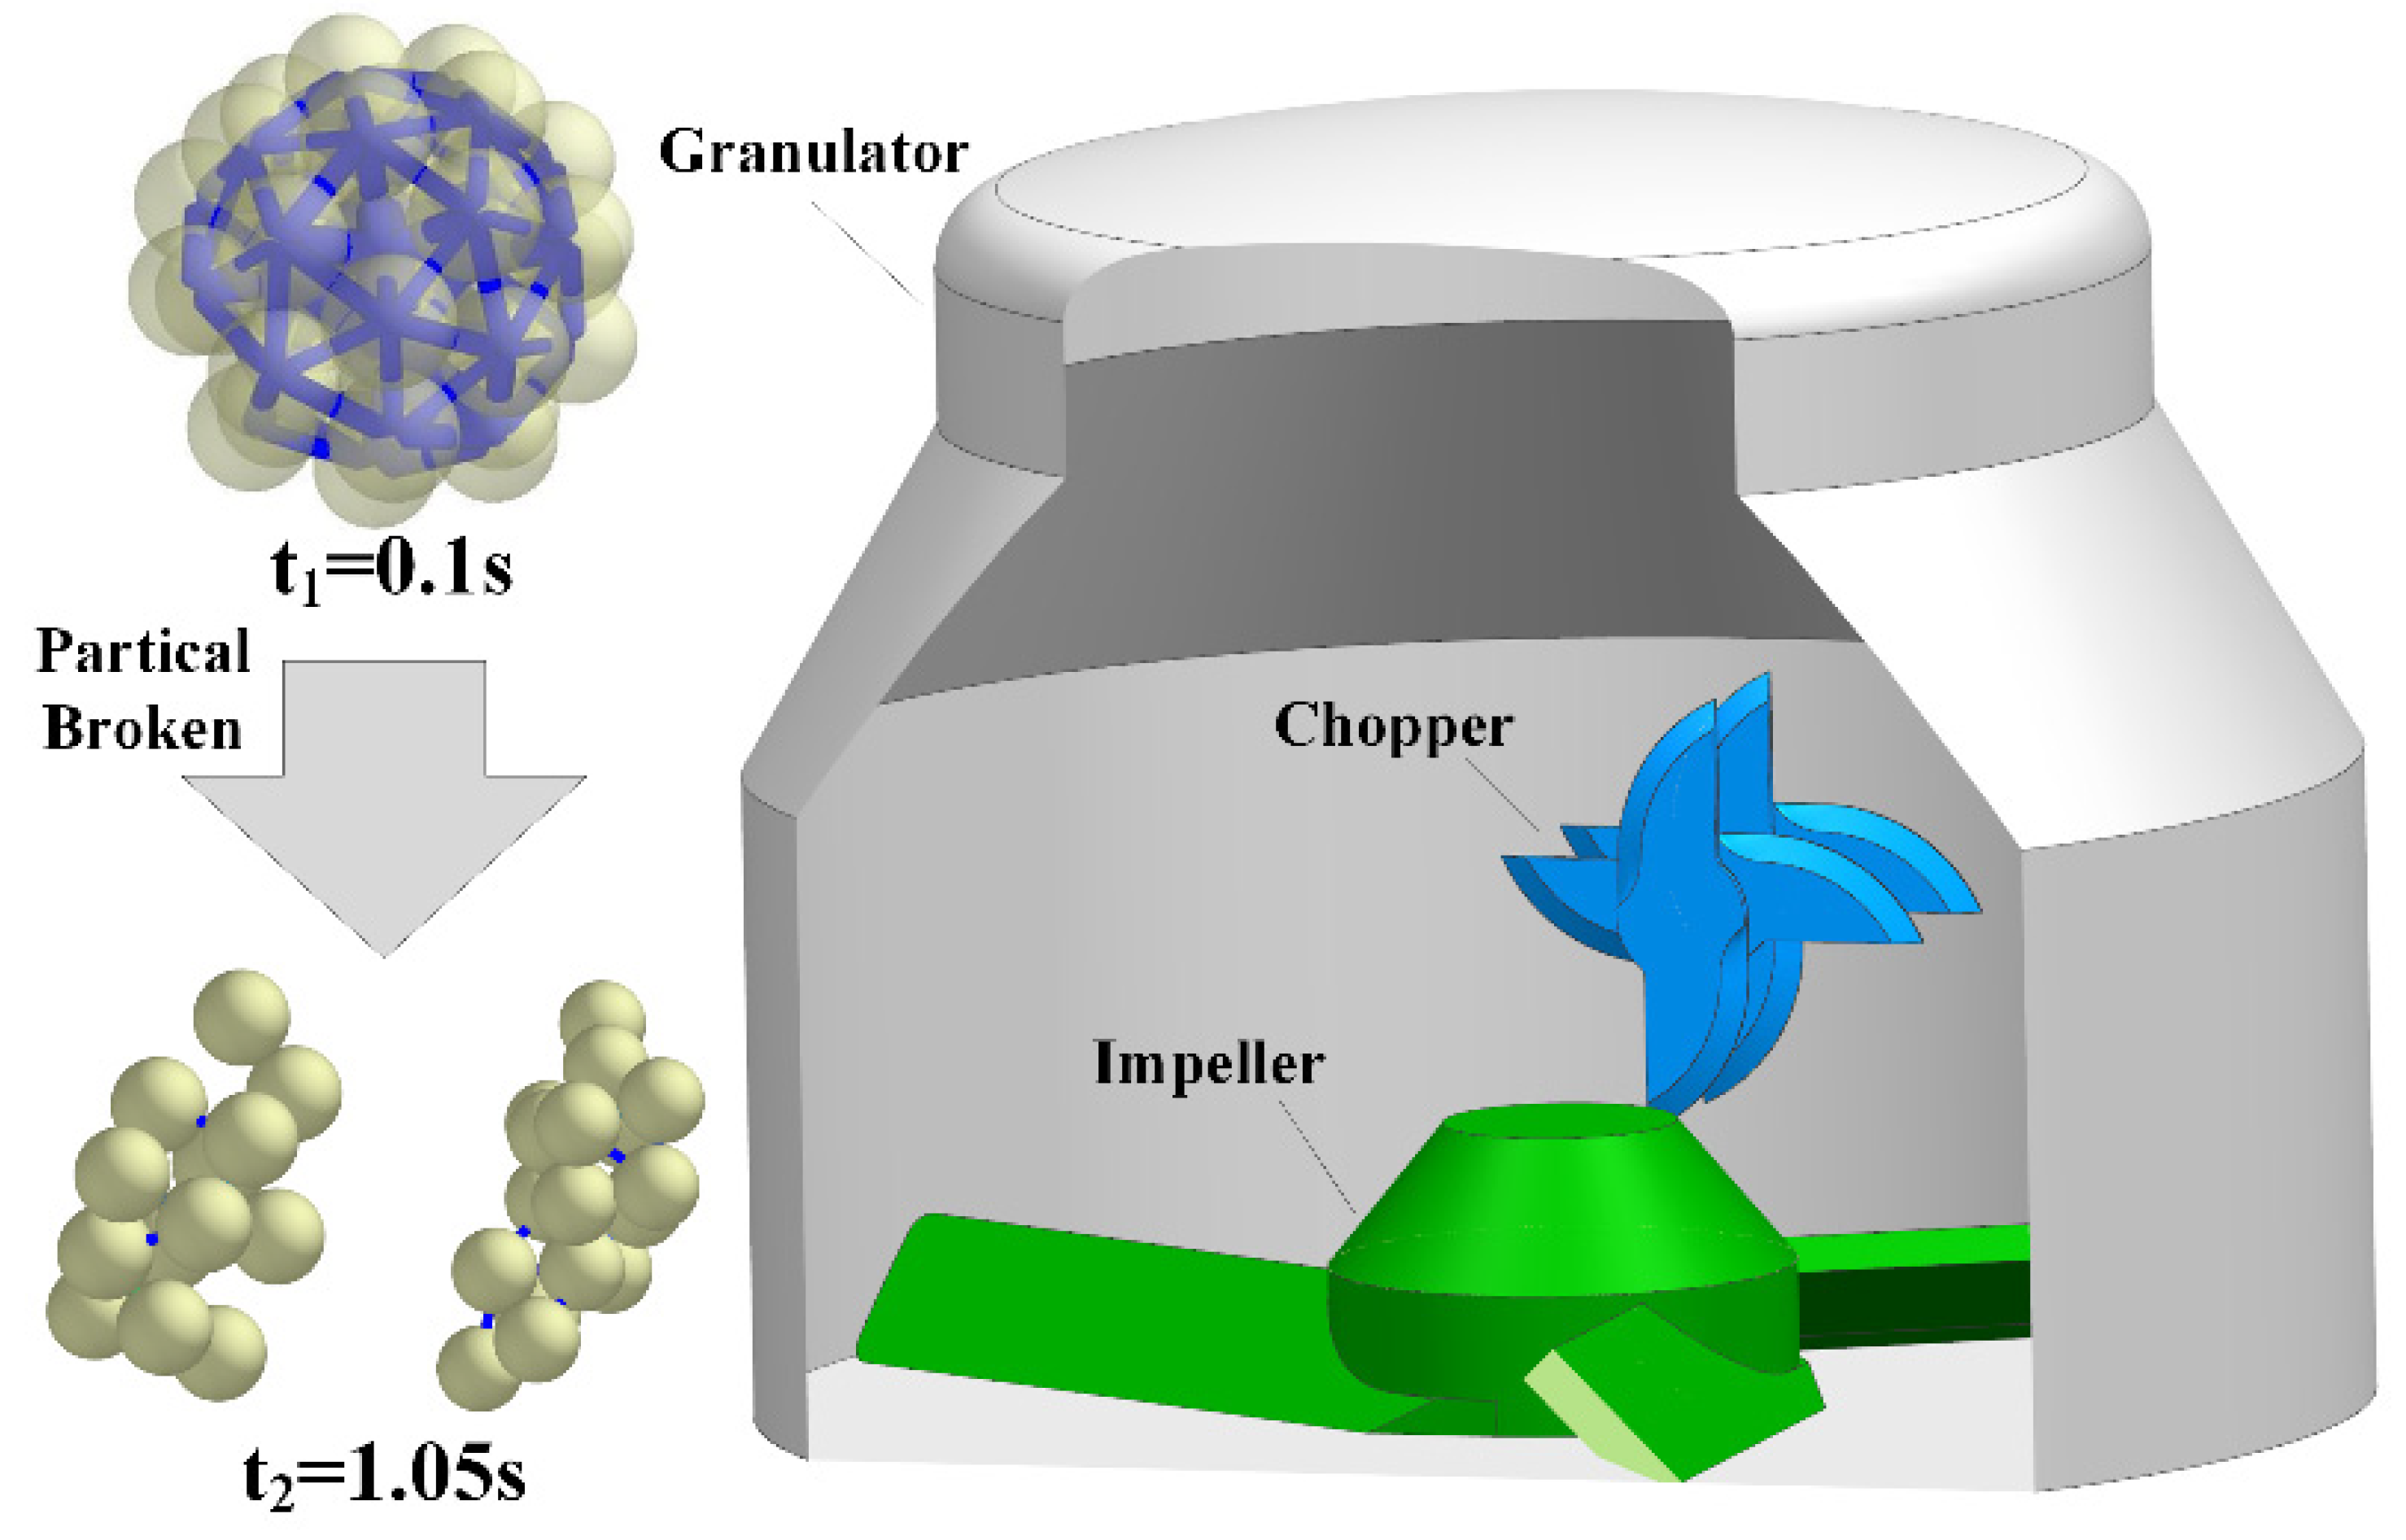
A high-speed shear wet granulator consists of a granulation chamber, impeller, chopper, and drive device. In the granulation stage, the high-speed shear wet granulator machine internally stirs soft shear material, and the powder, by applied mechanical force and liquid adhesion, extrudes and rolls up to form particles. Alizadeh Mohammadreza et al. [
15] proposed a systematic approach to improve the ductility of the discrete element method (DEM) for the simulation of viscous powder mixtures and to simulate the separation of particles during the stacking of ternary powder mixtures. Tomita Yosuke et al. [
16] investigated the characteristics of residence time distribution (RTD) in a continuous high-shear mixer-granulator and found that at higher scraper speeds, the shift in particle size distribution reached a steady state more quickly with changes in the liquid feed. Natalia Veronica et al. [
17] investigated the effect of different nozzle orifice sizes on particle properties and found that changes more influenced particle size produced with large orifice nozzles in process variables. Luo, Gan, et al. [
18] studied the system of microcrystalline cellulose and water composition for granulation and conducted three scales of HSWG experiments using a granulator. The results showed that it is feasible to scale up the HSWG process using the nucleation regime map approach. Thapa, Prakash et al. [
19] presented and discussed aspects such as process and formulation variables for high-shear wet granulation and potential key process parameters for various granulation technologies. Matsunami Kensaku et al. [
20] used a continuous high-shear granulator and ethenzamide as the active pharmaceutical ingredient, and results showed that high-speed manufacturing favored a lower liquid/solid ratio, while high circularity slowed down disintegration/dissolution. Kristó, Katalin, et al. [
21] investigated the effect of cooling and process parameters on product parameters by factorial design and found that in the case of pellets prepared with binder solutions, the size of the pellets was larger after cooling. As we are faced with various pelletizing requirements, it is critical to analyze the impact of the process parameters of the chopper and impeller on the pellet intermediates in an integrated manner.
The analysis and summary of the current literature show that the pharmaceutical process mechanism is complex, and many factors affect the process. Previous authors mainly used experiments to verify the pharmaceutical process and studied the design of equipment factors and process amplification. The accurate establishment of the movement and agglomeration model of pharmaceutical powder particles in the granulation process is an essential prerequisite for establishing the simulation model of the high-speed shear wet granulation process. It is also the basis for the study of control process parameters.
To accurately simulate the breakage curve at various rotational speeds, as shown in
Figure 1, this paper uses particle simulation. It also studies the granulation process under various effects, such as high-speed shear broken by the chopper, impeller collision, and extrusion. It also applies various breakage forms to determine the relationship between the broken capacity and process variables. By substituting the binder into the Hertz–Mindlin with Bonding model, the breakage of the particles was analyzed by the discrete element method, and on this basis, the fundamental law of particle breakage strength was revealed by analyzing the particle size distribution law of pharmaceutical powder particles.
2. Theoretical Basis
This paper uses the Discrete Element Method for high-speed shear wet granulation simulation. In the Discrete Element Method, the collision between particles is the process of contact and interaction between particles.
The resultant force determines the motion of a single particle and the resultant moment of force acting on it, described by the translational motion and rotational motion of the particle. The state of motion of a particle
depends on the resultant force and resultant moment of force to which it is subjected. The particle is subjected to the direct action of a particle
. The particle undergoes translational motion, and the resultant moment of force it is subjected to provides the rotation. The basic equation of motion of the particle
is shown in Equations (1) and (2) [
22].
where
is the mass of particle
,
is the translational velocity of particle
,
a is the force of particle
on particle
,
is the gravitational force,
is the principal moment of inertia,
is the angular acceleration, and
is the resultant moment of particle
on particle
.
In order to simulate the particle-to-particle contact as much as possible, other models are needed to act on the particles in addition to the above equations. In the face of different contact forms, there are also different contact models to match them.
The particle interaction law is called the contact model, and each contact is assigned a single contact model. For different practical situations, there are different contact models to match them. There are five main contact models commonly used: Hertz–Mindlin (No slip), Hertz–Mindlin with Bonding, Hertz–Mindlin with JKR Cohesion, Linear Cohesion, and Linear Spring.
Among them, the Hertz–Mindlin (No slip) [
23,
24] contact model is the most primitive model on which all other contact models are built and modified.
The normal force
is given by [
25]:
where the equivalent Young’s Modulus
and equivalent Radius
are defined as:
where
,
,
, and
,
,
are the Young’s Modulus, Poisson ratio, and Radius of each sphere in contact, respectively.
Additionally, there is a damping force,
, given by [
26]:
is the normal component of the relative velocity, and
and
(the normal Stiffness) are given by:
where
is the coefficient of restitution. The tangential force
depends on the tangential overlap
and the tangential Stiffness
.
where
is the equivalent shear modulus. Additionally, tangential damping is given by [
26]:
where
is the relative tangential velocity.
In the face of different material simulations, a basic Hertz–Mindlin (No slip) model is not enough, and an additional model is needed to make it more accurate. Therefore, the Hertz–Mindlin with bonding model is chosen in this paper to simulate the material in more detail.
The Hertz–Mindlin with bonding contact model [
27] is mainly applied in the field of rock breaking, where a finite number of balls are bonded into a large ball by specific adhesive forces and moments that can limit the relative motion of the balls bonded together. When the cohesive interaction between these balls reaches the maximum normal and tangential stresses, the cohesive interaction is broken, which means that the giant ball achieves fragmentation.
The adhesive force between the particles after bonding is initially 0. As the simulation proceeds, the forces (
)/torques (
) increase with a time step according to the following equation:
After the onset of adhesion, the adhesion bond starts to appear with increasing time steps, and the following equation gives the area of expression:
where
is the Radius of the “glue” when we use a simplified modeling approach, treating the “glue” as a liquid bridge between particles.
is the contact bond area, the Moment of Inertia.
,
are the normal and shear Stiffness, respectively.
is the time step.
,
are the normal and tangential velocities of the particles, and
,
are the normal and tangential angular velocities.
In this model, adhesive failure is due to the normal and tangential interparticle action being more significant than its maximum value, and the maximum normal and tangential stresses at rupture failure are:
The simulation of powder particle breaking, which is utilized for the following analysis of the data in this research, may be realized using the aforementioned laws and models.
3. Simulation Methods
The flow chart of the discrete element simulation is shown in
Figure 2. First, the particles are modeled, and the material parameters of the particles are set, which need to be as close to reality as possible. The second step is to edit the contact model and select a suitable contact model according to the microscopic properties of the particles. The third step is to simulate the geometric model, add the velocity method and size to the corresponding components, and set the time step according to the selected contact model. The next step is to start the calculation, generating particles within the geometry and calculating the resulting particles’ contact position and contact force, updating and recording the particle position after the calculation is completed. If the calculation is not finished, it goes to the next iteration of the time step, and the cycle iterates to realize the simulation analysis.
3.1. Particle Modeling
In this study, spherical particles are used to simulate powder particles. Particle size and shape have an enormous impact on the calculation speed of the simulation; particle size reduction leads to a geometric increase in simulation time; due to computer hardware limitations, the particle size of the powder particles used in this study is larger than the real particles, with spherical particles 1.2 mm in size being selected for simulation, with 37 small particles agglomerating to form a 5 mm agglomerates object, as shown in
Figure 3.
In discrete element software (EDEM), the microscopic and macroscopic properties of the material need to be understood in advance. These properties are described quantitatively in the form of density, shear modulus, and Poisson’s ratio. Material parameters are inherent to the material and can be obtained by referring to the material properties datasheet. For different experiments, the required material varies. The material used in this case is microcrystalline cellulose with a density of 1500 kg∙m−3, a Poisson’s ratio of 0.3, and a shear modulus of 100 MPa.
Since the Hertz–Mindlin with bonding model is computationally intensive, the degree of particle motion is relatively violent. Since all particle-influencing factors must be taken into account when choosing bonding parameters, the parameters used in this paper are based on the discrete element numerical simulation’s parameter selection method. Normal Stiffness per unit area and shear Stiffness per unit area are calculated using Equations (8), (10) and (13). Normal Strength and Shear Strength were calculated according to Equation (15) and combined with the experimental results of the mechanical properties of the powder in this simulation to solve for the adhesion parameters between the adhesive bonds of the powder particle agglomerates, as shown in
Table 1.
After the particle simulation is set up, the particle generation needs to be set up. In this simulation, 300 particle agglomerates were generated, each agglomerate consisting of 37 small particles, for a total of 11,100 small particles. The generation rate is 30,000 agglomerates per second, and the total particle agglomerate generation time is 0.01 s.
3.2. Geometric Motion Modeling
The model mesh for the granulator has been produced and is shown in
Table 2.
A structural drawing of the granulator is given in
Figure 4a, where the length is in millimeters.
Figure 4b shows the initial state of the simulation run at the end of particle generation.
The main dimensions are shown in
Table 3.
Figure 5 depicts the shape of the impeller and chopper, both composed of stainless steel. The impeller consists of a 45° tangential paddle with three blades, and the chopper is equipped with four willow blades. The impeller and the chopper spin counterclockwise under real operating circumstances, and the arrow indicating their motion is also included in the illustration.
Rotating speed is one of the most important process variables for high-speed shear wet granulation. The chopper and impeller speeds are carefully chosen as given in
Table 4, cross-matched, and a total of 20 case simulations are carried out. The typical impeller speed of a wet granulator is 50–800 rpm, and the chopper speed is 500–3500 rpm [
28].
4. Results
The powder particle agglomerates create adhesive bonds, which are produced in 0.01 s. The adhesion stabilizes after a period of falling. The particles make contact with the chopper for 0.25 s due to the impeller’s rotation. Typically, if the granulation time is too long, the particle size of the particles is too small, the proportion of fine powder gradually increases, and there is granulation failure and other situations. Usually, the particles are not entirely broken, the particle size is large, and the particle size distribution is not uniform enough. Due to the analysis software’s limitations and the simulation setup’s simplicity, we used existing code for the simulation and 10 s as the granulation time. At the end of the simulation, the inserted powder particle agglomerates changed in size, and it was seen that the agglomerates broke down. For analysis, the pertinent findings were taken out and used in the analysis of the mechanism of particle breakage.
Two types of particle agglomerates in general are dispersed during the operation of the granulator. One is shear-broken by the high-speed chopper, while the other particles propelled by the impeller are broken by mutual extrusion. The following analysis examines the particle-breaking mechanism for an impeller rotating at 300 rpm and a chopper rotating at 3000 rpm.
As shown in
Figure 6a,b, the powder particles are not initially susceptible to the chopping action caused by the impeller throughout the time interval of 1 s to 1.02 s. The high-speed shearing of the blade edge causes the force on the particle agglomerates to increase once they make contact with the chopper. As seen in
Figure 6c, the particles are propelled upward to separate from the agglomerates, which changes the particle size and causes the tiny particles to be ejected. Because the wall of the granulation chamber remains static, when the chopper breaks the material into three particles of various sizes, this portion of the material once again be subject to gravity, returning to the particle flow and beginning the cycle described above.
Fragmentation does not occur due to contact with the chopper in the particle flow caused by the impeller’s action, but rather due to particle-particle extrusion. According to
Figure 7a, the chosen particles had no velocity direction in the granulation chamber between 1.3 and 1.4 s. As the impeller moves the other gray particles inward, it forces the red and blue particle clusters at rest to move in a circular motion. They begin to separate due to the extrusion of the other particles. In
Figure 7b, blue and red arrows represent the directions of the blue and red particle cluster velocities, respectively. As observed in
Figure 7c, by 1.5 s, there seemed to be a split between the blue and red particle clusters. The powder particles were repeatedly crushed in the particle flow, leading to a steady particle size reduction.
As shown in
Figure 8, the average velocity of the shear-broken particles fluctuates roughly at 0.4 m/s, but the velocities of the powder particles in contact with different positions have obvious differences, as shown in the figure at 1.02 s. The velocity peak appears due to the particles contacting the chopper, and the maximum average velocity of the particles reaches 0.98 m/s. The average velocity of the compression-broken particles is always in the range of 0.3 m/s and fluctuates regularly in that range, with each small wave being the peak velocity generated by the particle following the rotation of the impeller.
The trajectory of the particles subjected to both types of breakage is depicted in
Figure 9. While the particles subjected to chopper action, which separates more and smaller particles, move at a slower rate toward the top of the granulation chamber and separate from larger particles, they accelerate under the action of the chopper and migrate to a higher position in the chamber.
In summary, it can be found that the particles subjected to chopper breakage are separated within 0.05 s, which is a short time and can be seen as having high broken efficiency. The particles subjected to breaking by compression need to be separated gradually in 0.2 s. The separation is not complete, and there is also a certain amount of adhesion, but ultimately both breakage forms lead to changes in particle size.
4.1. Effect of Rotational Speed on Particle Breakage
During the granulation process, shearing and extrusion of the powder particles occur, resulting in particle fragmentation, which leads to the breakage of the bonds between the powder particles, and more bonds are broken, thus leading to a higher bond fragmentation rate. The bond breakage rate can be used as an indicator to reflect the degree of internal breakage of large particles, but the fraction of broken bonds provides only a rough estimate of the breakage rate. The formula of bond breakage rate is defined as the ratio of broken bonds between powder particles to the total bonds generated.
According to
Figure 10, the breakage rate throughout the simulation is steadily rising. When the chopper speed is increased while the set impeller speed remains constant, the rate at which the pharmaceutical powder particles break up steadily rises. The breakage rate rose by 11.98%, 20.92%, 31.36%, and 27.89% at the four impeller speeds, respectively, as the chopper speed increased from 1000 rpm to 3000 rpm. The linear velocity of the chopper increased from 1.151 m/s to 3.454 m/s. When the impeller speed increased from 50 rpm to 300 rpm at five different chopper speeds, the breakage rate rose by 35.66%, 40.76%, 45.36%, 47.61%, and 51.56%, respectively. Comparing various speeds, the results of the processing techniques indicate the same tendencies. As a result, the chopper and impeller speeds should be reasonably matched when choosing the process parameters to achieve a better breakage effect.
In
Figure 11, breakage data are shown for each particle agglomerate. It can be seen that the impeller breakage rate positively correlates with the rotating impeller speed. The impeller’s low rotating speed causes the particles to be exposed to minimal force from the impeller, which prevents the impeller from breaking the particles. The force acting on the particles grows as the impeller speed increases gradually, and the impeller breakage rate rises gradually but more steadily. Additionally, the impeller and chopper’s pronounced coupling effect has an impact on the rate at which the chopper breaks down the particles. When the impeller runs at a low speed, it cannot effectively drive the particles into the chopper, and even when the chopper speed is higher, there are fewer broken particles. It is obvious that the chopper breakage rate at high impeller rotating speed is much greater than the chopper breakage rate at low impeller rotational speed when comparing the chopper breakage rate at impeller 100 rpm, chopper 3000 rpm, and impeller 200, chopper 3000 rpm. The chopper breakage rate under distinct sets of operating situations begins to vary as the impeller rotational speed rises. This implies that shear could be a pelletizer’s primary crushing force, and increased compression might be enough to break up particles into smaller pieces.
The particles undergo multiple cycles of being squeezed, cut, and re-entering into the particle stream over the whole breaking process. Increased impeller rotational speed causes more rotations, which propels the particle stream to travel continuously, causing more particles to come into contact with the chopper and impeller and increasing the likelihood of breakage cycles. The bonds between the particles loosen under the combined influence of the two preceding elements, making the particles more prone to breaking. This is the outcome of the combined action of the chopper and the impeller, where the impeller speed has a bigger impact on the chopper breaking rate.
The breakage rate of the bonds is 72% in
Figure 10 but reaches 98% in
Figure 11 at the same impeller speed of 300 rpm and a chopper speed of 3000 rpm, indicating an error. The incompleteness of the fragmentation in
Figure 10 may be the cause of the inaccuracy. When a connection is broken with a chopper, it is not fully broken but instead split into multiple tiny pieces, each of which still has a small amount of the original bond. When the impeller breaks something, the shattered particles have a larger size and more bonds. In the present simulation, comparing the outcomes from the two angles reveals a consistent upward trend in the breaking rate as the rotating speed rises. In the simulation, we analyzed the above two forms of breakage, but we did not consider the breakage caused by the impact of the particles on the wall.
4.2. Effect of Rotational Speed on the Mean Particle Size
Since the particles are not completely broken at the 300 rpm impeller speed and 3000 rpm chopper speed, the functioning condition is thoroughly examined over time.
Figure 12 displays the cumulative frequency of each particle size in 10 s. The particles are substantially fragmented in 1.5 s as a result of the high rotating speed of the impeller and chopper in this group. The initial particle size eventually changes to between 1.2 and 1.8 mm before reaching 66% by 10 s. The percentage of 1.82 mm particles that were broken up stayed at 23%. The proportion of the remaining 4.25 mm particles was the same as in
Figure 11, while the percentage of the remaining particles of other particle sizes varied very little during the experiment.
If the particle sizes of large and small particles are in the suitable range, good stability and compression molding can be produced, avoiding problems such as logging and sticky punching during compression and making the subsequent tablets with good tablet weight stability.
The particle size distribution can also be expressed as the standard deviation of the mean particle size and particle size distribution, as follows:
where
is the particle size value corresponding to 50%, and
is the particle size value corresponding to 84%. The mean particle size and standard deviation during the simulation are shown in
Figure 13. As the simulation proceeded, the mean particle size showed a smooth curving descent. In contrast, its standard deviation, from no difference at the beginning, increased sharply after the first large-scale fragmentation of agglomerates, peaked at 3 s at a value of 2.333, and then gradually decreased and stabilized gradually around 1.5.
The examination of mean particle size was also conducted for the other groups. Additionally, the simulation findings demonstrate that particle fragmentation is highly influenced by both chopper and impeller rotational speeds and that these two factors seem to be strongly connected. The particle size at various chopper speeds was determined by gradually increasing the impeller speed throughout the simulation computation. According to
Figure 14, when the impeller rotates at a low speed of 50 rpm, the mean particle size hardly changes when the chopper speed rises from 1000 rpm to 3000 rpm; even when the simulation is extended to 10 s, the mean particle size only drops from 4.61 mm to 3.67 mm. An increased impeller speed is required to reduce the particle size since the smaller the particle, the less likely it is to break. The mean particle size, which is affected by the increase in chopper speed, reduces noticeably from 2.45 mm to 1.61 mm when the impeller speed hits 300 rpm.
5. Discussion
This paper applies the bonded-particle model (BPM), a numerical rock fragmentation model, to powder simulation. Although powder particles are smaller than rocks, requiring higher computational accuracy, both rock and powder can be regarded as particles in nature, so a powder is considered to be composed of small powder particles to study its fragmentation.
Due to bonding connections, the particle fractured particle may be observed in the BPM model. The BPM model’s calculating volume is more stable, generating bonds after the first generation of particles. It requires better simulation processing power because, in contrast to the particle-replacement method (PRM) model used by Tavares [
29,
30], its particle blowing is more likely to happen during the replacement process and results in a higher computational load at the time of replacement. This quickly causes a computer crash and simulation failure. However, because of the computational model’s limitations, there are many holes in the BPM model, inaccuracies with the real agglomerate volume, and identically sized adhesion particles, all of which need to be improved. The JKR model can be used to simulate the humidity of the particles, and it was proposed by Johnson [
31]. Nevertheless, its surface energy parameters are not well measured and are still in the theoretical stage. The combination of broken and adhesion is essential to fit the actual situation as closely as possible.
The particle breakage may be seen in the BPM model as a result of bonding connections. The BPM model develops bonds after the initial generation of particles and has a more stable calculation volume. It is also more convenient to obtain this parameter without the need for complex measurement equipment. Due to the constraints, most of the parameters in this paper were simulated using parameters from the literature. For the measurement of particle properties of pharmaceutical powders, Wang Zheng et al. [
32] are constructing an iTCM database on the properties of Chinese medicine particles, which can provide some reference data on material properties for the simulation. When experimental conditions allow, it is still necessary to perform parameter calibration to obtain data, such as that done by Ma Guanguo et al. [
33], who obtained experimental data by physical stacking tests and simulation methods to calibrate the contact parameters of shotcrete wetted bodies. Additionally, only the impact of a single pharmaceutical powder particle species on the granulation effect could be taken into consideration at this time because only a single particle model had been established, making it impossible to take into account the impact of multiple pharmaceutical powder particle species. Therefore, the next step is to continue the in-depth study of other different powder particles and consider the factors of combined granulation of multiple powder particle species to achieve better granulation quality.
With the increasing standard of pharmaceutical regulatory quality, the requirements for wet granulation technology are getting higher and higher. This paper can provide references and ideas for the discrete meta-simulation of other materials, such as pharmaceutical powder granules, and the accurate simulation of pharmaceutical powder granules in the next step of the pharmaceutical process, such as drying, coating, and tablet pressing. However, there are many shortcomings, and future research needs improvement. For wet granulation simulation, the joint simulation of multiple stages is the direction of future research.
6. Conclusions
The conclusions and recommendations that can be made based on the results of this study are as follows:
(1) By establishing a three-dimensional model of a high-speed shear wet granulator and conducting a granulation process simulation, it was shown that there are two fundamental forms of breakages in the granulation process: shear breakages by the chopper and compression breakages by the impeller.
(2) As the impeller rotational speed increases, the rate of chopper breaking under various sets of operating conditions starts to change. This suggests that increased squeezing could be sufficient to crush particles into smaller fragments, and shear may be the dominant crushing force in a pelletizer.
(3) The simulation results indicate that the dispersion of agglomerates, which are collections of particles bound together by cohesive attractions, was most likely the cause of the reduction in particle size. Particle agglomerates exist in the larger sizes of PSDs, and when they are broken, particles are released, leading to larger fragmentation rates and a decrease in particle size.


