
Dissipative Particle Dynamics Simulation and Microscopic Experimental Study of Emulsification Performance of Surfactant/Polymer Flooding

Abstract
:1. Introduction
2. Materials and Methods
2.1. Materials
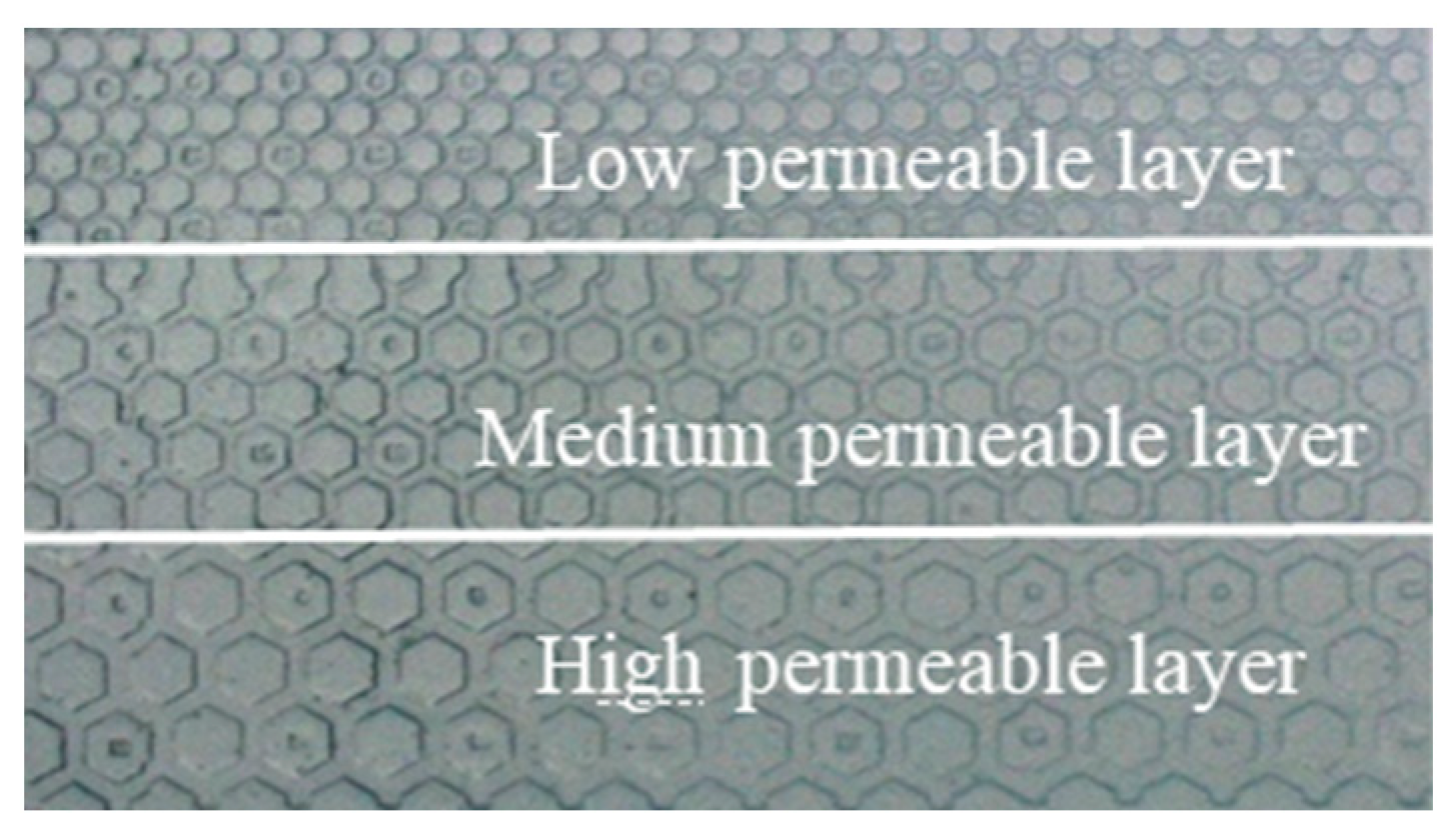
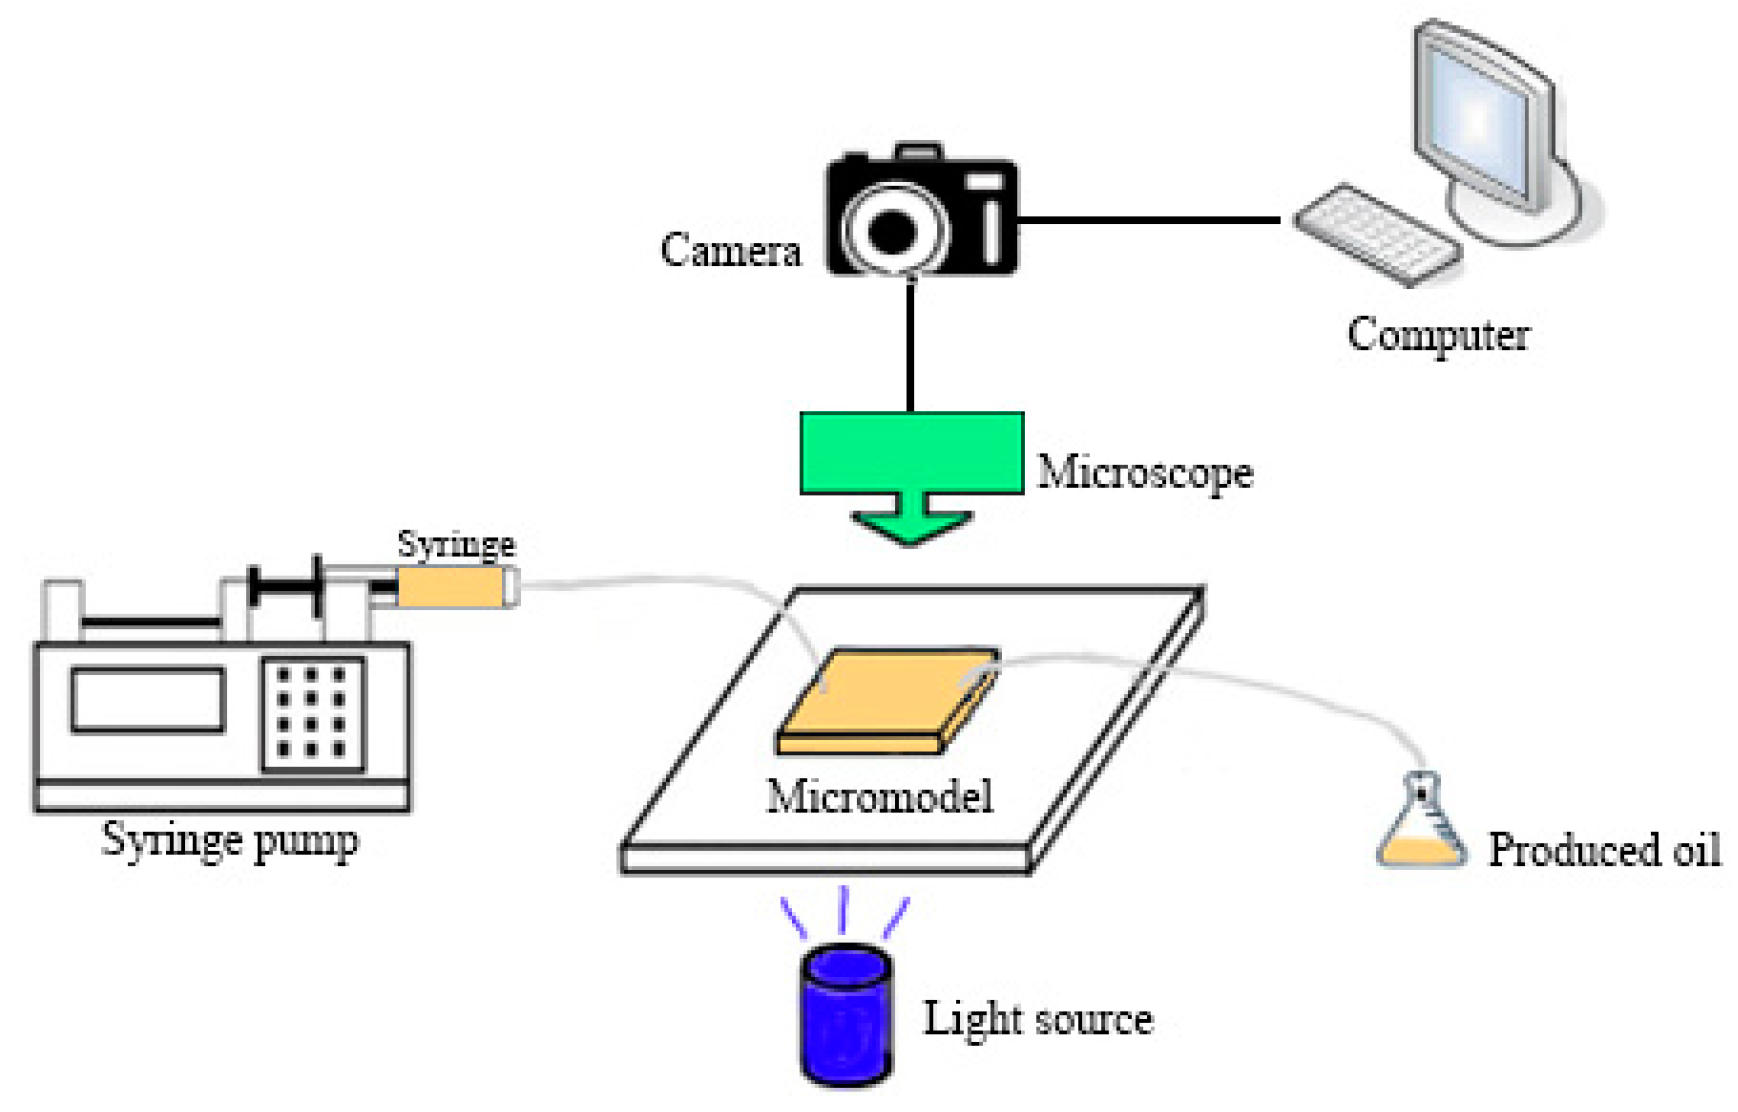
2.2. Microscopic Experiment
2.3. Molecular Simulation Method
2.3.1. Dissipative Particle Dynamics Parametrization Method
2.3.2. Coarse-Grained Model Construction
2.3.3. Calculation of Solubility Parameters
2.3.4. System Details
2.3.5. Interfacial Tension Measurement
3. Results and Discussion
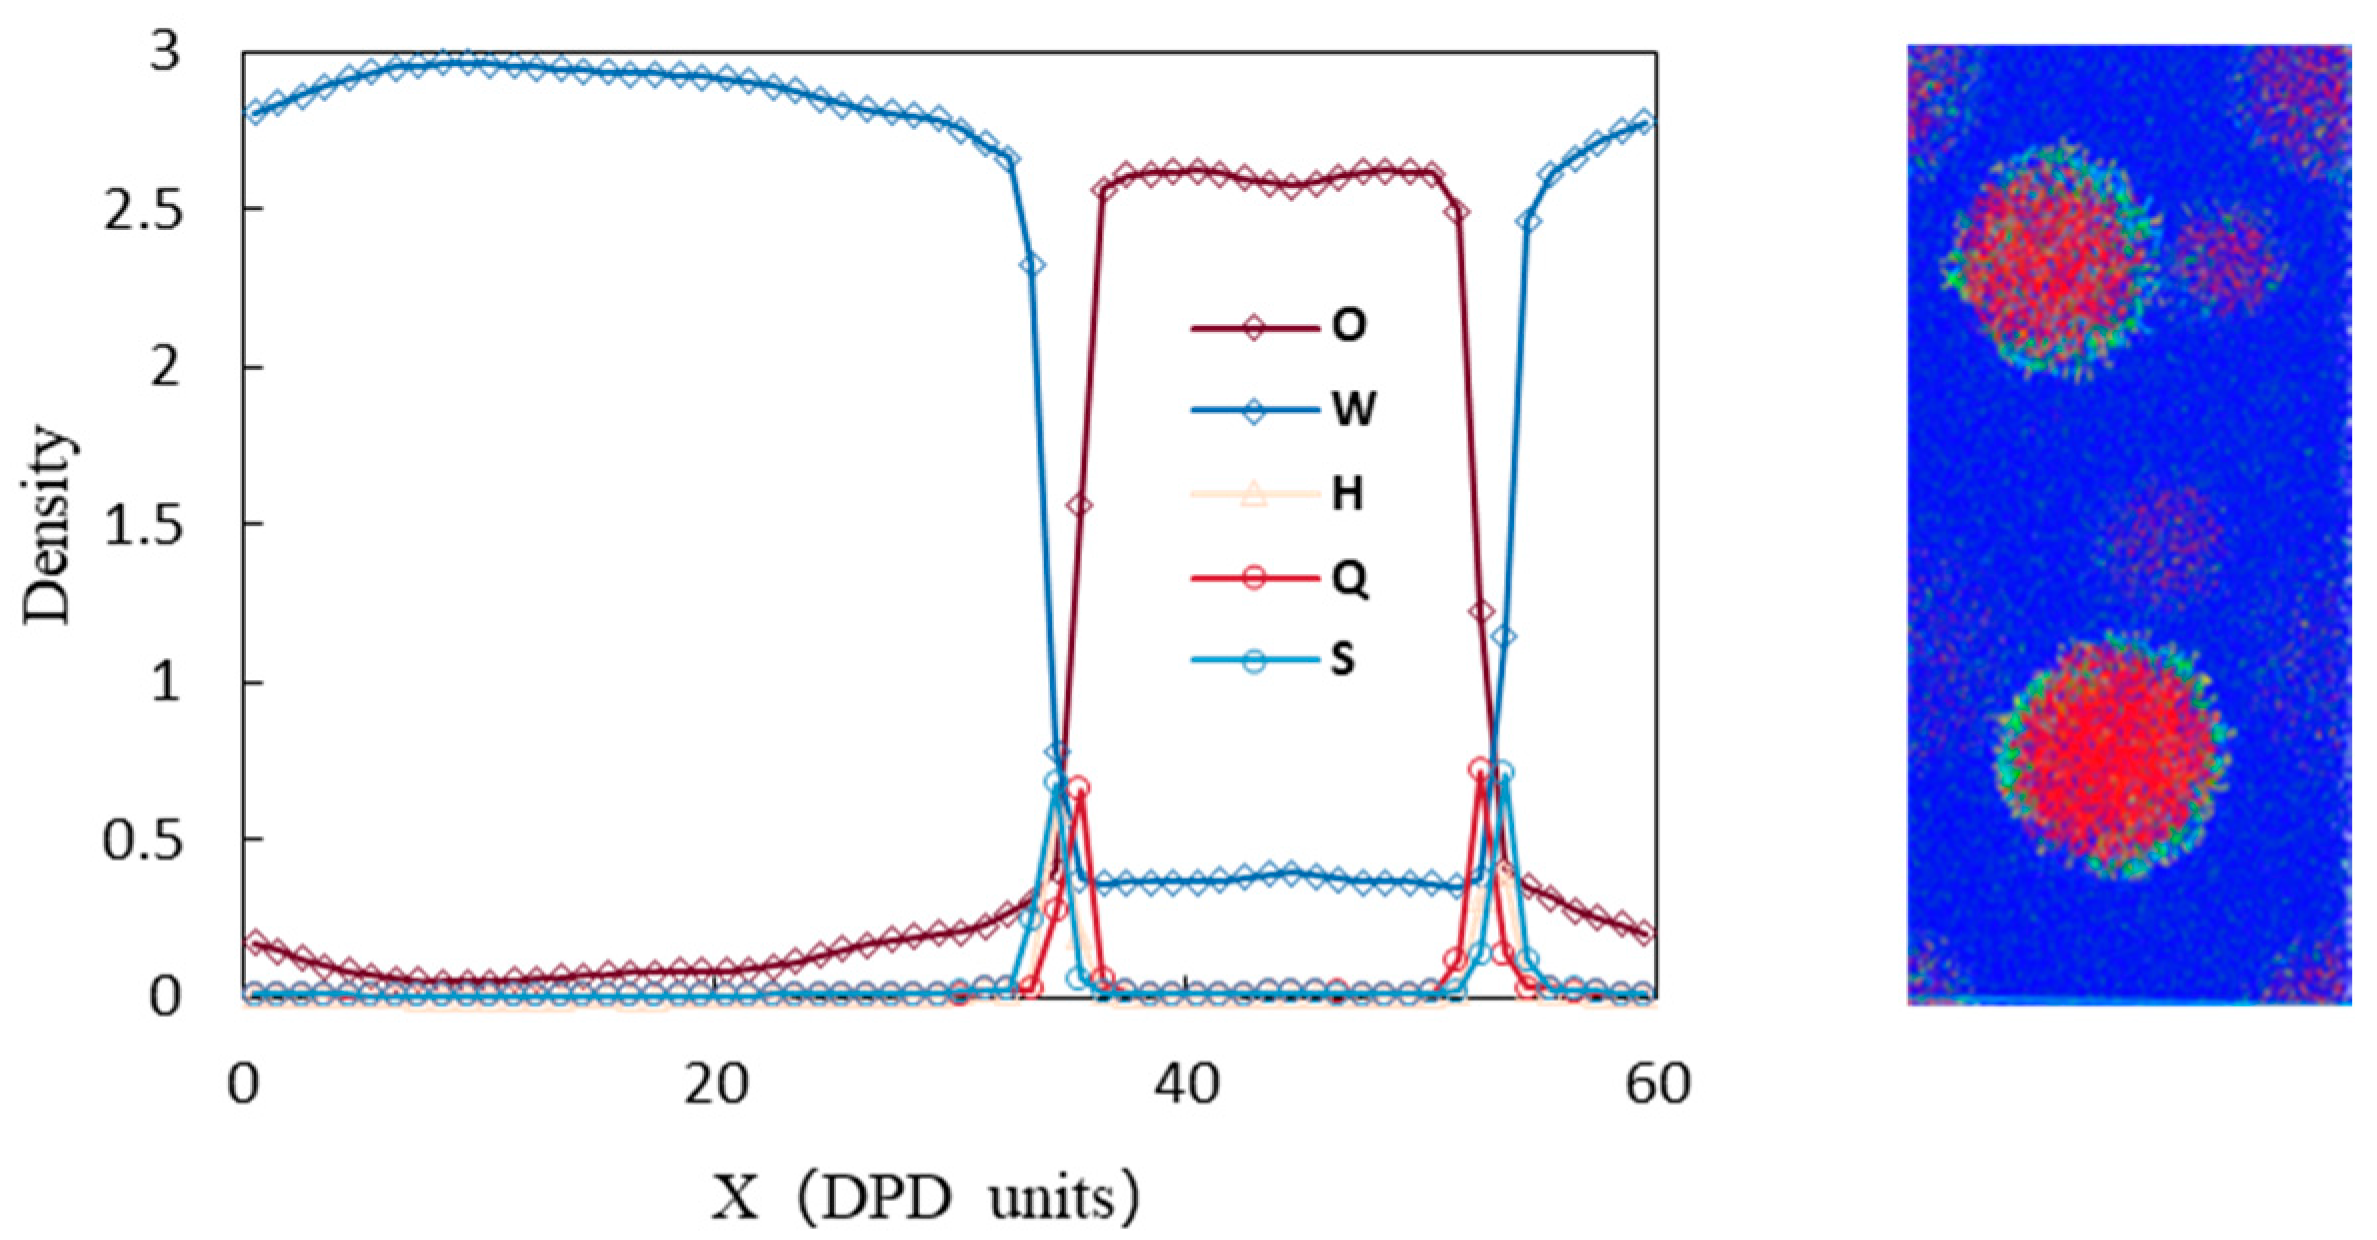
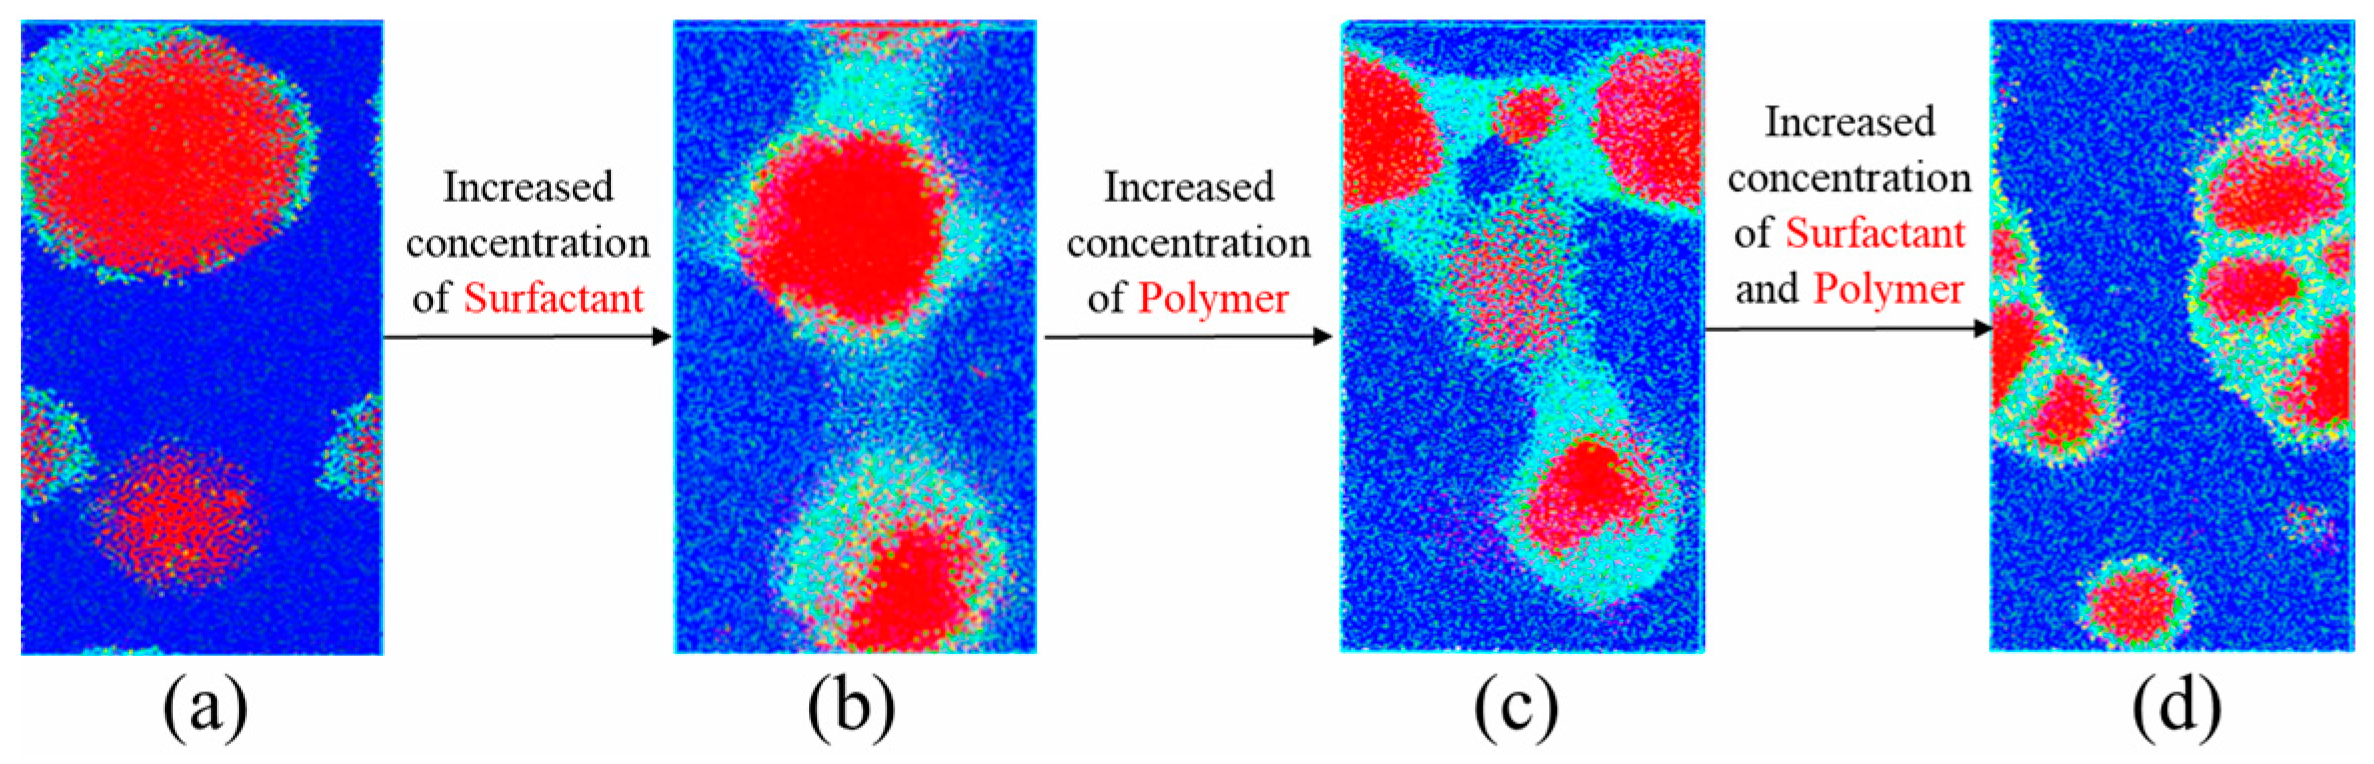
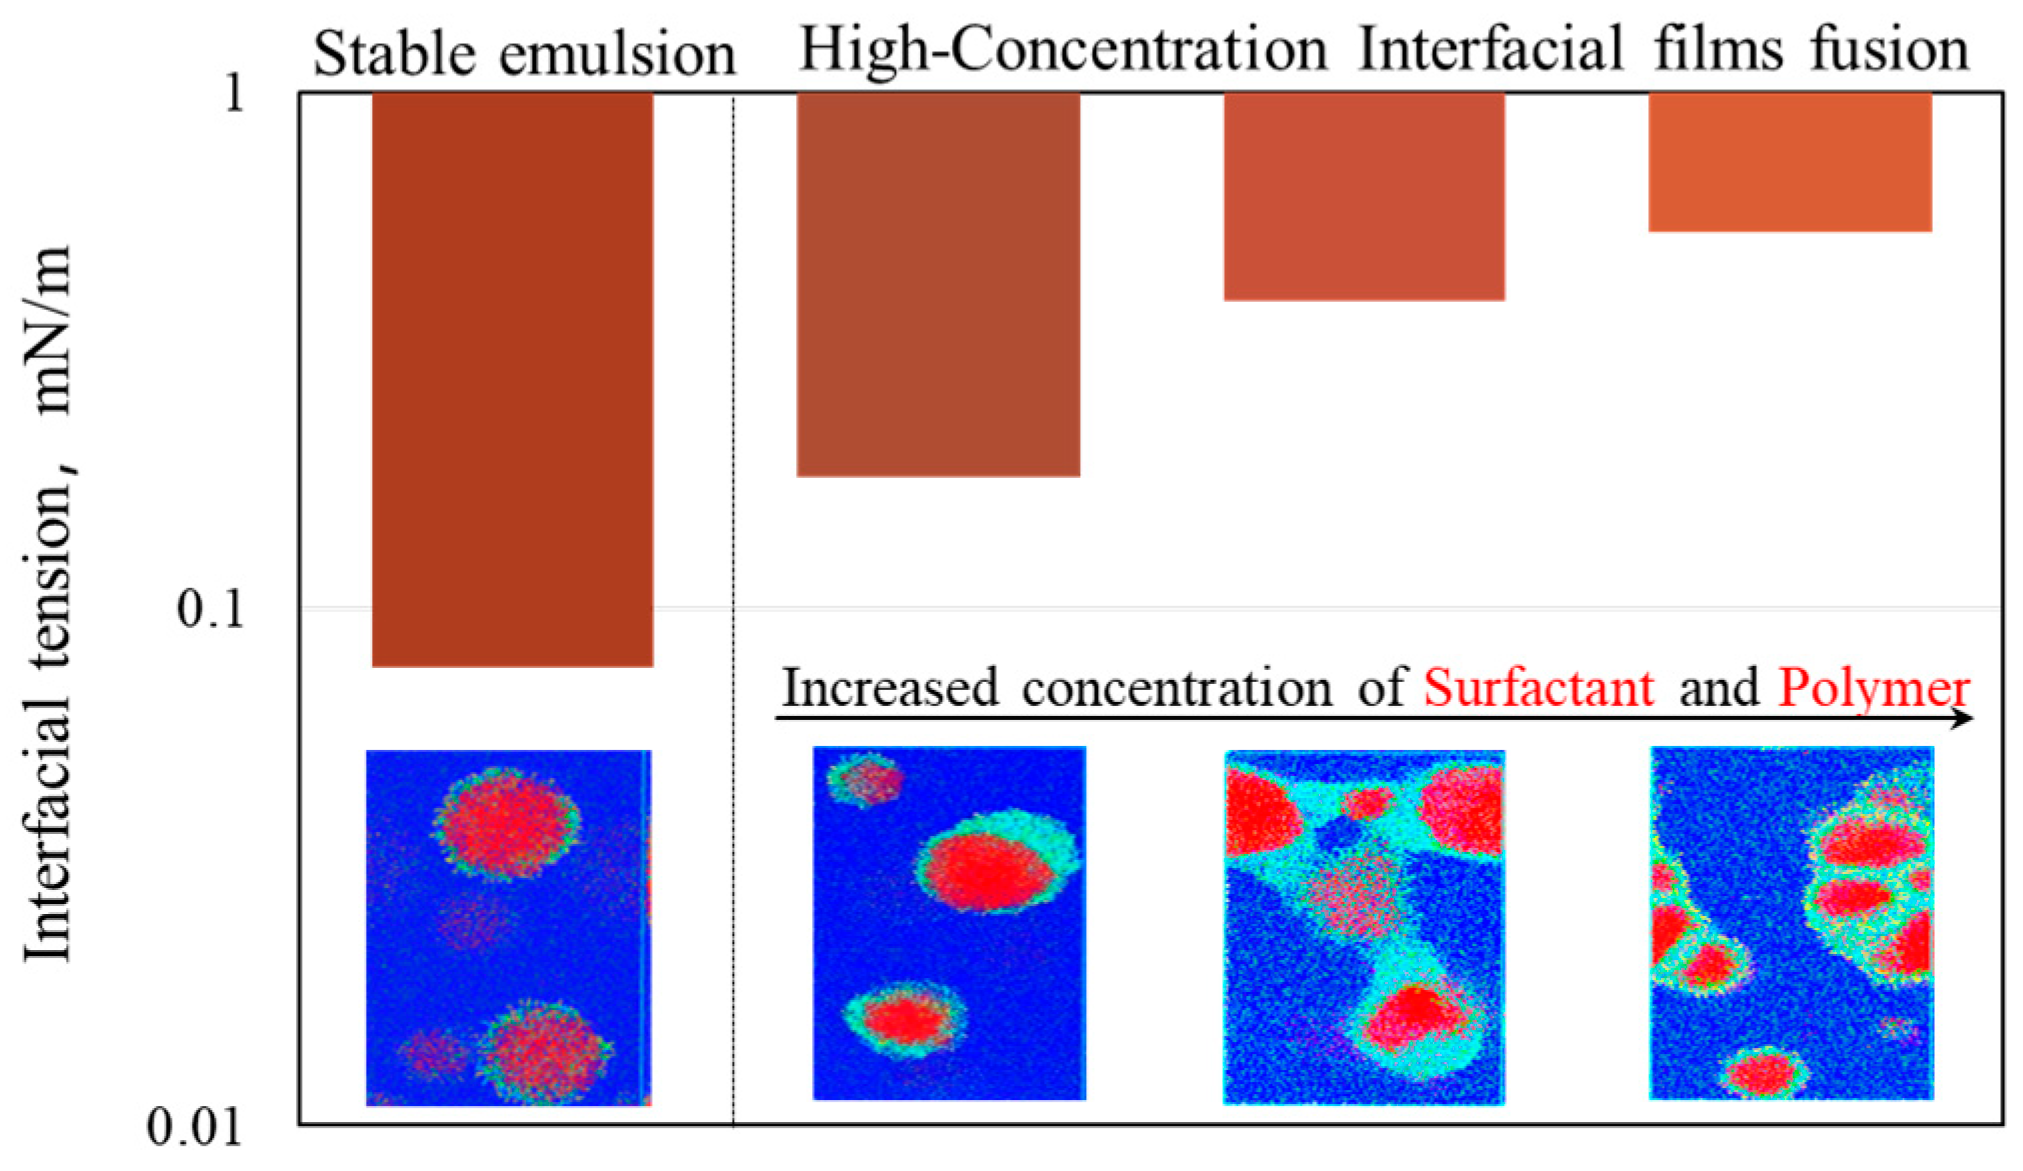
3.1. Analysis of Emulsification Behavior
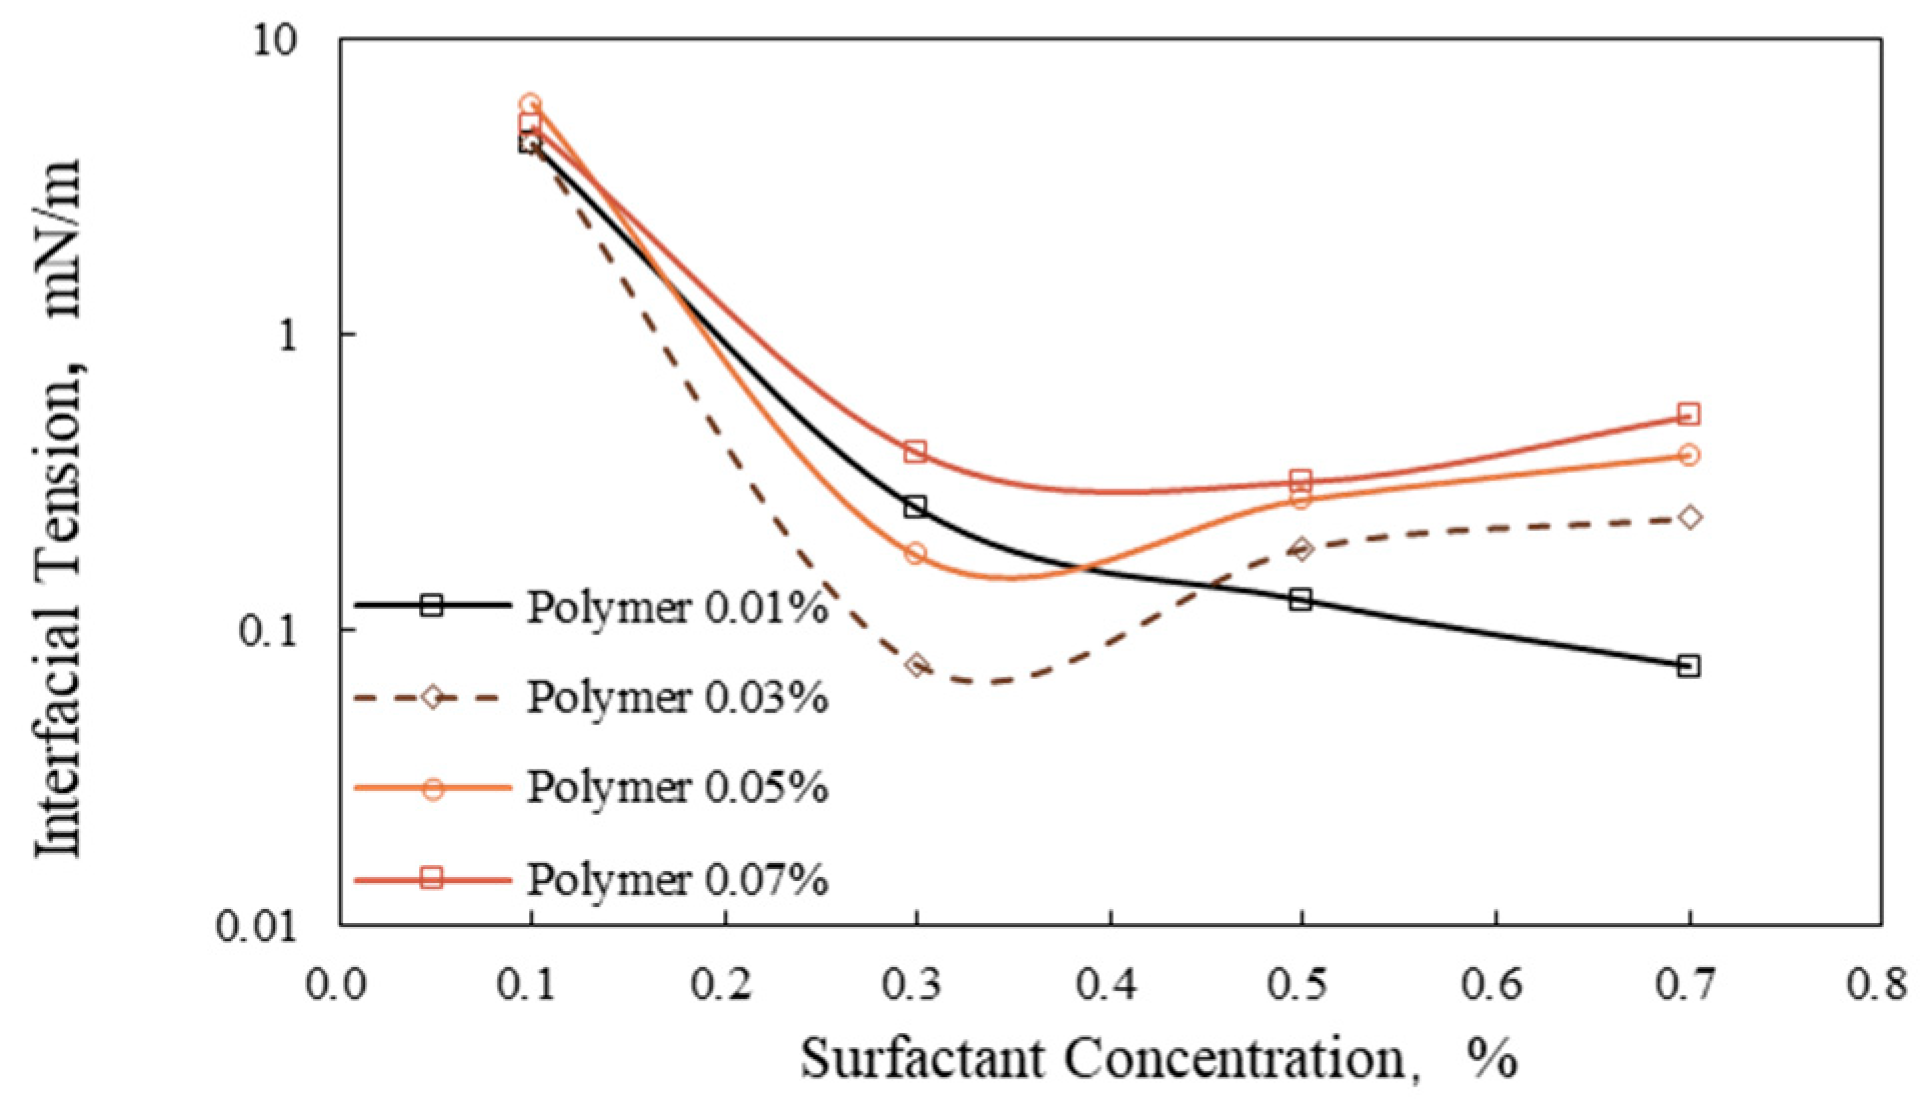
3.2. Interfacial Tension of Surfactant/Polymer Flooding
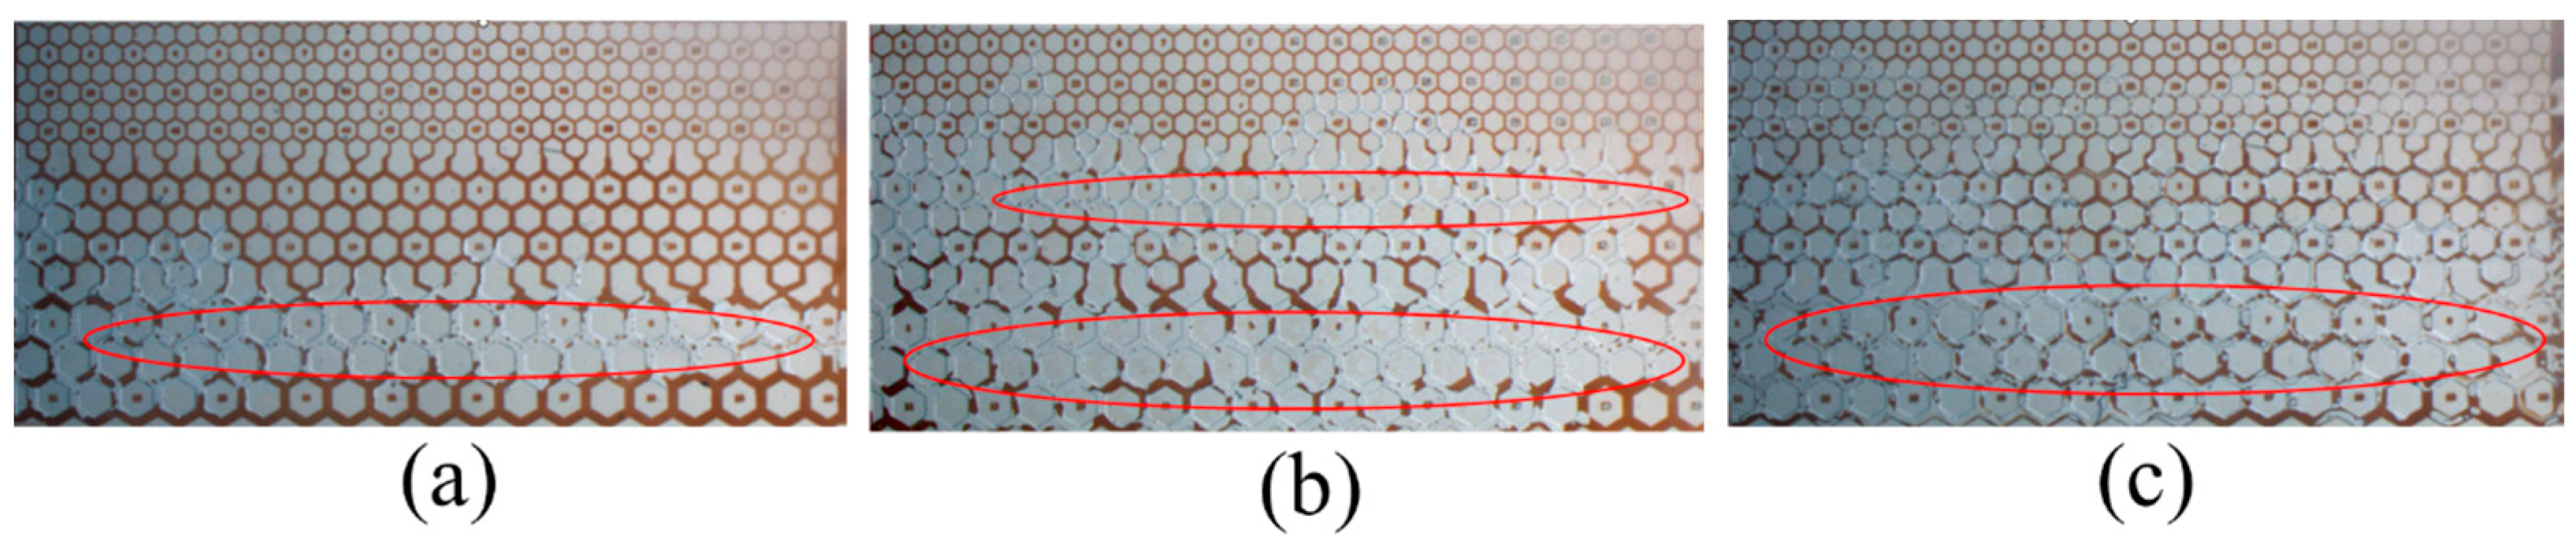
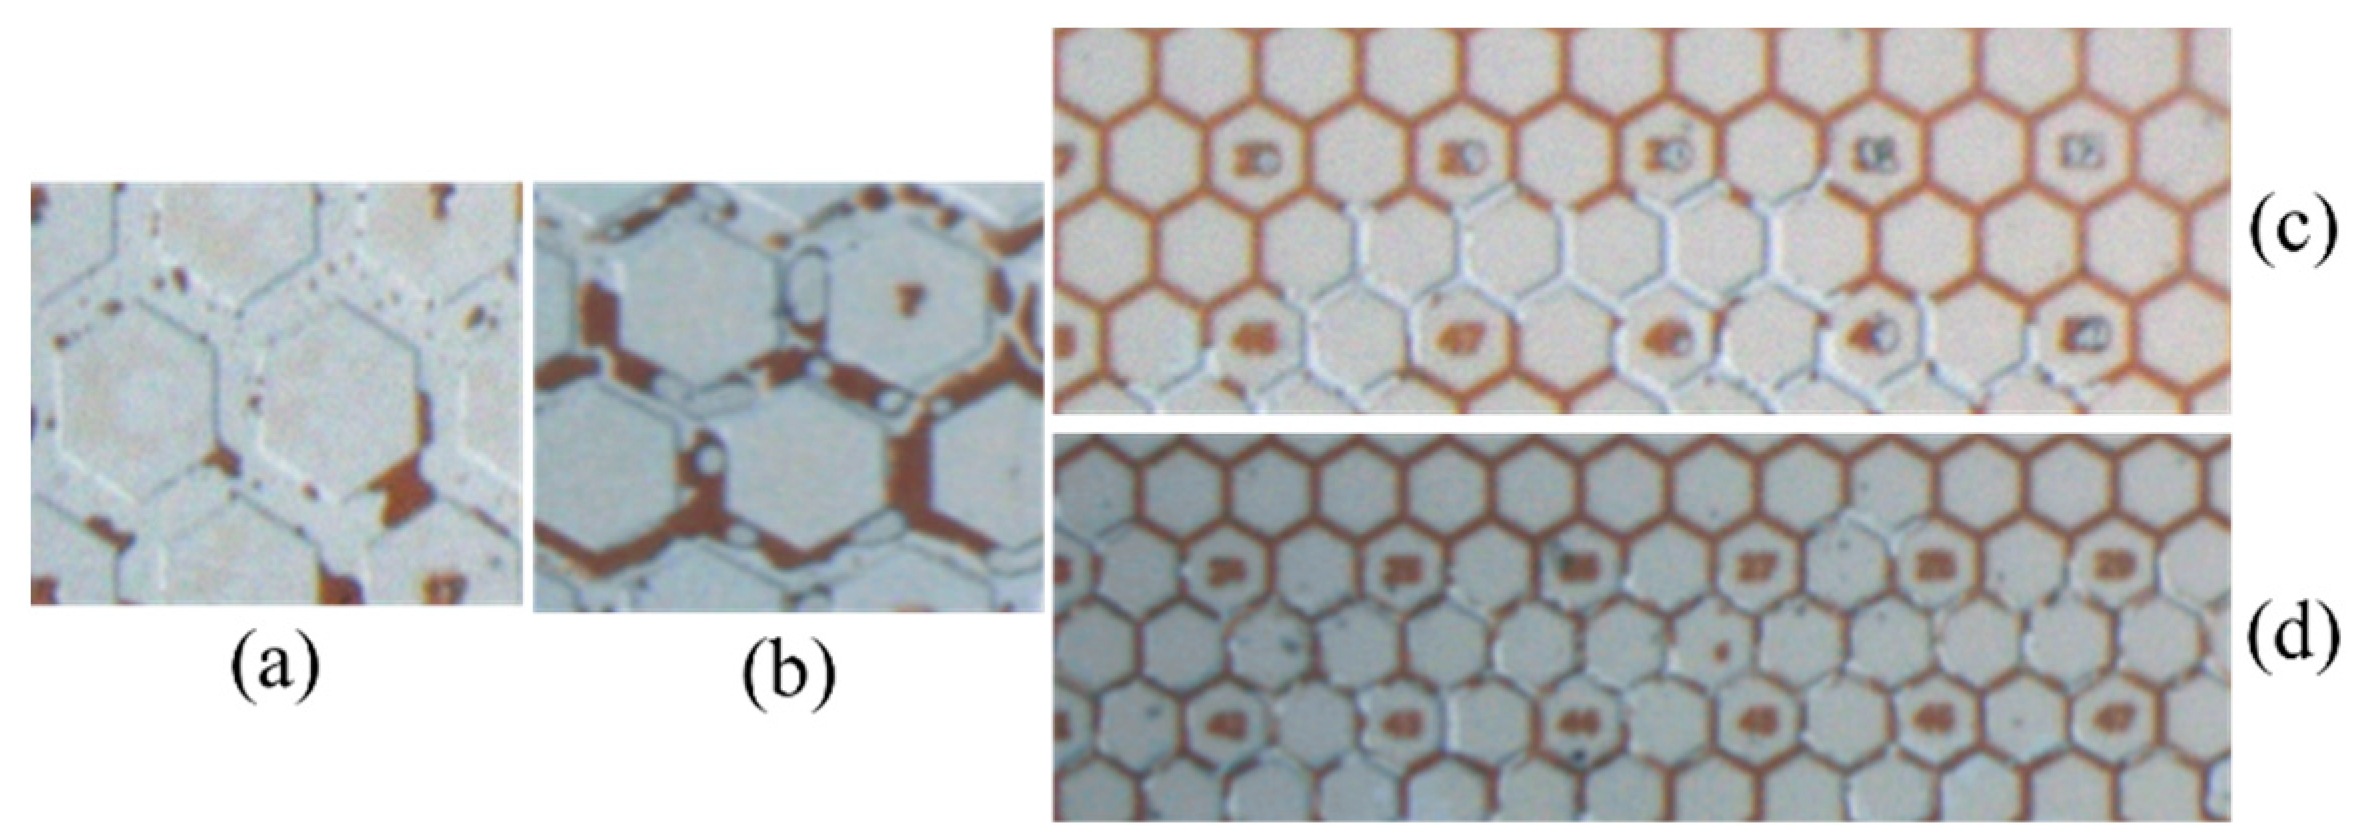
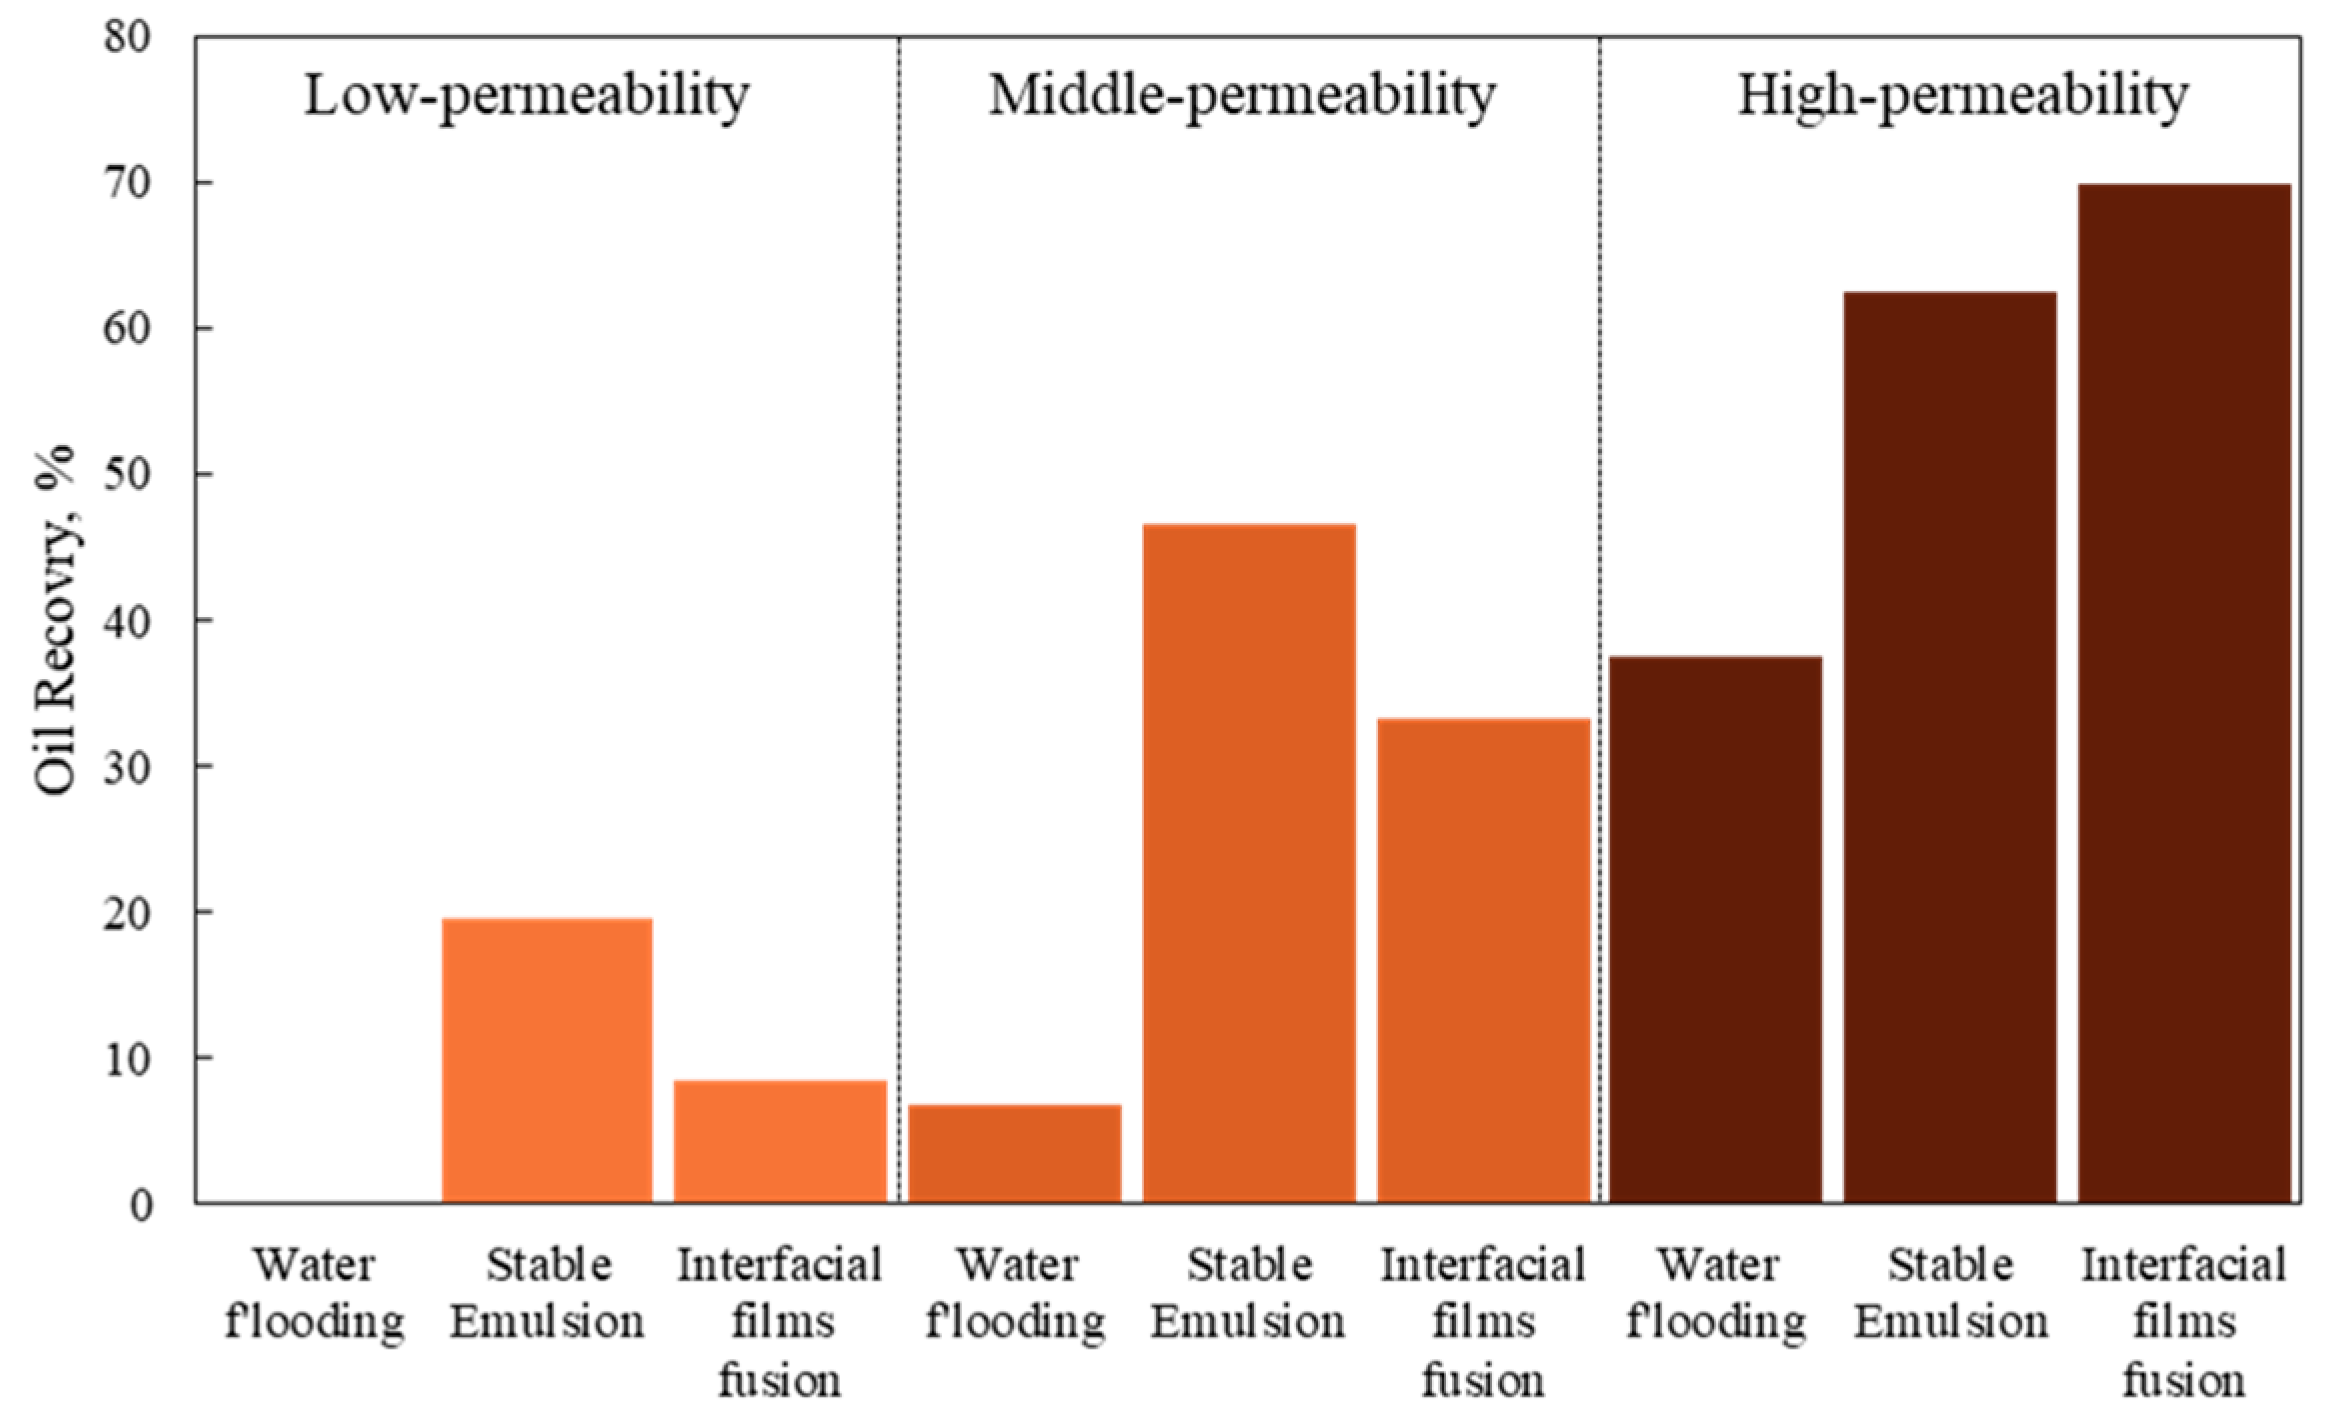
3.3. Emulsification and Oil Recovery in Microscale Experiments
4. Conclusions
Author Contributions
Funding
Data Availability Statement
Acknowledgments
Conflicts of Interest
References
- Abidin, A.; Puspasari, T.; Nugroho, W. Polymers for Enhanced Oil Recovery Technology. Procedia Chem. 2012, 4, 11–16. [Google Scholar] [CrossRef]
- Nazar, M.F.; Shah, S.S.; Khosa, M.A. Microemulsions in enhanced oil recovery: A review. Pet. Sci. Technol. 2011, 29, 1353–1365. [Google Scholar] [CrossRef]
- Pogaku, R.; Fuat, N.H.M.; Sakar, S.; Cha, Z.W.; Musa, N.; Tajudin, D.N.A.A. Polymer flooding and its combinations with other chemical injection methods in enhanced oil recovery. Polym. Bull. 2018, 75, 1753–1774. [Google Scholar] [CrossRef]
- Khormali, A.; Koochi, M.R.; Varfolomeev, M.A.; Ahmadi, S. Experimental study of the low salinity water injection process in the presence of scale inhibitor and various nanoparticles. J. Pet. Explor. Prod. Technol. 2022, 13, 903–916. [Google Scholar] [CrossRef]
- Pratama, R.A.; Babadagli, T. A review of the mechanics of heavy-oil recovery by steam injection with chemical additives. J. Pet. Sci. Eng. 2021, 208, 109717. [Google Scholar] [CrossRef]
- Tao, L.; Chen, Y.; Wang, Y.; Zhang, N.; Li, S.; Yang, Y.; Hu, Z. Optimization of hydrophilic SiO2/SDS dispersions in decentralized system: Experiments and RSM/CCD. J. Nanoparticle Res. 2022, 24, 138. [Google Scholar] [CrossRef]
- Tackie-Otoo, B.N.; Mohammed, M.A.A.; Yekeen, N.; Negash, B.M. Alternative chemical agents for alkalis, surfactants and polymers for enhanced oil recovery: Research trend and prospects. J. Pet. Sci. Eng. 2019, 187, 106828. [Google Scholar] [CrossRef]
- Sheng, J.J. A Comprehensive Review of Alkaline-Surfactant-Polymer (ASP) Flooding. Asia-Pac. J. Chem. Eng. 2014, 9, 471–489. [Google Scholar] [CrossRef]
- Yang, H.; Kang, W.; Yin, X.; Tang, X. A Low Elastic-microsphere/surfactant/polymer Combined Displacing Method after Polymer Flooding. In Proceedings of the SPE Kingdom of Saudi Arabia Annual Technical Symposium and Exhibition, Dammam, Saudi Arabia, 24–27 April 2017. [Google Scholar] [CrossRef]
- Louis, H.; Bauyrzhan, S.; Aziz, O.; Henri, B. Transport of polymer stabilized foams in porous media: Associative polymer versus pam. J. Pet. Ence Eng. 2018, 169, 602–609. [Google Scholar]
- Karnanda, W.; Benzagouta, M.S.; AlQuraishi, A.; Amro, M.M. Effect of temperature, pressure, salinity, and surfactant concentration on IFT for surfactant flooding optimization. Arab. J. Geosci. 2012, 6, 3535–3544. [Google Scholar] [CrossRef]
- Kurnia, I.; Zhang, G.; Han, X.; Yu, J. Zwitterionic-anionic surfactant mixture for chemical enhanced oil recovery without alkali. Fuel 2020, 259, 116236. [Google Scholar] [CrossRef]
- Clarke, A.; Howe, A.M.; Mitchell, J.; Staniland, J.; Hawkes, L.A. How Viscoelastic-Polymer Flooding Enhances Displacement Efficiency. SPE J. 2016, 21, 0675–0687. [Google Scholar] [CrossRef]
- Xia, H.; Pan, J.; Niu, L.; Xu, T. Mechanism research on starting residual oil migration in ASP flooding with different Alkali concentration. IOP Conf. Series: Earth Environ. Sci. 2018, 121, 022043. [Google Scholar] [CrossRef]
- AfzaliTabar, M.; Rashidi, A.; Alaei, M.; Koolivand, H.; Pourhashem, S.; Askari, S. Hybrid of quantum dots for interfacial tension reduction and reservoir alteration wettability for enhanced oil recovery (EOR). J. Mol. Liq. 2020, 307, 112984. [Google Scholar] [CrossRef]
- Lotfollahi, M.; Koh, H.; Li, Z.; Delshad, M.; Pope, G.A. Mechanistic Simulation of Residual Oil Saturation in Viscoelastic Polymer Floods. In Proceedings of the SPE EOR Conference at Oil and Gas West Asia, Muscat, Oman, 21–23 March 2016. [Google Scholar] [CrossRef]
- Erincik, M.Z.; Qi, P.; Balhoff, M.T.; Pope, G.A. New Method To Reduce Residual Oil Saturation by Polymer Flooding. SPE J. 2018, 23, 1944–1956. [Google Scholar] [CrossRef]
- Yuan, C.D.; Pu, W.F.; Wang, X.C.; Sun, L.; Zhang, Y.C.; Cheng, S. Effects of interfacial tension, emulsification, and sur-factant concentration on oil recovery in surfactant flooding process for high temperature and high salinity reservoirs. Energy Fuels 2015, 29, 6165–6176. [Google Scholar] [CrossRef]
- Dicharry, C.; Arla, D.; Sinquin, A.; Graciaa, A.; Bouriat, P. Stability of water/crude oil emulsions based on interfacial dila-tational rheology. J. Colloid Interface Sci. 2006, 297, 785–791. [Google Scholar] [CrossRef]
- Torrealba, V.A.; Hoteit, H. Conformance improvement in oil reservoirs by use of microemulsions. In Proceedings of the SPE Kingdom of Saudi Arabia Annual Technical Symposium and Exhibition, Dammam, Saudi Arabia, 23–26 April 2018. [Google Scholar]
- Yu, L.; Dong, M.; Ding, B.; Yuan, Y. Emulsification of heavy crude oil in brine and its plugging performance in porous media. Chem. Eng. Sci. 2018, 178, 335–347. [Google Scholar] [CrossRef]
- Alwi, N.B.; Salleh, I.K.B.; Ibrahim, J.M.; Carpenter, I.; Dyer, S.J.; Simpson, C.; Frigo, D.M.; Graham, G.M. Development of Improved Chemical Formulations for Scale Control for Alkaline Surfactant Polymer Flood in a Seawater Flooded Reservoir. In Proceedings of the Spe International Oilfield Scale Conference & Exhibition, Aberdeen, UK, 11–12 May 2016. [Google Scholar] [CrossRef]
- Yi, M.; Huang, J.; Wang, L. Research on crude oil demulsification using the combined method of ultrasound and chemical demulsifier. J. Chem. 2017, 2017, 9147926. [Google Scholar] [CrossRef]
- Phukan, M.; Koczo, K.; Falk, B.; Palumbo, A. New Silicon Copolymers for Efficient Demulsification. In Proceedings of the SPE Oil and Gas India Conference and Exhibition, Mumbai, India, 20–22 January 2010. [Google Scholar] [CrossRef]
- Tadros, T.; Vandamme, A.; Booten, K.; Levecke, B.; Stevens, C. Stabilisation of emulsions using hydrophobically modified inulin (polyfructose). Colloids Surfaces A: Physicochem. Eng. Asp. 2004, 250, 133–140. [Google Scholar] [CrossRef]
- Jiang, J.; Kang, X.; Wu, H.; Lu, Y.; Li, Z.; Xu, D.; Ma, T.; Yang, H.; Kang, W. Spontaneous emulsification induced by a novel surfactant-polymer compound system and its application to enhance oil recovery. J. Mol. Liq. 2021, 337, 116399. [Google Scholar] [CrossRef]
- Shi, W.; Xu, L.; Tao, L.; Zhu, Q.; Bai, J. Flow behaviors and residual oil characteristics of water flooding assisted by multi-effect viscosity reducer in extra heavy oil reservoir. Pet. Sci. Technol. 2022, 41, 1231–1249. [Google Scholar] [CrossRef]
- Nedjhioui, M.; Moulai-Mostefa, N.; Morsli, A.; Bensmaili, A. Combined effects of polymer/surfactant/oil/alkali on physical chemical properties. Desalination 2005, 185, 543–550. [Google Scholar] [CrossRef]
- Iyi, D.; Balogun, Y.; Oyeneyin, B.; Faisal, N. Numerical modelling of the effect of wettability, interfacial tension and tem-perature on oil recovery at pore-scale level. J. Pet. Sci. Eng. 2021, 201, 108453. [Google Scholar] [CrossRef]
- Førdedal, H.; Nodland, E.; Sjöblom, J.; Kvalheim, O.M. A Multivariate Analysis of W/O Emulsions in High External Electric Fields as Studied by Means of Dielectric Time Domain Spectroscopy. J. Colloid Interface Sci. 1995, 173, 396–405. [Google Scholar] [CrossRef]
- Pei, H.; Zhang, G.; Ge, J.; Jiang, P.; Zhang, J.; Zhong, Y. Study of polymer-enhanced emulsion flooding to improve viscous oil recovery in waterflooded heavy oil reservoirs. Colloids Surfaces A Physicochem. Eng. Asp. 2017, 529, 409–416. [Google Scholar] [CrossRef]
- Zimmerman, M.I.; Porter, J.R.; Ward, M.D.; Singh, S.; Bowman, G.R. SARS-CoV-2 simulations go exascale to predict dramatic spike opening and cryptic pockets across the proteome. Nat. Chem. 2021, 13, 651–659. [Google Scholar] [CrossRef] [PubMed]
- Fu, L.; Gu, F.; Liao, K.; Wen, X.; Huang, W.; Li, X.; Ren, Z.; Xie, L. Application of molecular simulation in tertiary oil recovery: A systematic review. J. Pet. Sci. Eng. 2022, 212, 110196. [Google Scholar] [CrossRef]
- Hoogerbrugge, P.J.; Koelman, J.M.V.A. Simulating Microscopic Hydrodynamic Phenomena with Dissipative Particle Dynamics. EPL Europhys. Lett. 1992, 19, 155–160. [Google Scholar] [CrossRef]
- Ruiz-Morales, Y.; Mullins, O.C. Coarse-Grained Molecular Simulations to Investigate Asphaltenes at the Oil–Water Interface. Energy Fuels 2015, 29, 1597–1609. [Google Scholar] [CrossRef]
- Lin, S.L.; Xu, M.Y.; Yang, Z.R. Dissipative particle dynamics study on the mesostructures of n-octadecane/water emulsion with alternating styrene–maleic acid copolymers as emulsifier. Soft Matter 2011, 8, 375–384. [Google Scholar] [CrossRef]
- Noid, W.G. Perspective: Coarse-grained models for biomolecular systems. J. Chem. Phys. 2013, 139, 090901. [Google Scholar] [CrossRef]
- Bian, X.; Litvinov, S.; Qian, R.; Ellero, M.; Adams, N.A. Multiscale modeling of particle in suspension with smoothed dis-sipative particle dynamics. Phys. Fluids 2012, 24, 147. [Google Scholar] [CrossRef]
- Mayoral, E.; Goicochea, A.G. Modeling the temperature dependent interfacial tension between organic solvents and water using dissipative particle dynamics. J. Chem. Phys. 2013, 138, 094703. [Google Scholar] [CrossRef]
- Alvarez, F.; Flores, E.A.; Castro, L.V.; Hernández, J.G.; López, A.; Vázquez, F. Dissipative Particle Dynamics (DPD) Study of Crude Oil−Water Emulsions in the Presence of a Functionalized Co-polymer. Energy Fuels 2010, 25, 562–567. [Google Scholar] [CrossRef]
- Al-Shalabi, E.W.; Ghosh, B. Effect of Pore-Scale Heterogeneity and Capillary-Viscous Fingering on Commingled Waterflood Oil Recovery in Stratified Porous Media. J. Pet. Eng. 2016, 2016, 1–14. [Google Scholar] [CrossRef]
- Jamaloei, B.Y.; Asghari, K.; Kharrat, R.; Ahmadloo, F. Pore-scale two-phase filtration in imbibition process through porous media at high- and low-interfacial tension flow conditions. J. Pet. Sci. Eng. 2010, 72, 251–269. [Google Scholar] [CrossRef]
- Meybodi, H.E.; Kharrat, R.; Araghi, M.N. Experimental studying of pore morphology and wettability effects on micro-scopic and macroscopic displacement efficiency of polymer flooding. J. Pet. Sci. Eng. 2011, 78, 347–363. [Google Scholar] [CrossRef]
- Mingtsung, L.; Runfang, M.; Aleksey, V.; Neimark, A.V. Parametrization of chain molecules in dissipative particle dynamics. J. Phys. Chem. B 2016, 120, 4980. [Google Scholar]
- Steinmetz, D.; González, K.R.A.; Lugo, R.; Verstraete, J.; Lachet, V.; Mouret, A.; Creton, B.; Nieto-Draghi, C. Experimental and Mesoscopic Modeling Study of Water/Crude Oil Interfacial Tension. Energy Fuels 2021, 35, 11858–11868. [Google Scholar] [CrossRef]
- Koelman, J.M.V.A.; Hoogerbrugge, P.J. Dynamic Simulations of Hard-Sphere Suspensions Under Steady Shear. EPL Europhys. Lett. 1993, 21, 363–368. [Google Scholar] [CrossRef]
- Groot, R.D.; Madden, T.J. Dynamic simulation of diblock copolymer microphase separation. J. Chem. Phys. 1998, 108, 8713–8724. [Google Scholar] [CrossRef]
- Groot, R.D.; Warren, P.B. Dissipative particle dynamics: Bridging the gap between atomistic and mesoscopic simulation. J. Chem. Phys. 1997, 107, 4423–4435. [Google Scholar] [CrossRef]
- Shi, K.; Lian, C.; Bai, Z.; Zhao, S.; Liu, H. Dissipative particle dynamics study of the water/benzene/caprolactam system in the absence or presence of non-ionic surfactants. Chem. Eng. Sci. 2015, 122, 185–196. [Google Scholar] [CrossRef]
- Quann, R.; Jaffe, S. Building useful models of complex reaction systems in petroleum refining. Chem. Eng. Sci. 1996, 51, 1615–1635. [Google Scholar] [CrossRef]
- Meng, S.; Zhang, J.; Wu, C.; Zhang, Y.; Xiao, Q.; Lu, G. Dissipative particle dynamics simulations of surfactant CTAB in ethanol/water Mixture. Mol. Simul. 2013, 40, 1052–1058. [Google Scholar] [CrossRef]
- Jamali, S.; Boromand, A.; Khani, S.; Wagner, J.; Yamanoi, M.; Maia, J. Generalized mapping of multi-body dissipative particle dynamics onto fluid compressibility and the Flory-Huggins theory. J. Chem. Phys. 2015, 142, 164902. [Google Scholar] [CrossRef]
- Keaveny, E.E.; Pivkin, I.G.; Maxey, M.; Karniadakis, G.E. A comparative study between dissipative particle dy-namics and molecular dynamics for simple- and complex-geometry flows. J. Chem. Phys. 2005, 123, 104107. [Google Scholar] [CrossRef]
- Santo, K.P.; Neimark, A.V. Dissipative particle dynamics simulations in colloid and Interface science: A review. Adv. Colloid Interface Sci. 2021, 298, 102545. [Google Scholar] [CrossRef]
- Maiti, A.; Mcgrother, S. Bead–bead interaction parameters in dissipative particle dynamics: Relation to bead-size, solubility parameter, and surface tension. J. Chem. Phys. 2004, 120, 1594–1601. [Google Scholar] [CrossRef]
- Rezaei, H.; Modarress, H. Dissipative particle dynamics (DPD) study of hydrocarbon–water interfacial tension (IFT). Chem. Phys. Lett. 2015, 620, 114–122. [Google Scholar] [CrossRef]
- Zhang, D.; Shangguan, Q.; Wang, Y. An easy-to-use boundary condition in dissipative particle dynamics system. Comput. Fluids 2018, 166, 117–122. [Google Scholar] [CrossRef]
- Paredes, R.; Fariñas-Sánchez, A.I.; Medina-Rodríguez, B.; Samaniego, S.; Aray, Y.; Álvarez, L.J. Dynamics of Surfactant Clustering at Interfaces and Its Influence on the Interfacial Tension: Atomistic Simulation of a Sodium Hexadecane–Benzene Sulfonate–Tetradecane–Water System. Langmuir 2018, 34, 3146–3157. [Google Scholar] [CrossRef] [PubMed]


| Molecule | Bead Type | Molecule Structure | Molecule Dynamics Model | Coarse-grained Model |
|---|---|---|---|---|
| H2O | W |  |  |  |
| PAM | H |  |  |  |
| Oil | O |  |  |  |
| Surfactant (Pro-oil base group) | Q |  | 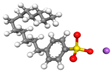 |  |
| Surfactant (Hydrophilic group) | S | 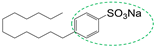 |
| Field Parameters (Reduce Type) | O | W | H | Q | S |
|---|---|---|---|---|---|
| O | 25.45 | ||||
| W | 161.6 | 25.82 | |||
| H | 102.4 | 78.24 | 27.62 | ||
| Q | 26.15 | 151.72 | 32.54 | 25 | |
| S | 148.73 | 25.93 | 26.56 | 177.3 | 25 |
Disclaimer/Publisher’s Note: The statements, opinions and data contained in all publications are solely those of the individual author(s) and contributor(s) and not of MDPI and/or the editor(s). MDPI and/or the editor(s) disclaim responsibility for any injury to people or property resulting from any ideas, methods, instructions or products referred to in the content. |
© 2023 by the authors. Licensee MDPI, Basel, Switzerland. This article is an open access article distributed under the terms and conditions of the Creative Commons Attribution (CC BY) license (https://creativecommons.org/licenses/by/4.0/).
Share and Cite
Zhang, B.; Guan, B.; Liu, W.; Peng, B.; Cong, S. Dissipative Particle Dynamics Simulation and Microscopic Experimental Study of Emulsification Performance of Surfactant/Polymer Flooding. Processes 2023, 11, 1411. https://doi.org/10.3390/pr11051411
Zhang B, Guan B, Liu W, Peng B, Cong S. Dissipative Particle Dynamics Simulation and Microscopic Experimental Study of Emulsification Performance of Surfactant/Polymer Flooding. Processes. 2023; 11(5):1411. https://doi.org/10.3390/pr11051411
Chicago/Turabian StyleZhang, Biao, Baoshan Guan, Weidong Liu, Baoliang Peng, and Sunan Cong. 2023. "Dissipative Particle Dynamics Simulation and Microscopic Experimental Study of Emulsification Performance of Surfactant/Polymer Flooding" Processes 11, no. 5: 1411. https://doi.org/10.3390/pr11051411