Article

Pore Structure and Fractal Characteristics of Marine–Continental Transitional Black Shales: A Case Study of the Permian Shanxi Formation in the Eastern Margin of the Ordos Basin

1
School of Resource and Environment, Yangtze University, Wuhan 430100, China
2
Dongsheng Company of China Petrochemical Shengli Oilfield, Dongying 257100, China
3
School of Geosciences, Yangtze University, Wuhan 430100, China
4
PetroChina Research Institute of Petroleum Exploration & Development, Beijing 100083, China
*
Authors to whom correspondence should be addressed.
Processes 2023, 11(5), 1424; https://doi.org/10.3390/pr11051424
Submission received: 8 April 2023 / Revised: 26 April 2023 / Accepted: 6 May 2023 / Published: 8 May 2023

Abstract

:
To study the microscopic pore characteristics of marine–continental transitional shale, we studied the Daning–Jixian block of the Shanxi Formation using low-pressure CO2 adsorption (LP-CO2A) and low-temperature N2 adsorption (LT-N2A) methods in conjunction with field emission scanning electron microscopy (FE-SEM), geochemistry, and mineral composition analysis in order to obtain pore structure characteristic parameters. The fractal dimension of the pores was calculated using the Frankel–Halsey–Hill (FHH) model, and the study also discusses the factors that influence the pore structure. The study found that the marine–continental transitional phase shale of the Shanxi Formation has clay mineral contents ranging from 36.24% to 65.21%. The total organic carbon (TOC) contents range from 0.64% to 9.70%. Additionally, the organic matter maturity is high. The FE-SEM and gas adsorption experiments revealed that the transitional shale of the Shanxi Formation possesses a diverse range of pore types with relatively large pore sizes. The dominant pore types are organic and intragranular pores, with pore morphologies predominantly appearing as slit and parallel plate structures. According to the experimental data on gas adsorption, the total SSA values range from 11.126 to 47.220 m2/g. The total PV values range from 0.014 to 0.056 cm3/g. Micropores make up a greater proportion of the total SSA, whereas mesoporous pores make up a greater proportion of the total PV. The distribution of shale pore fractal dimensions D1 and D2 (D1 is 2.470 to 2.557; D2 is 2.531 to 2.755), obtained through LT-N2A data, is relatively concentrated. D1 and D2 have a positive correlation with the TOC content, clay mineral content, and BET-SSA, and D1 and D2 have a negative correlation with the quartz content. D2 is positively correlated with the Langmuir volume, showing that D2 can be used to evaluate the methane adsorption capacity.

1. Introduction

Since 2000, the shale gas industry has experienced rapid development on a global scale [1]. China has achieved successful commercialization of marine shale gas exploration and development in the Sichuan Basin and its surrounding regions [2]. Several shale gas fields, including Fuling, Changning, and Weiyuan, have been discovered to date, with shale gas production in China expected to reach almost 240 × 108 m3 by 2022 [3]. Marine–continental transitional shale is widely distributed across a large geographic region in China, and its recoverable resources make up approximately 18% of the country’s total recoverable shale gas resources [2,3]. Marine–continental transitional shale is widely distributed and covers a large area. Recoverable resources account for 18% of the total recoverable resources of shale gas in China, and it is an important replacement field for future shale gas exploration [4]. Shale is a heterogeneous porous material with a complex pore structure that includes a range of pore types, a broad range in pore size, and a continuous distribution of microscopic pores that are between nanometres and microns in size and are linked to macroscopic pores [5,6]. The size, shape, and structure of the pores in shales influence how rough they are, which, in turn, impacts how gas is produced in the mud shale and how it is adsorbed and desorbed [7]. Studying pore structure characteristics is helpful for exploring the adsorption characteristics and occurrence mode of gas in shale, and it is also a crucial part of shale reservoir evaluation [8].
The main objective of shale gas assessment is the precise characterization of the shale pore structure [9]. Several studies on the geographical characterization of shale reservoirs have been conducted by forerunners, and the primary technological tools employed in these studies include image analysis, the fluid intrusion technique, and the radiation detection method [10,11]. Imaging techniques utilized in image analysis include optical microscope (OM) observation, scanning electron microscope (SEM) analysis, helium ion microscope (HIM) analysis, atomic force microscope (AFM) analysis, transmission electron microscope (TEM) analysis, etc. These techniques are mostly used to observe the types and shapes of shale pores, as well as their connectivity and distribution [11,12,13,14,15]. Fluid intrusion techniques mainly include adsorption techniques (LT-N2A, LP-CO2A) and the high-pressure mercury injection (HPMI) method, which can quantitatively characterize the pore size distribution (PSD), specific surface area (SSA), pore volume (PV), and pore structure of shale [15,16,17,18]. The spatial distribution characteristics of the porosity and mineral composition inside shales are often obtained using small-angle neutron scattering (SANS), computed tomography (CT), nuclear magnetic resonance (NMR), small-angle X-ray scattering (SAXS), and other radiation detection methods. As a result of using these methods, qualitative descriptions of shale pore genesis, connectivity, and pore density may be compiled [19,20,21,22,23]. The measurements of the pore complexity and inhomogeneity of shale reservoirs is also performed using fractal theory as a method and approach [24]. Fractal theory, however, is mostly employed in conjunction with the pore measurement techniques stated above, and it cannot be used as a standalone pore characterization technique; rather, it is an addition to pore research techniques [25].
Fractal dimension calculation methods mainly include the particle size method, the FHH model method, the BET model method, and the thermodynamic method, and its value, D, is usually used to evaluate the roughness and complexity of shale pore surfaces and structures [25,26]. The fractal dimension is between two and three, and the larger the D value is, the stronger the roughness and complexity of the pore surface [26,27]. Previous studies on shale pore space have primarily focused on marine shales, as China is currently exploring and developing mainly for southern marine organic-rich shales [28]. Clarkson et al. (2013) conducted a comprehensive study on the pore structure characteristics of typical shale gas reservoirs in North America, and the study utilized LT-N2A, HPMI, and SANS to obtain information on pore geometry characteristics, pore size distribution, pore connectivity, and other relevant data [29]. Chen et al. (2012), Tian et al. (2012), Wang et al. (2015), and Yang et al. (2016) studied the pore structure characteristics of the black organic-rich shales of the marine Niutitang Formation, Wufeng–Longmaxi Formation, transitional Dalong Formation, and lacustrine Shahejie Formation in South China by using LT-N2A, LP-CO2A and HPMI, and they found that these shales developed abundant nanoscale pores, with pore sizes mainly ranging from 2 nm to 50 nm. The SSA is positively correlated with micropores, while the PV is mainly provided by mesopores. The fractal dimension of the shale is calculated by the FHH model. The results show that the black organic-rich shale of the Niutitang Formation and Wufeng–Longmaxi Formation has surface fractal characteristics, indicating that the PV and pore surface heterogeneity are strong, which is conducive to the adsorption of a large amount of gas [30,31,32,33]. Zhang et al. (2018) studied the pore fractal characteristics of the Longtan Formation shale in northwest Guizhou and concluded that the pore heterogeneity and fractal dimension of the marine–continental transitional shale are generally large. When D2 is greater than 2.8, the gas adsorption capacity is strong [34]. Huang et al. (2020) concluded that the organic matter and clay mineral contents are the main factors affecting the pore structure of marine–continental transitional shale by comparing the pore difference between marine–continental transitional shale and marine shale in Guizhou [35]. Previous research on shales in the transitional phase between marine and continental environments has been limited, particularly in terms of quantitatively characterizing the pore structure complexity and influential factors.
The Permian Shanxi Formation in the eastern margin of the Ordos Basin contains a set of shales that transition between marine and continental depositional environments, and, thus, it has good prospects for exploration and development [36]. However, there are relatively few studies on the pore structure characteristics and factors influencing transitional shales in the Shanxi Formation in the eastern margin of the Ordos Basin. This study uses the marine–continental transitional black shale of the Shanxi Formation in the Ordos Basin as its primary research subject. Using LT-N2A and LP-CO2A experiments, as well as FE-SEM, XRD, and associated geochemical experiments, the pore structure of the transitional shales of the Shanxi Formation is described qualitatively and quantitatively, and the fractal dimension of shales is calculated by using the FHH model. This paper focuses on the relationship between the pore structure parameters and fractal dimension; the relationship between the pore structure parameters and TOC and shale mineral components; and the relationship between the TOC, shale mineral components, and shale adsorption capacity and fractal dimension in order to provide references for the optimization of favourable areas and resource potential evaluation of transitional shale reservoirs in the study area, which has important theoretical and practical value.

2. Geological Setting

The research area’s Ordos Basin, which has an area of over 25 × 104 km2, is situated on the North China platform and has abundant coal, oil, and gas resources. It is a large multicycle cratonic basin formed by the superposition of a Palaeozoic platform, platform margin depression, and Meso–Cenozoic intraplatform depression [36,37]. Located on the southeast margin of the Yishan Slope of the Ordos Basin, the study area is part of the Jinxi flexural belt, which consists of one depression, two slope belts and one anticlinal belt (Figure 1a) [38]. Due to multistage epigenetic transgression, the Daning–Jixian block overall is a transitional environment between marine and continental environments, and shale resulting from the transition between marine and continental environments is present [39]. The Shanxi Formation in the study area consists of two submembers, the Shan1 member and Shan2 member. The Shan1 member mainly has grey sandstone and dark grey mudstone, and the coal seam is developed locally. On the other hand, the second member of the Shan Formation contains dark shale, grey sandstone, and a local coal seam [37]. From the bottom up, Shan2 can be divided into Shan23, Shan22, and Shan21 (Figure 1b). The thickness of the Shan2 shale monolayer is larger than that of the Shan1 shale monolayer, which is characterized by a stable transverse distribution, good sedimentary continuity, few thin intercalations, etc. It is the primary horizon for shale gas production in the marine–continental transitional deposit [39,40].

3. Samples and Methods

3.1. Samples

All of the samples for this research came from drill cores of the Permian Shanxi Formation’s marine–continental transitional shale on the eastern edge of the Ordos Basin. Vertically, the shale samples are scattered in Shan23 (Figure 1b). The lithology is mainly black organic-rich shale, which is distributed at depths of 2120~2170 m.

3.2. Organic Petrography and Mineralogy

The TOC contents in 12 samples were determined by a LECO CS-230 carbon–sulfur analyser produced by Leco Co., LTD (St. Joseph, USA). Before the experiment began, the samples were crushed in an agate mortar to more than 200 mesh, dried at 80 °C for 8 h, soaked in sufficient hydrochloric acid for 24 h, and then rinsed with distilled water until completely neutral. The neutral samples were dried by being heated at a low temperature. The GB/T 19145-2003 standard was strictly implemented.
Vitrinite reflectance is often assessed using the optical approach, which is carried out by microscopic examination of the kerogen and examination of the reflectance of the particles by a photomultiplier. The SY/T 5124-2012 standard was strictly implemented.
By using XRD, the whole-rock mineral content and composition were identified. The experimental instrument was a multifunctional XRD produced by Bruker, Germany, model D8 ADVANCE. The test instrument used a Cu target. Before the experiment, an agate grinder was used to grind the shale samples after low-temperature drying and sieving through 200 mesh, and the sample mass was adjusted to be more than 0.5 g. The test was carried out at room temperature. The voltage and current of the instrument were set to 40 kV and 5 mA, respectively, during the experiment. The SY/T 5163-2018 standard was strictly implemented.

3.3. FE-SEM

The FE-SEM employed in this argon ion polishing experiment was a Zeiss SIGMA, and the polishing apparatus was a Gatan 697 Ilion II. After employing the polishing device to remove surface imperfections using argon ions, a thin gold coating, on the order of 10 nm in thickness, was applied to the sample. Next, a Zeiss SIGMA SEM was used to study the materials’ tiny pore morphologies and structural characteristics [40].

3.4. Gas Adsorption Measurements

The gas adsorption experiment adopts the Autosorb-iQ automatic specific surface and pore size distribution analyser produced by Quantachrome. A minimum relative pressure of 4 × 10⁻⁵ was applied, and the aperture was sized at 0.35~500 nm. Prior to the experiment, the materials were ground to sizes of 60–80 mesh in an agate mortar. After degassing the samples, the ground powder samples were vacuumed and dried at 105 °C for 8 h while the vacuum pressure was maintained below 0.5 Pa. The adsorption gas used in the LT-N2A experiment was nitrogen, which had a purity level of above 99.999%. Gas adsorption under rising relative pressure and desorption under lowering pressure were monitored at a constant temperature of 77 K, and a low-temperature N2 adsorption–desorption curve was developed. The SSA, PV, and PSD values of the samples were calculated using the BET method and the BJH model [41]. The LP-CO2A experiment used carbon dioxide with a purity of more than 99.999% as the adsorption gas. The adsorption capacity was tested under increasing relative pressure at a constant temperature of 273 K to produce an LP-CO2A curve. The DFT model was used to determine the SSA, PV, and PSD of the samples. The whole test procedure of the LP-CO2A and LT-N2A experiments was carried out according to GB/T 21650.3-2011 and GB/T 21650.2-2008, respectively.

3.5. CH4 Isothermal Adsorption

The major applications of the methane isothermal adsorption technique include testing the methane adsorption capabilities of shale and simulating the maximal methane adsorption capabilities of shale under formation temperature and pressure circumstances. In this paper, a Gravimetric Isotherm Rig 3 isothermal adsorption instrument was used, and the test was based on GB/T 19560-2008. The shale samples were crushed to between 60 and 80 mesh, the samples were weighed to approximately 80~120 g, and the test temperature was 70 °C. First, the highest pressure point of 25 MPa and 9 experimental pressure points were set, and methane gas was injected to steadily increase from atmospheric pressure to 25 MPa. The time for each pressure point to reach equilibrium was not less than 6 h, and then the pressure was increased to the next pressure point and gradually increased to the final pressure. The ideal gas law was utilized to calculate each point’s adsorption capacity based on its experimental pressure throughout the adsorption process, and a regression analysis was employed to produce an isothermal adsorption curve.

3.6. Fractal Theory

There are many methods by which to study the fractal characteristics of shale micropores, including the fractal BET model and the mathematical model of FHH fractal theory, among which the FHH method is simple to calculate, has a wide range of applications, and is widely used by researchers in fractal theory studies. In this paper, the FHH model is used to calculate the fractal dimension of shale sample pores [24,25,26,27].
ln V V m = C + A ln ln p 0 p
In Formula (1),  V  is the quantity of gas molecules that have been adsorbed at equilibrium pressure p, in cm3/g;  V m  is the monolayer covering volume, in cm3/g;  C  is a constant;  p 0  is the saturated vapour pressure of gas adsorption, in MPa; and A is the coefficient related to the fractal dimension (D).  A  can be determined by using the slope of the fitted line in the graph  l n V  and  l n [ l n ( p 0 / p ) ] , and  D  can be calculated by the value of  A . The calculation formula is as follows:
D = A + 3
When the fractal dimension is calculated and analysed, the correlation curves of the adsorption branch  l n V  and  l n [ l n ( p 0 / p ) ]  are established by Formula (1), and the fractal dimension (D) is calculated by Formula (2). The fractal dimensions of shale pores are normally between two and three, and the closer the number is to three, the rougher the pore surface and the more complex the pore structure. When the value tends towards two, the pore structure surface is smoother and more homogeneous [42,43,44,45].

4. Results

4.1. Mineralogy and Geochemistry

The TOC contents of the transitional black shales of the Shanxi Formation on the eastern margin of the Ordos Basin range from 0.64% to 9.70%, with a mean of 3.80%. Ro values between 2.08% and 2.36%, with a mean of 2.23%, demonstrate the overly mature condition of the organic substance. The XRD whole-rock analysis results (Table 1) show that the transitional shale minerals of the Shanxi Formation are composed of complex minerals, including clay minerals, quartz, feldspar, calcite, dolomite, and small amounts of pyrite and siderite (Table 1). They are dominated by clay and siliceous minerals, with quartz contents ranging from 28.92% to 58.98% and a mean of 43.00%. The clay contents range from 36.24% to 65.21%, with a mean of 49.37%. Feldspar consists of potassium feldspar and plagioclase, with contents ranging from 0 to 2.53% and an average content of 0.96%, which is relatively low. The contents of carbonate minerals (dolomite and calcite) range from 0 to 13.56%, with an average content of 3.02%. Compared with marine shale, the content of carbonate minerals in Shanxi Formation samples is relatively different, and it is close to that of lacustrine shale [15,45]. The contents of pyrite and siderite in the Shanxi Formation samples are low, with average contents of 1.81% and 1.85%, respectively. More than 80% of the 12 shale samples contain pyrite, indicating that the area was in a reducing depositional environment [15,35]. The transitional shales of the Shanxi Formation differ from marine organic-rich shales in that they have a high clay mineral content and a low siliceous mineral content [42,43,44,45,46]. The clay mineral content in lacustrine and continental shales is comparable to that of the Shanxi Formation, while siliceous mineral richness varies significantly (Table 2) [21,47].
Correlation analysis of TOC, quartz, and clay mineral contents in shale samples from the Shanxi Formation (Figure 2) shows that the quartz content is inversely correlated with TOC (R2 = 0.52) (Figure 2a), while the clay content is favourably correlated with TOC (R2 = 0.57) (Figure 2b). TOC is favourably correlated with the quartz content and negatively correlated with the clay mineral content in marine shales, which is in contrast to previous marine shale studies [47,48,49]. This agrees with earlier research on the contents of quartz, clay, and TOC in transitional and continental shales [37,39,49].

4.2. Pore Characteristics from FE-SEM

The shale pore types are diverse, and the structure is complex. FE-SEM scanning electron microscopy imaging shows that the pores in the shale samples of the Shanxi Formation have three different morphological types: organic pores, inorganic pores, and microfractures. Intergranular pores and intragranular pores are further divisions of inorganic pores [43]. The FE-SEM images show that a large number of micro/nanopores are developed in the shale samples of the Shanxi Formation (Figure 3 and Figure 4). Micro/nanopores are developed in the shale organic matter, most of which are smaller than 300 nm (Figure 3a) and a few of which are up to 1.5 μm (Figure 3b). The pore shapes in the organic matter are different (irregular, oval, circular, long stripe, and nearly circular), the distribution is not uniform (Figure 3c,d), and local enrichment rarely occurs in the organic matter (Figure 3a). In addition, the organic matter that filled in between pyrite crystal particles developed elliptical or circular organic pores (Figure 4f).
According to the FE-SEM images, intergranular pores and intergranular pores make up the majority of the inorganic pores in the shale samples (Figure 3e,f). The pores within grains are mostly round or elliptical (Figure 3e), except that the pores between clay mineral grains are mostly parallel plates or slits (Figure 4c), with an uneven distribution and large pore size differences, which mostly result from the dissolution of acidic fluids during the production of hydrocarbons and the diagenesis of organic materials. Most intergranular pores that form between stiff particles, most of which are irregular, are generally larger than 100 nm and are distributed unevenly (Figure 3f and Figure 4b). Such pores are mainly affected by diagenetic compaction [36,37,38,39,40]. In addition, intercrystalline pores are present between strawberry-shaped pyrite particles (Figure 4e), with certain connectivity and pore sizes up to hundreds of nanometres, which interact with organic matter [49,50,51].
In addition to the aforementioned pores, shale samples also produce microfractures, with the fracture width typically being less than 200 nm. Some microfractures are developed in the clay minerals, most of which are less than 130 nm in width (Figure 4a), which, during the diagenetic process, are mostly created when the clay minerals dehydrate and shrink [49,50]. Most microcracks form at the edge of the organic matter (Figure 3b,c and Figure 4d), and these microcracks are usually caused by the abnormally high pressure generated in the process of hydrocarbon generation during the thermal evolution of the organic matter [37,38,39,40].

4.3. Pore Characteristics from Gas Adsorption

4.3.1. Low-Temperature N2 Adsorption

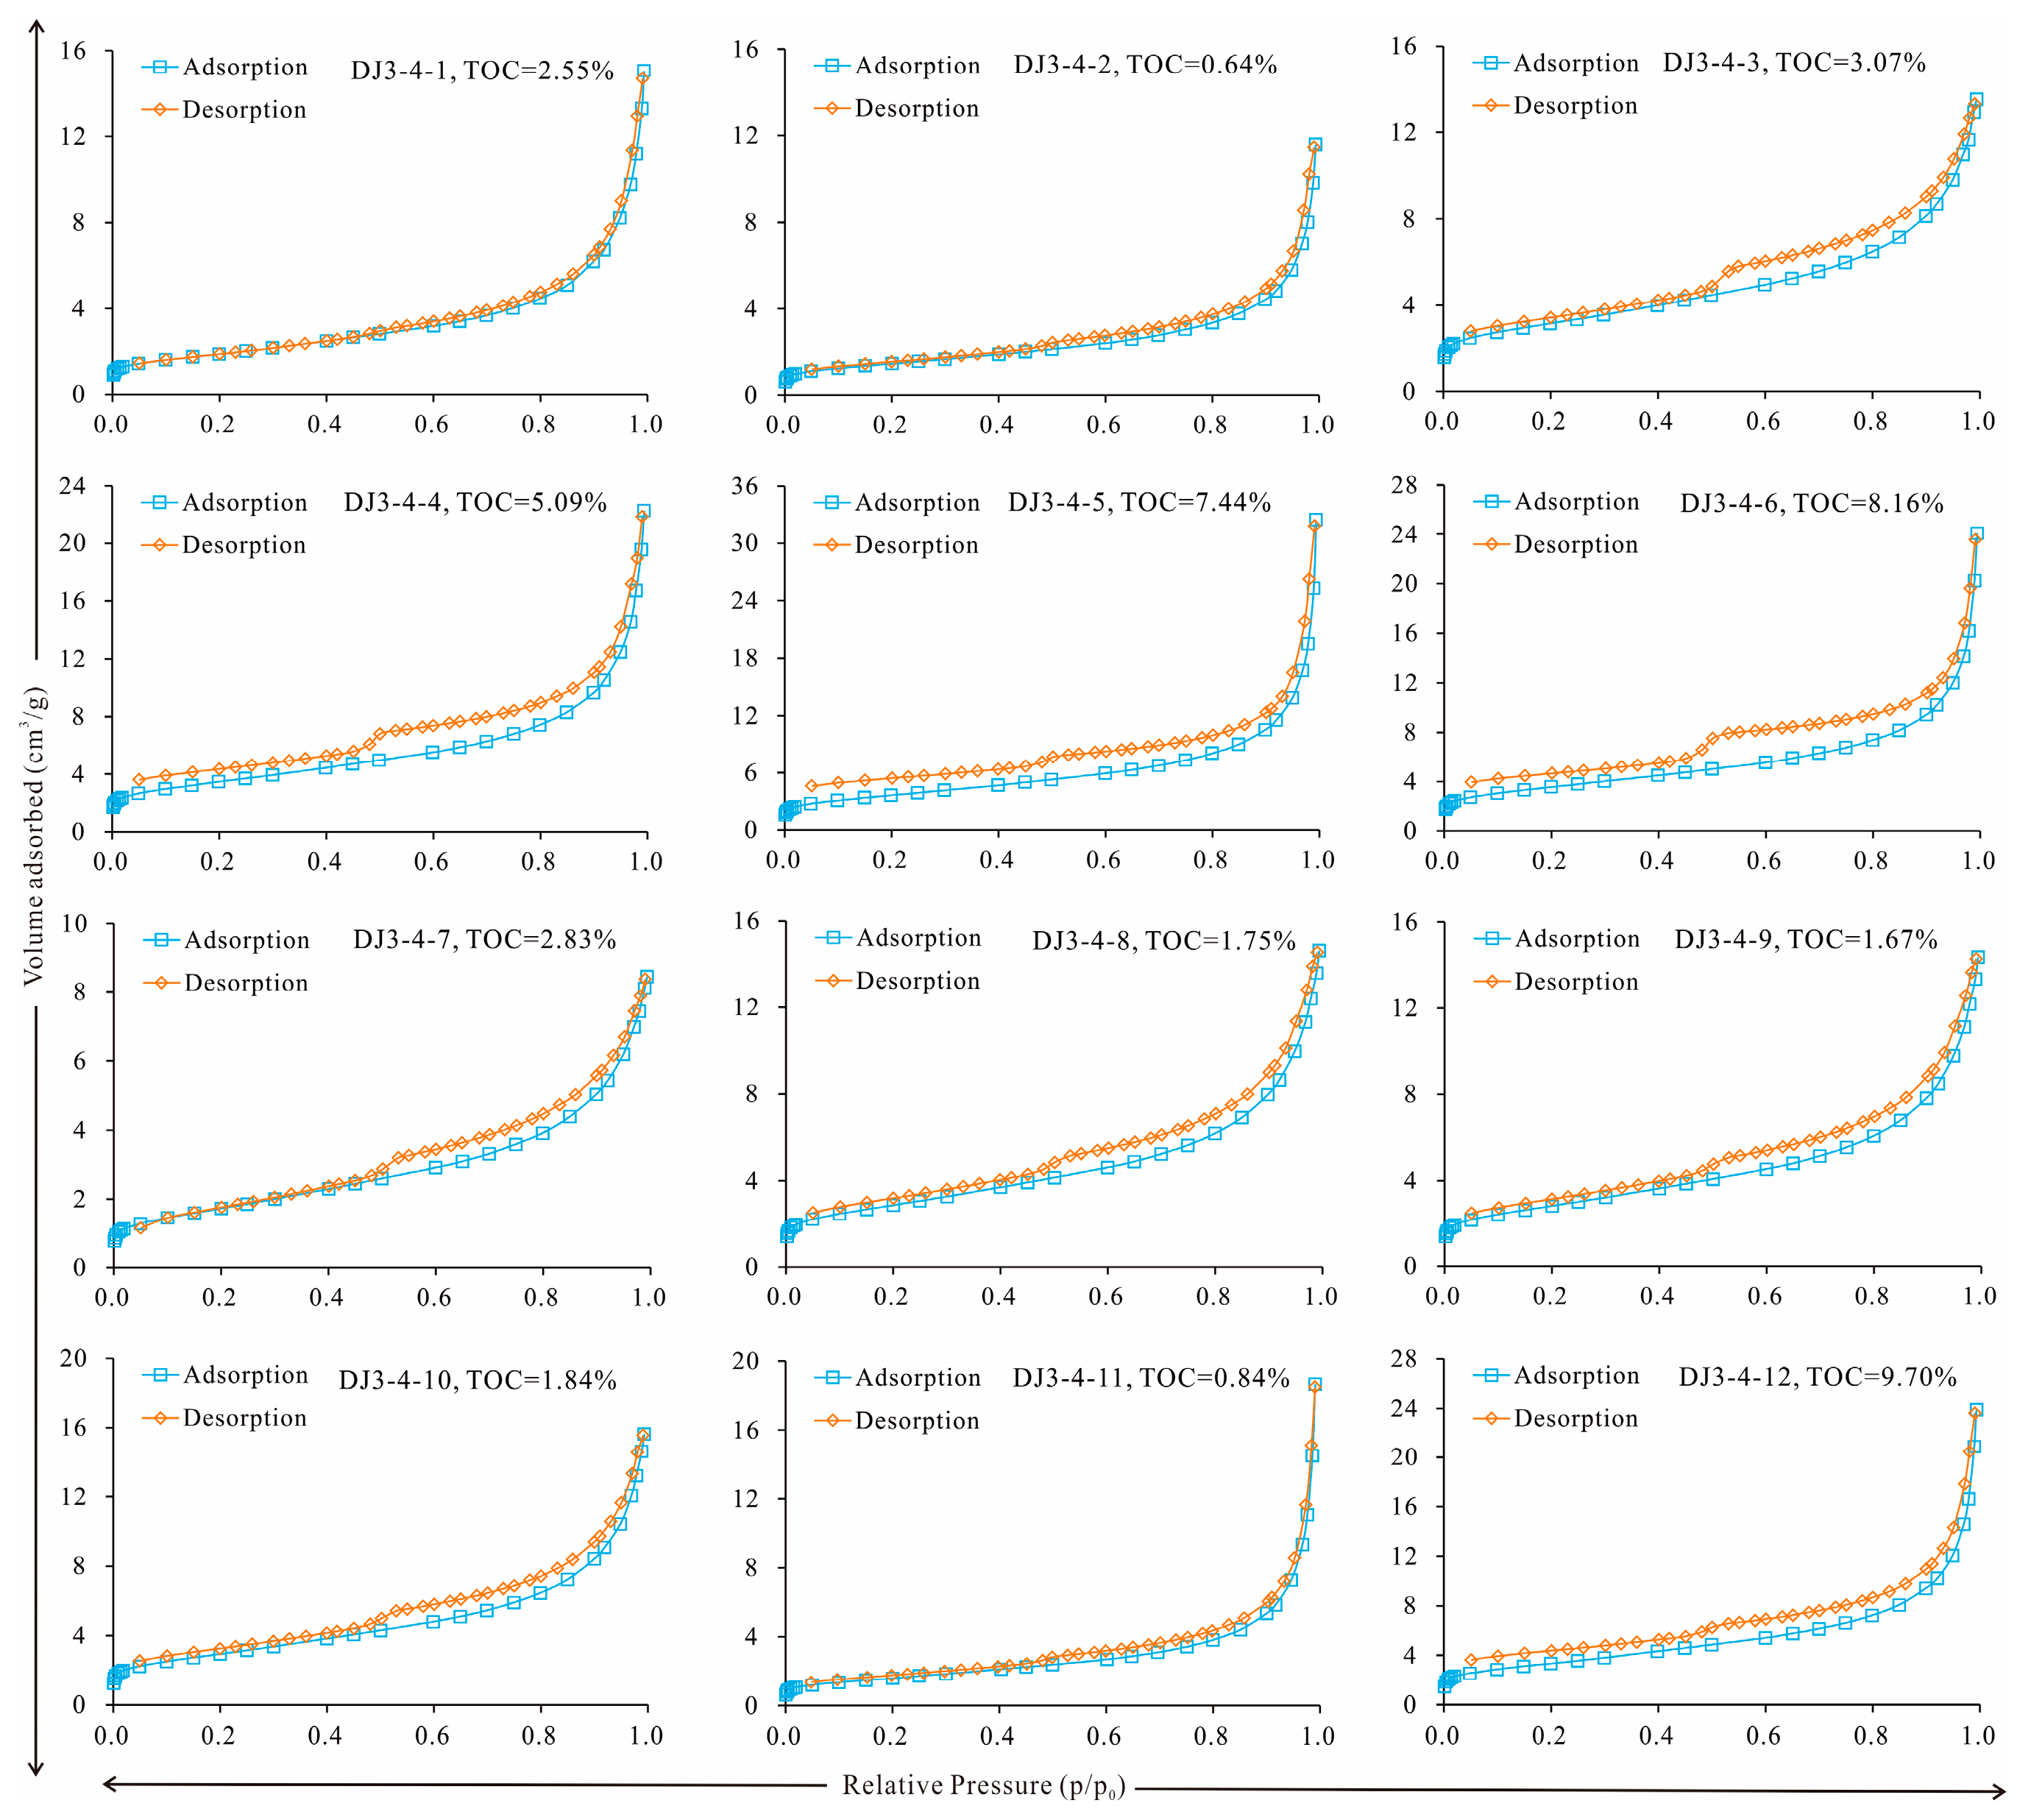
The LT-N2A isothermal curves of 12 transitional shale samples (Figure 5) show that the shapes of the shale adsorption curves are similar to a certain degree, but different samples also show differences [51,52,53,54,55]. Based on the adsorption isotherm division scheme proposed by IUPAC [50], the adsorption isotherms of 12 shale samples from the Shanxi Formation in this study are all type IV, but the morphological differences are large, mainly because of the strong heterogeneity of shale [15,46,51]. The adsorption process may be loosely separated into three phases based on the fluctuation tendency of the N2 isothermal adsorption curve: (1) when p/p0 = 0~0.3, the adsorption curve rises slowly and presents a slightly convex shape. When p/p0 = 0.3, the monomolecular layer on the pore surface is basically saturated, and adsorption gradually transitions to multimolecular layer adsorption with increasing relative pressure. (2) When p/p0 = 0.3~0.9, the gas adsorption capacity increases steadily with increasing relative pressure. (3) When p/p0 = 0.9~1.0, the adsorption curve rapidly becomes steeper and does not reach saturation when p/p0 is close to 1. This mostly results from the condensation of gas, demonstrating that the shale has a particular number of macropores or microfractures [56,57,58]. The adsorption and desorption curves are divided from 0.45 to 0.9, and a hysteresis loop forms between the two curves. This is because capillary condensation occurs in this relative pressure interval [2,15,29,35,50], and the adsorption and desorption processes cannot be completely reversible. At the same time, the formation of the hysteresis ring is similar to that of the H3 type, indicating the development of slit-type and parallel plate-like pores in the Shanxi Formation shale [59,60].
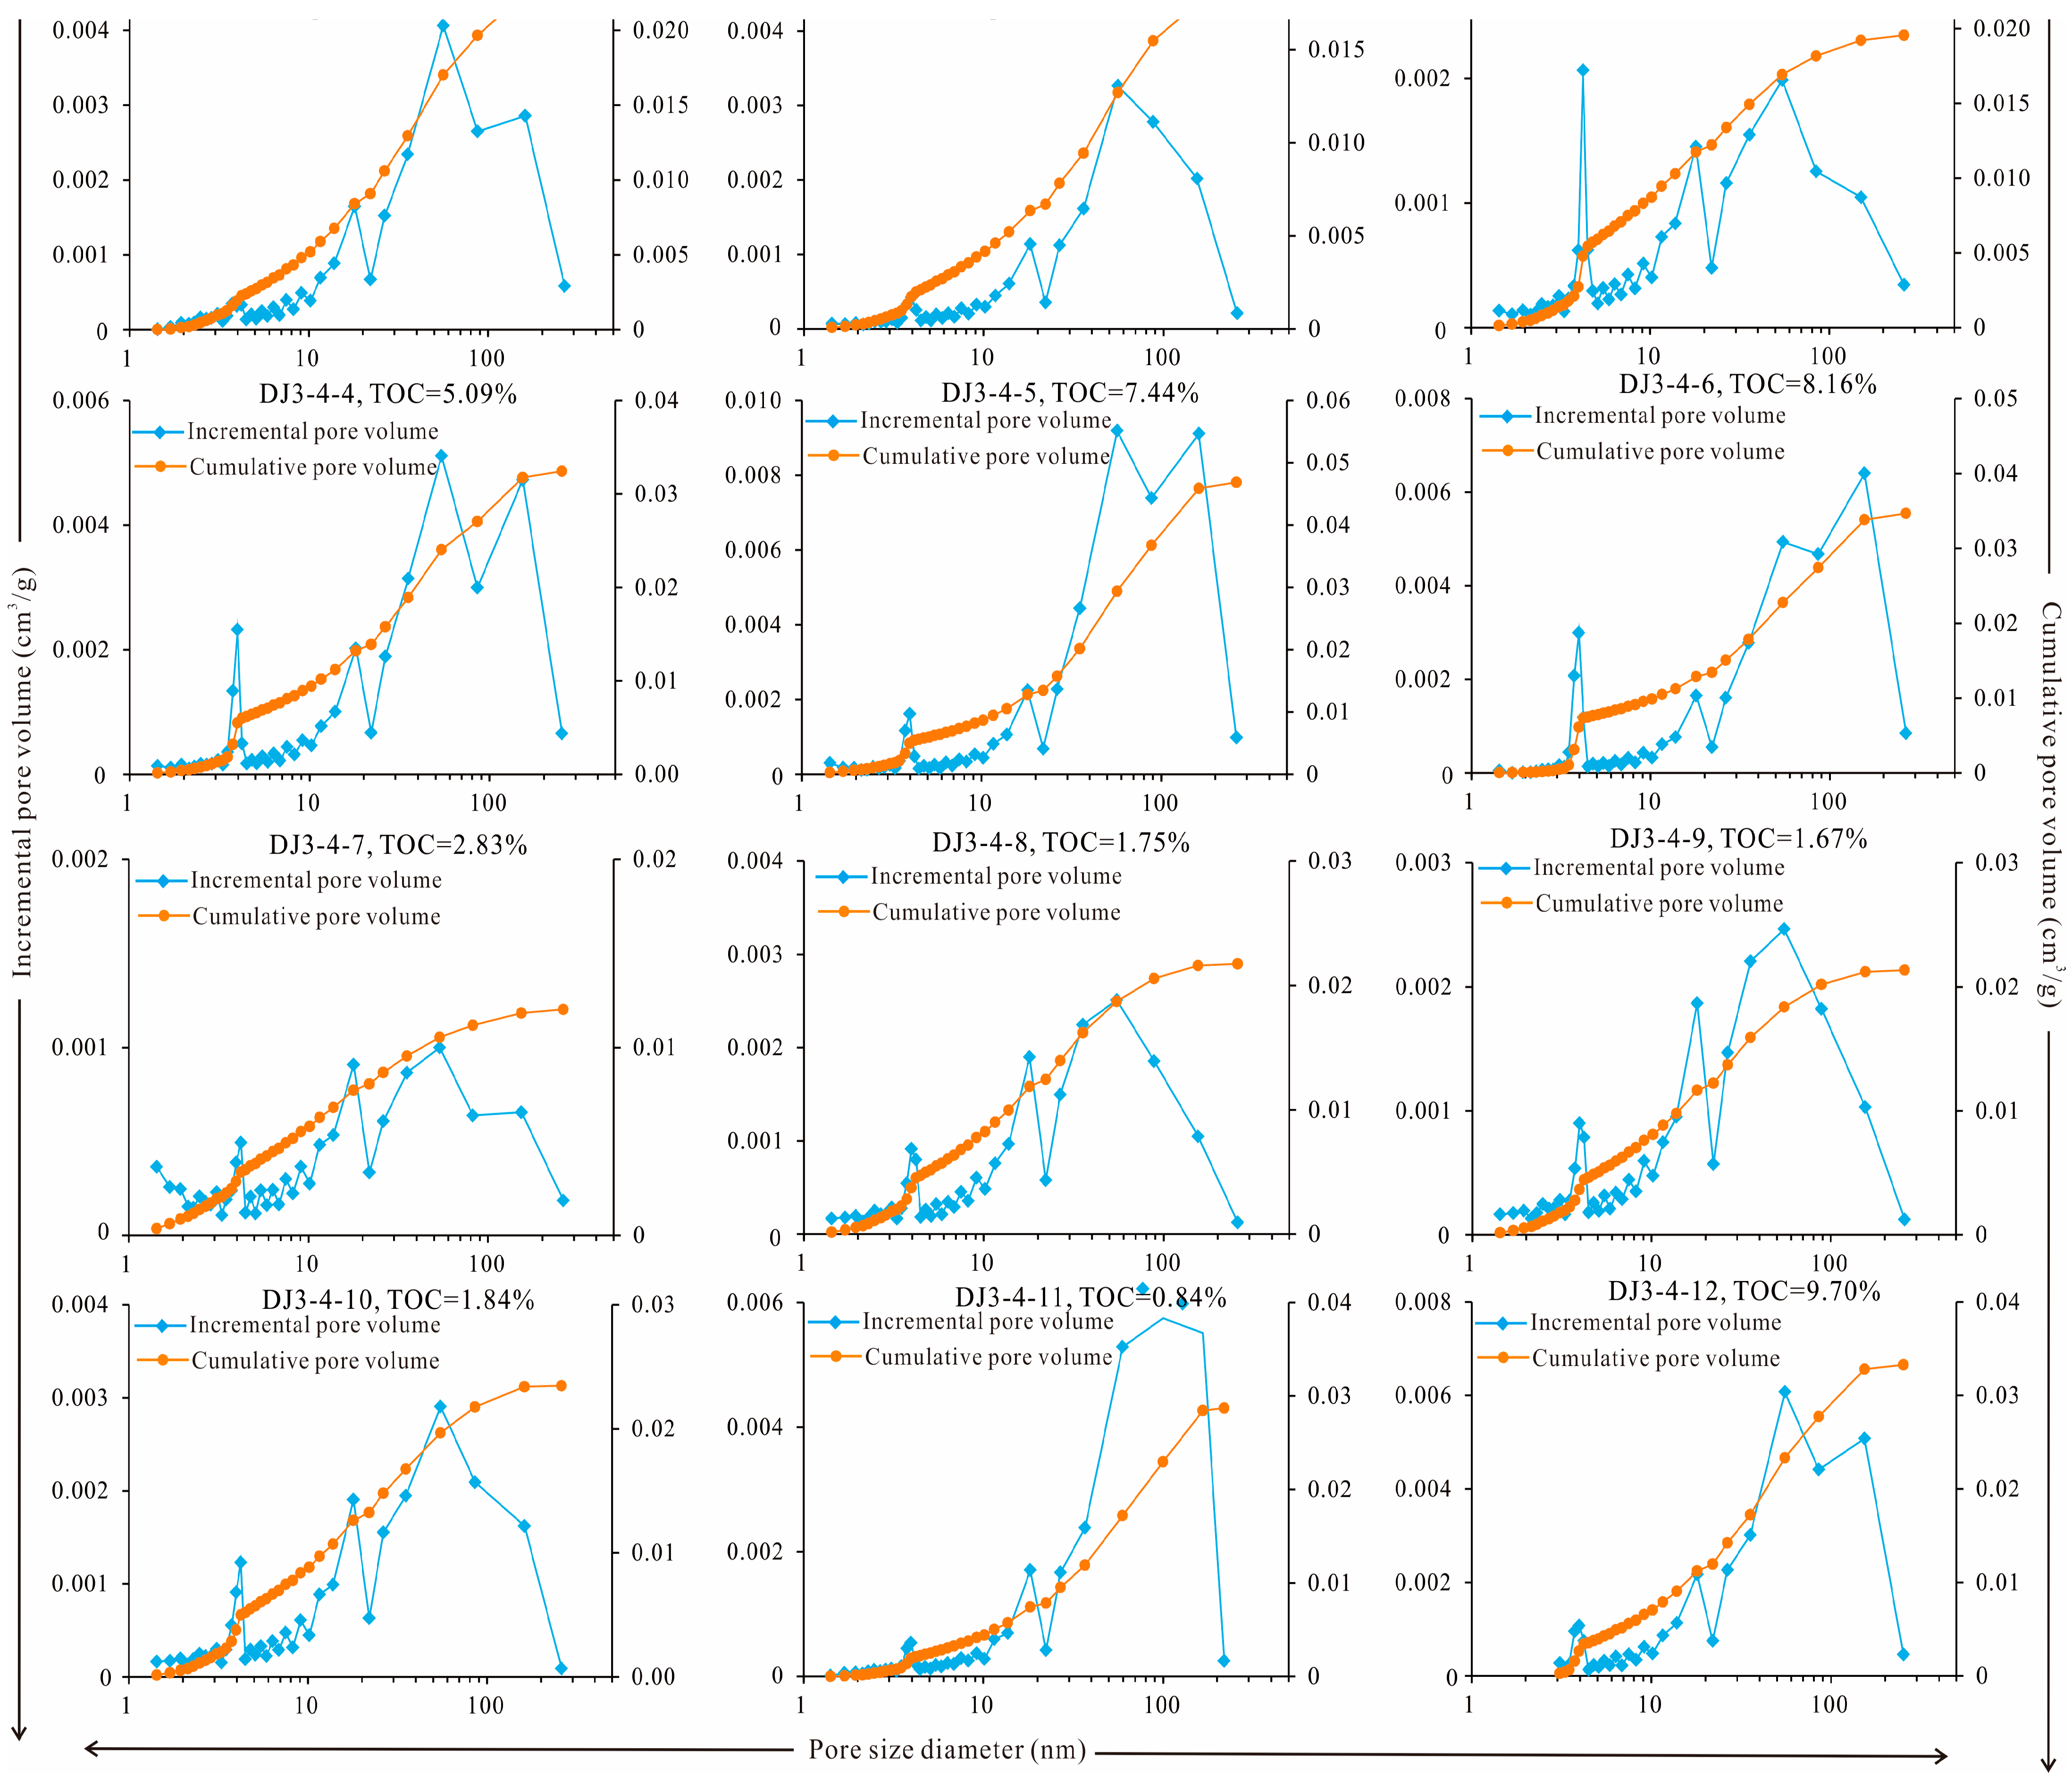
The pore structure characteristics of the shale samples were determined by quantitatively analysing the LT-N2A experimental data and were based on the theoretical BET and BJH models, as shown in Table 3. The BET-SSA values of shale pores range from 5.118 m2/g to 12.812 m2/g, with a mean value of 9.542 m2/g. BJH-PV parameters range from 0.012 cm3/g to 0.047 cm3/g, with 0.026 cm3/g being the average. Marine–continental transitional shales have SSA and PV values that are somewhat higher than those of continental shales and quite similar to those of lacustrine shales [16,21,22,23,24,49,50,51]. The pore diameter distribution curve is calculated based on the LT-N2A experiment, as shown in Figure 6. The relationship between the pore size and pore volume is shown by a curve with multiple peaks. The peaks are at 3~5 nm, 10~22 nm, and 22~270 nm, and the maximum cumulative pore volume reaches 0.047 cm3/g.

4.3.2. Low-Pressure CO2 Adsorption

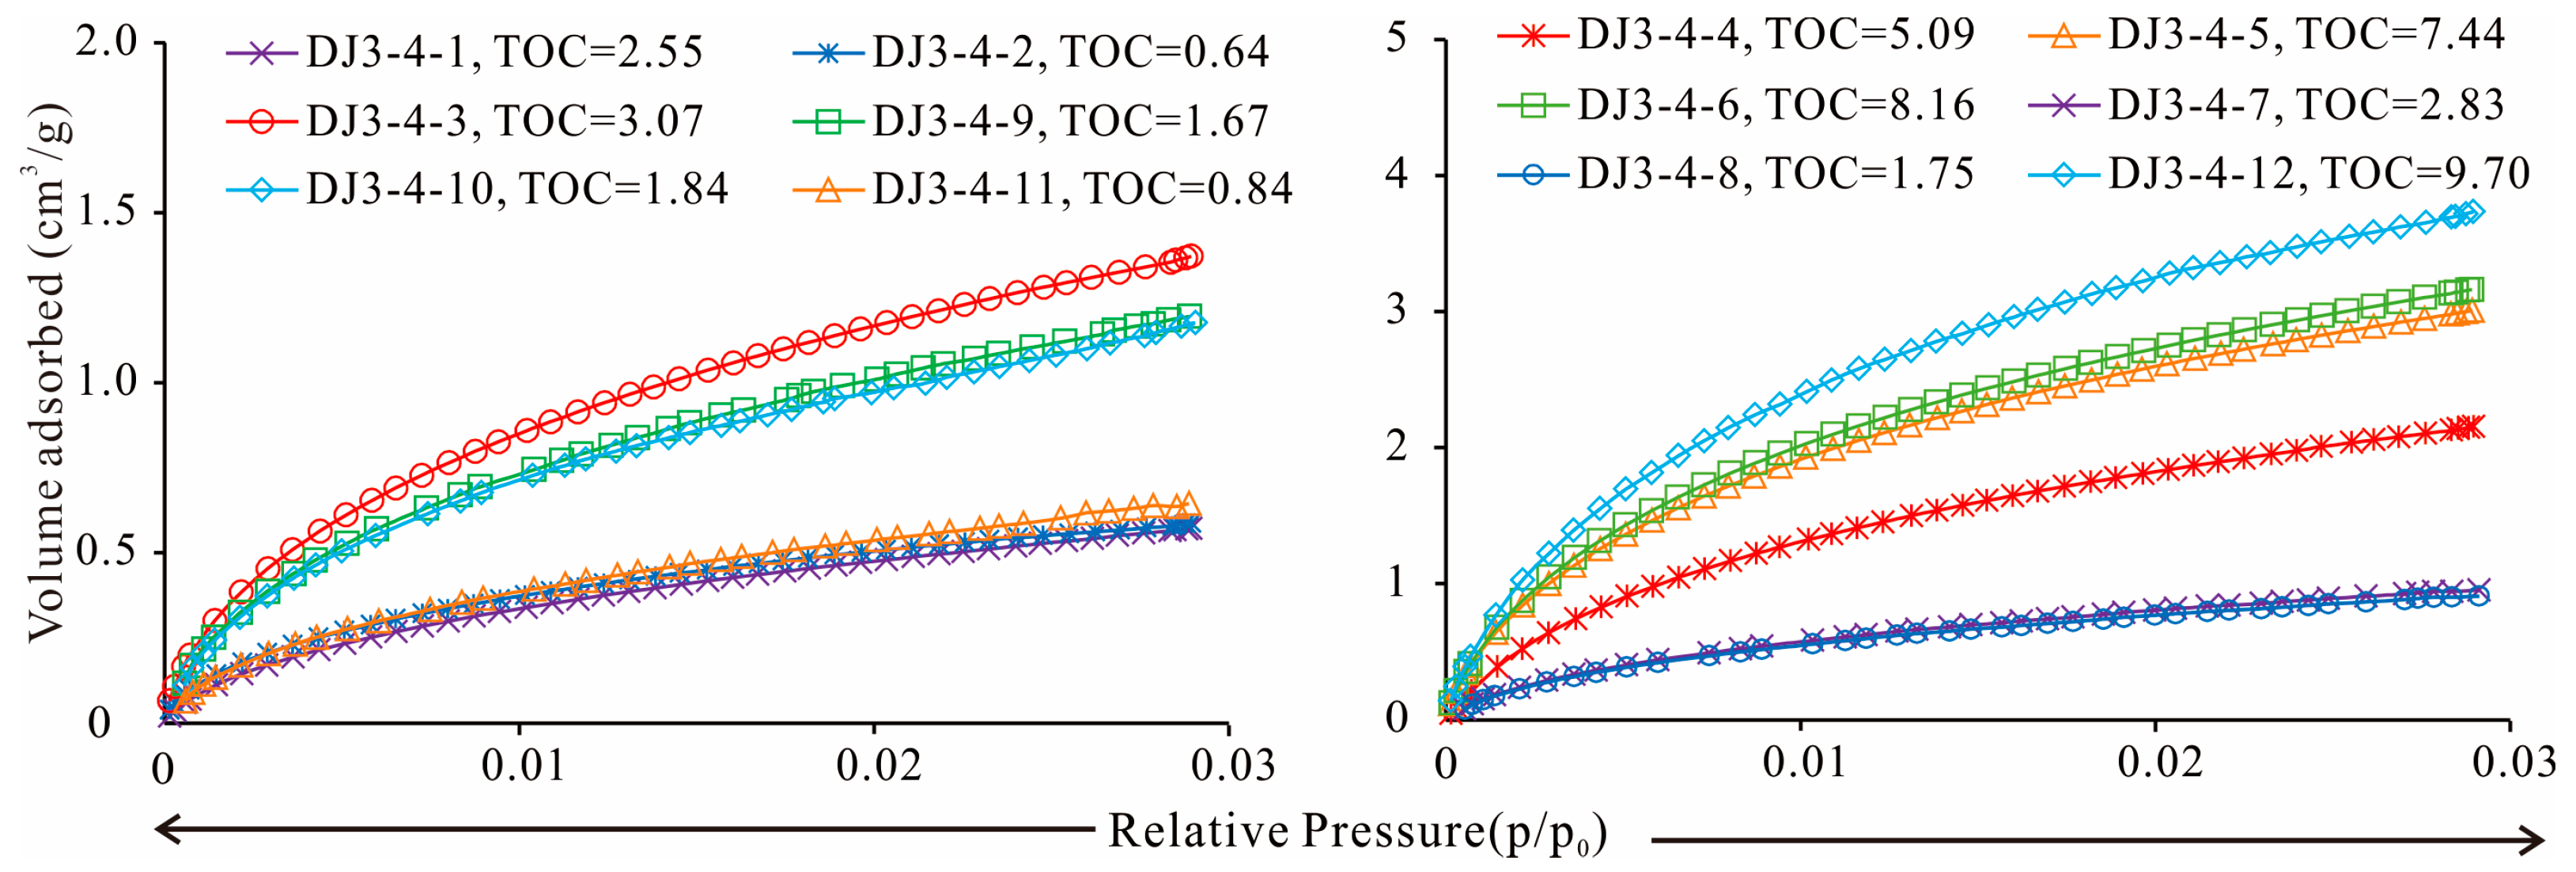
The LP-CO2A isothermal adsorption curve is shown in Figure 7. The curve type corresponds to an isotherm of type I, which reflects the micropore filling phenomenon in shale samples, indicating the development of a certain number of micropores in shale [11,22,23,24]. The morphologies of the CO2 adsorption curves of different samples are similar, but the maximum adsorption amount of CO2 is different, which shows the micropore-scale pore structure of different shale samples [20,24,25]. In the Shanxi Formation, the samples with greater organic carbon content often have higher CO2 adsorption gas volume, which indicates the larger pore volume of shale micropores. This finding suggests that the TOC content is directly correlated with the level of micropore development.
Table 3 displays the experimental results of low-pressure CO2 adsorption based on the NLDFT model. The micropore sizes are between 0.349 nm and 0.576 nm (average of 0.441 nm). The SSA values of micropores range from 6.025 m2/g to 38.303 m2/g (mean of 17.037 m2/g). The micropore volumes range from 0.002 cm3/g to 0.011 cm3/g (mean of 0.005 cm3/g). The pore size distribution shows an obvious multipeak pattern (Figure 8), with three main peaks from 0.3 to 0.4 nm, 0.4 to 0.7 nm, and 0.7 to 0.9 nm, indicating that the shale pores are widely distributed from 0.3 to 0.9 nm. The corresponding main peak pore sizes are 0.35 nm, 0.54 nm, and 0.81 nm, indicating a greater proportion of such pores within the total pore volume.

4.4. CH4 Adsorption Isotherms

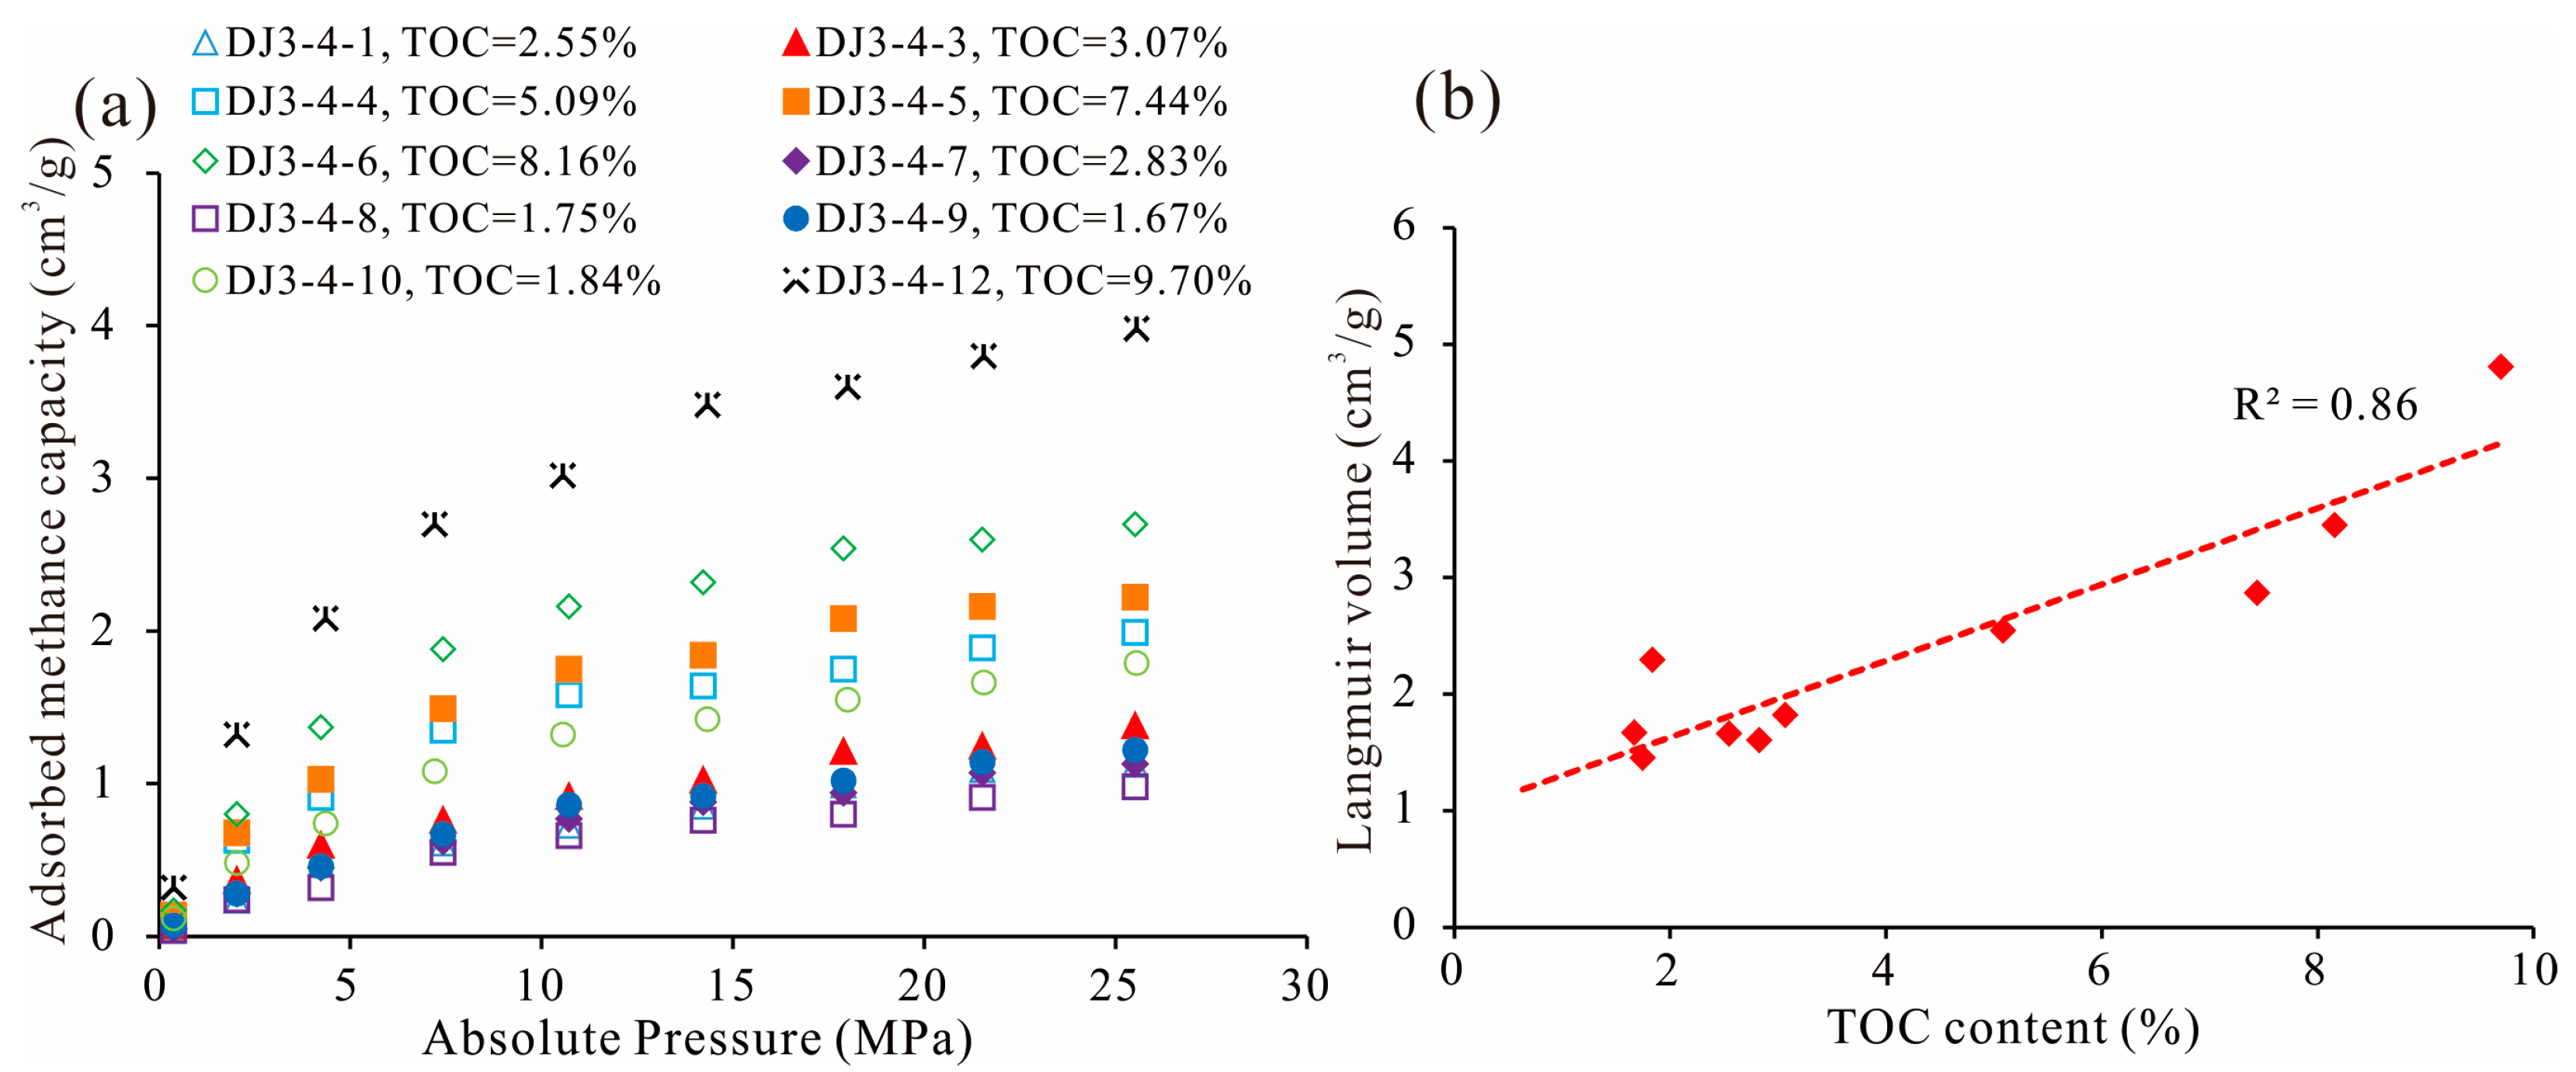
Under specific temperature and pressure conditions, the isothermal CH4 adsorption experiment can ascertain the maximum CH4 adsorption capacity of shale, reflecting its maximum gas adsorption capacity [6,8,15,24]. In this paper, the gas adsorption capacity of transitional shale from the Shanxi Formation is investigated using the Langmuir model in conjunction with an isothermal adsorption experiment. As depicted in Figure 9a, the adsorbed gas volume of the Shanxi Formation shale samples tends to become saturated at approximately 21 MPa. The adsorption capacity of CH4 varies widely between different shale samples, mainly because the degree of pore development, pore size distribution, and geometric characteristics within shale samples are quite different. The gas adsorption capacity of shale is positively correlated with the TOC content; as the TOC content increases, so does the shale’s capacity. This finding is consistent with earlier research [8,15,38]. The Langmuir characteristics of 12 shale samples from the research area are shown in Table 4. The Langmuir volume of different shale samples varies widely, with values ranging from 1.45 cm3/g to 4.81 cm3/g (average of 2.42 cm3/g). Langmuir pressures range from 5.68 MPa to 12.99 MPa. Figure 9b shows a substantial positive connection between the TOC content and Langmuir volume, with a correlation coefficient R2 of 0.86, showing that the transitional shale TOC content is one of the key elements influencing the shale adsorption performance [15,21]. The creation of a high number of organic pores during the thermal evolution of organic matter may be the cause of the rise in VL with increasing TOC content since this increases the contact area between gas and pores, which promotes gas enrichment and raises the shale’s gas content [35,36,37,38,39].

4.5. Pore Fractal Characteristics

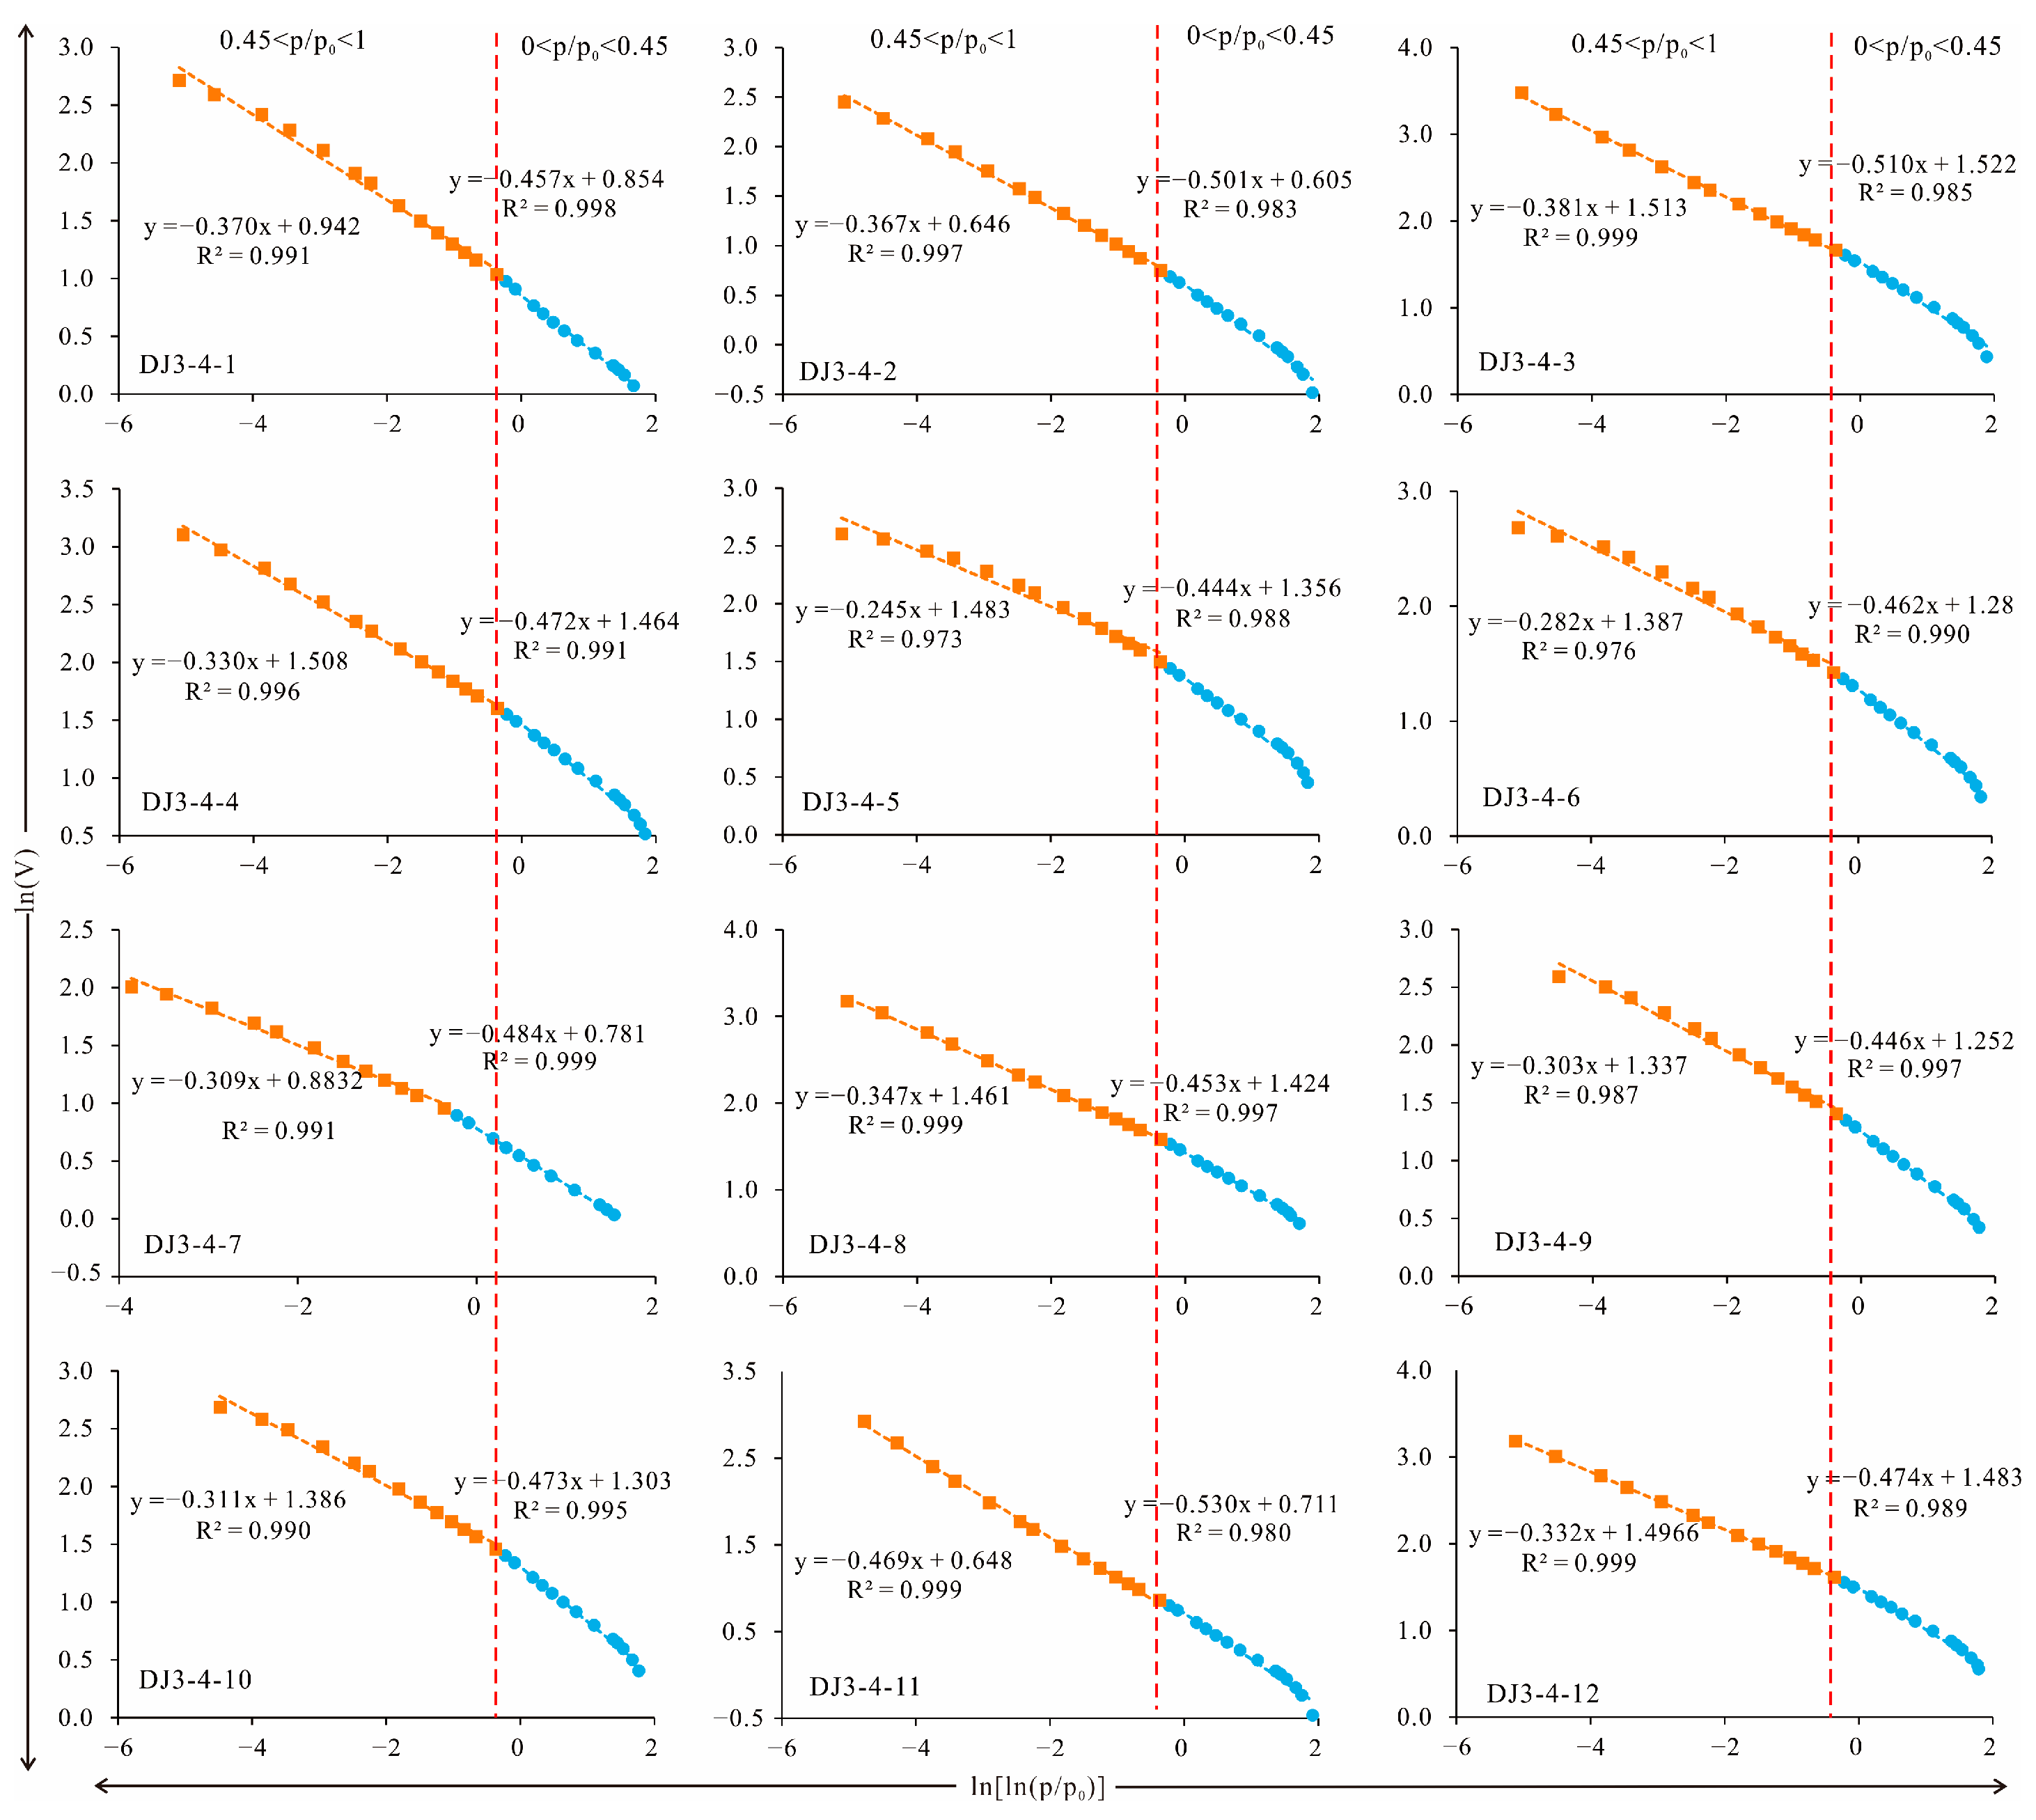
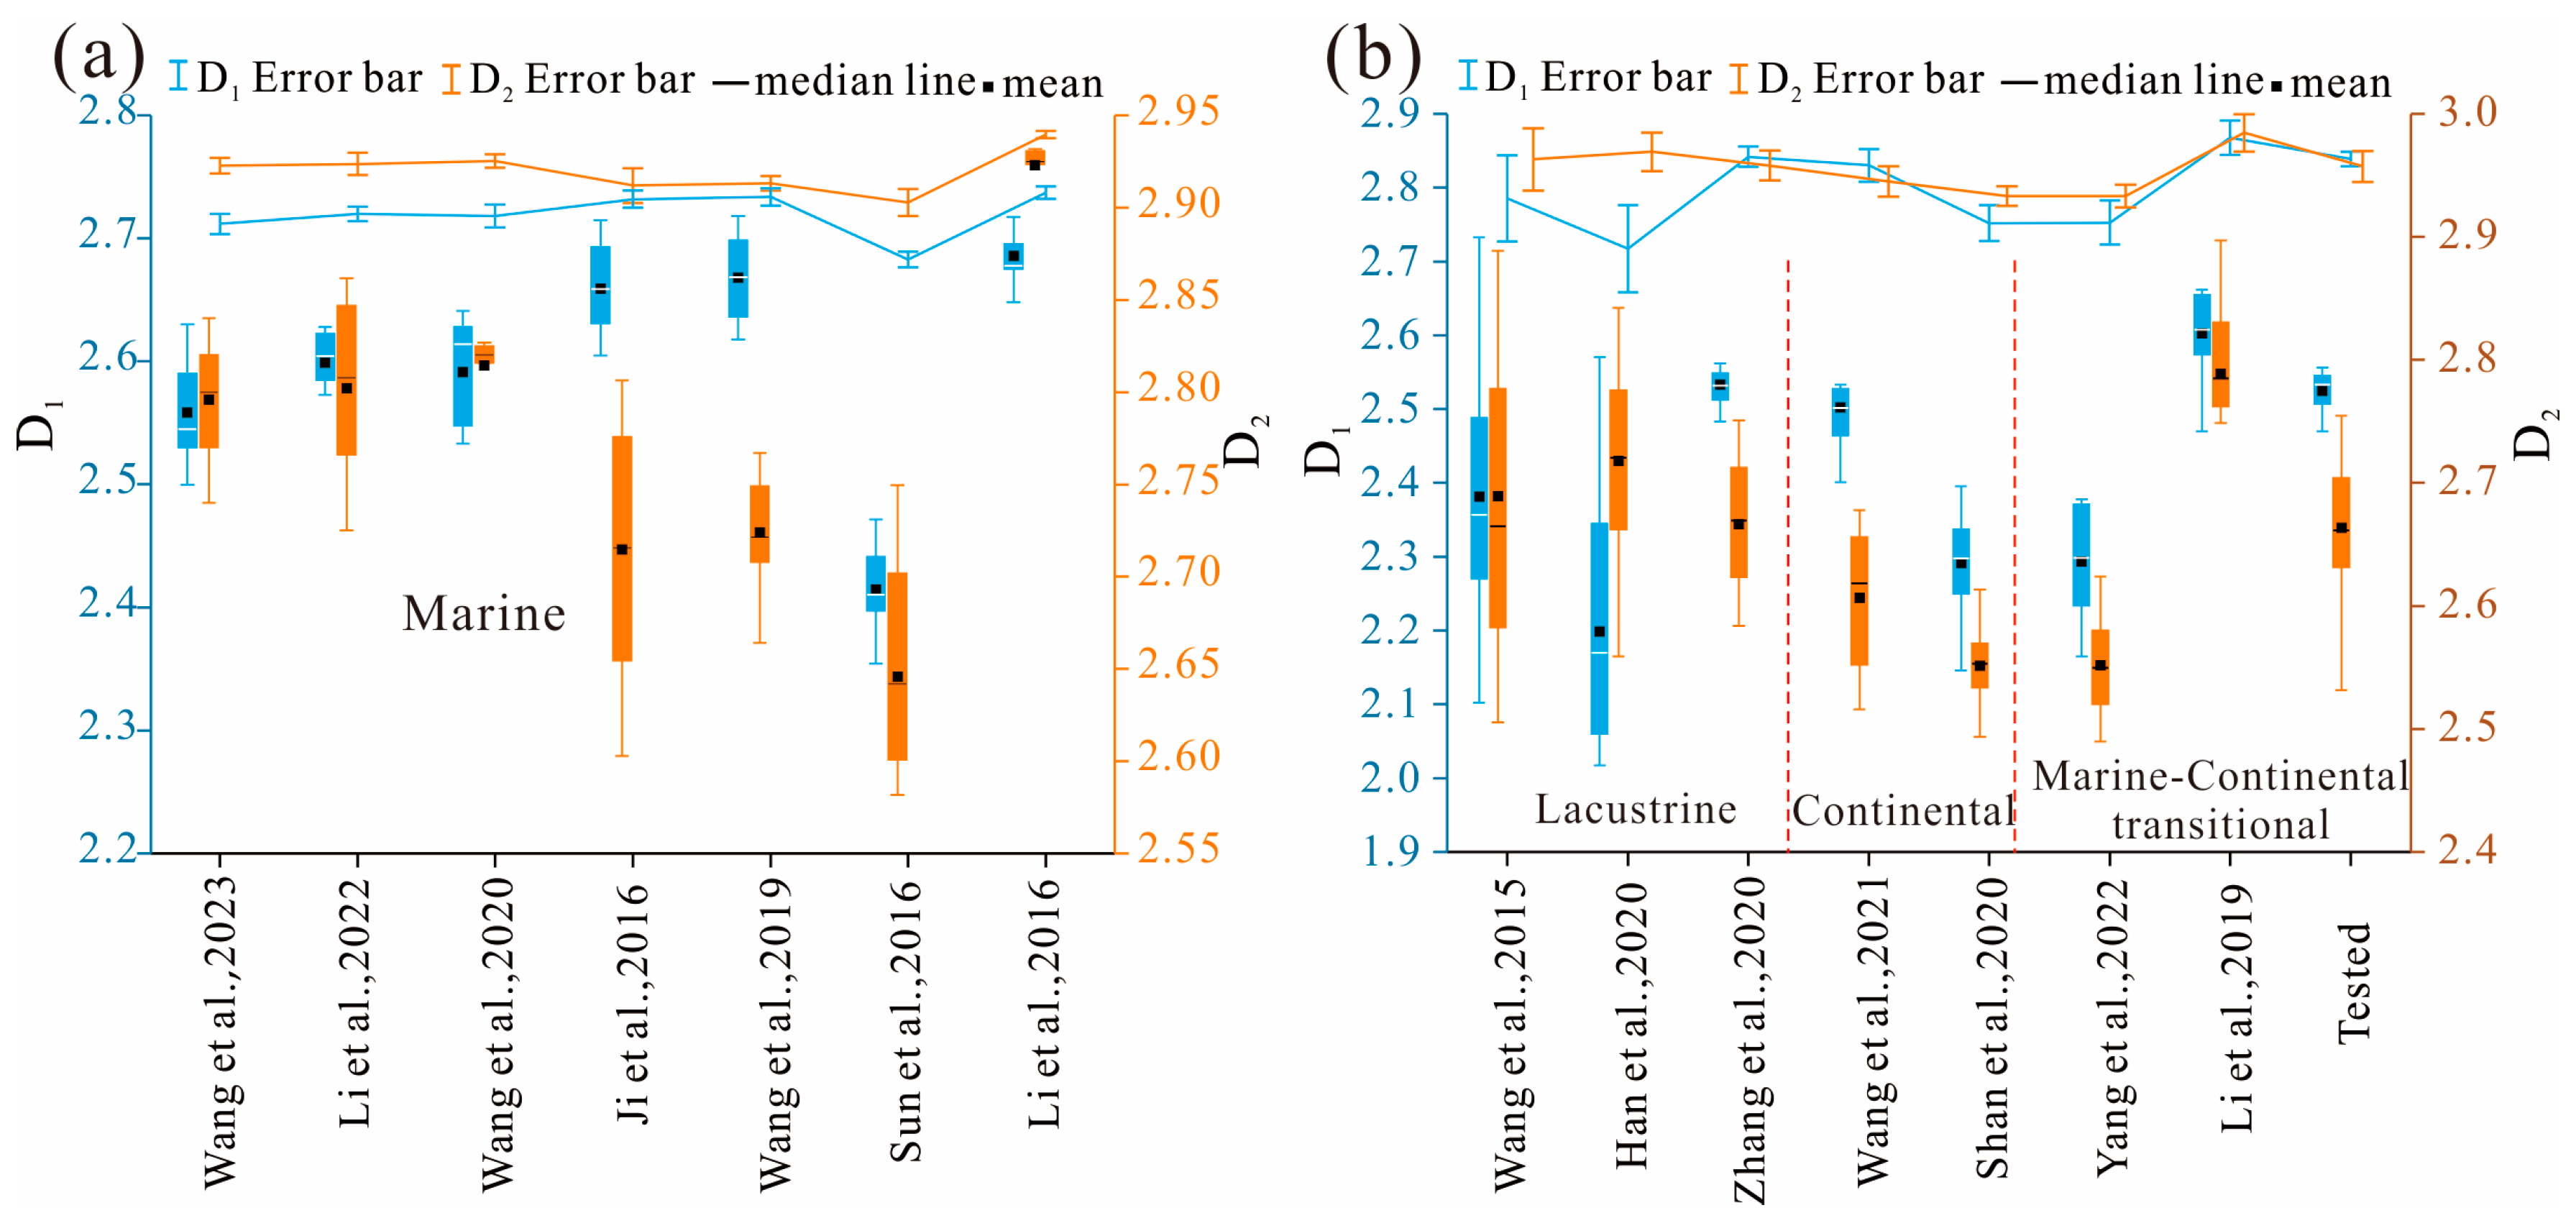
The relationship between the  l n V  and  l n [ l n ( p 0 / p ) ]  of the adsorption curve of LT-N2A was determined by using the adsorption branch gas adsorption capacity and relative pressure, as shown in Figure 10. When the LT-N2A curve’s relative pressure is between 0.45 and 0.5 at low temperatures, the hysteresis loop manifests, showing how much the pore structure changes before and after the pressure range. According to the characteristics of the double logarithmic curve in Figure 10, p/p0 = 0.5 was used as the limit to perform piecewise linear fitting for the high-pressure and low-pressure portions of the adsorption curve, calculate the slope of the fitting lines in different pressure portions, and calculate the fractal dimension of the sample using Equation (2). The findings demonstrate that shale pores have two distinct fractal properties, and there is a good match between them. D1 and D2 are used to signify the fractal dimensions of pores in the low-pressure section (0 < p/p0 < 0.5) and the high-pressure segment (p/p0 > 0.5), respectively (Table 5). The findings demonstrate that the pore structure of the Shanxi Formation at the eastern fringe of the Ordos Basin has a very high fractal dimension (D) degree, suggesting that it is complex and has significant heterogeneity [9,15,30]. The samples with high and low relative pressures exhibit dramatically varied fractal dimensions. In the high-relative-pressure section (p/p0 > 0.5), the D2 values of shale pores are between 2.531 and 2.755, with an average value of 2.663. In the low-relative-pressure section (p/p0 < 0.5), the D1 values of shale pores are between 2.470 and 2.557, with an average value of 2.525. This is in line with the fractal outcomes of the shales investigated by Sun et al. (2015) and Bu et al. (2016). Figure 11 depicts the fractal dimensions of marine, continental, lacustrine, and transitional shales in typical basins [8,9,15,35,42,43,44,45,46]. The fractal dimension of marine shale is far from two and close to three. The fractal dimensions D1 and D2 of most lacustrine and continental shales are close to two and close to three, respectively, which is opposite to the fractal dimension D1 of marine and transitional shales, indicating that the pore heterogeneity of transitional shales is stronger than that of continental and lacustrine shales.

5. Discussion

5.1. Properties of the Porous Structure Distribution

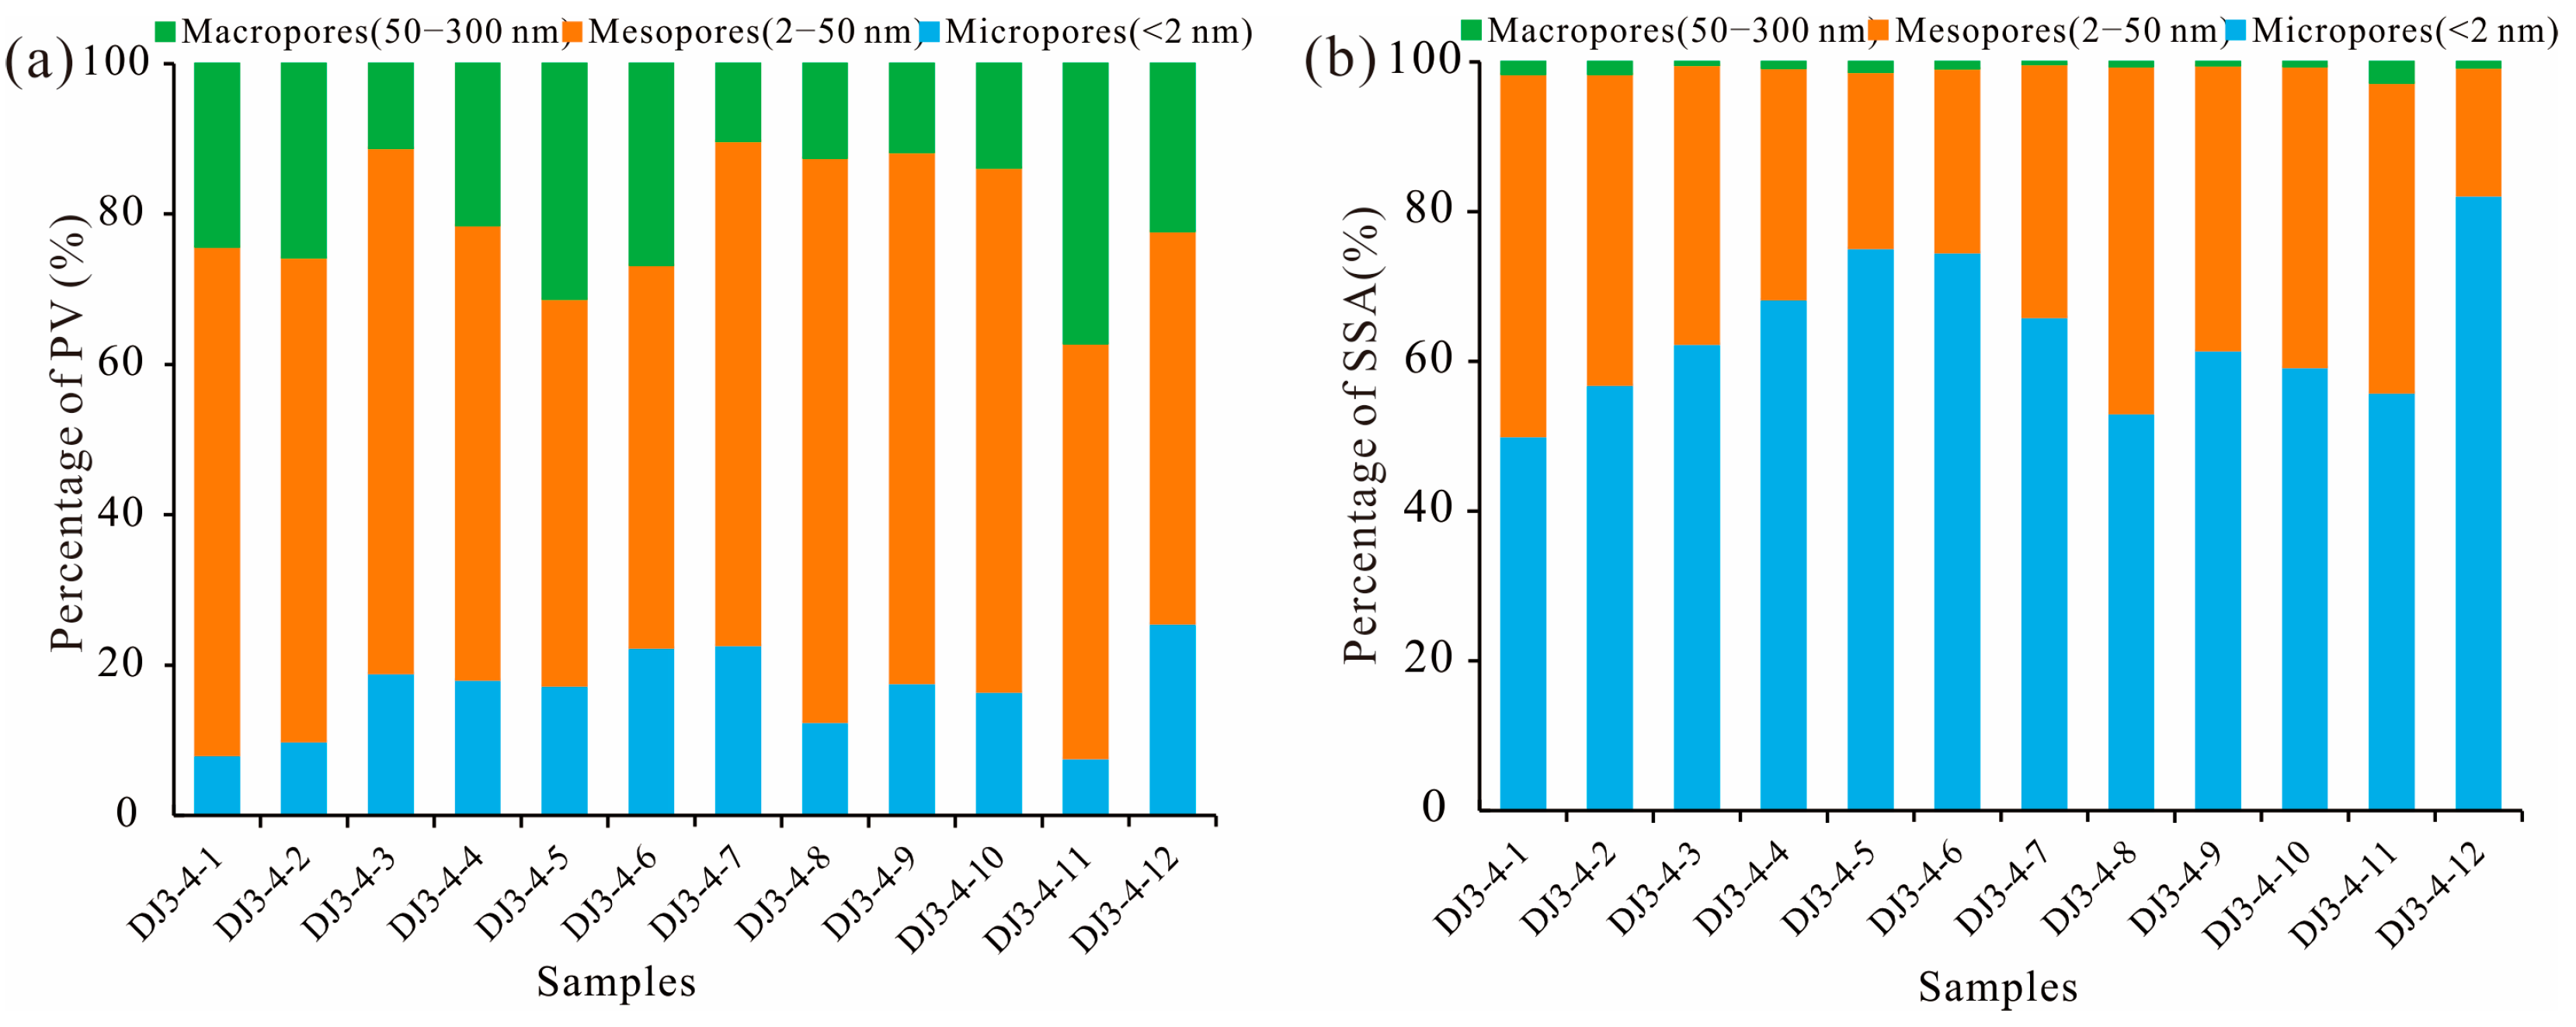
The pore structure of the Shanxi Formation shale is complex and diversified, with a broad variety of pore sizes, from a few nanometres to a few microns, and variable degrees of pore development, as can be observed from the research mentioned above [9,15,16]. Table 6 shows the pore size distribution characteristics (0.3~300 nm) of the transitional shale obtained from gas adsorption experiments ((LT-N2A and LP-CO2A). According to Table 6, the shale from the Shanxi Formation has an average PV of 0.031 cm3/g, but the values vary from 0.019 cm3/g to 0.056 cm3/g; the average mesoporous volume (2~50 nm) is 0.019 cm3/g, but the values range from 0.010 cm3/g to 0.029 cm3/g. Macropores (50–300 nm) range in volume from 0.001 cm3/g to 0.012 cm3/g (mean of 0.007 cm3/g); the volumes of micropores (0.3~2 nm) range from 0.002 cm3/g to 0.011 cm3/g (mean of 0.005 cm3/g). The PV distribution features show that there are significant variations across samples. Nevertheless, in general, mesoporous pores provide the majority of PV (51~75%), followed by macropores (10~37%), and micropores provide a small amount of pore volume (8~26%) (Figure 12a).
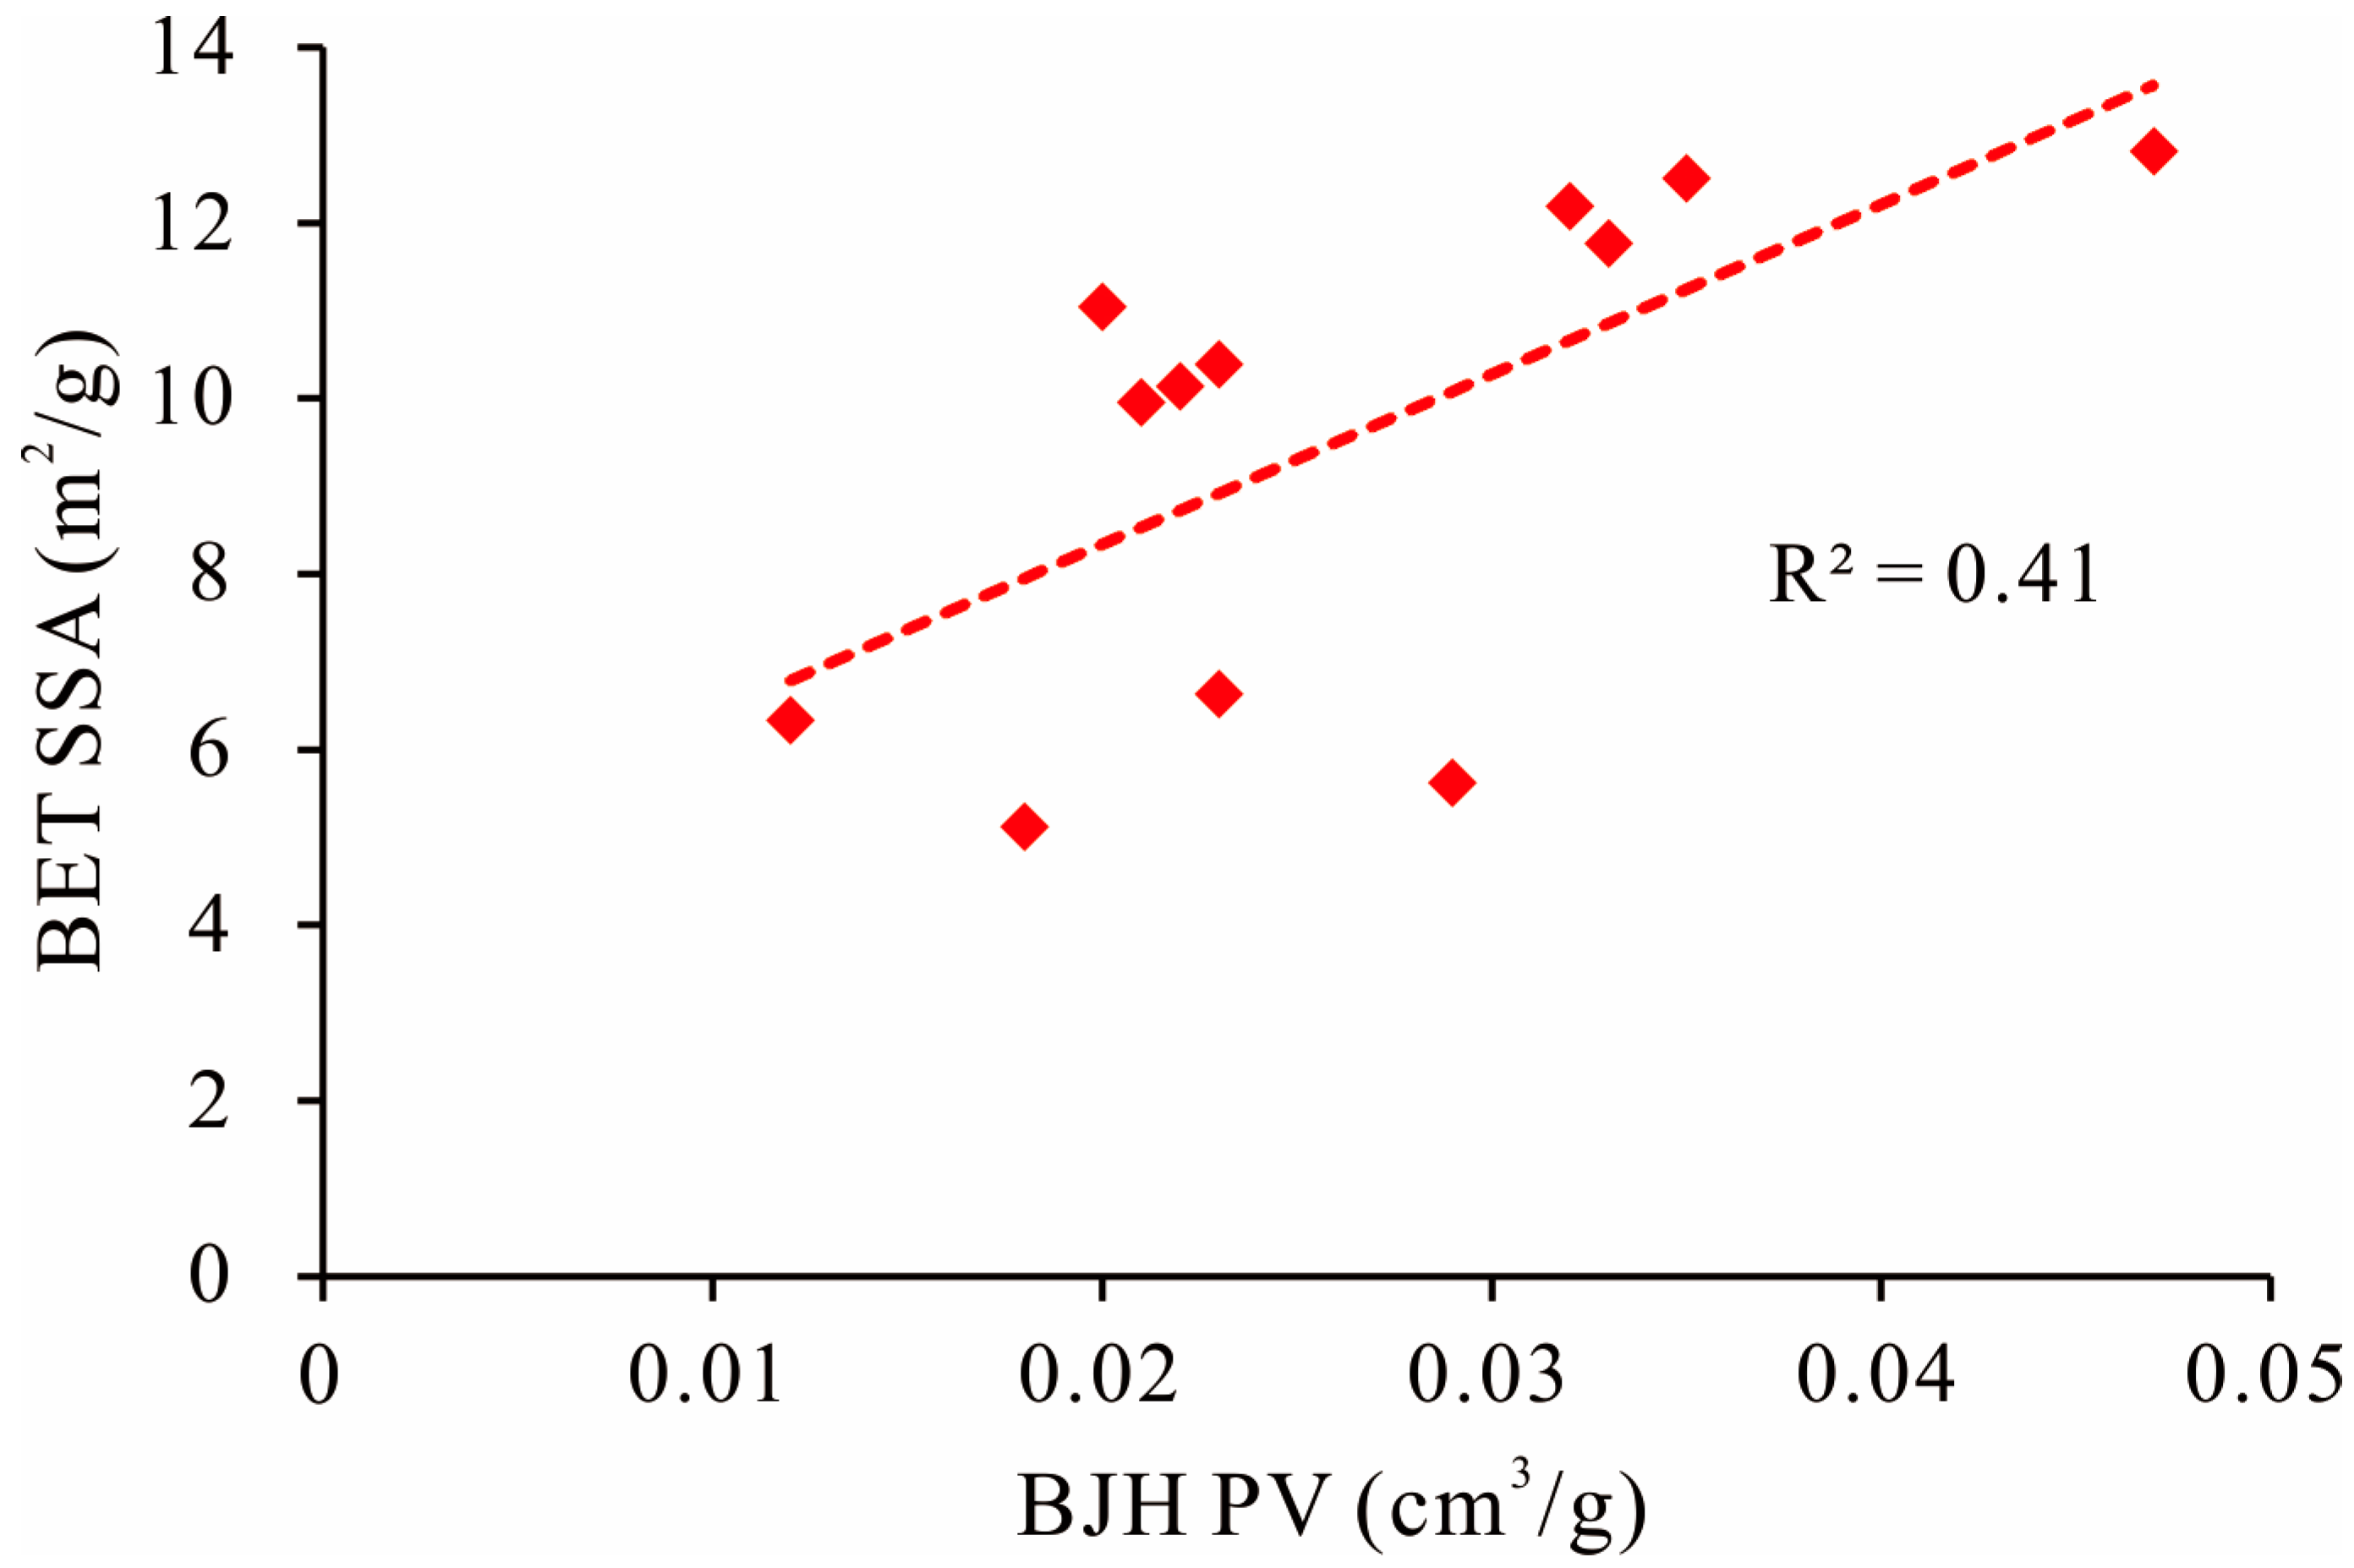
The SSA values of shale vary from 6.29 m2/g to 38.80 m2/g (mean of 17.49 m2/g), whereas those of micropores are in the range of 6.29 m2/g to 38.80 m2/g. The mean mesoporous SSA is 8.03 m2/g, with a range of 4.62 m2/g to 10.94 m2/g. The macropore SSA values ranges from 0.09 m2/g to 0.58 m2/g (mean of 0.24 m2/g) (Table 6). Figure 12b demonstrates how extremely diverse the SSA of the Shanxi Formation shale is, with significant variations across various samples. Nonetheless, the majority of SSA values are generally provided by micropores and mesopores, whose comparative surface areas vary across samples, whereas macropores provide the least SSA [31,32,33,34,35]. The association between BJH-PV and BET-SSA is shown in Figure 13. Overall, there is a considerable positive association (R2 = 0.41) with a few anomalies, which is consistent with earlier research on lacustrine shale, transitional shale, and marine shale [9,15,16,35,36,37,38,39].

5.2. The Relevance of Pore Structure to Shale Composition

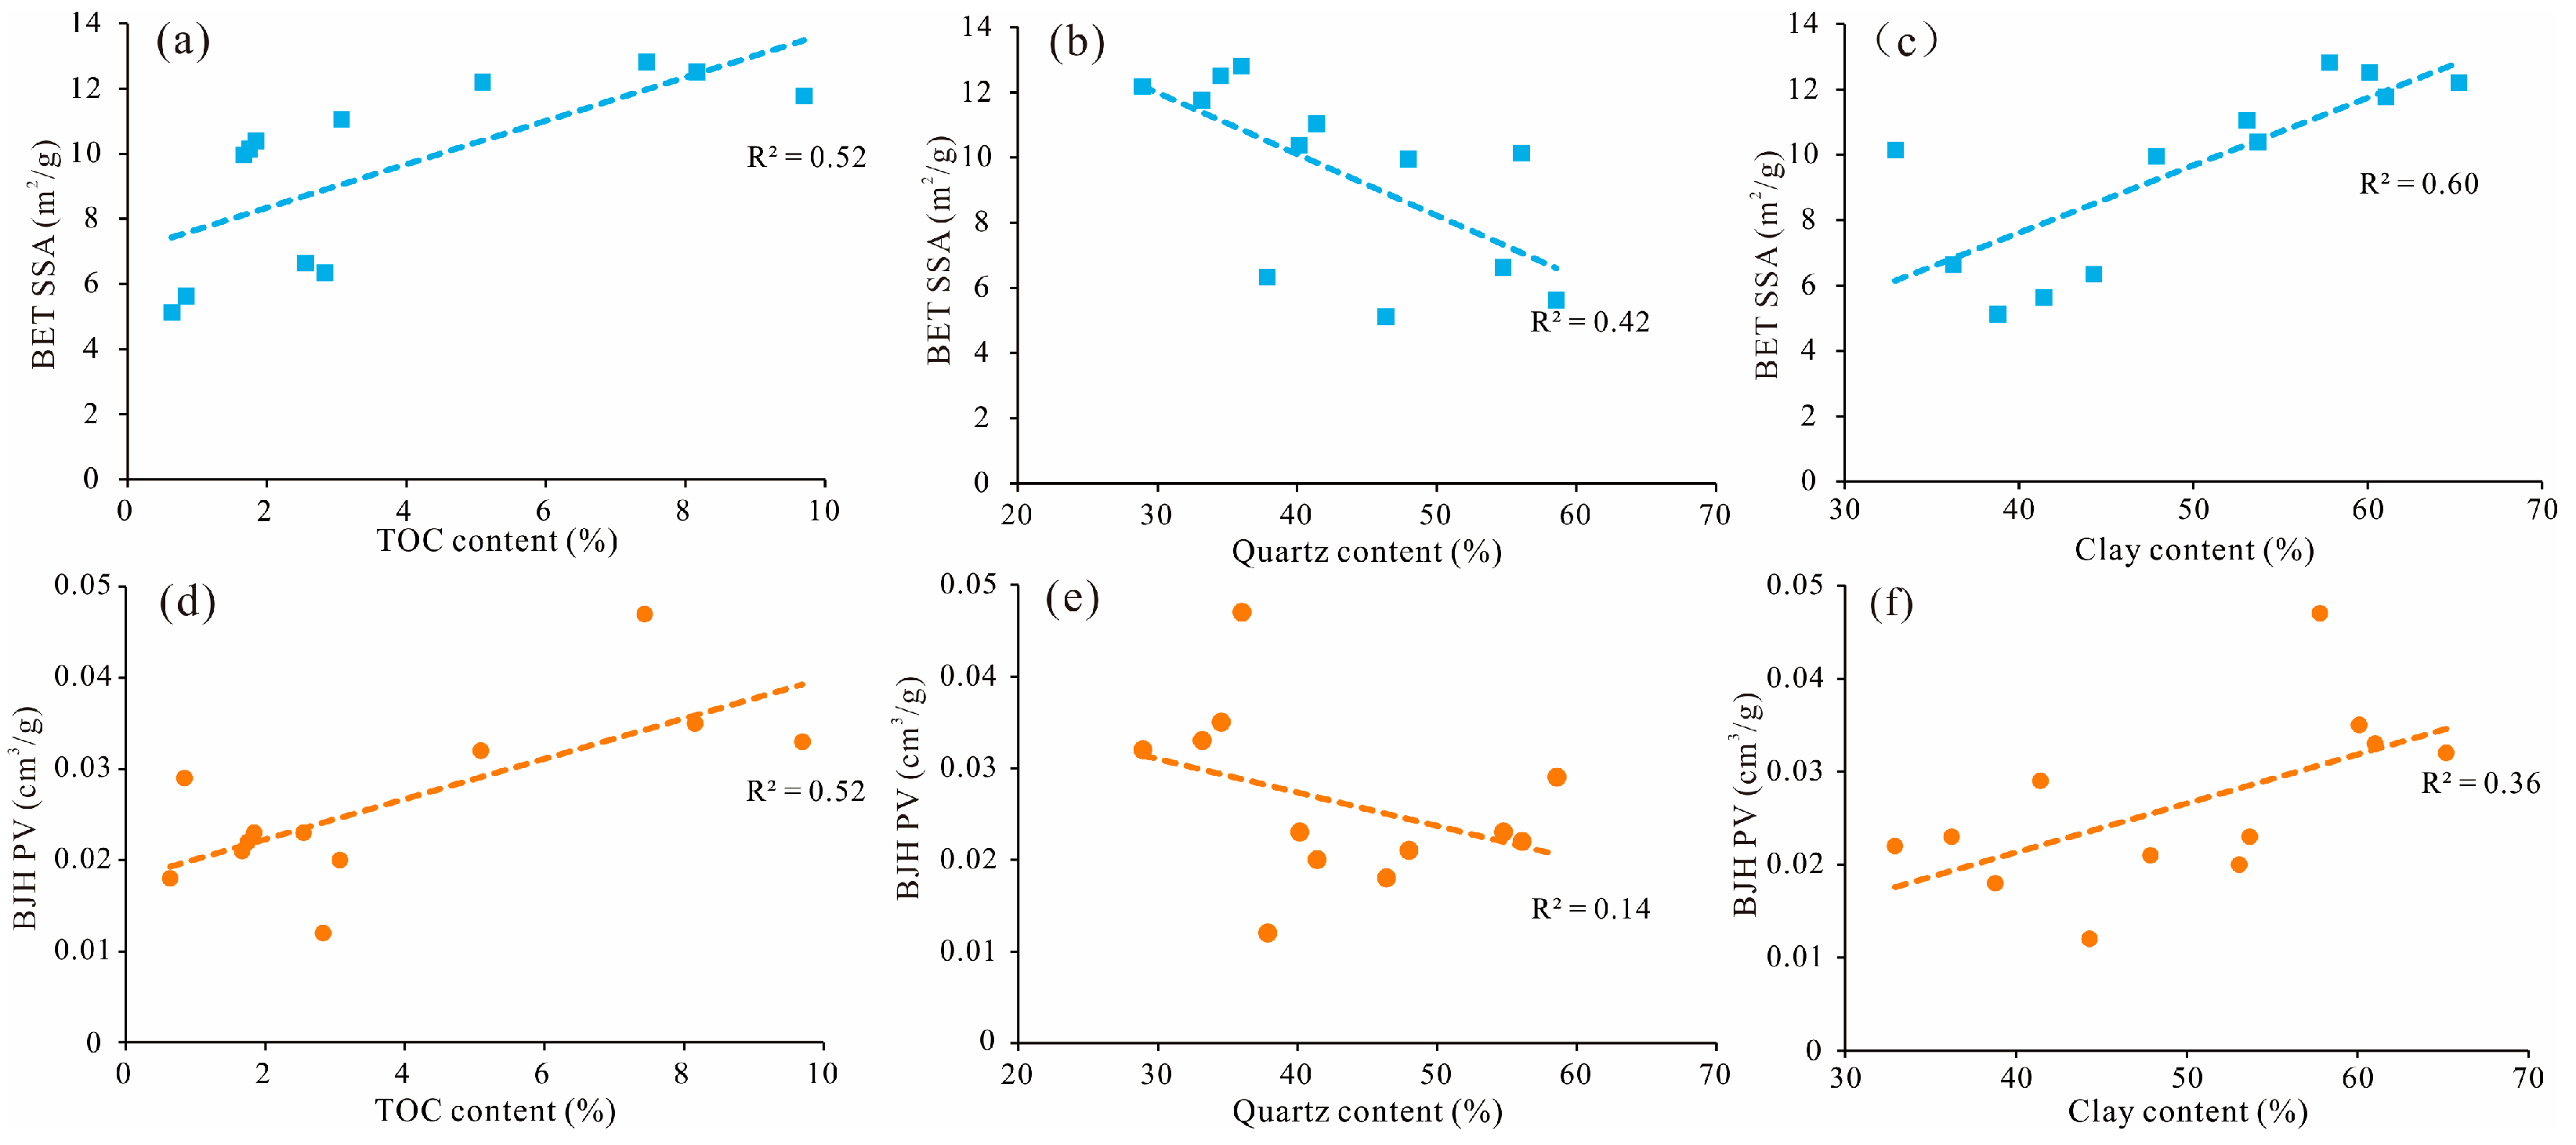
Studies have shown that the mineral composition and TOC content of shale are closely related to the pore structural characteristics of shale [3]. The link between TOC, the main shale mineral components, and the characteristics of the pore structure is shown in Figure 14. When the TOC content increases, the pore structure parameters (BET-SSA and BJH-PV) of the shale samples increase, with a positive correlation between the two parameters (R2 = 0.52 in Figure 14a,d). This suggests that as the number of micropores derived from organic matter increases, the pore specific surface area and pore volume also increase. This result is in agreement with those of previous studies [17,18,19,20,21]. Several academics have shown that the thermal development of hydrocarbon production causes the organic pore content of organic-rich shale to increase. The SSA of shale is increased by this kind of pore because it has a complicated internal structure and rough pore surface. The contact area between pores and gas molecules is greatly improved, and the adsorption capacity of shale is enhanced [17,18,19,20].
Figure 14b,c depict the link between pore structure characteristics and the main mineral components (clay and quartz) of the shale. BET-SSA is significantly correlated with the clay mineral content (R2 = 0.60) and inversely correlated with the quartz content (R2 = 0.42). The positive correlation between the BJH-PV and clay mineral content is weak (R2 = 0.36), and the inverse relationship between the BJH-PV and quartz content is weak (R2 = 0.14), demonstrating that BET-SSA and BJH-PV increase as the clay mineral content in transitional shale increases, and they decrease as the quartz content decreases. Owing to the fine granularity of clay minerals and the presence of micro- to nanoscale pores, the pore SSA is large. The positive correlation between the BJH-PV and clay minerals is weak because clay minerals develop micro- and nanopores, but the fine clay minerals fill some micropores and the pore throats are blocked, resulting in the reduction of micro- and nanopores and the reduction in pore volume. This finding is in agreement with those of previous studies [15,23,24,54]. As a result, many variables (shale mineral composition and TOC) rather than a single variable (such as TOC) affect how much the pore structure of the transitional shale develops in the study region.

5.3. Dimensions of Fractals and Their Influences

The complexity of the pores may be quantitatively described by the size of the fractal dimension, which is directly correlated with the growth of the pores. Therefore, the factors that control shale pores all affect the fractal dimension [21,34,35]. The main influential factors include the shale mineral composition, TOC content, burial depth, and diagenetic evolution stage [13,14,15]. As shown in Figure 15a, D1 and D2 are positively correlated with the TOC content (R2 = 0.22 and R2 = 0.53, respectively), demonstrating that as the amount of organic matter increases, the complexity of the pore structure of the shale and its capacity for adsorption also increase. This is in line with the results from lacustrine shales, continental shales, and marine gas shales because a greater TOC content causes the organic matter to produce more micropores, which leads to a more complex pore structure and an increased D value [15,21,22].
The analysis of the relationship between the fractal dimension (D1 and D2) and mineral composition (clay and quartz) shows that D2 has a clear negative correlation with the quartz content (R2 = 0.54), and D1 has a weak negative correlation with the quartz content (R2 = 0.07) (Figure 15b). It is hypothesized that the reason for the decrease in the fractal dimension as the quartz content increases may be the increase in the proportion of the terrigenous quartz content in the transitional shale of the Shanxi Formation. This is based on a comparison between the quartz content and quartz origin of the marine rocks. This type of silica is usually transported and deposited over a long distance, resulting in a high degree of mineral sorting and roundness. In the process of compaction and diagenesis, the mineral arrangement and support ability are strong, and the pore shape patterns are simple. The complexity of these pores is reduced [9,15,21]. The correlation between D1 and D2 and the clay mineral content is weak (D1 is R2 = 0.04; D2 is R2 = 0.32) (Figure 15c). Because the clay mineral content of the Shanxi Formation shales in the study area is generally high, the average content is more than 49% but the mineral particles are small. However, with compaction, the number of micropores and mesopores in the shale increases, making the correlation between them weak [21,22,23,24]. There is a good correlation between D1 and D2 (Figure 15d). Its correlation coefficient R2 = 0.56, indicating that the low-relative-pressure segment (0 < p/p0 < 0.5) and the high-relative-pressure segment (0.5 < p/p0 < 1.0) have the same pore fractal characteristics [25]. Previous studies on the heterogeneity of marine–continental transitional shale reservoirs have found that clay minerals and the TOC content are the main factors affecting the development of reservoir pores, but the performance is inconsistent in different regions due to the difference in the sedimentary environment. The shale pores in the southern Qinshui Basin are greatly affected by the kaolinite content. The illite/smectite mixed layer and illite in the Longtan shale of the Sichuan Basin are the keys to the formation of the pore system [30]. Therefore, the sedimentary environment of shale results in different mineral components and different contributions to pores.
Figure 16 depicts the link between D1 and D2 and the pore physical properties (BJH-PV and BET-SSA). Figure 16a shows that BET-SSA has a good positive trend with D1 and D2, demonstrating that the fractal dimension increases as the BET-SSA increases. On the other hand, the positive correlation between the BJH-PV and D1 and D2 is weak (Figure 16b), proving that BJH-PV has little influence on the fractal dimension. The study findings of marine shales, lacustrine shales, and continental shales are compatible with the association between pore structure parameters and the fractal dimension of transitional shales in the Shanxi Formation [16,21,36,37,38,39,55], demonstrating that the fractal dimension, inner pore surface roughness and irregularity, and pore structural complexity all increase as the SSA of transitional shales in the Shanxi Formation increases.

5.4. Connections between the Langmuir Parameters for CH4 Adsorption and the Fractal Dimension

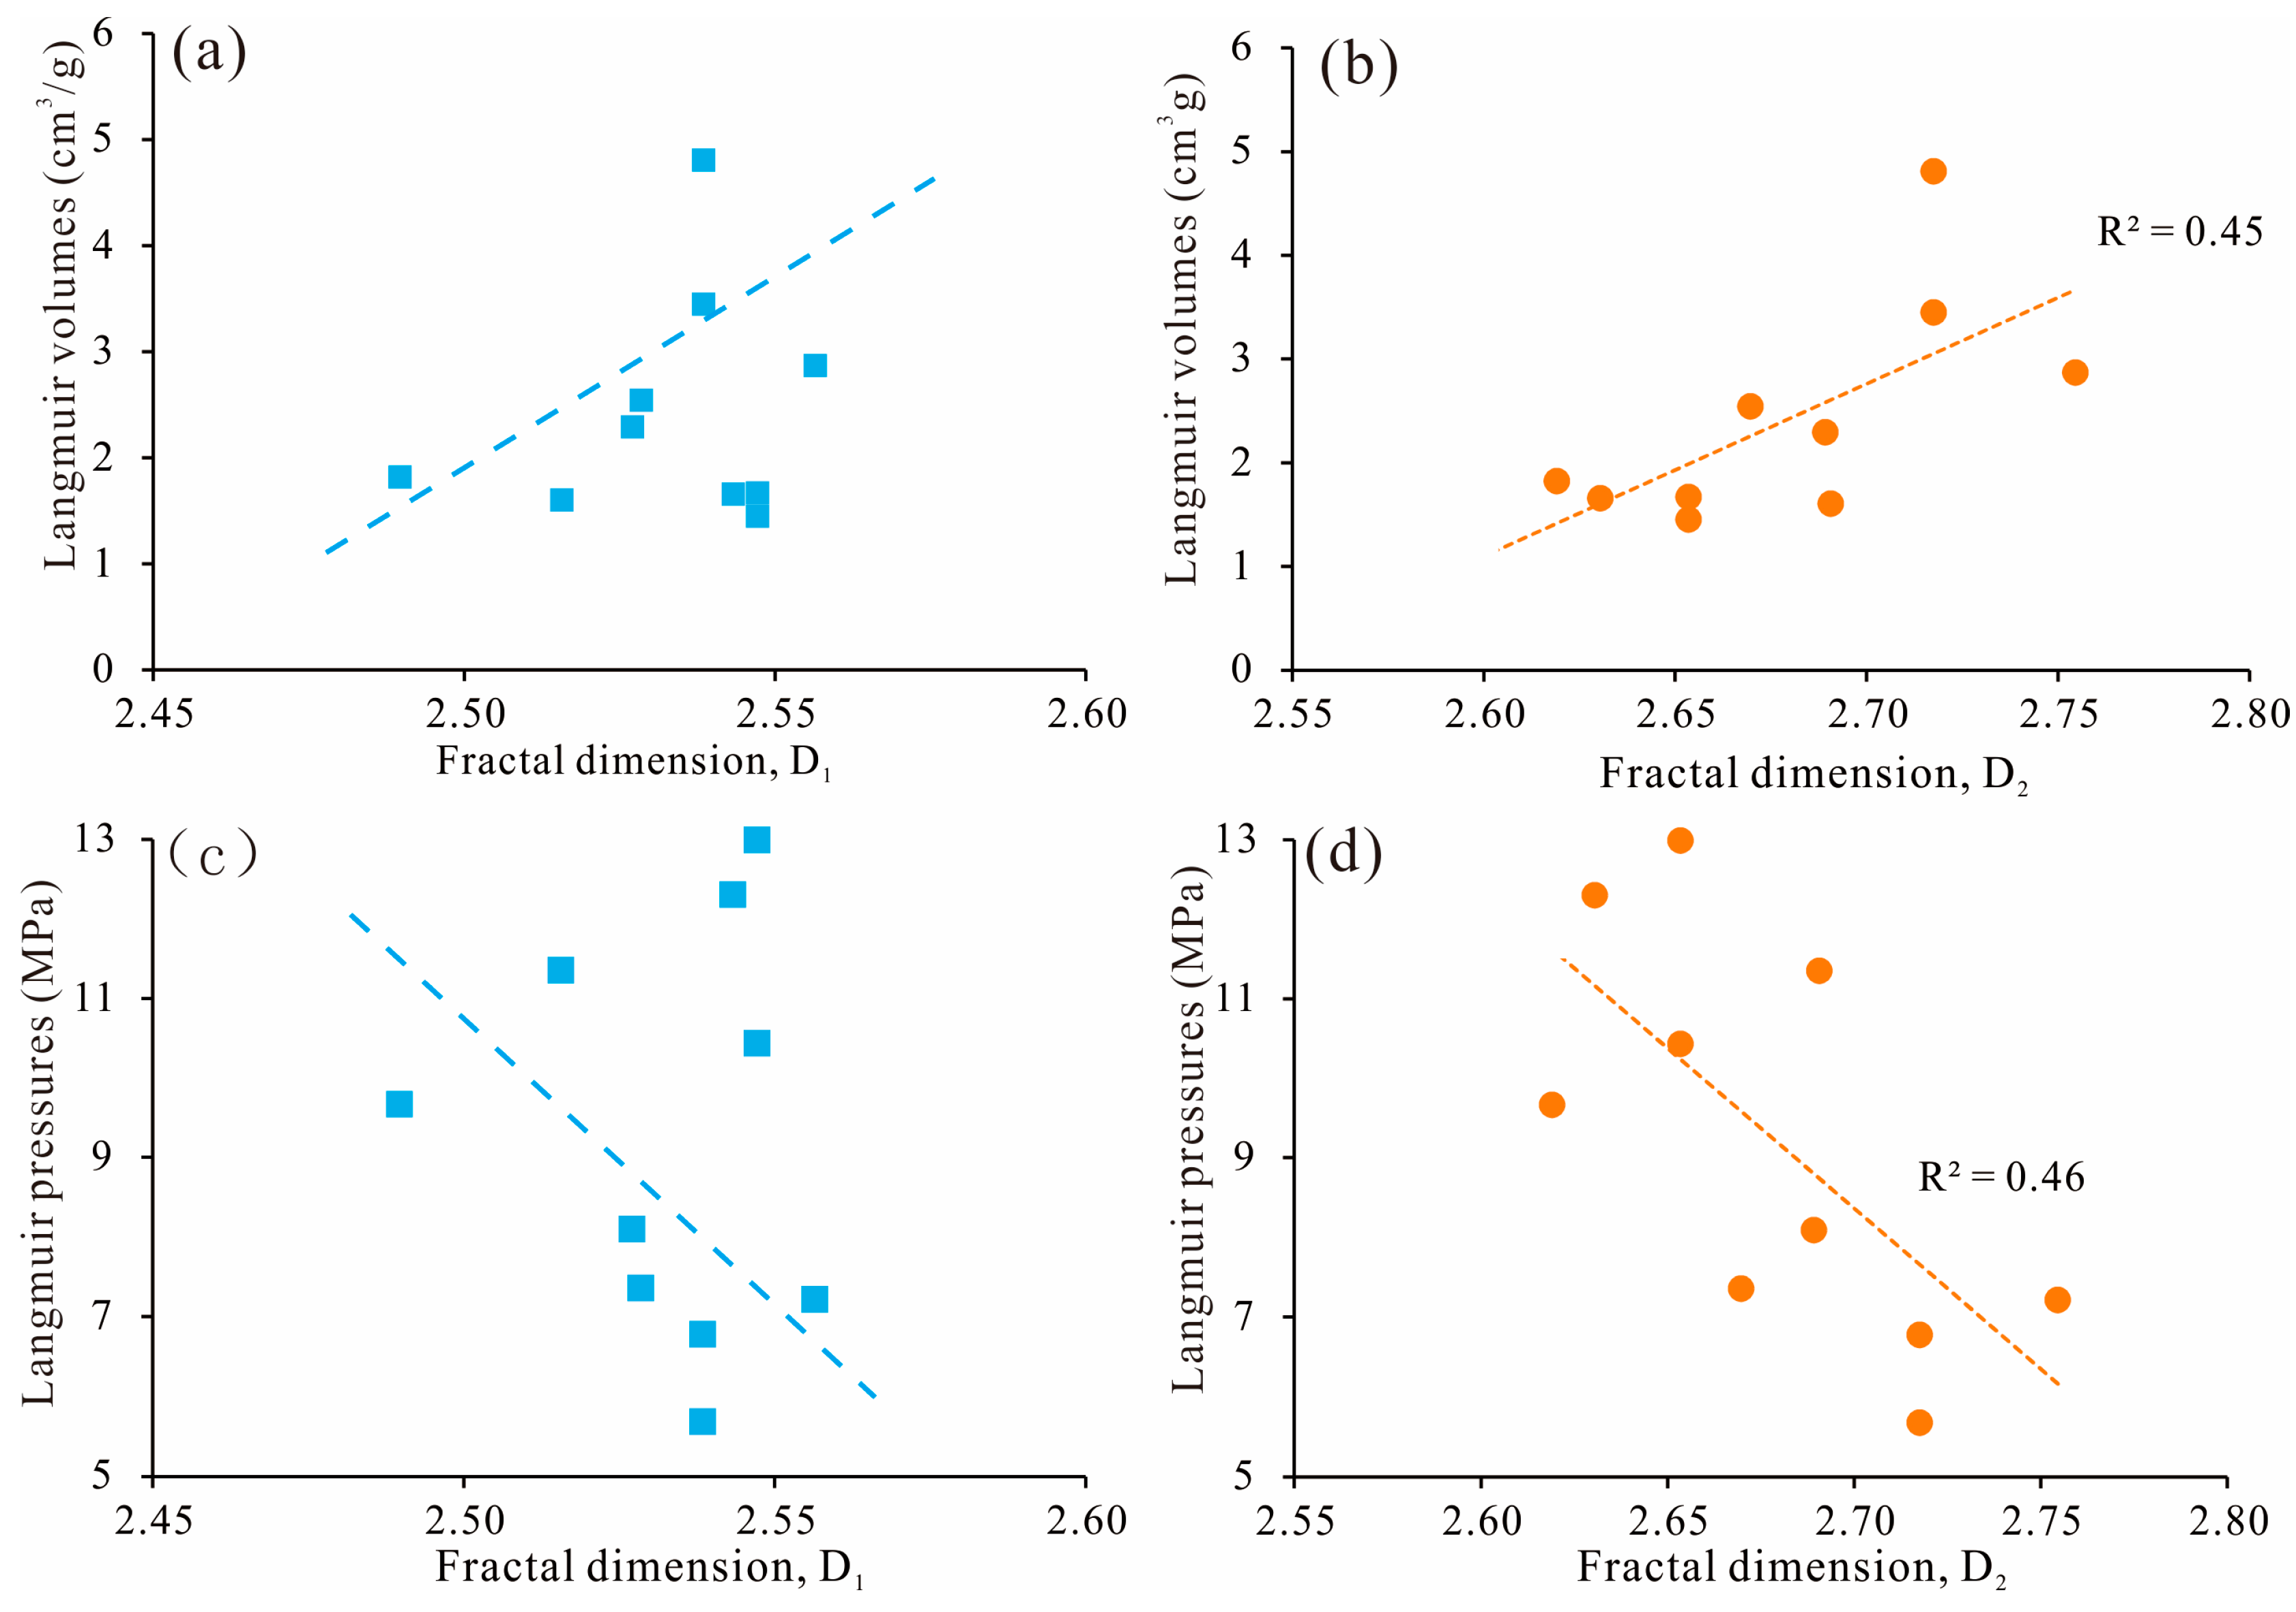
The presence of gas in shale is influenced by its pore structure. Shales with the same pore volume or particular surface area may have radically varying pore complexities, and the complexity and heterogeneity of pore development certainly have an impact on the pores’ ability to adsorb methane [8,35]. In general, as the fractal dimension increases, the complexity of the pore structure grows, and the capacity for gas adsorption steadily increases [2]. The majority of the SSA of the shale is provided by micropores, as shown in Figure 12b. Although the volume of micropores is small, their large number plays a crucial role in the complexity and heterogeneity of the pores. The increased proportion of micropores in shale, its complex internal structure, and rough pore surface greatly increase the SSA of shale [8,30,31,35]. According to the correlation between the fractal dimension of shale pores, Langmuir volume, and Langmuir pressure (Figure 17), the Langmuir volume shows a weak positive connection with D1 (Figure 17a) and a strong positive correlation with D2 (Figure 17b), which is consistent with earlier research [8,30,31,35]. Increasing D2 values correlate with coarser shale surfaces, more adsorption sites, and larger shale methane adsorption capacities. The Langmuir pressure of the shale is inversely related to D2 (Figure 17d). As D2 increases, the Langmuir pressure gradually decreases, and easier methane desorption of the shale reservoir is realized.

6. Conclusions

(1) The transitional shales of the Shanxi Formation in the study area are mainly composed of quartz and clay minerals. The quartz contents range from 28.92% to 58.98%, with a mean of 43.00%, while the clay contents range from 36.24% to 65.21%, with a mean of 49.37%. In comparison to marine shale, transitional shale has a higher clay content.
(2) The Shanxi Formation’s transitional shale contains primarily organic and intragranular pores. The pore structure of shale samples is categorized as H3 type based on the hysteresis ring type and curve of LT-N2A, indicating that the pore morphology is primarily composed of slit and parallel plate shapes.
(3) The transitional shale samples have total SSA values ranging from 11.126 to 47.220 m2/g, with a mean of 25.754 m2/g. The total PV values range from 0.014 to 0.056 cm3/g, with a mean of 0.031 cm3/g. Micropores were found to contribute the most to the total SSA, while mesoporous pores were found to contribute the most to the total PV.
(4) The pore structure of transitional shale is primarily influenced by the organic matter and mineral composition. The BET-SSA and BJH-PV, two important parameters of pore structure, show a positive correlation with the TOC and clay mineral contents but a negative correlation with the quartz content.
(5) According to the FHH model, the calculated fractal dimensions, D1 and D2, for transitional shale pores exhibit clear fractal characteristics. The fractal dimension is positively associated with both the TOC and clay mineral contents, while it is negatively associated with the quartz content. The BET-SSA is positively correlated with both D1 and D2, with D2 exhibiting a stronger fitting trend line than D1. In addition, the Langmuir volume is positively correlated with D2. As the value of D2 increases, the adsorption capacity of shale also increases.

Author Contributions

Conceptualization, D.W. and T.W.; methodology, H.H.; formal analysis, D.W. and Z.D.; investigation, T.W. and Z.D.; writing—original draft preparation, D.W. and T.W.; writing—review and editing, D.W. and T.W.; supervision, D.W. and Z.D.; project administration, Z.X. and H.H.; funding acquisition, D.W. and Z.D. All authors have read and agreed to the published version of the manuscript.

Funding

This research was jointly supported by the Research and Experiment on Scale Benefit Development Technology of Deep Coalbed Methane in Daning-Jixian (Grant No. 2022KT1401) and In Situ Bio-gasification Mechanism and Experimental Study of Coalbed Methane (Grant No. 2021DJ2302).

Data Availability Statement

All data are included in the manuscript.

Acknowledgments

We thank the PetroChina Research Institute of Petroleum Exploration and Development for picking up the samples.

Conflicts of Interest

The authors declare no conflict of interest.

References

  1. Adeyilola, A.; Nordeng, S.; Onwumelu, C.; Nwachukwu, F.; Gentzis, T. Geochemical, Petrographic and Petrophysical Characterization of the Lower Bakken Shale, Divide County, North Dakota. Int. J. Coal Geol. 2020, 224, 103477. [Google Scholar] [CrossRef]
  2. Zou, C.; Yang, Z.; He, D.; Wei, Y.; Li, J.; Jia, A.; Chen, J.; Zhao, Q.; Li, Y.; Li, J.; et al. Theory, Technology and Prospects of Conventional and Unconventional Natural Gas. Pet. Explor. Dev. 2018, 45, 604–618. [Google Scholar] [CrossRef]
  3. Zou, C.; Zhang, G.; Yang, Z.; Tao, S.; Hou, L.; Zhu, R.; Yuan, X.; Ran, Q.; Li, D.; Wang, Z. Concepts, Characteristics, Potential and Technology of Hydrocarbons: On Unconventional Petroleum Geology. Pet. Explor. Dev. 2013, 40, 413–428. [Google Scholar] [CrossRef]
  4. Wang, H.; Shi, Z.; Wang, Q.; Zhao, Q.; Dong, D.; Li, S.; Liu, D.; Sun, S.; Qiu, Z. Favorable Lithofacies Types and Genesis of Marine-Continental Transitional Black Shale: A Case Study of Permian Shanxi Formation in the Eastern Margin of Ordos Basin, NW China. Pet. Explor. Dev. 2021, 48, 1315–1328. [Google Scholar]
  5. Li, A.; Ding, W.; He, J.; Dai, P.; Yin, S.; Xie, F. Investigation of Pore Structure and Fractal Characteristics of Organic-Rich Shale Reservoirs: A Case Study of Lower Cambrian Qiongzhusi Formation in Malong Block of Eastern Yunnan Province, South China. Mar. Pet. Geol. 2016, 70, 46–57. [Google Scholar] [CrossRef]
  6. Ji, W.; Song, Y.; Jiang, Z.; Meng, M.; Liu, Q.; Chen, L.; Wang, P.; Gao, F.; Huang, H. Fractal Characteristics of Nano-Pores in the Lower Silurian Longmaxi Shales from the Upper Yangtze Platform, South China. Mar. Pet. Geol. 2016, 78, 88–98. [Google Scholar] [CrossRef]
  7. Li, Y.; Wang, Z.; Pan, Z.; Niu, X.; Yu, Y.; Meng, S. Pore Structure and Its Fractal Dimensions of Transitional Shale: A Cross-Section from East Margin of the Ordos Basin, China. Fuel 2019, 241, 417–431. [Google Scholar] [CrossRef]
  8. Kuang, L.; Dong, D.; He, W.; Wen, S.; Sun, S.; Li, S.; Qiu, Z.; Liao, X.; Li, Y.; Wu, J.; et al. Geological Characteristics and Development Potential of Transitional Shale Gas in the East Margin of the Ordos Basin, NW China. Pet. Explor. Dev. 2020, 47, 471–482. [Google Scholar] [CrossRef]
  9. Xie, W.D.; Wang, M.; Wang, X.Q.; Wang, Y.D.; Hu, C.Q. Nano-Pore Structure and Fractal Characteristics of Shale Gas Reservoirs: A Case Study of Longmaxi Formation in Southeastern Chongqing, China. J. Nanosci. Nanotechnol. 2021, 21, 343–353. [Google Scholar] [CrossRef]
  10. Zhou, S.; Liu, D.; Cai, Y.; Yao, Y.; Li, Z. 3D Characterization and Quantitative Evaluation of Pore-Fracture Networks of Two Chinese Coals Using FIB-SEM Tomography. Int. J. Coal Geol. 2017, 174, 41–54. [Google Scholar] [CrossRef]
  11. Sing, K. The Use of Nitrogen Adsorption for the Characterisation of Porous Materials. Colloid Surf. A 2001, 187–188, 3–9. [Google Scholar] [CrossRef]
  12. Wang, G.; Zhang, Q.; Zhu, R.; Tang, X.; Liu, K.; Jin, Z. Geological Controls on the Pore System of Lacustrine Unconventional Shale Reservoirs: The Triassic Chang 7 Member in the Ordos Basin, China. Geoenergy Sci. Eng. 2023, 221, 111139. [Google Scholar] [CrossRef]
  13. Wang, J.Y.; Guo, S.B. Study on the Relationship between Hydrocarbon Generation and Pore Evolution in Continental Shale from the Ordos Basin, China. Pet. Sci. 2021, 18, 1305–1322. [Google Scholar] [CrossRef]
  14. Al-Yaseri, A.Z.; Lebedev, M.; Vogt, S.J.; Johns, M.L.; Barifcani, A.; Iglauer, S. Pore-Scale Analysis of Formation Damage in Bentheimer Sandstone with in-Situ NMR and Micro-Computed Tomography Experiments. J. Pet. Sci. Eng. 2015, 129, 48–57. [Google Scholar] [CrossRef]
  15. Wang, T.; Tian, F.; Deng, Z.; Hu, H. Pore Structure and Fractal Characteristics of Wufeng–Longmaxi Formation Shale in Northern Yunnan–Guizhou, China. Front. Earth Sci. 2023, 10, 998958. [Google Scholar] [CrossRef]
  16. Han, H.; Guo, C.; Zhong, N.; Pang, P.; Gao, Y. A Study on Fractal Characteristics of Lacustrine Shales of Qingshankou Formation in the Songliao Basin, Northeast China Using Nitrogen Adsorption and Mercury Injection Methods. J. Pet. Sci. Eng. 2020, 193, 107378. [Google Scholar] [CrossRef]
  17. Li, Z.; Liu, D.; Cai, Y.; Ranjith, P.G.; Yao, Y. Multi-Scale Quantitative Characterization of 3-D Pore-Fracture Networks in Bituminous and Anthracite Coals Using FIB-SEM Tomography and X-Ray μ-CT. Fuel 2017, 209, 43–53. [Google Scholar] [CrossRef]
  18. Liu, K.; Ostadhassan, M.; Zhou, J.; Gentzis, T.; Rezaee, R. Nanoscale Pore Structure Characterization o f the Bakken Shale in the USA. Fuel 2017, 209, 567–578. [Google Scholar] [CrossRef]
  19. Mastalerz, M.; He, L.; Melnichenko, Y.B.; Rupp, J.A. Porosity of Coal and Shale: Insights from Gas Adsorption and SANS/USANS Techniques. Energ Fuel 2012, 26, 5109–5120. [Google Scholar] [CrossRef]
  20. Zhang, J.; Tang, Y.; He, D.; Sun, P.; Zou, X. Full-Scale Nanopore System and Fractal Characteristics of Clay-Rich Lacustrine Shale Combining FE-SEM, Nano-CT, Gas Adsorption and Mercury Intrusion Porosimetry. Appl. Clay Sci. 2020, 196, 105758. [Google Scholar] [CrossRef]
  21. Yang, R.; He, S.; Yi, J.; Hu, Q. Nano-Scale Pore Structure and Fractal Dimension of Organic-Rich Wufeng-Longmaxi Shale from Jiaoshiba Area, Sichuan Basin: Investigations Using FE-SEM, Gas Adsorption and Helium Pycnometry. Mar. Pet. Geol. 2016, 70, 27–45. [Google Scholar] [CrossRef]
  22. Ahmadi, Y. Improving Fluid Flow through Low Permeability Reservoir in the Presence of Nanoparticles: An Experimental Core Flooding WAG Tests. Iran. J. Oil Gas Sci. Technol. 2021, 10, 69–82. [Google Scholar]
  23. Chen, S.; Tao, S.; Tang, D.; Xu, H.; Li, S.; Zhao, J.; Jiang, Q.; Yang, H. Pore Structure Characterization of Different Rank Coals Using N2 and CO2 Adsorption and Its Effect on CH4 Adsorption Capacity: A Case in Panguan Syncline, Western Guizhou, China. Energ Fuel 2017, 31, 6034–6044. [Google Scholar] [CrossRef]
  24. Mandelbrot, B.B.; Wheeler, J.A. The Fractal Geometry of Nature. Am. J. Phys. 1983, 51, 286–287. [Google Scholar] [CrossRef]
  25. Pfeifer, P.; Avnir, D. Chemistry in Noninteger Dimensions between Two and Three. I. Fractal Theory of Heterogeneous Surfaces. J. Chem. Phys. 1983, 79, 3558–3565. [Google Scholar] [CrossRef]
  26. Hazra, B.; Wood, D.A.; Vishal, V.; Varma, A.K.; Sakha, D.; Singh, A.K. Porosity Controls and Fractal Disposition of Organic-Rich Permian Shales Using Low-Pressure Adsorption Techniques. Fuel 2018, 220, 837–848. [Google Scholar] [CrossRef]
  27. Chandra, D.; Vishal, V.; Bahadur, J.; Sen, D. A Novel Approach to Identify Accessible and Inaccessible Pores in Gas Shales Using Combined Low-Pressure Sorption and SAXS/SANS Analysis. Int. J. Coal Geol. 2020, 228, 103556. [Google Scholar] [CrossRef]
  28. Li, Y.; Zhou, D.H.; Wang, W.H.; Jiang, T.X.; Xue, Z.J. Development of Unconventional Gas and Technologies Adopted in China. Energy Geosci. 2020, 1, 55–68. [Google Scholar] [CrossRef]
  29. Clarkson, C.R.; Solano, N.; Bustin, R.M.; Bustin, A.M.M.; Chalmers, G.R.L.; He, L.; Melnichenko, Y.B.; Radliński, A.P.; Blach, T.P. Pore Structure Characterization of North American Shale Gas Reservoirs Using USANS/SANS, Gas Adsorption, and Mercury Intrusion. Fuel 2013, 103, 606–616. [Google Scholar] [CrossRef]
  30. Chen, S.B.; Zhu, Y.M.; Wang, H.Y.; Liu, H.L.; Wei, W.; Fang, J.H. Structure characteristics and accumulation significance of nanopores in Longmaxi shale gas reservoir in the southern Sichuan. Basin. J. China Coal Soc. 2012, 37, 438–444. [Google Scholar]
  31. Tian, H.; Zhang, S.C.; Liu, S.B.; Zhang, H. Determination of organic-rich shale pore features by mercury injection and gas adsorption methods. Acta Pet. Sin. 2012, 33, 419–427. [Google Scholar]
  32. Wang, Y.; Zhu, Y.; Liu, S.; Zhang, R. Pore Characterization and Its Impact on Methane Adsorption Capacity for Organic-Rich Marine Shales. Fuel 2016, 181, 227–237. [Google Scholar] [CrossRef]
  33. Yang, R.; He, S.; Hu, Q.; Hu, D.; Zhang, S.; Yi, J. Pore Characterization and Methane Sorption Capacity of Over-Mature Organic-Rich Wufeng and Longmaxi Shales in the Southeast Sichuan Basin, China. Mar. Pet. Geol. 2016, 77, 247–261. [Google Scholar] [CrossRef]
  34. Zhang, P.; Huang, Y.; Zhang, J.; Tang, X.; Liu, C.; Yang, J. Fractal characteristics of the Longtan Formation transitional shale in northwest Guizhou. J. China Coal Soc. 2018, 43, 1580–1588. [Google Scholar]
  35. Huang, Y.Q.; Zhang, P.; Zhang, J.C.; Yang, J.Y. The effect on the fractal characteristics of shale pores by mineral compositions of marine and marine-continental transitional shales. Bull. Mineral. Petrol. Geochem. 2020, 39, 548–557. [Google Scholar]
  36. Yang, Y.; Zhang, J.; Xu, L.; Li, P.; Liu, Y.; Dang, W. Pore Structure and Fractal Characteristics of Deep Shale: A Case Study from Permian Shanxi Formation Shale, from the Ordos Basin. Acs Omega 2022, 7, 9229–9243. [Google Scholar] [CrossRef]
  37. Qiu, Z.; Song, D.; Zhang, L.; Zhang, Q.; Zhao, Q.; Wang, Y.; Liu, H.; Liu, D.; Li, S.; Li, X. The Geochemical and Pore Characteristics of a Typical Marine–Continental Transitional Gas Shale: A Case Study of the Permian Shanxi Formation on the Eastern Margin of the Ordos Basin. Energy Rep. 2021, 7, 3726–3736. [Google Scholar] [CrossRef]
  38. Zhang, Q.; Qiu, Z.; Zhao, Q.; Zhang, L.; Dong, D.; Wang, Y.; Hou, W.; Li, S.; Li, X. Composition Effect on the Pore Structure of Transitional Shale: A Case Study of the Permian Shanxi Formation in the Daning–Jixian Block at the Eastern Margin of the Ordos Basin. Front. Earth Sci. 2022, 9, 802713. [Google Scholar] [CrossRef]
  39. Yang, C.; Zhang, J.; Wang, X.; Tang, X.; Chen, Y.; Jiang, L.; Gong, X. Nanoscale Pore Structure and Fractal Characteristics of a Marine-Continental Transitional Shale: A Case Study from the Lower Permian Shanxi Shale in the Southeastern Ordos Basin, China. Mar. Pet. Geol. 2017, 88, 54–68. [Google Scholar] [CrossRef]
  40. Shan, C.; Zhao, W.; Wang, F.; Zhang, K.; Feng, Z.; Guo, L.; Ma, X.; Liao, T. Nanoscale Pore Structure Heterogeneity and Its Quantitative Characterization in Chang7 Lacustrine Shale of the Southeastern Ordos Basin, China. J. Pet. Sci. Eng. 2020, 187, 106754. [Google Scholar] [CrossRef]
  41. Brunauer, S.; Emmett, P.H.; Teller, E. Adsorption of Gases in Multimolecular Layers. J. Am. Chem. Soc. 1938, 60, 309–319. [Google Scholar] [CrossRef]
  42. Meng, M.; Ge, H.; Shen, Y.; Ji, W. Fractal Characterization of Pore Structure and Its Influence on Salt Ion Diffusion Behavior in Marine Shale Reservoirs. Int. J. Hydrogen Energy 2020, 45, 28520–28530. [Google Scholar] [CrossRef]
  43. Loucks, R.G.; Ruppel, S.C. Mississippian Barnett Shale: Lithofacies and Depositional Setting of a Deep-Water Shale-Gas Succession in the Fort Worth Basin, Texas. Aapg Bull. 2007, 91, 579–601. [Google Scholar] [CrossRef]
  44. Li, X.; Wang, Y.; Lin, W.; Ma, L.; Liu, D.; Liu, J.; Zhang, Y. Micro-Pore Structure and Fractal Characteristics of Deep Shale from Wufeng Formation to Longmaxi Formation in Jingmen Exploration Area, Hubei Province, China. J. Nat. Gas Geosci. 2022, 7, 121–132. [Google Scholar] [CrossRef]
  45. Wang, X.; Zhu, Y.; Wang, Y. Fractal Characteristics of Micro- and Mesopores in the Longmaxi Shale. Energies 2020, 13, 1349. [Google Scholar] [CrossRef]
  46. Wang, M.; Xue, H.; Tian, S.; Wilkins, R.W.T.; Wang, Z. Fractal Characteristics of Upper Cretaceous Lacustrine Shale from the Songliao Basin, NE China. Mar. Pet. Geol. 2015, 67, 144–153. [Google Scholar] [CrossRef]
  47. Goral, J.; Walton, I.; Andrew, M.; Deo, M. Pore System Characterization of Organic-Rich Shales Using Nanoscale-Resolution 3D Imaging. Fuel 2019, 258, 116049. [Google Scholar] [CrossRef]
  48. Josh, M.; Delle Piane, C.; Esteban, L.; Bourdet, J.; Mayo, S.; Pejcic, B.; Burgar, I.; Luzin, V.; Clennell, M.B.; Dewhurst, D.N. Advanced Laboratory Techniques Characterising Solids, Fluids and Pores in Shales. J. Pet. Sci. Eng. 2019, 180, 932–949. [Google Scholar] [CrossRef]
  49. Liu, X.; Xiong, J.; Liang, L. Investigation of Pore Structure and Fractal Characteristics of Organic-Rich Yanchang Formation Shale in Central China by Nitrogen Adsorption/Desorption Analysis. J. Nat. Gas Sci. Eng. 2015, 22, 62–72. [Google Scholar] [CrossRef]
  50. Sing, K.S.W. Reporting Physisorption Data for Gas/Solid Systems with Special Reference to the Determination of Surface Area and Porosity (Recommendations 1984). Pure Appl. Chem. 1985, 57, 603–619. [Google Scholar] [CrossRef]
  51. Peng, N.; He, S.; Hu, Q.; Zhang, B.; He, X.; Zhai, G.; He, C.; Yang, R. Organic Nanopore Structure and Fractal Characteristics of Wufeng and Lower Member of Longmaxi Shales in Southeastern Sichuan, China. Mar. Pet. Geol. 2019, 103, 456–472. [Google Scholar] [CrossRef]
  52. Wang, Y.; Zhu, Y.; Wang, H.; Feng, G. Nanoscale Pore Morphology and Distribution of Lacustrine Shale Reservoirs: Examples from the Upper Triassic Yanchang Formation, Ordos Basin. J. Energy Chem. 2015, 24, 512–519. [Google Scholar] [CrossRef]
  53. Thommes, M.; Kaneko, K.; Neimark, A.V.; Olivier, J.P.; Rodriguez-Reinoso, F.; Rouquerol, J.; Sing, K.S.W. Physisorption of Gases, with Special Reference to the Evaluation of Surface Area and Pore Size Distribution (IUPAC Technical Report). Pure Appl. Chem. 2015, 87, 1051–1069. [Google Scholar] [CrossRef]
  54. Wang, X.; Jiang, Z.; Jiang, S.; Chang, J.; Zhu, L.; Li, X.; Li, J. Full-Scale Pore Structure and Fractal Dimension of the Longmaxi Shale from the Southern Sichuan Basin: Investigations Using FE-SEM, Gas Adsorption and Mercury Intrusion Porosimetry. Minerals 2019, 9, 543. [Google Scholar] [CrossRef]
  55. Hu, J.; Tang, S.; Zhang, S. Investigation of Pore Structure and Fractal Characteristics of the Lower Silurian Longmaxi Shales in Western Hunan and Hubei Provinces in China. J. Nat. Gas Sci. Eng. 2016, 28, 522–535. [Google Scholar] [CrossRef]
  56. Sun, M.; Yu, B.; Hu, Q.; Chen, S.; Xia, W.; Ye, R. Nanoscale Pore Characteristics of the Lower Cambrian Niutitang Formation Shale: A Case Study from Well Yuke #1 in the Southeast of Chongqing, China. Int. J. Coal Geol. 2016, 154–155, 16–29. [Google Scholar]
  57. Milliken, K.L.; Rudnicki, M.; Awwiller, D.N.; Zhang, T. Organic Matter–Hosted Pore System, Marcellus Formation (Devonian), Pennsylvania. AAPG Bull. 2013, 97, 177–200. [Google Scholar] [CrossRef]
  58. Chang, J.; Fan, X.; Jiang, Z.; Wang, X.; Chen, L.; Li, J.; Zhu, L.; Wan, C.; Chen, Z. Differential Impact of Clay Minerals and Organic Matter on Pore Structure and Its Fractal Characteristics of Marine and Continental Shales in China. Appl. Clay Sci. 2022, 216, 106334. [Google Scholar] [CrossRef]
  59. Loucks, R.G.; Reed, R.M.; Ruppel, S.C.; Hammes, U. Spectrum of Pore Types and Networks in Mudrocks and a Descriptive Classification for Matrix-Related Mudrock Pores. Aapg Bull. 2012, 96, 1071–1098. [Google Scholar] [CrossRef]
  60. Kumar, S.; Mendhe, V.A.; Kamble, A.D.; Varma, A.K.; Mishra, D.K.; Bannerjee, M.; Buragohain, J.; Prasad, A.K. Geochemical Attributes, Pore Structures and Fractal Characteristics of Barakar Shale Deposits of Mand-Raigarh Basin, India. Mar. Pet. Geol. 2019, 103, 377–396. [Google Scholar] [CrossRef]
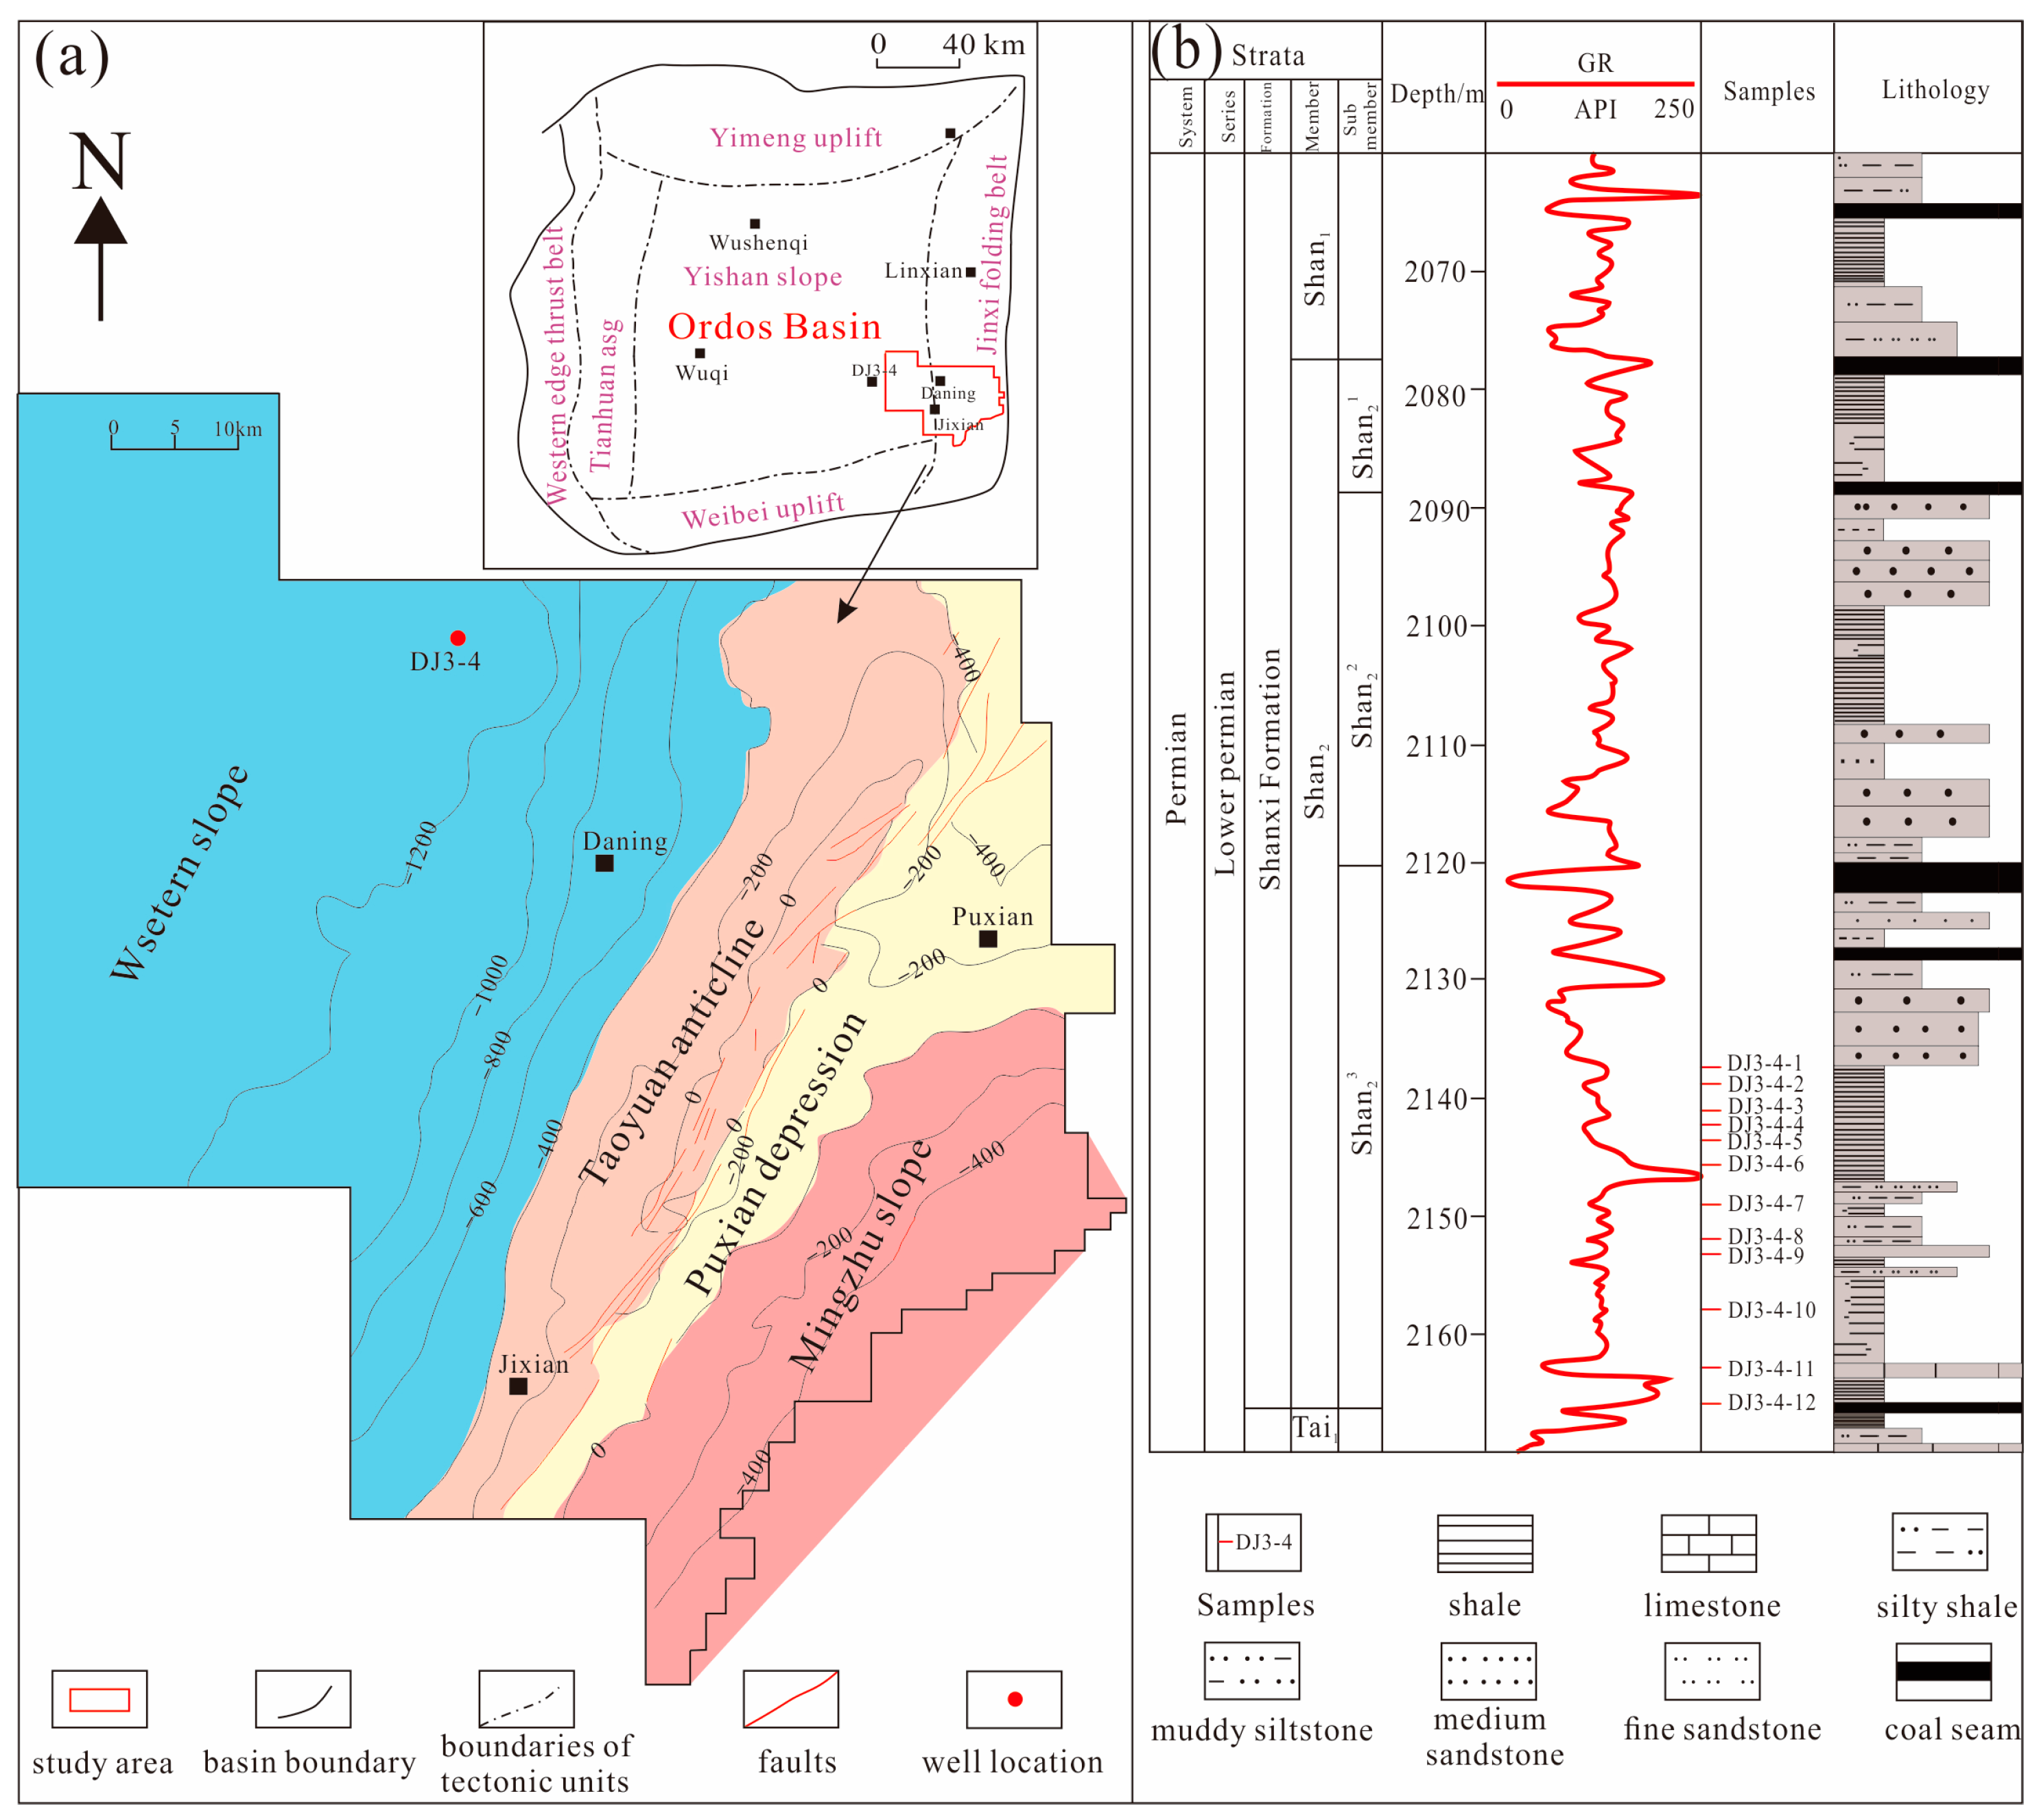
Figure 1. (a) Location of study areas of the sedimentary facies [38]; (b) stratigraphy of the Shanxi Formation.
Processes 11 01424 g001
Figure 2. (a) Connection between the TOC and quartz content; (b) connection between the clay mineral content and TOC.
Processes 11 01424 g002
Figure 3. FE-SEM images of samples of Shanxi shale showing the main pore types and geometries. (a) Organic pores and microfractures, DJ3-4-11 (TOC = 0.84%); (b) organic pores, DJ3-4-3 (TOC = 2.17%); (c) organic pores, microfractures, and interparticle pores, DJ3-4-7 (TOC = 2.83%); (d) organic pores and interparticle pores, DJ3-4-12 (TOC = 9.70%); (e) intraparticle pores, DJ3-4-10 (TOC = 2.19%); (f) interparticle pores, DJ3-4-12 (TOC = 9.70%).
Processes 11 01424 g003
Figure 4. FE-SEM images of samples of Shanxi shale showing the main pore types and geometries. (a) Fractures between clay layers, DJ3-4-6 (TOC = 8.16%); (b) interparticle pores and organic, DJ3-4-12 (TOC = 9.70%); (c) intraparticle pores between clay layers, DJ3-4-4 (TOC = 5.09%); (d) edge cracks showing organic matter, DJ3-4-5 (TOC = 7.44%); (e) pyrite interparticle pores, DJ3-4-4 (TOC = 5.09%); (f) organic pores between pyrite and organics; DJ3-4-3 (TOC = 2.17%).
Processes 11 01424 g004
Figure 5. Isotherms of N2 adsorption and desorption in shale samples.
Processes 11 01424 g005
Figure 6. Curves of the pore size distribution from the LP-N2A experiment.
Processes 11 01424 g006
Figure 7. LP-CO2A isotherms of shale samples.
Processes 11 01424 g007
Figure 8. Pore size distributions obtained from LP-CO2A.
Processes 11 01424 g008
Figure 9. (a) Isothermal adsorption curves of shale samples and (b) associations between the TOC and Langmuir volume of shale samples.
Processes 11 01424 g009
Figure 10. Fractal calculation results.
Processes 11 01424 g010
Figure 11. Comparison of the fractal dimensions of marine, continental, lacustrine, and transitional shales in typical basins [5,6,7,13,15,16,20,36,40,44,45,46,54,55,56,57]. (a): Marine shale; (b): Lacustrine, continental, marine–continental transitional shale.
Processes 11 01424 g011
Figure 12. Proportions of various pore sizes as determined by LT-N2A and LP-CO2A; (a) percentage of PV; (b) percentage of pore SSA.
Processes 11 01424 g012
Figure 13. Correlation between the BJH-TPV derived from the LT-N2A and BET-SSA.
Processes 11 01424 g013
Figure 14. Links between the pore structure parameters, quartz, TOC values, and clay minerals. (a,d): TOC versus BET-SSA and BJH-PV; (b,e) quartz content versus BET-SSA and BJH-PV; and (c,f) clay content versus BET-SSA and BJH-PV.
Processes 11 01424 g014
Figure 15. Quartz, clay mineral, and TOC contents, as well as the fractal dimensions, are related to each other. (a) TOC relative to D1 and D2; (b) quartz content versus D1 and D2; (c) clay content versus D1 and D2; (d) D1 versus D2.
Processes 11 01424 g015
Figure 16. Pore structural parameters and fractal dimensions in relation to each other. (a) BJH-PV versus D1 and D2; (b) BET-SSA versus D1 and D2.
Processes 11 01424 g016
Figure 17. (a,b) Relationships between the Langmuir volume and D1 and D2; (c,d) affiliations between Langmuir pressures and D1 and D2.
Processes 11 01424 g017
Table 1. Transitional shale from the Shanxi Formation, including its TOC percentage, thermal maturity, and mineral makeup.
SamplesStrataDepth (m)TOC
(%)
Ro
(%)
Quartz
(%)
Total Clays
(%)
Potash Feldspar
(%)
Plagioclase
(%)
Calcite
(%)
Dolomite
(%)
Pyrite
(%)
Siderite
(%)
DJ3-4-1Shanxi Fm.2138.292.552.1754.7736.240.000.001.144.992.870.00
DJ3-4-2Shanxi Fm.2139.050.642.1246.3938.790.002.530.006.520.974.81
DJ3-4-3Shanxi Fm.2141.393.072.1741.4153.070.000.000.000.001.414.11
DJ3-4-4Shanxi Fm.2142.6355.092.3428.9265.210.000.000.000.005.870.00
DJ3-4-5Shanxi Fm.2143.3957.442.3336.0357.800.001.710.001.270.632.56
DJ3-4-6Shanxi Fm.2145.218.162.334.5460.100.001.710.001.390.691.58
DJ3-4-7Shanxi Fm.2149.192.832.2937.8744.310.000.0011.012.554.260.00
DJ3-4-8Shanxi Fm.2152.091.752.0856.1032.910.001.640.006.173.180.00
DJ3-4-9Shanxi Fm.2153.641.672.2348.0047.870.000.000.001.221.151.76
DJ3-4-10Shanxi Fm.2158.611.842.1940.1853.690.002.490.000.000.642.99
DJ3-4-11Shanxi Fm.2163.10.842.1358.5841.420.000.000.000.000.000.00
DJ3-4-12Shanxi Fm.2166.099.702.3633.1861.040.001.380.000.000.004.40
Table 2. Mineral composition of shale reservoirs in typical basins.
SiteFormationFaciesMineral CompositionRange (%)Mean (%)Source
Northern Yunnan–GuizhouWufeng–LongmaxiMarineClay16.7–39.629.0Wang et al., 2023 [15]
Quartz24.7–63.340.9
Ordos BasinYanchangContinentalClay39.0–46.043.0Wang et al., 2021 [17]
Quartz33.0–40.036.6
Songliao BasinNenjiangLacustrineClay42.1–64.453.8Zhang et al., 2020 [21]
Quartz20.1–34.726.2
Sichuan BasinNiutitangMarineClay7.8–36.220.6Meng et al., 2020 [42]
Quartz21.2–56.735.3
Fort Worth BasinBarnettMarineClay7.0–48.024.2Loucks et al., 2006 [43]
Quartz8.0–58.034.3
Jingmen exploration areaWufeng–LongmaxiMarineClay15.4–52.139.6Li et al., 2022 [44]
Quartz38.0–58.844.6
Sichuan BasinLongmaxiMarineClay10.2–42.221.4Wang et al., 2020 [45]
Quartz32.0–83.052.3
Songliao BasinQingshankouLacustrineClay41.0–65.954.6Wang et al., 2015 [46]
Quartz17.2–39.026.2
Eastern margin of the Ordos BasinShanxiTransitionalClay32.9–65.249.4Tested
Quartz28.9–58.643.0
Table 3. Results of the LT-N2A and LP-CO2A analyses of shale samples.
SamplesStrataLP-CO2ALT-N2A
SDFT (m2/g)VDFT (cm3/g)DCO2 (nm)SBET (m2/g)VBJH (cm3/g)DN2 (nm)
DJ3-4-1Shanxi Fm.6.0360.0020.3496.6300.0233.970
DJ3-4-2Shanxi Fm.6.0250.0020.3495.1180.0182.455
DJ3-4-3Shanxi Fm.14.1630.0040.34911.0460.0204.215
DJ3-4-4Shanxi Fm.22.4200.0070.50112.1890.0323.966
DJ3-4-5Shanxi Fm.31.3580.0090.34912.8120.0473.977
DJ3-4-6Shanxi Fm.33.2260.0100.34912.5090.0353.967
DJ3-4-7Shanxi Fm.9.5330.0030.5516.3370.0124.758
DJ3-4-8Shanxi Fm.9.9650.0030.57610.1380.0224.362
DJ3-4-9Shanxi Fm.12.9570.0040.5179.9540.0214.283
DJ3-4-10Shanxi Fm.12.9100.0040.57310.3860.0233.977
DJ3-4-11Shanxi Fm.7.0440.0020.4795.6240.0293.964
DJ3-4-12Shanxi Fm.38.8030.0110.34911.7630.0333.960
Note: SDFT = DFT specific surface area; VDFT = DFT pore volume; SBET = BET specific surface area; VBJH = BJH pore volume; DN2 = average pore width by LT-N2A; DCO2 = average pore width by LP-CO2A.
Table 4. Methane adsorption results of shale samples.
SamplesStrataDepths PL (MPa)VL (cm3/g)
DJ3-4-1Shanxi Fm.2138.2912.301.66
DJ3-4-3Shanxi Fm.2141.399.661.82
DJ3-4-4Shanxi Fm.2142.6357.352.54
DJ3-4-5Shanxi Fm.2143.3957.212.87
DJ3-4-6Shanxi Fm.2145.216.773.45
DJ3-4-7Shanxi Fm.2149.1911.351.60
DJ3-4-8Shanxi Fm.2152.0912.991.45
DJ3-4-9Shanxi Fm.2153.6410.431.67
DJ3-4-10Shanxi Fm.2158.618.092.29
DJ3-4-12Shanxi Fm.2166.095.684.81
Table 5. Fractal dimensions derived from the FHH model.
SamplesStratap/p0 = 0~0.45p/p0 = 0.45~1.0
A1R2D1A2R2D2
DJ3-4-1Shanxi Fm.−0.4570.9982.543−0.3700.9912.631
DJ3-4-2Shanxi Fm.−0.5010.9832.499−0.3670.9972.633
DJ3-4-3Shanxi Fm.−0.5100.9852.490−0.3810.9992.619
DJ3-4-4Shanxi Fm.−0.4720.9912.529−0.3300.9962.670
DJ3-4-5Shanxi Fm.−0.4440.9882.557−0.2450.9732.755
DJ3-4-6Shanxi Fm.−0.4620.9902.539−0.2820.9762.718
DJ3-4-7Shanxi Fm.−0.4840.9992.516−0.3090.9912.691
DJ3-4-8Shanxi Fm.−0.4530.9972.547−0.3470.9992.654
DJ3-4-9Shanxi Fm.−0.4460.9972.547−0.3030.9872.654
DJ3-4-10Shanxi Fm.−0.4730.9952.527−0.3110.9902.689
DJ3-4-11Shanxi Fm.−0.5300.9802.470−0.4690.9992.531
DJ3-4-12Shanxi Fm.−0.4740.9892.539−0.3320.9992.718
Table 6. The absolute micropore, mesopore, macropore PV, and SSA values of shale samples.
SamplesPV (cm3/g)SSA (m2/g)
MicroporeMesoporeMacroporeTotalMicroporeMesoporeMacroporeTotal
DJ3-4-10.0020.0170.0060.0256.296.090.2012.583
DJ3-4-20.0020.0120.0050.0196.334.620.1811.126
DJ3-4-30.0040.0170.0030.02414.718.790.0923.593
DJ3-4-40.0070.0240.0080.03922.9910.420.2733.684
DJ3-4-50.0100.0290.0170.05632.1310.060.5842.761
DJ3-4-60.0100.0230.0120.04533.2510.940.3944.590
DJ3-4-70.0030.0100.0010.01410.655.450.0516.154
DJ3-4-80.0030.0180.0030.0249.928.660.1118.697
DJ3-4-90.0040.0180.0030.02513.778.500.1122.382
DJ3-4-100.0050.0190.0040.02713.749.310.1423.184
DJ3-4-110.0020.0170.0120.0317.315.410.3713.080
DJ3-4-120.0110.0230.0100.04538.808.070.3547.220
Disclaimer/Publisher’s Note: The statements, opinions and data contained in all publications are solely those of the individual author(s) and contributor(s) and not of MDPI and/or the editor(s). MDPI and/or the editor(s) disclaim responsibility for any injury to people or property resulting from any ideas, methods, instructions or products referred to in the content.