Article

Application of the MPPT Control Algorithm Based on Hybrid Quantum Particle Swarm Optimization in a Photovoltaic Power Generation System

Yunnan Electric Power Grid Research Institute, Kunming 650217, China
*
Author to whom correspondence should be addressed.
Processes 2023, 11(5), 1456; https://doi.org/10.3390/pr11051456
Submission received: 6 April 2023 / Revised: 6 May 2023 / Accepted: 7 May 2023 / Published: 11 May 2023
(This article belongs to the Special Issue Photovoltaic (PV) Systems: Modelling, Measurement and Assessment)

Abstract

:
The Maximum Power Point Tracking method is a mainstream method for improving the operational efficiency of photovoltaic power generation, but it is difficult to adapt to the rapidly changing environment and lacks good steady-state and dynamic performance. To achieve fast and accurate tracking of the Maximum Power Point Tracking, the optimization of the contraction expansion coefficient of the Quantum Particle Swarm Optimization algorithm is studied, and then the Levy flight strategy is introduced to optimize the algorithm’s global convergence ability, thereby constructing the Hybrid Quantum Particle Swarm Optimization algorithm. Finally, the Hybrid Quantum Particle Swarm Optimization combined with the Maximum Power Point Tracking algorithm is obtained. The research results showed that the Hybrid Quantum Particle Swarm Optimization combined with the Maximum Power Point Tracking algorithm can always converge to the theoretical minimum value with a probability of more than 94% in the Roserock function and Rastigin function tests. The tracking error of the Hybrid Quantum Particle Swarm Optimization combined with the Maximum Power Point Tracking algorithm was less than 1% under lighting conditions. The convergence time of the Hybrid Quantum Particle Swarm Optimization combined with the Maximum Power Point Tracking algorithm in arbitrary shadow occlusion environments can reach a stable state within 0.1 s. In summary, the Hybrid Quantum Particle Swarm Optimization combined with the Maximum Power Point Tracking algorithm proposed in the study has excellent performance and very wide applicability. To a certain extent, it improves the total power generation capacity of the photovoltaic power generation system and the power generation efficiency of the photovoltaic array.

1. Introduction

At present, solar photovoltaics has become one of the most important renewable energy sources in the world. With the continuous development of technology and the expansion of industrial scale, the cost of solar photovoltaic power generation is also continuously decreasing [1,2,3]. According to data from the International Energy Agency, the cost of solar photovoltaic power generation (PPG) has decreased by nearly 80% in the past decade [4]. In addition, the installed capacity of global solar PPG is constantly increasing. According to the International Energy Agency’s prediction, the installed capacity of global solar photovoltaic power generation will reach 1.4 trillion watts by 2030, and China is the largest solar photovoltaic market in the world, with its installed capacity accounting for one-third of the world’s [5]. PPG has significant energy, environmental protection, and economic benefits, making it one of the highest-quality green energy sources. According to the World Wildlife Fund’s analysis of the effectiveness of reducing carbon dioxide emissions, installing a one-square-meter PPG system is equivalent to planting 100 square meters of trees. In addition, PPG technology can fundamentally solve environmental problems such as smog and acid rain. The development of PPG technology and related industries can provide unlimited imagination space for the future of Nenpark society, such as using the electricity generated by the PPG system to support the operation of ecological circulation systems in universities and transforming idle land with harsh natural conditions into an ecological home for a green economy. However, there are many problems with PPG technology at present, such as being greatly affected by geographical location, output power being affected by weather, light intensity, and temperature, low photoelectric conversion efficiency, and the high initial cost of PPG systems. To address the above issues, the study first designs the structure of the PPG system and photovoltaic cells then designs the Maximum Power Point Tracking (MPPT) method, and finally introduces the Levy flight strategy optimization Quantum Particle Swarm (OPSO) algorithm. In addition, it optimizes the Contraction expansion coefficient (CE). From this, Hybrid Quantum Particle particle swarm optimization (HQPSO) can be obtained, and finally, HQPSO combined with the MPPT (H–M) algorithm can also be obtained.
The research aims to propose an algorithm that can better and more quickly adapt to environmental changes, with relatively good steady-state and dynamic performance, thereby promoting the healthy development of PPG, maximizing the utilization of solar energy, and improving the stability of the system and the conversion efficiency of photovoltaic cells. Balbino et al. designed an improved MPPT method without mechanical and voltage sensors for small wind turbine systems. Through simulation and experiments on a 1.5 kw small wind turbine system, the tracking efficiency of this method was close to 97.64% [6]. Zhang et al. proposed a hybrid MPPT method based on an iterative learning control and disturbance observation algorithm to propose the goal of fast and accurate tracking of MPPT. The policy and hardware results confirmed the effectiveness of this method [7]. In summary, the MPPT method for PPG systems currently needs further improvement. The innovation points of the research are as follows: First, an HQPSO combined with the MPPT algorithm (H–M) is proposed; Then, the Levy flight strategy is introduced to further improve the reliability of the OPSO algorithm in global convergence. The research structure is mainly divided into four parts. The first part is a summary of relevant research results. The second part is the design of the maximum power point tracking control algorithm based on the HQPSO algorithm. The third part is the validation of the effectiveness and practicality of the proposed algorithm. The last part is a summary of the research.

2. Related Works

For a long time, the world’s total energy consumption has continued to grow. Today’s global energy supply is mainly fossil energy. However, with the large-scale development and utilization of hundreds of years, the world is facing problems such as resource depletion. From the global total resource reserves in 2020, the reserves of oil, coal, and natural gas resources were 237.33 billion tons, 1074.11 billion tons, and 188.07 trillion cubic meters. According to the current world average mining intensity, the total reserves are insufficient to meet the current development status of population growth, industrialization, and urbanization. Therefore, carrying out renewable-energy-related technologies will play an extremely important role in ensuring world energy supply and promoting clean energy development. Li et al. found that the application of metal nanoparticles led to the improvement of the efficiency of solar cells due to the plasma effect. Therefore, the study explored the different situations of related mechanisms on the basis of metalized perovskite solar cells. The results showed that in a properly designed perovskite structure with multi-layer slender metal nanoparticles, the absorption of photons can be increased and the binding energy of excitons can be reduced at the same time. Thus, the efficiency can be improved through metallization, which cannot be achieved in traditional p–n junction batteries [8]. To achieve efficient photovoltaic power generation prediction in smart city energy management, Sun et al. studied and designed a model based on a multi-scale short-term memory recurrent neural network that can predict very short-term photovoltaic power generation. The experimental results showed that the model can stably assist in predicting the energy consumption of photovoltaic power generation [9]. To meet the demand for fast charging of new energy vehicles, Zhang and others introduced distributed PPG technology and proposed a scheme for installing a distributed generation system for fast charging stations for electric vehicles. This scheme planned the layout of the station and analyzed the operational efficiency of the station. The results confirmed that this scheme achieved the design goal of the rationalization and intelligence of fast charging stations and provided a reference for the construction of urban fast charging networks [10]. Bhende et al. developed a control scheme for power sharing between photovoltaic water pumping units, which was used for the collaborative control of independent and grid-connected photovoltaic water pumping systems. In the case of high photovoltaic power infiltrating into weak current networks, a disturbance and observation optimization algorithm for sharing offload power between photovoltaic units was studied and designed. The simulation results verified the performance of the control scheme [11]. Wu et al. proposed a supercapacitor as a control system and a sensing circuit for accurately detecting the output current and current change rate of solar power generation systems to solve the problem of indirection and instability of the output voltage of PPG modules. The experimental results showed that the control system can effectively suppress the output voltage fluctuation of the PPG module and enhance the reliability of load power consumption [12].
MPPT technology is a mainstream method for achieving the healthy development of PPG, maximizing the use of solar energy, and improving the system stability and conversion efficiency of photovoltaic cells. It continuously adjusts the output characteristics of photovoltaic cells through technical means to maintain them working near the maximum power point [13]. Combining the costs of PPG systems, MPPT technology is the simplest and most effective method to improve power generation efficiency and reduce operating costs [14]. To improve the efficiency of photovoltaic systems and reduce the cost of solar cells, Alrasheed et al. studied and developed an MPPT system using a dual-axis motor feedback tracking system. The simulation results confirmed that the system can be more efficient and cost-effective and achieve maximum power transmission [15]. Nasr et al. proposed a dual-objective control strategy based on MPPT to ensure the maximum overall efficiency of wireless power transmission systems. Experiments verified that the power transmission efficiency of this strategy only decreased by 2% [16]. Inspired by the fact that solar energy was the foundation of PPG and plant growth, Pachaivannan et al. designed a new crowded plant height optimization algorithm for solar photovoltaic MPPT. The results showed that the performance of this method was superior to the MPPT control strategy based on the perturbation observation algorithm [17].
In summary, there are many research achievements related to PPG systems and MPPT technology, but there is currently a lack of MPPT technology that adapts to rapid changes in the external environment. To investigate an algorithm with enhanced adaptability to changing environments, as well as to improve steady-state and dynamic performance, the study focuses on using QPS as a foundation for optimization, specifically by optimizing the CE coefficient and implementing the LF strategy. This leads to the development of a novel HQPSO algorithm. Finally, the HQPSO algorithm is combined with the MPPT method to construct the H–M algorithm.

3. MPPT Control Algorithm Establishment Based on HQPSO

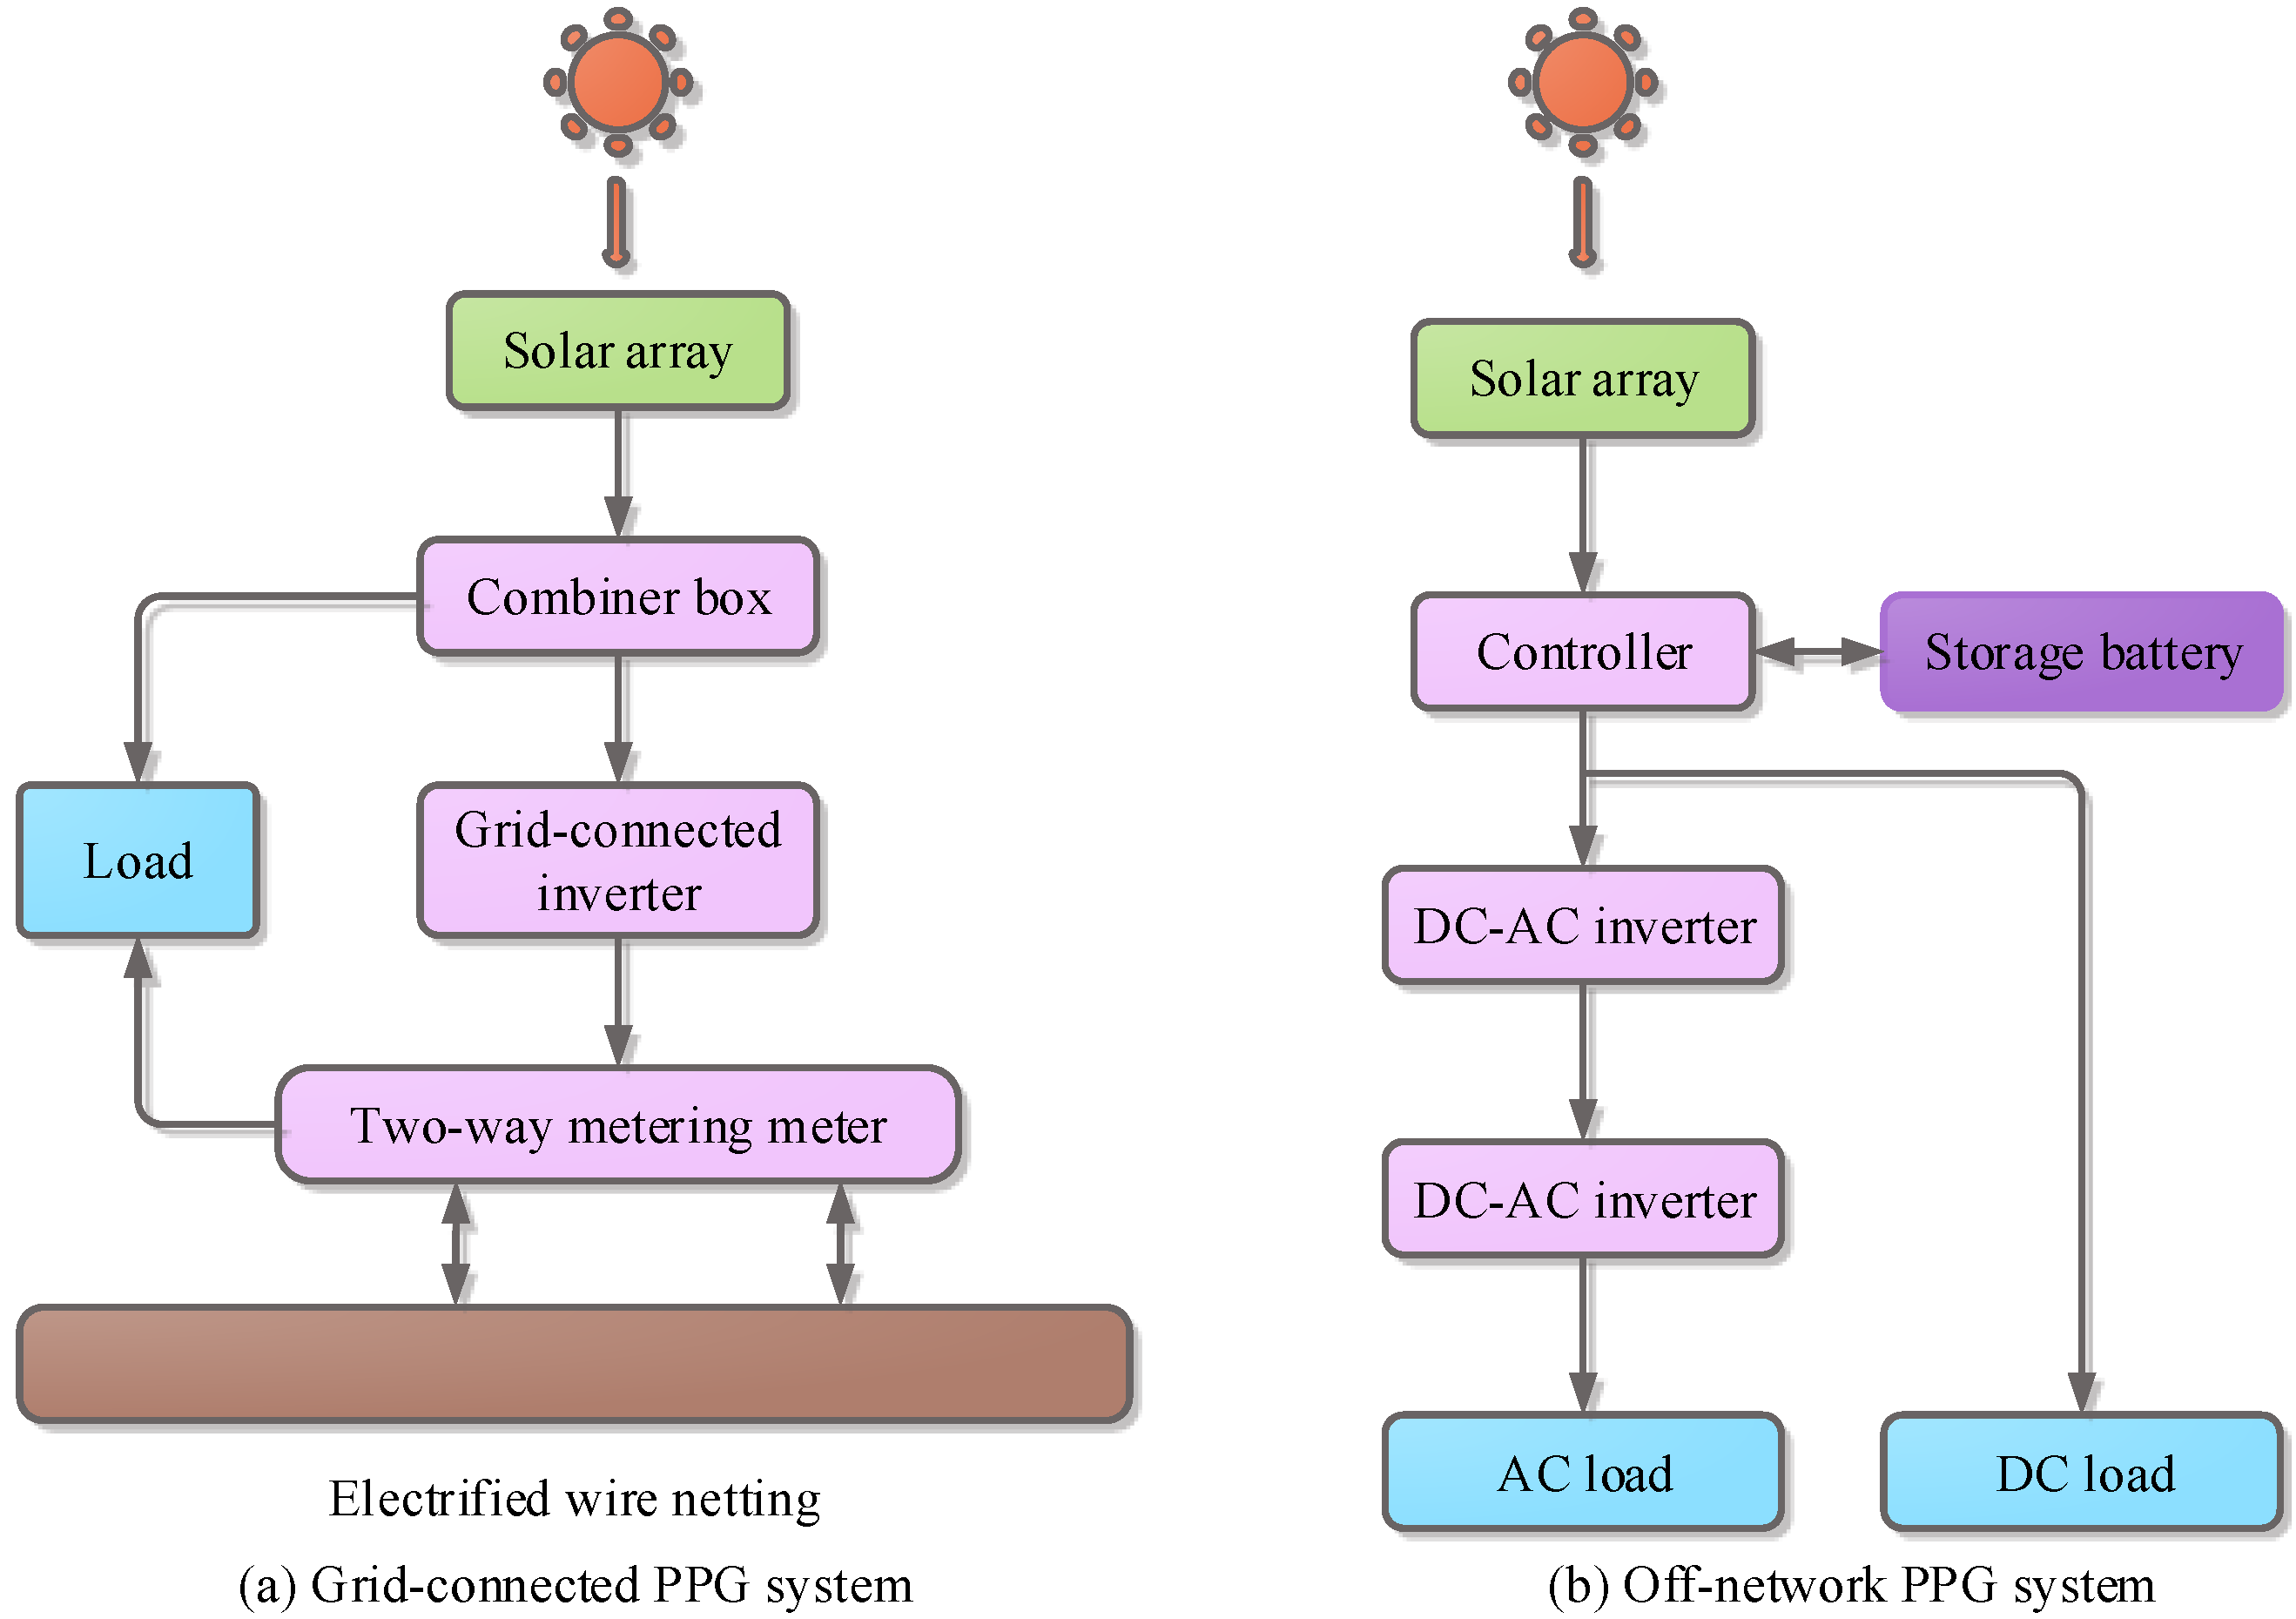
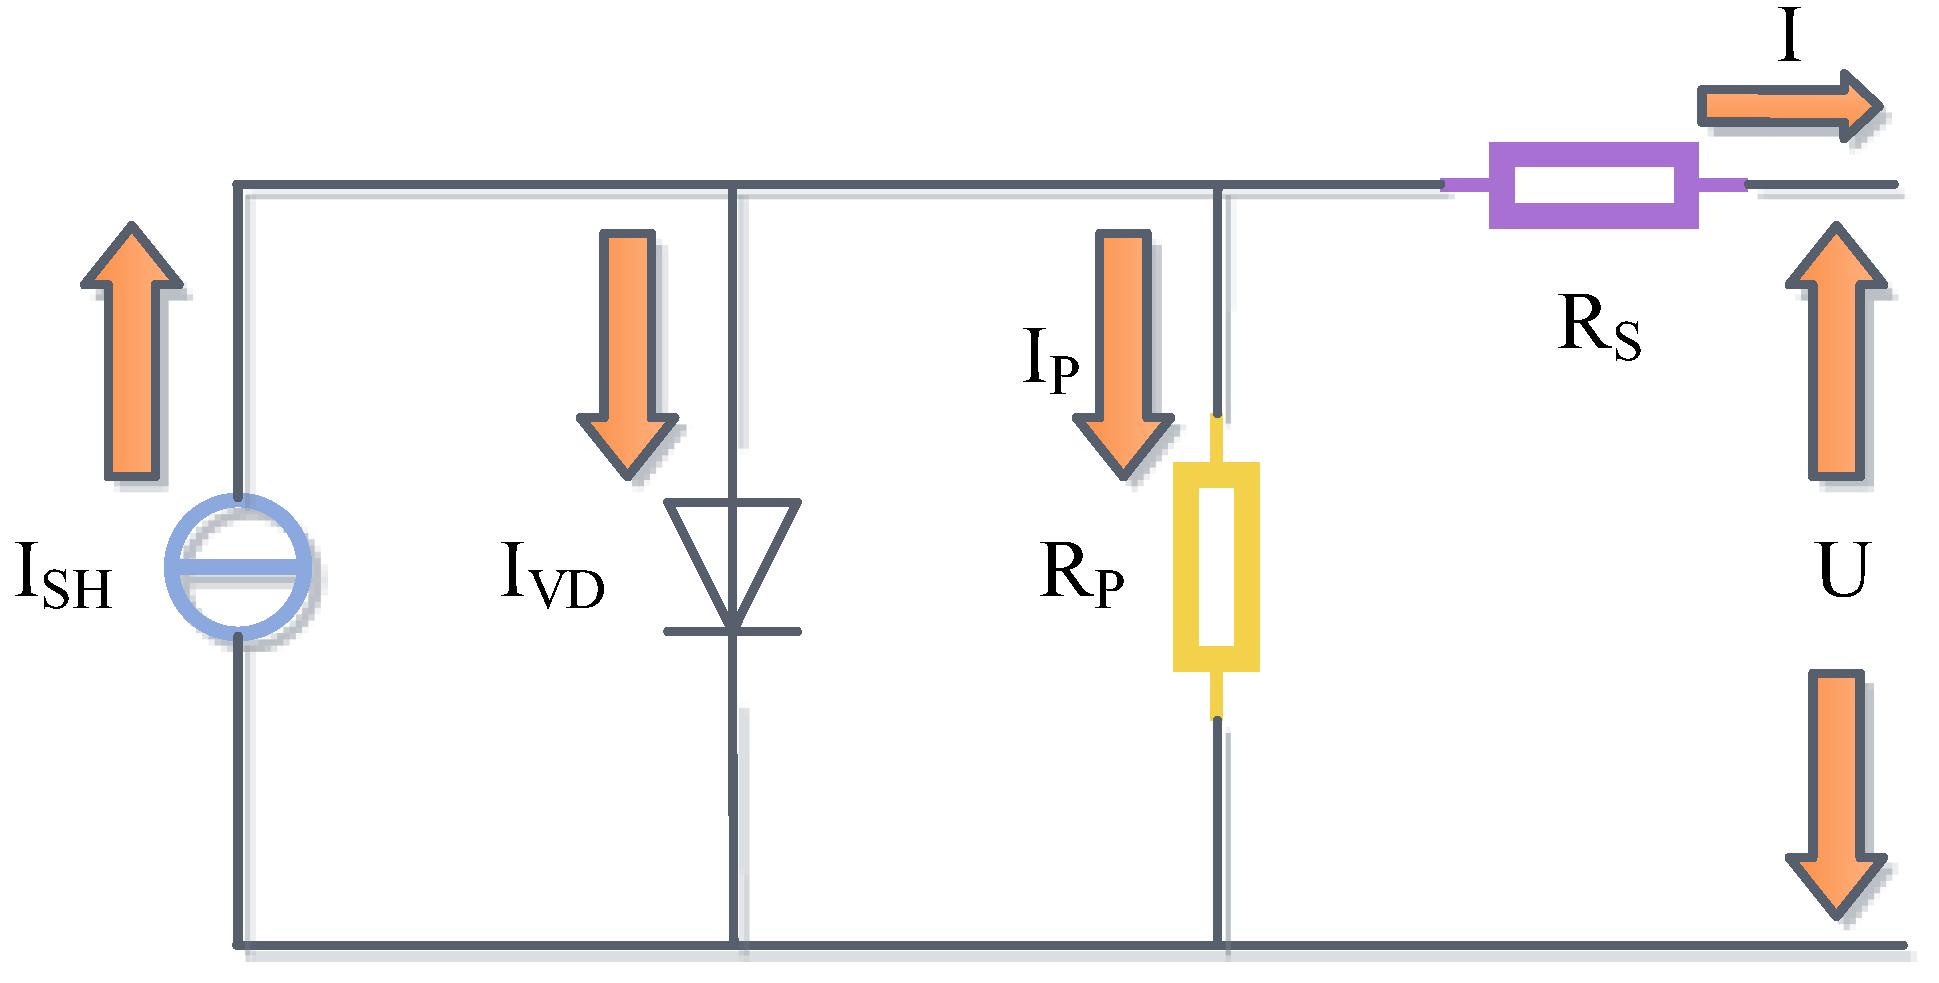
3.1. Structural Design of the PPG System and Photovoltaic Cells

Currently, there are many technologies that utilize solar energy, including two types of technologies that directly use sunlight and heat. One type does not change its form, which is passive solar energy technology; another type of energy conversion technology is active solar energy technology, including PPG technology, which converts solar radiation into electrical energy. The PPG system is divided into a grid-connected system and an off-grid system based on whether it is connected to the external power grid. The corresponding structure diagram is shown in Figure 1.
Figure 1a shows the structure of a grid-connected PPG system. The solar cell array usually needs to be connected to the inverter through a combiner box for grid connection, thereby transmitting electrical energy to the grid. There is no need to store electrical energy during the transmission. Figure 1b shows the structure of the off-grid PPG system. It is not connected to the power grid and can be combined with energy storage batteries, charging controllers, or inverters for power supply activities. The solar controller can control the output current and voltage changes of the solar cell array, which is composed of numerous solar cells with semiconductor characteristics. The MPPT method used in the controller can enable the entire photovoltaic system to work at maximum power while controlling the charging and discharging of battery components. In addition, the solar cell array has different characteristics in different environments, laying a solid practical foundation for the design of subsequent related algorithms. The load of the PPG system is divided into DC and AC. The AC load needs to convert the DC voltage through an inverter to obtain the available AC voltage for the load. The system structure of the DC load is simple. The voltage output from the solar cell array can be directly output to the load after being boosted or reduced by a voltage controller. The main raw material of photovoltaic cells is silicon, whose principle is to convert solar energy into light energy through the photovoltaic effect of semiconductor devices. When the P–N junction of a semiconductor device is irradiated by light, the light energy is absorbed by the semiconductor material, and a voltage is generated at both ends thereof. If a short circuit occurs in the P–N junction, a current will be generated. Photovoltaic cells are a nonlinear DC current source that provides power that depends on temperature and sunlight intensity. According to the principle of photovoltaic cells, the corresponding equivalent circuit can be obtained by simplifying the photovoltaic cell circuit, as shown in Figure 2.
In Figure 2, the equivalent circuit of a photovoltaic cell consists of a current source I S H , a diode V D , a series resistor R S , and a parallel resistor R P . The output current EE can be obtained through Kirchhoff’s law, and the calculation is shown in Equation (1) [18].
I = I S H I V D I P
In Equation (1), I V D represents the current flowing through V D . I P represents the parallel current. The calculation of I V D is shown in Equation (2).
I V D = I O D exp q U + I R S Z m T 1
I O D in Equation (2) represents the reverse current of V D ; q represents the amount of electronic charge, which is 1.6 × 10⁻¹⁹ C; U is the battery output voltage; Z is the quality factor of V D ; m represents the Boltzmann constant, which is 1.38 × 10⁻²³ J/K; T stands for absolute temperature. The photovoltaic array is composed of multiple photovoltaic modules in parallel, and the output current I can be obtained as Equation (3).
I = N P I P N P I O D exp q U N S + I R S N P Z m T 1 U + I R S R P N P
In Equation (3), N P and N S are the number of batteries in series and in parallel, respectively. Generally, the R S inside a photovoltaic cell consists of the resistance carried by the contact electrode and the resistance of the semiconductor material itself, with a small resistance value; due to the non-ideal characteristics and doping of P–N junctions, R P has a large resistance value. Both are internal resistances of photovoltaic cells, with R S = 0 and R P being infinite under ideal conditions. When checking out a circuit model, the effect of R P on the circuit is ignored to facilitate circuit calculations. Under standard test conditions, namely radiation intensity of 1000 W/m2 and temperature of 25 °C, an engineering model is established based on the technical indicators provided by the battery manufacturer, as shown in Equation (4) [19].
I = I S C 1 A 1 exp U A 2 U O C 1 A 1 = 1 I M I S C exp U A 2 U O C A 2 = U M U O C 1 L n 1 I M I S C 1
In Equation (4), I S C and U O C respectively represent the battery short-circuit current and battery open-circuit voltage under standard test environments. I M and U M represent the maximum power point current and voltage under the standard test environment, respectively. In practical applications, it is difficult to meet standard test conditions, so it is necessary to modify the parameters of Equation (4) using the current temperature and illumination amplitude to build a new engineering model. The corrected result using the compensation coefficient is shown in Equation (5).
U O C = U 1 a T T S ln e + b G G S I S C = I S C G G S 1 + c T T S U M = U M 1 a T T S ln e + b G G S I M = I M G G S 1 + c T C
U O C and U M in Equation (5) are the corrected battery open circuit voltage and maximum power point voltage, respectively. Both a and b represent voltage compensation coefficients. T and T S represent the temperatures of the measured and standard test environments, respectively. G and G S represent the illumination amplitude under the measured and standard test environments, respectively. c is the current compensation coefficient. I S C and I M are the corrected battery short-circuit current and maximum power point current, respectively. I M represents the maximum power point current in a standard test environment. e represents the base number of natural logarithms.

3.2. Design of the MPPT Method

The main methods for obtaining maximum power from photovoltaic arrays include mechanical tracking and electrical tracking. Mechanical tracking is physical tracking in which the direction of a photovoltaic panel is changed within a day based on pre-calculated and defined angles. Electrical tracking refers to tracking the maximum tracking point on the I–U curve or P–U curve of a photovoltaic panel. In general, power electronic equipment is used as a point tracker in renewable energy generation, which can track the maximum power point to achieve maximum efficiency. In summary, MPPT technology improves the photoelectric conversion efficiency of solar systems, reducing the solar panels required to obtain a specific amount of output. The output of a photovoltaic system has a non-linear relationship with light intensity, battery temperature, and load conditions. Under certain external conditions, the system can operate at a certain range of voltage and power. The principle of MPPT technology is to actively find the voltage or current at which the photovoltaic array operates through a given temperature and irradiance to achieve maximum power output. The MPPT is controlled through a conversion circuit, and its position in the PPG system is shown in Figure 3.
In Figure 3, the MPPT control circuit calculates the current and voltage output from the photovoltaic array to obtain a control signal. Then, the control signal is applied to the DC conversion circuit to adjust the output current and voltage of the array operation. In a linear circuit, when the impedance of both the external load and the power supply is conjugate, the external load can obtain maximum output power. In PPG systems, although DC/DC converter circuits are all nonlinear, they can be considered linear for a relatively short period of time. The traditional single-peak MPPT method has a simple principle. Currently, the widely used methods with high accuracy include Disturbance Observation (DO) and Incremental Conductivity (IC). The principle of the DO method is to increase or decrease the voltage across the photovoltaic cell at fixed time intervals. The control signal for the next step is determined based on the subsequent power change direction. The MPPT module increases or decreases the output voltage or current of the photovoltaic array in a determined small step length within each cycle. The DO method does not require too many parameters in practical applications, and the accuracy of the sensor does not need to be very high. However, after this method, the photovoltaic array can only oscillate around the maximum power point, resulting in partial power loss. The IC method is based on the slope of the photovoltaic array P–U curve at the maximum power point of 0. The output power of the photovoltaic cell is Equation (6).
P = U · I
Taking the derivative of U , the slope of the photovoltaic cell power curve at the maximum power point is 0, positive on the left-hand side, and negative on the right-hand side. To sum up, a flowchart of the IC method can be obtained, as shown in Figure 4.
In Figure 4, U m and I m represent the current voltage and current of the photovoltaic cell, respectively. U r e represents the reference voltage that forces the photovoltaic array to operate. The IC method determines whether the current operating point is located to the left or right of the maximum power point by comparing its conductance variation with conductance. Then it controls the increase or decrease of the output voltage to achieve tracking of the maximum power point. However, due to the use of derivative algorithms, the output of the IC method is unstable, and low-accuracy sensors are not suitable.

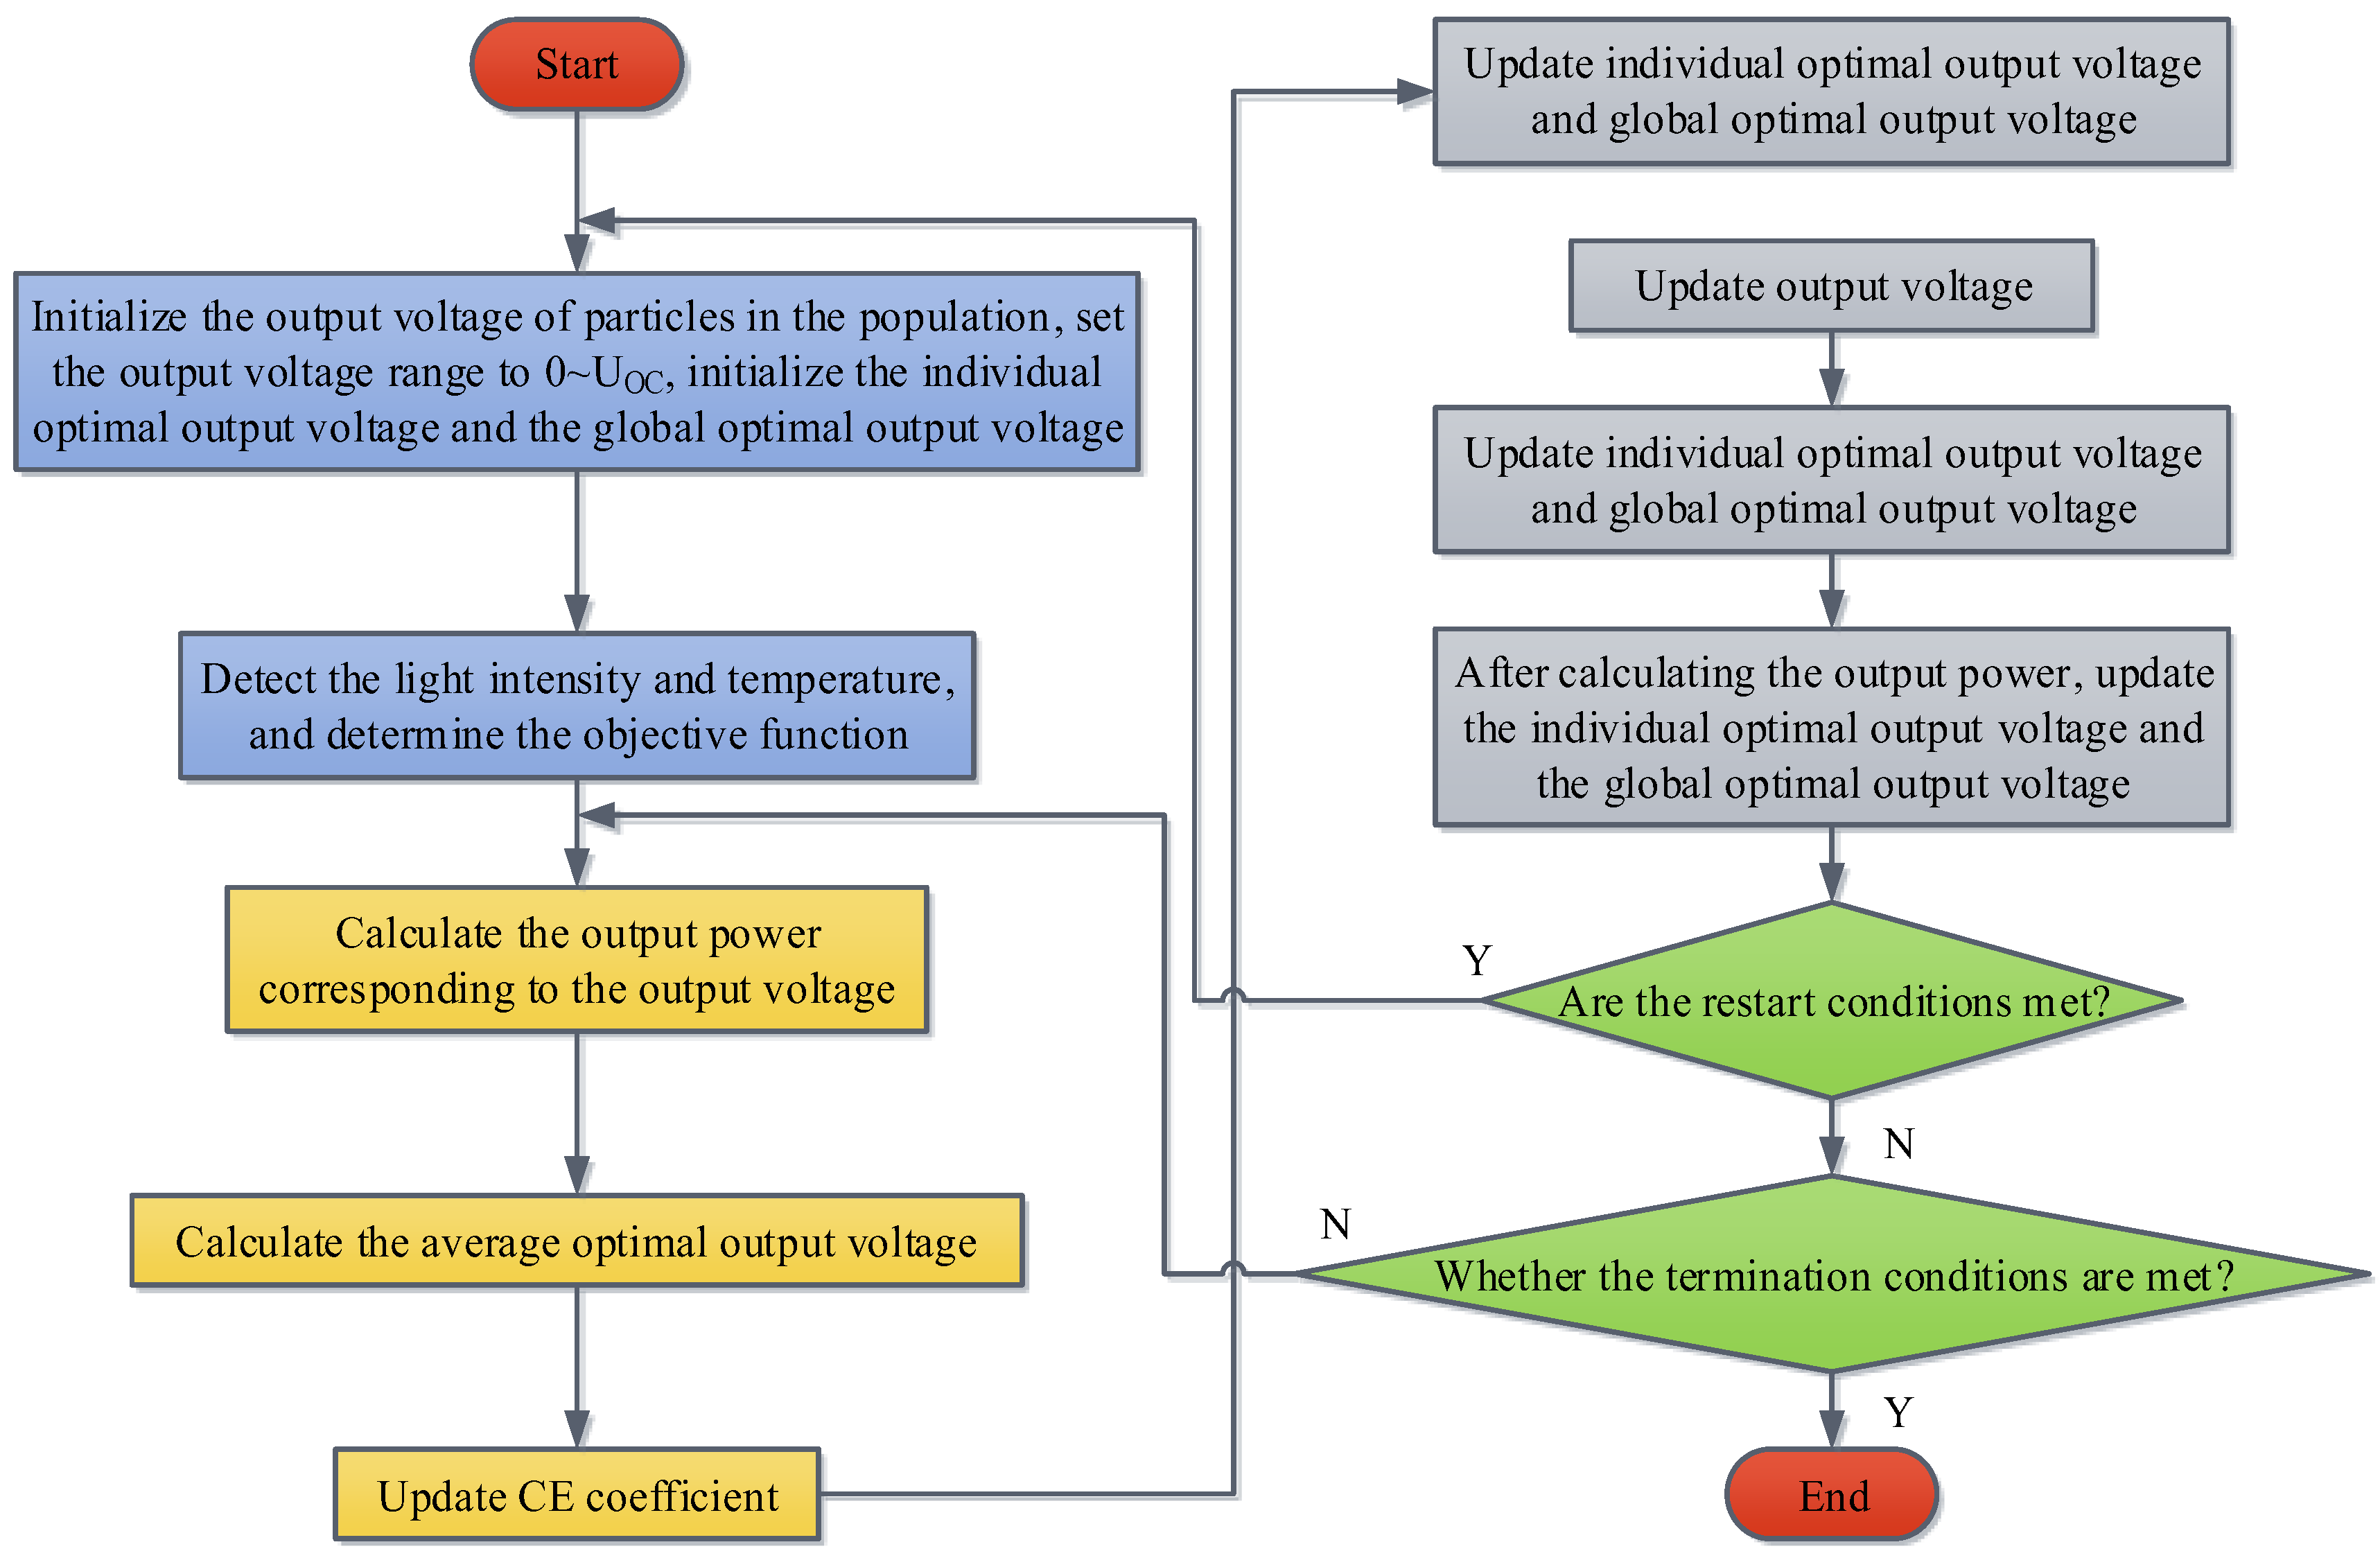
3.3. Construction of the MPPT Control Algorithm Based on HQPSO

Under local shadow conditions, there are multiple relative maximum power points in the P–U characteristic curve of a photovoltaic array. It is difficult to track the absolute maximum power points with traditional MPPT. Therefore, it is necessary to utilize a multi-peak MPPT method. Currently, the mainstream MPPT algorithm is based on sliding mode variable structure control (SMVSC), namely the S–M algorithm, and the MPPT method is based on Particle Swarm Optimization (PSO). The working principle of SMVSC is to use a high-speed switching control law to make the state trajectory of the system reach the pre-designed state space surface within a certain time while keeping the subsequent trajectory stable on the surface. The switching function of the converter C is expressed as Equation (7).
C = 0 , D 0 1 , D < 0
When C is 0, the switch is open; when C is 1, the switch is closed. D is calculated using Equation (8).
D = I + U d I d U
The control system based on the S–M algorithm has a fast response speed and is easy to operate in practical applications. However, in practical applications, it is difficult for the algorithm to move completely in accordance with the sliding mode toward the equilibrium point. Instead, it traverses both sides of the synovial surface, resulting in chattering, which cannot be avoided. The PSO algorithm updates each particle’s speed and position based on its best previous solution and the best solution sought by the current population. Equation (9) is used to iteratively update the velocity and solution of particles.
v i k + 1 = ζ v i k + d 1 r a n d P i k s i k + d 2 r a n d P b k s i k s i k + 1 = s i k + v i k + 1
In Equation (9), ζ represents the inertial factor. d 1 and d 2 are acceleration variables, respectively. r a n d is a random vector obtained from the uniform distribution of each particle size 0 , 1 n . P i and P b represent individual and global optimal solutions, respectively. To avoid divergence, v i k + 1 is typically v max , v max , i = 1 , 2 , , n , in which v max is the maximum particle velocity. However, the PSO algorithm is prone to falling into the local optimization, so PSO optimization is introduced to optimize the MPPT method. Supposing there are W particles in the N space, and position of the particle i at the moment t is S i t = u i 1 t , , u i N t , the optimal position of i is O i t = o i , 1 t , , u i , N t . For the minimization problem, O i t is shown in Equation (10).
O i t = S i t , f S i t < f O i t 1 O i t 1 , f S i t f O i t 1
In Equation (10), f S i t is the fitness value corresponding to the position of i at the time t . f O i t 1 means the fitness value corresponding to the individual optimal position of i at time t . The global optimal position O S t of the population is calculated using Equation (11).
O S t = O o s t o s = arg min 1 i W f O i t
The o s in Equation (11) is the subscript of the globally optimal position particle. The evolution of i under dimension j is shown in Equation (12).
S i , j t + 1 = o i , j t ± L i , j t 2 ln 1 x i , j t o i , j t = α j t O i , j t + 1 α j t O S j t L i , j t = 2 ψ m b S i , j t
In Equation (12), if x i , j t X 0 , 1 and x i , j t > 0.5 , + is taken, and vice versa ; o i , j ( t ) is the attractor of i in the j dimension at the t iteration; L i , j t represents the characteristic length of the δ potential progression; α j t X 0 , 1 and O S j t indicate that j is the global optimal location in space; ψ represents the contraction expansion coefficient CE; m b is the average of the globally optimal locations. When tracking the maximum power point, it is always expected that the MPPT method will track to the theoretical maximum power point as much as possible, find the global maximum power point with lower operating costs, and maintain the results. Therefore, the study optimizes the CE coefficient and position update equation to form a new HQPSO algorithm, as shown in Figure 5.
The steps of the HQPSO algorithm are as follows. To adapt ψ to changes in particle fitness values during the optimization process, a variable CE coefficient strategy is studied. This causes each particle to have a corresponding ψ , and the expression is shown in Equation (13).
ψ = ψ min ψ max ψ min · f f min f a v f min , f f a v ψ max , f > f a v
In Equation (13), ψ min and ψ max respectively represent the minimum and maximum values of the CE coefficient; f is the individual optimal fitness value of the current particle; f min and f a v are the minimum and average fitness values of all particles, respectively. Based on the impact of CE coefficients on algorithm performance studied previously, ψ max = 1 and ψ min = 0.5 are selected [20]. In addition, in order to increase the diversity of the population and optimize the performance of the algorithm, research is conducted to introduce an LF strategy during the update process to avoid the algorithm falling into local optimization. The step size of LF is a function of time t . By using Mantegna simplification and Fourier transform, Equation (14) can be obtained.
L F χ α · η v 1 χ , 1 < χ 2
The χ in Equation (14) is a power function that determines the shape of the LF distribution. Both v and η follow a standard normal distribution, and the expression of α is shown in Equation (15).
α = Γ 1 + χ · sin π η 2 Γ 1 + χ 2 · χ · 2 χ 1 2
The Γ of Equation (15) is a standard gamma function. To sum up, the H–M algorithm can be obtained by combining the HQPSO algorithm with the MPPT method. The process is shown in Figure 6.

4. H–M Algorithm Performance and Application Analysis in the PPG System

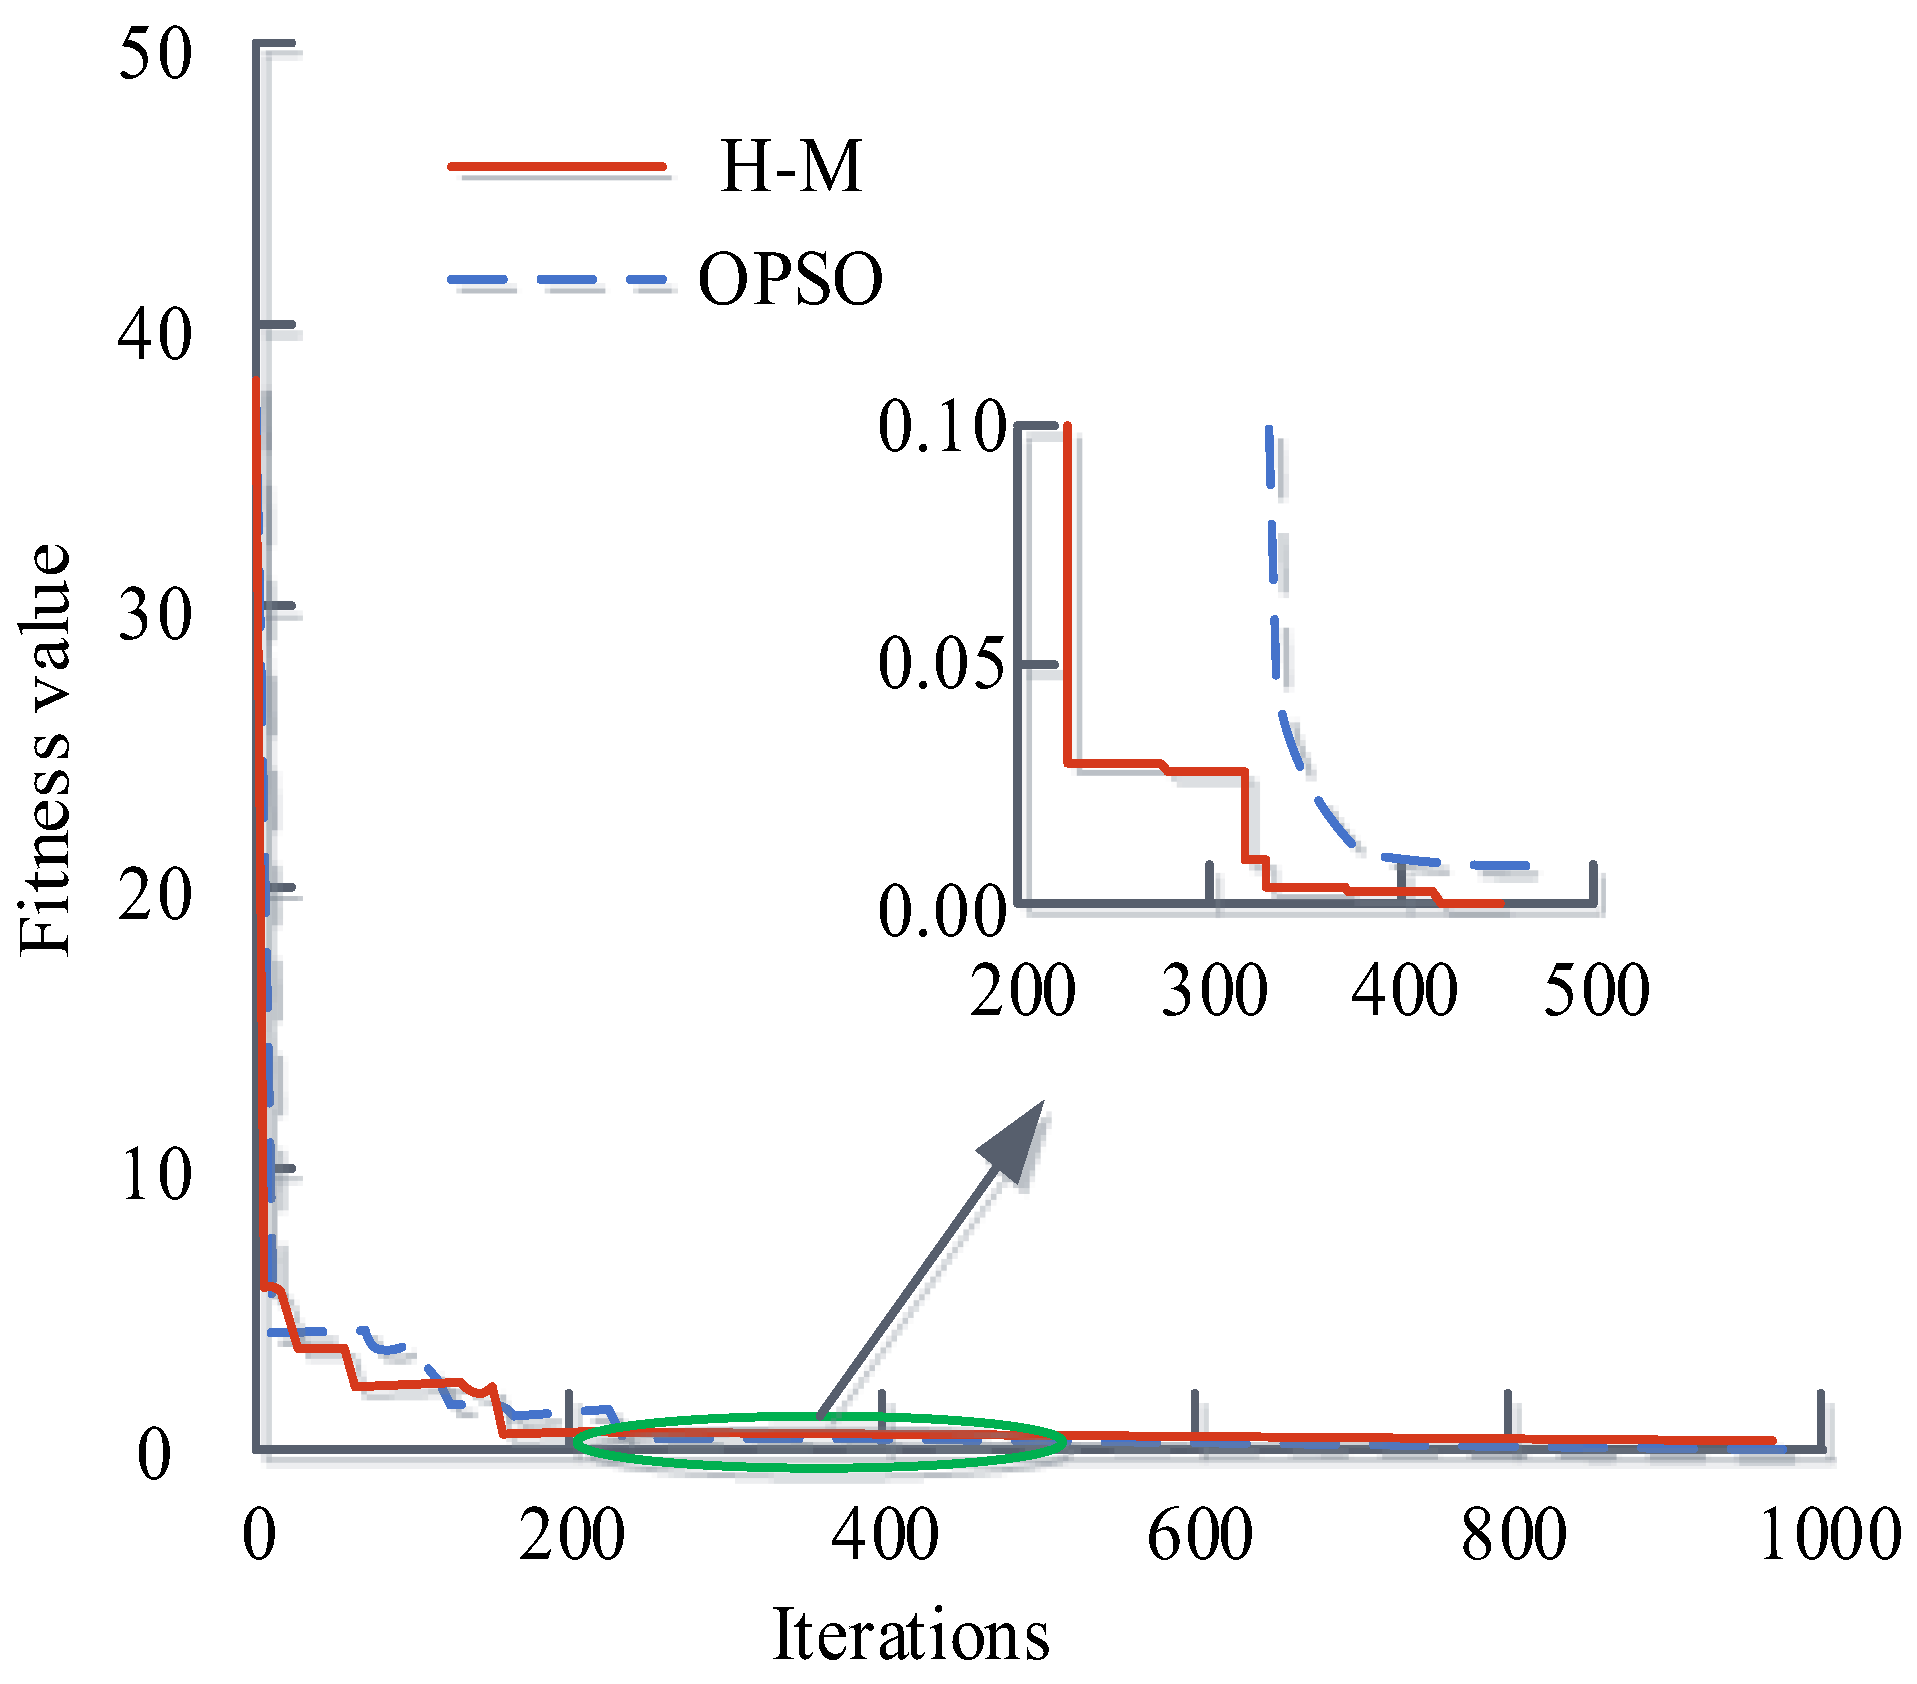
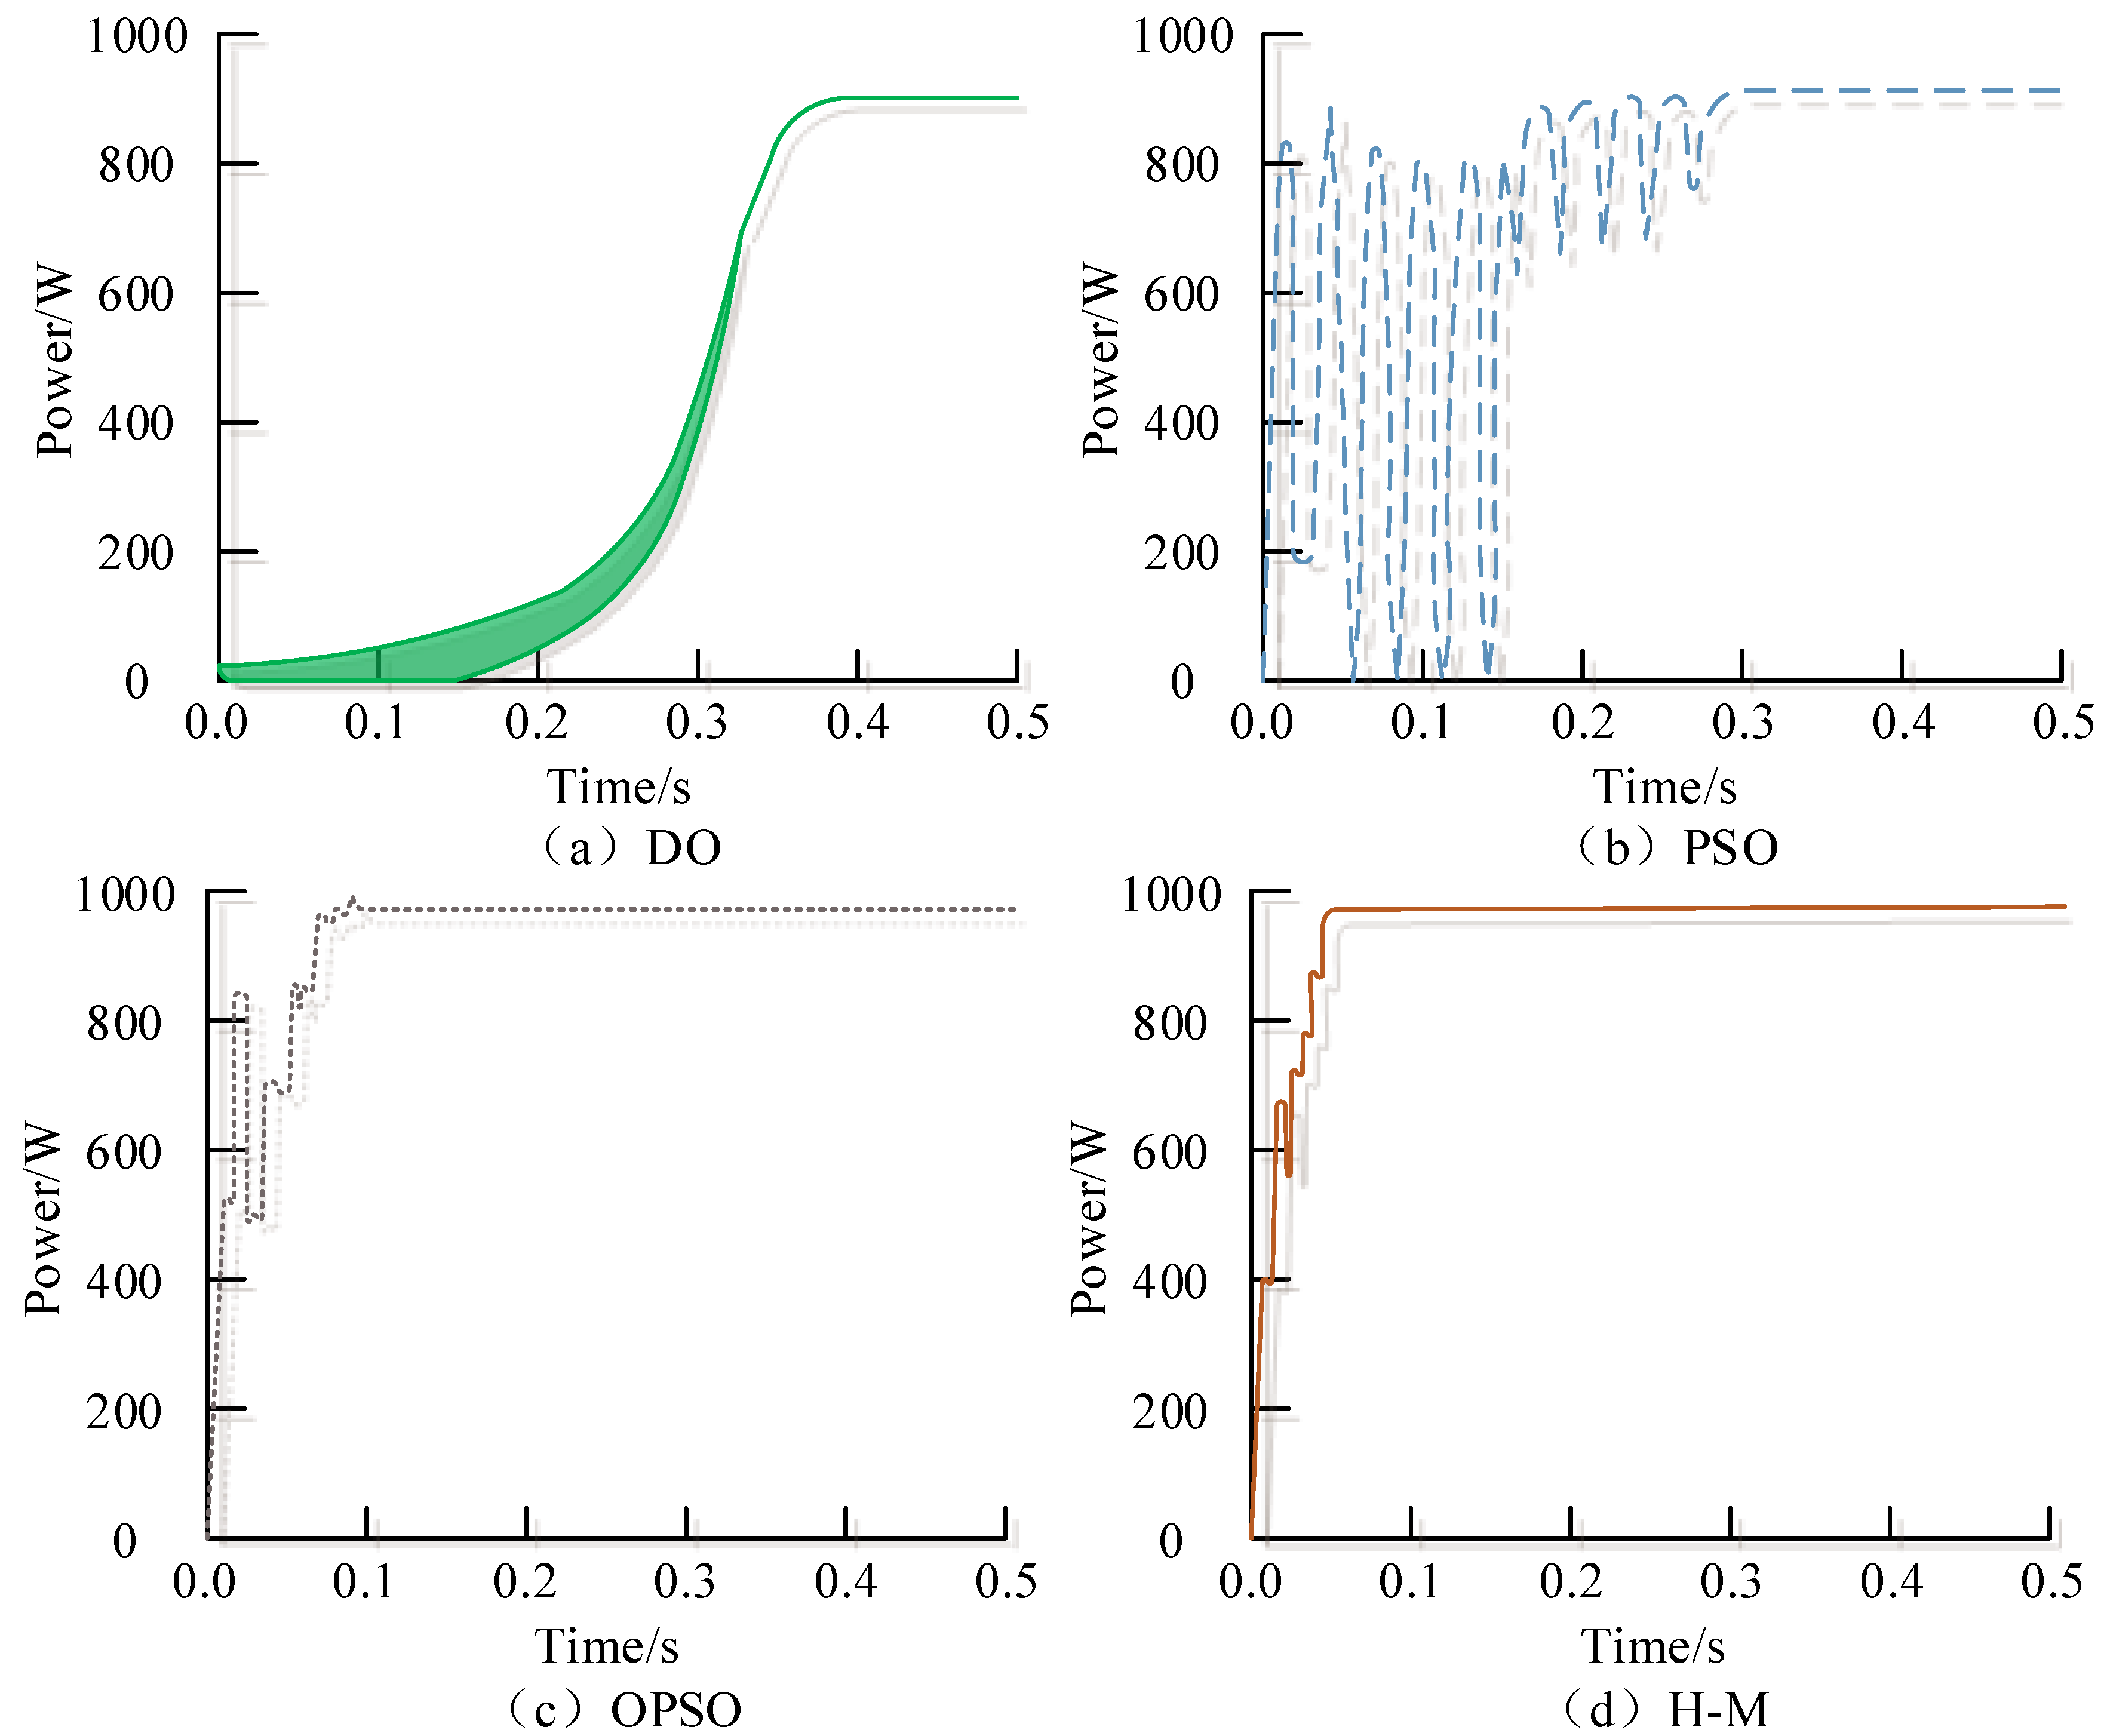
4.1. Performance Analysis of the H–M Algorithm

To verify the performance of the F-M algorithm proposed in the study, the commonly used Sphere function, Roserock function, and Rastigin function were selected for testing. The experimental platform was Matlab software, and the experimental parameters were set as follows. The functional dimension was 5; the MAXITER was 1000; the population size was set to 10, 20, and 40, respectively. Convergence occurred when the objective function was less than 0.0000001.
It ran the H–M, PSO, and OPSO independently 50 times on three test functions to obtain test results for different algorithms, as shown in Table 1. From Table 1, in the Sphere function, when the number of particles was small, the OPSO algorithm could always reach the convergence condition. Moreover, both the PSO algorithm and the OPSO algorithm slightly improved tracking accuracy after the population number reached 40. When optimizing Roserock, the PSO algorithm has been unable to converge. The OPSO algorithm had a probability of finding the theoretical minimum of about 80%. In the Rastigin function, the OPSO algorithm had better multimodal optimization ability and higher convergence probability than the PSO algorithm. Comparing the H–M algorithm with the OPSO algorithm, for the Sphere function, the H–M algorithm could always find the minimum value in the two types of population sizes, and the optimization ability was greatly improved. For the Roserock function and the Rastigin function, the H–M algorithm could always converge to the theoretical minimum with a probability of more than 94%. With a particle count of 20, it achieved the effect of the OPSO algorithm with a particle count of 40. In the three functions, the convergence rate of the H–M algorithm significantly improved. It increased by nearly 60% under two types of population, and the average convergence iteration number also decreased by more than 180 times. Based on the above analysis, it can be concluded that the performance of the H–M algorithm is more stable.
To further verify the multimodal optimization ability of the H–M algorithm, 50 experiments were conducted on the Rastigin function when the population size was ten. The best-performing one was selected to obtain the corresponding fitness change curve results of the two algorithms, as shown in Figure 7. From Figure 7, the H–M algorithm could achieve the theoretical optimal value by only iterating 632 times. The OPSO algorithm still could not converge after 992 iterations. Based on the above results, the H–M algorithm has the highest stability, optimization accuracy, and convergence speed. It can effectively solve complex multimodal problems and avoid the occurrence of local optimization.

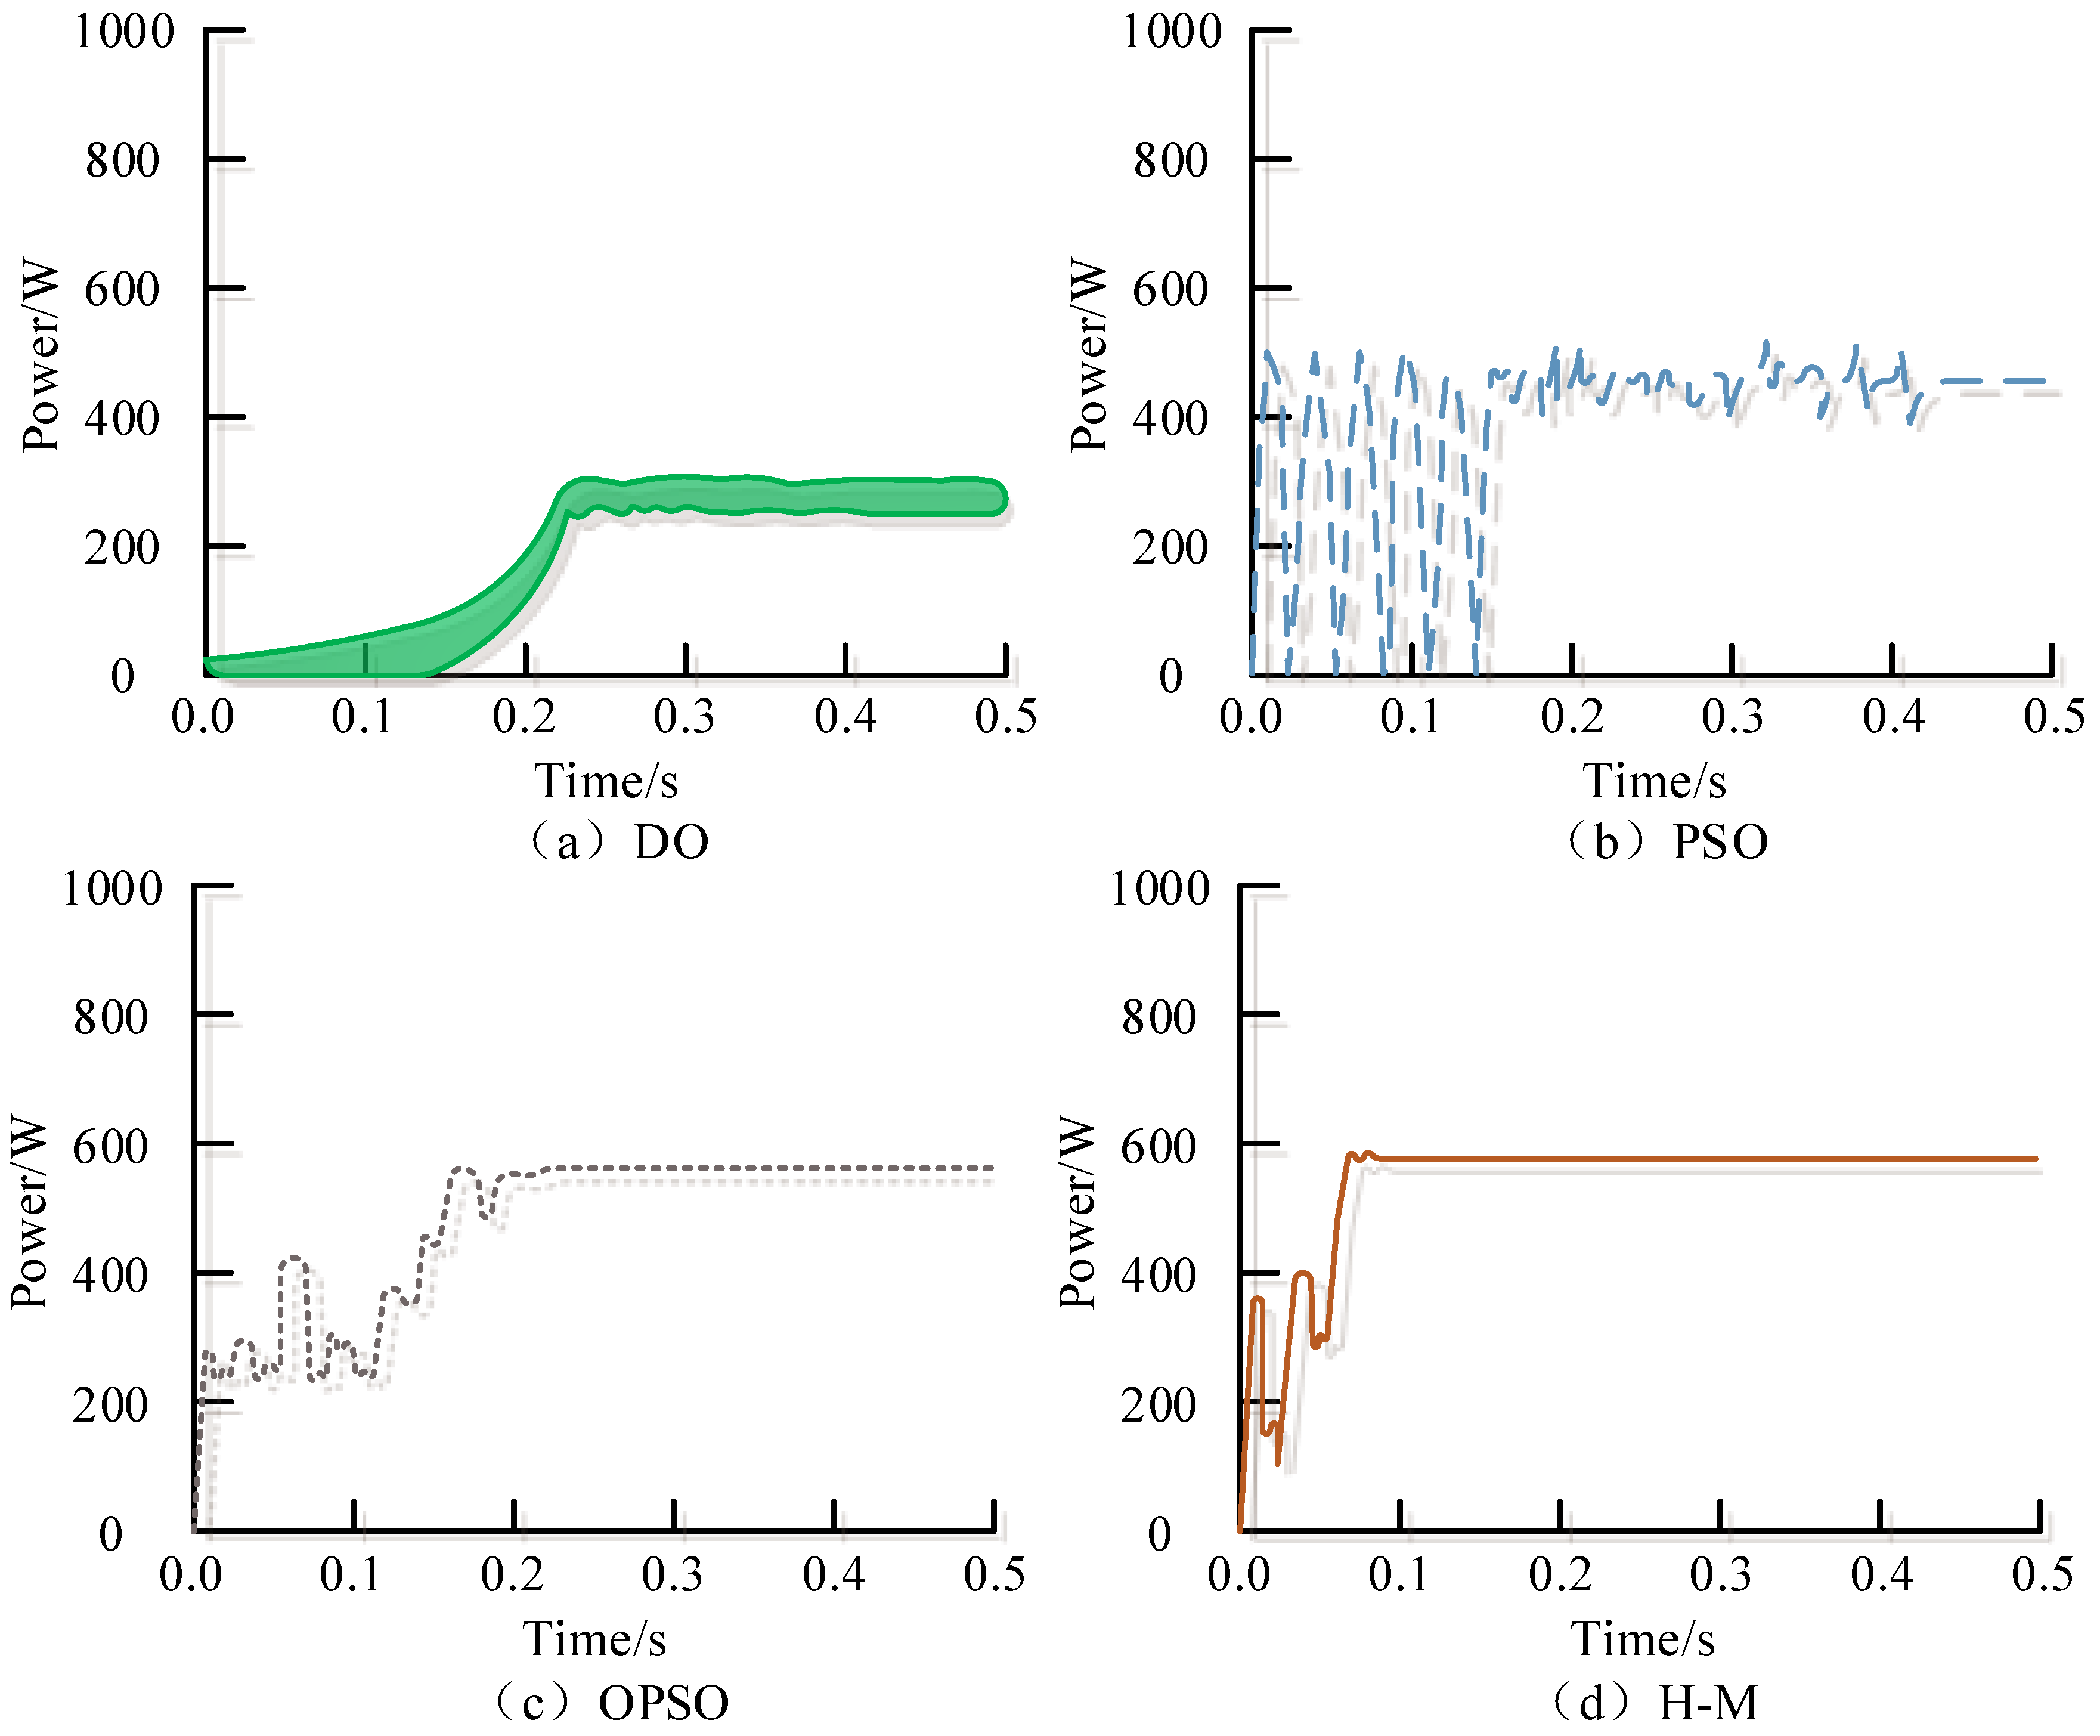
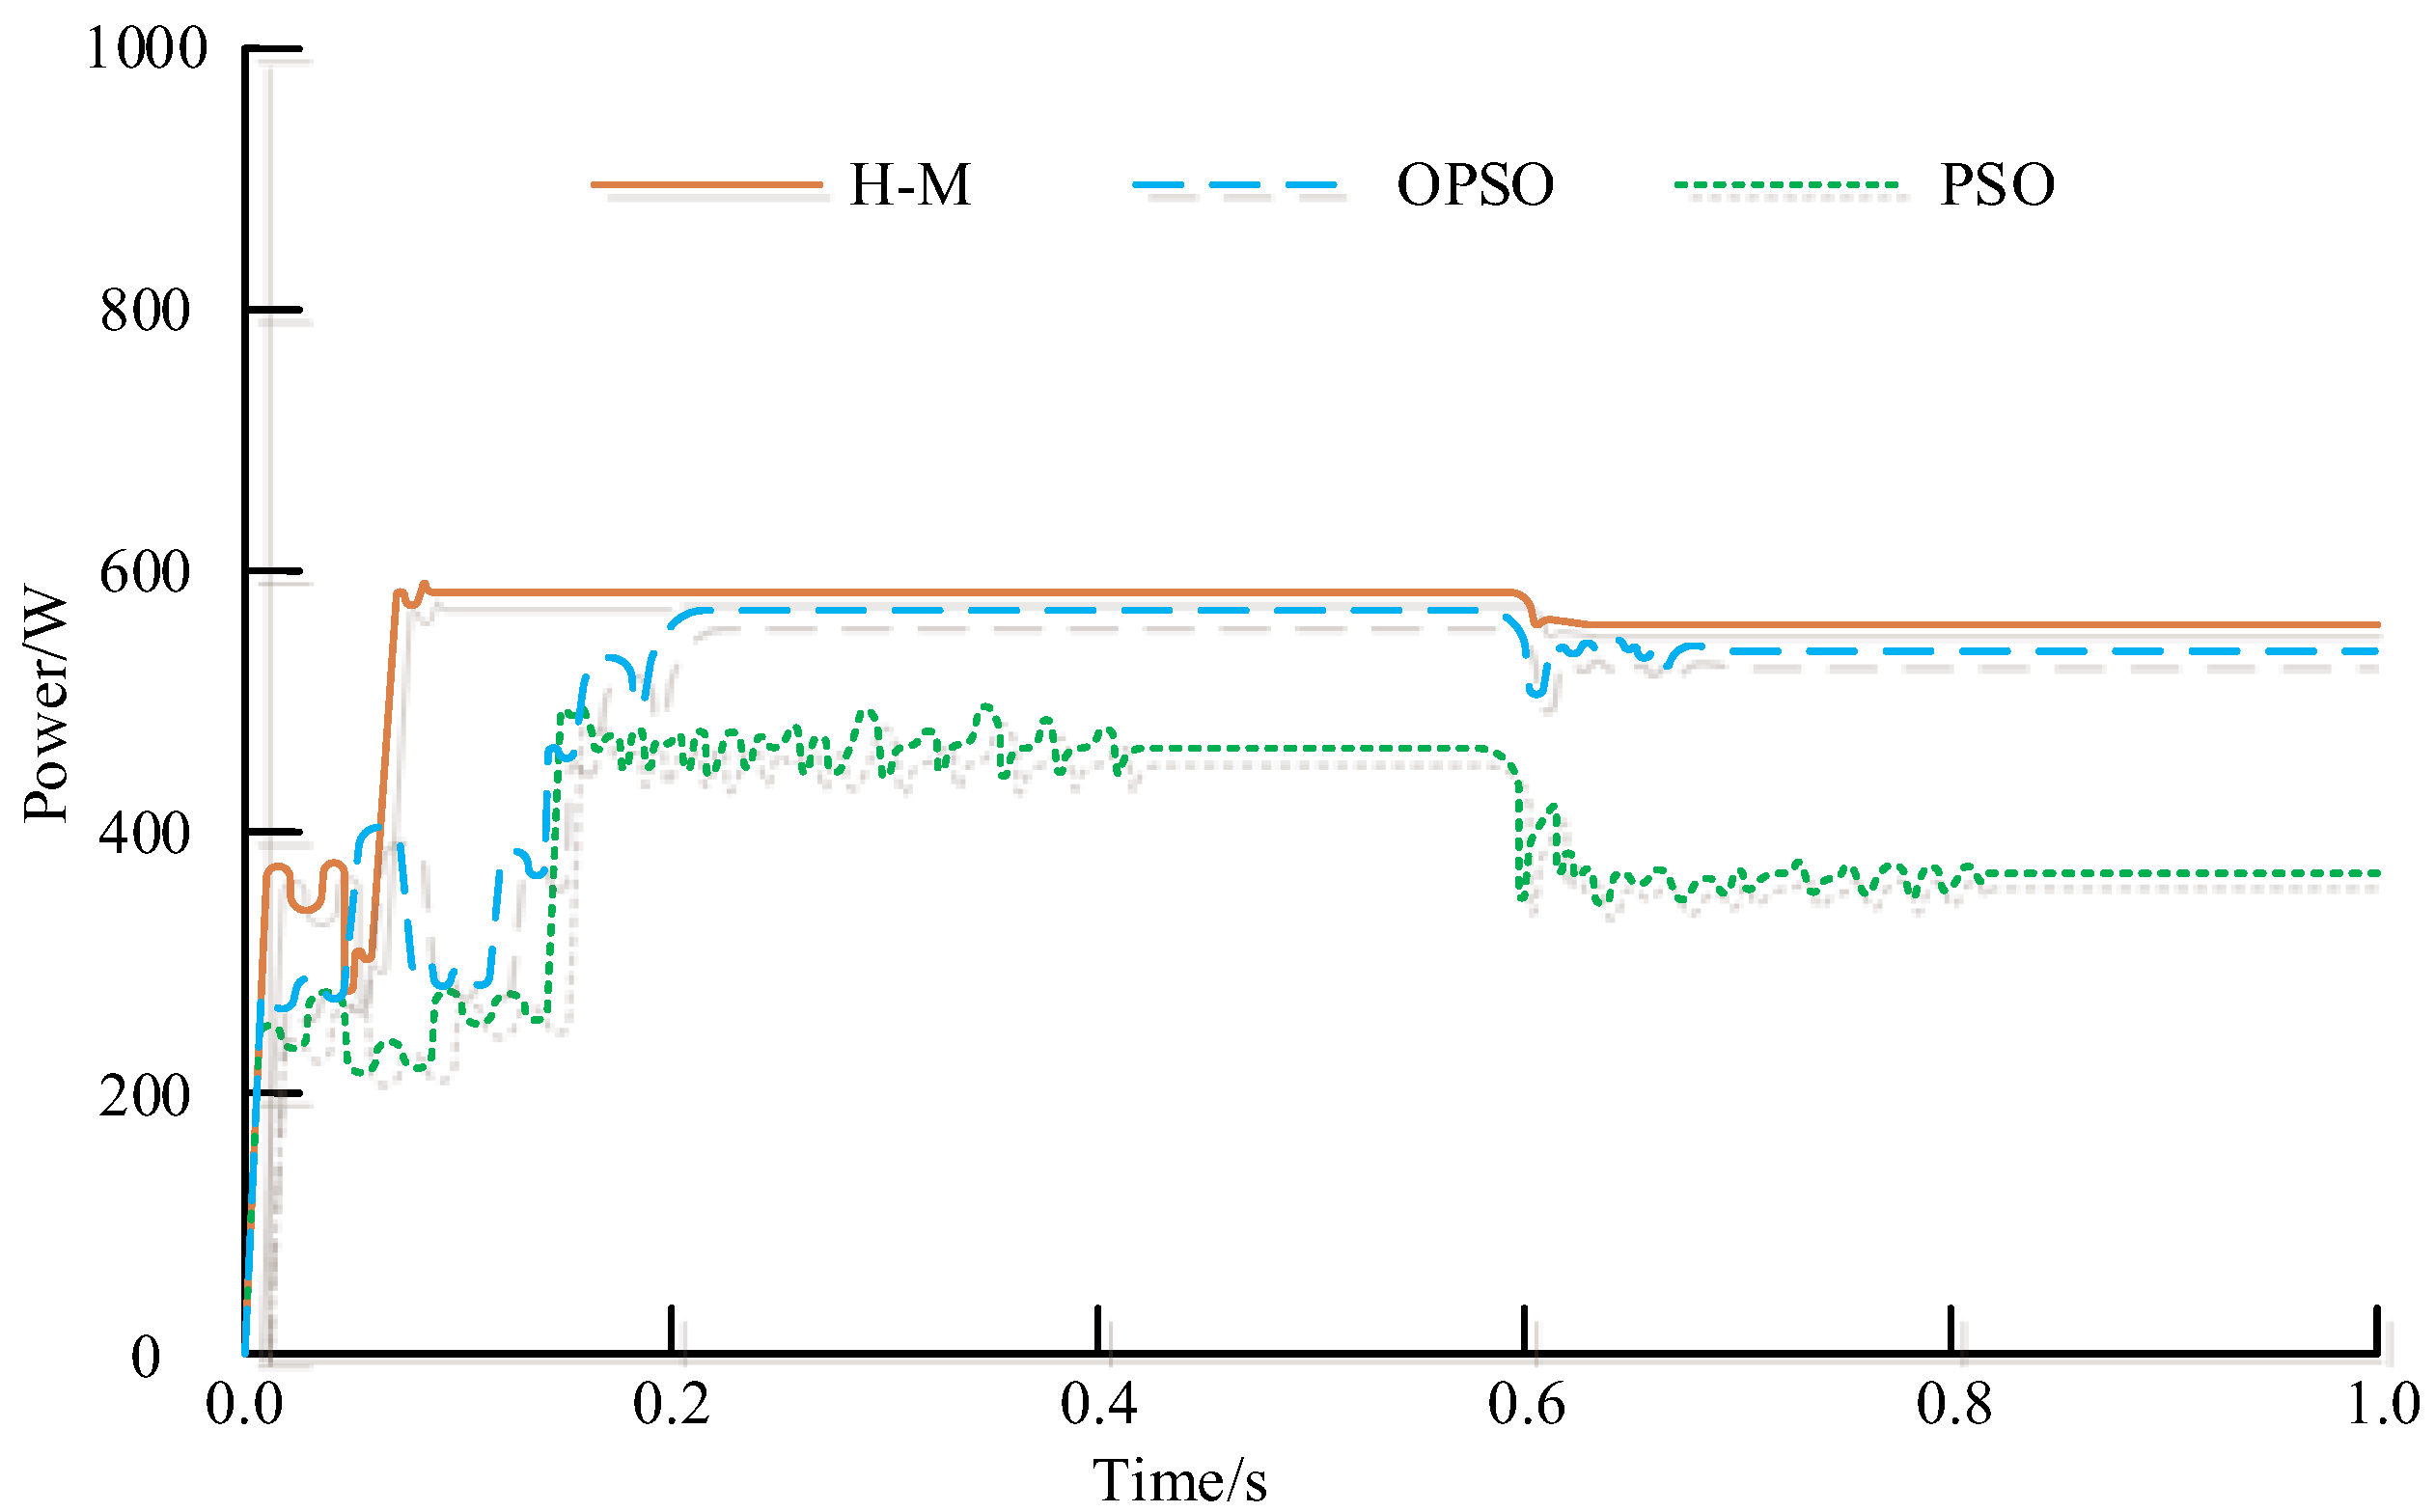
4.2. Application Analysis of the H–M Algorithm in the PPG System

To verify the ability of the H–M algorithm to track the maximum power point in a PPG system, a system was established using the Simulink module of Matlab software. The required photovoltaic array MPPT system included photovoltaic arrays, conversion circuits, MPPT modules, PWM generators, and load resistors. Three sets of comparative experiments were conducted in the constructed system simulation model, namely no shadow occlusion, shadow occlusion, and shadow mutation.
Figure 8 shows the output power results of MPPT control using different algorithms without shadow occlusion. The ideal output power of the photovoltaic array was 913.2 W. Figure 8 shows that the error between the four algorithms and the ideal output power was less than 0.05%. The output power curve of the DO algorithm was the smoothest, but it started to stabilize at 0.405 s, and it took a long time to reach a stable state. The time taken for the four algorithms to reach a stable state from longest to shortest was DO, PSO, OPSO, and H–M. The H–M algorithm only needed 0.059 s to reach a stable state. In summary, in the absence of shadow occlusion, the tracking accuracy of the four algorithms was basically the same, but the tracking efficiency of the H–M algorithm was improved by an average of 80% compared to the other three algorithms.
To better evaluate the algorithm during local shadow occlusion, 20 independent experiments were conducted on four algorithms, and the results obtained are shown in Table 2. Under partial shadow occlusion, the P–U characteristic curve of the photovoltaic array contained three peaks, and the theoretical value of the maximum output power was 590.9445 W. Table 1 shows that the DO algorithm cannot jump out of local optimization. The final output power was 296.1452 W. The minimum output power of the PSO algorithm was 296.1452 W. This indicated that the algorithm was also prone to falling into local optimization problems, and the maximum convergence time was 0.403. However, its tracking performance was improved compared to the DO algorithm. From the maximum output power, the PSO algorithm, OPSO algorithm, and H–M algorithm could track the global maximum power point. However, the average output power results showed that the tracking performance of the OPSO algorithm and the H–M algorithm could always converge to the maximum value with a higher probability, with convergence times of 0.239 s and 0.125 s, respectively.
To better compare the tracking performance of the maximum power point of the algorithm, the primary output power closest to the average output power in Table 2 was selected from 20 experiments to obtain the MPPT output power curves of different algorithms under local shadow occlusion, as shown in Figure 9. Figure 9 shows that the DO algorithm started to reach a local optimal value at 0.2497 s and started to oscillate, resulting in premature convergence and poor stability. The H–M algorithm had the highest tracking accuracy of 99.61% and the shortest convergence time of 0.099 s.
Due to the poor performance of the DO algorithm in local shadows, only the other three algorithms were compared for shadow mutation conditions. The mutation was performed in 0.6 s under partial shadow occlusion. The results are shown in Figure 10. Figure 10 showed that the tracking results before 0.6 s were consistent with the static shadow occlusion results. After 0.6 s, the irradiance of the photovoltaic module changed from 800 W/m2 to 600 W/m2, and the P–U characteristic curve of the photovoltaic array changed to two peaks. The PSO algorithm fell into local optimization after a sudden change in shadow and returned to stability after a large fluctuation of 0.235 s. The convergence time difference between the OPSO algorithm and the H–M algorithm was 46 ms. The error between the H–M algorithm and theoretical value was 0.8%, and the error of the OPSO algorithm was 4%. After the shadow mutation, the curve of the H–M algorithm had no significant fluctuations and was smoother. This indicates that the dynamic performance of the H–M algorithm is better. In summary, the algorithm proposed in the study is applicable to traditional photovoltaic arrays composed of series modules, as well as photovoltaic systems with equivalent resistors at the output end.

5. Conclusions

The MPPT method can adjust the DC output of the photovoltaic inverter by sending signals from the detected external environment to maximize the power generation effect of the photovoltaic inverter. However, the traditional MPPT method is difficult to use in the case of uneven illumination. Therefore, the research optimizes the OPSO algorithm to obtain the HQPSO algorithm. Then, the H–M algorithm is established by combining the HQPSO algorithm with the MPPT method. The experimental results showed that in the Roserock function and Rastigin function tests, the H–M algorithm always converged to the theoretical minimum with a probability of more than 94%. In addition, with a particle count of 20, it achieved the effect of the OPSO algorithm with a particle count of 40. Furthermore, in the three functions, the convergence rate of the H–M algorithm significantly improved by nearly 60% under two types of population, and the average convergence iteration number also decreased by more than 180 times. The tracking error of the H–M algorithm under lighting conditions was less than 1%, and compared with the other three methods, the H–M algorithm had the shortest convergence time in any shadow occlusion environment, reaching a stable state within 0.1 s. This indicated that the tracking results of the proposed method had extremely high stability and dynamic performance and can adapt well to changes in the environment. In addition, under partial shading conditions, this method can significantly improve the power generation efficiency of the photovoltaic array, thereby increasing the total power generation of the PPG system. In summary, the H–M algorithm proposed in the study can effectively improve the photovoltaic conversion efficiency of PPG systems, providing methods for photovoltaic industry-related projects around the world to further promote solar power generation technology. However, there are still shortcomings in the research. The research only focuses on the MPPT method and optimization of photovoltaic arrays under local shadow occlusion. The output terminal of the entire photovoltaic system uses a form of equivalent resistance, which is also a preset fixed resistance. In the future, further research can be conducted combining inverter circuits and grid connections to make their applicability more extensive.

Author Contributions

Conceptualization, writing—original draft preparation X.X. and W.Z.; methodology, W.X.; formal analysis, writing—original draft preparation Y.N.; investigation, resources, S.C.; data curation, writing—review and editing Y.O. and K.Z.; visualization, supervision, M.L. All authors have read and agreed to the published version of the manuscript.

Funding

This research received no external funding.

Institutional Review Board Statement

Not Applicable.

Informed Consent Statement

Not Applicable.

Data Availability Statement

The datasets used and/or analyzed during the current study are available from the corresponding author on reasonable request.

Conflicts of Interest

There are no conflicts of interest in this article.

References

  1. Mathi, R.; Jayalalitha, S. Influence of renewable energy sources on the scheduling on thermal power stations and its optimization for CO2 reduction. Comput. Intell. 2022, 38, 903–920. [Google Scholar] [CrossRef]
  2. Farmahini, A.H.; Friedrich, D.; Brandani, S.; Sarkisov, L. Exploring new sources of efficiency in process-driven materials screening for post-combustion carbon capture. Energy Environ. Sci. 2020, 13, 1018–1037. [Google Scholar] [CrossRef]
  3. Sun, S.; Liu, Y.; Li, Q.; Wang, T.; Chu, F. Short-term multi-step wind power forecasting based on spatio-temporal correlations and transformer neural networks. Energy Convers. Manag. 2023, 283, 116916. [Google Scholar] [CrossRef]
  4. Vijayalakshmi, V.J.; Arumugam, P.; Christy, A.A.; Brindha, R. Simultaneous allocation of EV charging stations and renewable energy sources: An Elite RERNN-m2MPA approach. Int. J. Energy Res. 2022, 46, 9020–9040. [Google Scholar] [CrossRef]
  5. Huang, X.; Chen, N.; Ye, D.; Zhong, A.; Liu, H.; Li, Z.; Liu, S. Structurally complementary star-shaped unfused ring electron acceptors with simultaneously enhanced device parameters for ternary organic solar cells. Sol. RRL 2023, 2300143. [Google Scholar] [CrossRef]
  6. Balbino, A.J.; Nora, B.; Lazzarin, T.B. An Improved Mechanical Sensorless Maximum Power Point Tracking Method for PMSG-Based Small Wind Turbines Systems. IEEE Trans. Ind. Electron. 2021, 69, 4765–4775. [Google Scholar] [CrossRef]
  7. Zhang, X.; Gamage, D.; Wang, B.; Ukil, A. Hybrid Maximum Power Point Tracking Method Based on Iterative Learning Control and Perturb & Observe Method. IEEE Trans. Sustain. Energy 2021, 12, 659–670. [Google Scholar]
  8. Li, Z.; Zhang, L.; Zhang, R.; Wang, Z.; Xue, Z.; Sun, H. Unscented Kalman filtering method for scheduling photovoltaic power generation system fluctuations. Proc. Inst. Mech. Eng. Part A J. Power Energy 2021, 235, 608–619. [Google Scholar] [CrossRef]
  9. Sun, K.Q.; Li, K.J.; Pan, J.P.; Liu, Y.; Liu, Y.L. An optimal combined operation scheme for pumped storage and hybrid wind-photovoltaic complementary power generation system. Appl. Energy 2019, 242, 1155–1163. [Google Scholar] [CrossRef]
  10. Zhang, J.; Liu, C.; Yuan, R.; Li, T.; Jiang, Z. Design scheme for fast charging station for electric vehicles with distributed photovoltaic power generation. Glob. Energy Interconnect. 2019, 2, 150–159. [Google Scholar] [CrossRef]
  11. Bhende, C.N.; Hota, S.K.; Nayak, K.; Karanki, S.B. Cooperative control of photovoltaic based water pumping system. IET Renew. Power Gener. 2020, 14, 2278–2286. [Google Scholar] [CrossRef]
  12. Wu, S.L.; Li, S.S.; Gu, F.C.; Chen, P.H.; Chen, H.C. Application of supercapacitors in photovoltaic power generation system. Sens. Mater. 2019, 31, 3583–3597. [Google Scholar] [CrossRef]
  13. Babaei, S.M.; Yahyazadeh, M.; Marj, H.F. Novel MPPT for linear-rotational sun-tracking system using fractional fuzzy grey-based sliding mode control. Iran. J. Sci. Technol. Trans. Electr. Eng. 2020, 44, 1379–1401. [Google Scholar] [CrossRef]
  14. Zhong, C.; Li, H.; Zhou, Y.; Lv, Y.; Chen, J.; Li, Y. Virtual synchronous generator of PV generation without energy storage for frequency support in autonomous microgrid. Int. Electr. Power Energy Syst. 2022, 134, 107343. [Google Scholar] [CrossRef]
  15. Alrasheed, K.S.; Toha, S.F.; Anuar, H.; Buys, Y.F. Maximum power point tracking using light dependent resistor and dc motor for solar photovoltaic system in Kuwait. Int. J. Recent Technol. Eng. 2021, 9, 222–228. [Google Scholar]
  16. Nasr, F.; Madani, S.M.; Niroomand, M. Dual-objective control strategy for maximum power and efficiency point tracking in wirelessly powered biomedical implanted devices. IET Microw. Antennas Propag. 2020, 14, 36–44. [Google Scholar] [CrossRef]
  17. Pachaivannan, N.; Subburam, R.; Ramkumar, U.; Kasinathan, P. Crowded plant height optimisation algorithm tuned maximum power point tracking for grid integrated solar power conditioning system. IET Renew. Power Gener. 2019, 13, 2137–2147. [Google Scholar] [CrossRef]
  18. Azzali, N.; Meucci, M.; Rosa, D.D.; Mercatelli, L.; Sani, E. Spectral emittance of ceramics for high temperature solar receivers. Sol. Energy 2021, 222, 74–83. [Google Scholar] [CrossRef]
  19. Liu, S.; Liu, C. Virtual-vector-based robust predictive current control for dual three-phase PMSM. IEEE Trans. Ind. Electron. 2021, 68, 2048–2058. [Google Scholar] [CrossRef]
  20. Xu, L.; Wang, H.; Su, L.; Lu, D.; Peng, K.; Gao, H. A new class of high-entropy fluorite oxides with tunable expansion coefficients, low thermal conductivity and exceptional sintering resistance. J. Eur. Ceram. Soc. 2021, 41, 6670–6676. [Google Scholar] [CrossRef]
Figure 1. Schematic diagram of the PPG system structure for grid-connected and off-grid.
Processes 11 01456 g001
Figure 2. Equivalent circuit of a photovoltaic cell.
Processes 11 01456 g002
Figure 3. Position of MPPT in the PPG system.
Processes 11 01456 g003
Figure 4. Process of the IC method.
Processes 11 01456 g004
Figure 5. Flow of the HQPSO algorithm.
Processes 11 01456 g005
Figure 6. Flow of the H–M algorithm.
Processes 11 01456 g006
Figure 7. The fitness curve of the Rastigin function of the OPSO algorithm and the H–M algorithm when the population size is ten.
Processes 11 01456 g007
Figure 8. Output power of MPPT control by different algorithms without shadow occlusion.
Processes 11 01456 g008
Figure 9. MPPT output power of different algorithms under local shadow occlusion.
Processes 11 01456 g009
Figure 10. MPPT output power of different algorithms under sudden shadow changes.
Processes 11 01456 g010
Table 1. Test results of different algorithms.
FunctionAlgorithmPopulation SizeMaximumMinimumMean ValueStandard DeviationAverage Number of Convergence IterationsConvergence Rate/%
SpherePSO102.23 × 10−31.44 × 10−208.09 × 10−53.62 × 10−468568
205.43 × 10−197.68 × 10−352.32 × 10−201.02 × 10−19163100
404.01 × 10−332.98 × 10−488.17 × 10−355.61 × 10−34130100
OPSO101.12 × 10−61.73 × 10−182.33 × 10−81.01 × 10−1921698
206.07 × 10−362.98 × 10−441.33 × 10−378.50 × 10−37128100
402.46 × 10−453.51 × 10−511.85 × 10−464.11 × 10−46114100
H–M100000157100
20000080100
40000033100
RosebrockPSO106.381.01 × 10−40.6591.4910000
204.971.05 × 10−40.7211.5210000
402.672.48 × 10−40.8641.6210000
OPSO105.9700.1331.2361276
203.9300.6731.0750480
401.3800.2740.38843380
H–M100.97200.1390.33442798
200.70100.0610.21031897
403.60 × 10−309.69 × 10−55.25 × 10−422595
RastriginPSO1016.800.6531.0210000
2013.91.75 × 10−154.613.109844
407.9603.021.919736
OPSO1017.70.00912.643.1310000
202.9800.9360.82991816
401.9900.5770.74684538
H–M102.1700.8540.64378689
201.7900.3390.51271396
400.32500.05970.023665394
Table 2. Operation results of different algorithms in local shadow occlusion.
AlgorithmDOPSOOPSOH–M
Average output power/W296.1452467.3259572.0456589.6970
Maximum output power/W296.1452590.0347590.5799590.4539
Minimum output power/W296.1452296.1452505.0121587.8071
Average time/s0.2510.4030.2390.125
Disclaimer/Publisher’s Note: The statements, opinions and data contained in all publications are solely those of the individual author(s) and contributor(s) and not of MDPI and/or the editor(s). MDPI and/or the editor(s) disclaim responsibility for any injury to people or property resulting from any ideas, methods, instructions or products referred to in the content.

