Article

Graphene Oxide Membranes for Ionic/Molecular Filtration: From Self-Assembly to Design

1
Jiangsu Key Laboratory of Advanced Food Manufacturing Equipment and Technology, Jiangnan University, Wuxi 214122, China
2
Department of Physics, Xiamen University, Xiamen 361005, China
*
Author to whom correspondence should be addressed.
Processes 2023, 11(5), 1520; https://doi.org/10.3390/pr11051520
Submission received: 24 April 2023 / Revised: 12 May 2023 / Accepted: 15 May 2023 / Published: 16 May 2023
(This article belongs to the Section Materials Processes)

Abstract

:
The graphene oxide (GO) membrane holds great promise in desalination and green energy fields due to its naturally occurring nanochannels, which provide significant advantages in gas and ion filtration. In this study, the sizes and distributions of nanopore/channels in GO membranes and the relationship of GO flakes size and membrane thickness are explored by molecular dynamics simulations. Our results demonstrate that the size of GO flakes influences the distribution of nanopore sizes in GO membranes, while it almost has no influence on the total nanopore area in membranes with the same thickness. Additionally, our findings confirm that the total nanopore area of the GO membranes decreases exponentially as the membrane thickness increases, which is consistent with experimental observations. To expand the range of nanopore size regulation, we developed a columnar-array substrate model to create GO membranes customized for specific filtration functions, such as virus filtration. Our findings provide physical insights into the rational design of functional membranes for energy and environmental applications and offer theoretical guidance and technical support for the practical application of GO membranes in separation and filtration.

1. Introduction

Membrane-based separation technologies are widely used in industrial processes, such as chemical and pharmaceutical separation, gas filtration, and water treatment. This is due to their high energy efficiency, sustainable development, a small footprint, and continuous operation, compared to traditional purification methods [1]. The membranes commonly employed for separation, including those constructed using zeolite [2], silica [3], carbon-based materials [4,5], and polymers [6,7], have exhibited a noteworthy separation performance. Nevertheless, these membranes often encounter challenges in terms of limited tolerance under varying conditions. Thus, membranes with better thermal or chemical stability are needed to improve performance. Graphene and its related materials are regarded as outstanding membrane materials for various purposes due to their single-atom thickness, excellent mechanical properties, and stability [8,9].
GO membranes have been proven to possess favorable gas separation properties. In the initial stages of research, submicron-thick GO membranes exhibited permeability exclusively to water. However, subsequent developments led to the creation of nanometer-thick GO membranes that could permeate gases. A recent study [10] has delved into additional factors that impact the filtration and permeation of gases through GO membranes, broadening our understanding of this area. Nair et al. [11] initially found that these GO membranes were impermeable to gases and liquids, but allowed for unhindered water evaporation. It was later discovered that gas separation properties can be achieved through careful control of the stacking structure. Kim et al. [12] demonstrated the ability to precisely control airflow channels by stacking GO nanosheets in different ways. They found that by using two different stacking methods, the layered GO membranes behaved as nanopores membranes (Method I) or molecular sieve membranes (Method II). Li et al. [13] produced ultrathin GO membranes with a thickness of approximately 1.8 nm, which showed mixture separation selectivity. They tested various gas molecules to determine pore size and discovered that at a temperature of 293 K, hydrogen (with a kinetic diameter of 0.289 nm) passed through the GO membrane 300 times faster than CO2 (with a kinetic diameter of 0.33 nm). Interestingly, they found that the primary factor affecting molecular penetration was not layer spacing, but the selective structural defects inside the GO flakes. These results suggest that few-layer GO membranes can provide excellent selectivity for various gas mixtures. The molecular sieve performance of GO membranes depends on their nanostructures, such as layer spacing, intrinsic defects, and functional groups [10].
GO membranes exhibit exceptional versatility. Subsequently, researchers have prepared GO membranes with varying thicknesses to filtrate ions and organic dyes. Extensive studies have been conducted to explore the ion filtration mechanism of GO membranes, providing valuable insights into their filtration capabilities in these specific applications. GO membranes have proven to be highly versatile and to possess exceptional selectivity not only for gases but also for various ions and organic dyes in solution. Ultrathin filtration membranes with nanometer thicknesses have been fabricated by Yang et al. [14] and Han et al. [15], which exhibit exceptional filtration and sieving performances, and organic dye retention exceeding 99.9%. Joshi et al. [16] fabricated micron-thick GO membranes that can block all solutes with a hydration radius larger than 4.5 Å. Through physical constraints, Abraham [17] achieved precise and tunable ion sieving by controlling the layer spacing of GO membranes. Sun et al. developed freestanding GO membranes and demonstrated their selective ion permeation and water purification performance. They attributed the selective ion permeation performance to the nanocapillaries in the layered structure and the different chemical interactions between metal ions and oxygen-containing functional groups [18,19]. Aaron et al. [20] simulated the filtration of milk by GO membranes by molecular dynamics for lactose separation, so that lactose could diffuse through nanochannels in the GO membrane, while the fat and protein were preserved in the milk. GO membranes with a thickness greater than 100 nm exhibit no detectable penetration [21,22].
Moreover, researchers have improved the filtration performance of GO membranes by modifying the interlayer spacing. Huang et al. [23] introduced copper hydroxide nanochains into the GO membrane, yielding a membrane with superior water flux and rejection rate. This innovative approach highlights the potential for enhancing the filtration capabilities of GO membranes through strategic modifications. Additionally, Han et al. [24] co-assembled graphene with multi-walled carbon nanotubes, and Hu et al. [25] utilized crosslinking reagents to assemble GO membranes layer by layer, both of which resulted in filter membranes with high retention of organic dyes and moderate retention of salt ions. In recent years, some researchers have used substances other than GO for modification treatment to obtain GO filtration membranes with better performance for dye removal [26,27].
While previous studies have explored the filtration and separation capabilities of GO membranes, there remains a research gap at a more microscopic level. For instance, understanding the microstructure, functional groups, stacking order between adjacent GO flakes, and interlayer spacing becomes crucial for regulating the permeability and selectivity of various particle types [28,29]. However, the intricate nature of graphene’s microstructure poses challenges in analyzing the membrane’s structural attributes through experimental measurements [30,31]. Therefore, a comprehensive analysis of the factors influencing filtration performance becomes necessary, offering valuable insights for the design and manufacturing of GO membranes [32,33,34,35].
This study demonstrates that nanopore size, number, and distribution on the GO membrane can be controlled by changing the size of the GO flakes and the thickness of the membrane. These findings provide a theoretical reference for designing the filtration performance of GO membranes in industrial applications.

2. Materials and Methods

To avoid confusion, the abbreviations of the variables used in this paper are shown in Table 1.
In this study, we employed a simulation approach to investigate the gas filtration mechanism of GO membranes prepared using vacuum filtration. We constructed hydroxyl-functionalized graphene with a concentration of c = nOH/nC = 20% on both sides of the flake in the oxidation regions of GO, where nOH is the number of densities of hydroxyl groups and nC is the number of densities of the carbon atom. The distribution of hydroxyl groups was randomly sampled in the oxidized region. The all-atom optimized potentials for liquid simulations (OPLS-AA) [36] were used for GO. This potential can capture essential many-body terms in interatomic interactions, including bond stretching, van der Waals, and electrostatic interactions. This potential has been widely applied to the study of the properties of GO [34,36]. We used periodic boundary conditions (PBC) in all three directions, and isothermal-isobaric (NPT) ensemble relaxation was performed in the vertical plane direction of the GO block material.
The deposition model was generated by randomly generating nb GO blocks with the dimensions of bl, bw, and bh in a periodic box with the dimensions of boxl and boxw. GO flakes with the same-sized ns flakes were stacked to form a GO block material. The number of layers in the GO block is lg. For simplicity and consistency, we used a square box and square-shaped GO block materials with bl = bw and boxl = boxw. The GO blocks were then allowed to settle freely, and the lbl is determined by two rules:
  • If a block is in contact with the base, we set lbl to 1;
  • If a newly generated block overlaps with an existing one, we mark the block layer where the overlapping block is present as lbl − 1.
That is, each block is placed on either the first layer or on top of the coinciding block layer. The resulting GO membrane material consists of lb layers of GO blocks, where each GO block contains lg layers of GO flakes. The settling process is shown in Figure 1a. Figure 1b depicts cross-sectional TEM images of ultrathin GO membranes [12]. Figure 1c shows a side-view schematic of the GO membranes model in this paper. Figure 1d shows the SEM images of GO membranes [12]. Figure 1e is a top-down schematic of the GO membranes established in this paper. The marked red circles represent the structural defects of the GO membrane prepared by the experiment, which act as channels for gas molecules to pass through the GO membrane. The red squares represent the nanopores in the GO membrane model, corresponding to the structural defects observed in the GO membrane prepared by experiment. These nanopores are formed by the deposition of the GO flakes.
To guide the design and optimization of the GO membranes model, we introduce dimensionless parameters to define the gas permeation state through the membranes. In this context, the values of boxl and bl do not have any special meaning, as the deposition model is dimensionless. The quantity of GO blocks depends on boxl/bl. α is defined as the average coverage of GO blocks in each layer. The relationship between α and boxl/bl is shown in Figure 2a, and α is convergence on 0.15 when boxl/bl is over 20. The parameter of the boxl/bl was fixed at 30 in this study.
The variables used in this study include boxl and bl in addition to the nb, with the lb being a function of these three variables. To determine the lb, we first investigated the α for various lb values in the GO membranes model, as presented in Figure 2b. The average coverage of each layer shows a decreasing trend when lb is less than 50 or greater than the max lb − 50 (“the max lb − 50” means 50 layers less than the maximum layer number lb), whereas it fluctuates steadily around 0.15 between those values, which is taken as the average coverage of each layer in this study. The lb for each model is represented by the horizontal coordinate of the intersection of 0.075 and the image. To account for the random depositing of GO flakes, we conducted multiple simulations to investigate the probability distribution of different lb formed in the GO membrane model for the same number of GO blocks. The average value of the multiple simulations was then taken as the final value of lb, as depicted in Figure 2c. Furthermore, we varied the nb and performed simulations to assess the probability distribution changes in lb. The average value of multiple simulations was used as the final value of lb.
The deposition model contains a significant number of interlayer channels, which results in a model with a lower density compared to the experiment. The GO flake in the upper layer collapses when the spanning width is greater than 7.0 nm and 100.0 nm for a single layer and bilayer intercalation (Figure 3), respectively. This is evidenced by the steep drop in the red and blue lines, indicating the collapse of GO flakes and abrupt changes in gh. In this study, we calculated the density of the deposition model using Equation (1):
ρ = 4 m C + 4 c ( m O + m H ) 3 3 C bond 2 g h N A α
where mC, mO, and mH are the relative atomic masses of a single carbon, oxygen, and hydrogen atoms, respectively, Cbond is the C-C bond length in GO, gh is the interlayer spacing of the GO flake, NA is the Avogadro constant, c is the oxidation concentration of the GO flake, and α is the average coverage of each layer. Equation (1) is a deformation of the density formula ρ = m v . Volume is calculated by multiplying the graphene lattice area by layer gh. The whole is then multiplied by the α to obtain the density formula.
To calculate the density of the lap model, the gh and the oxide concentration need to be known. The oxidation concentration affects the gh of the model, and the gh affects the density of the GO block material. In Figure 4a, the influence of the oxidation concentration of the GO flake on gh is depicted, and we regulated the GO flake oxidation concentration to adjust gh. A linear relationship is used to fit the correlation between the two factors. The closest match to the actual situation is observed when the oxidation concentration was 20%. Figure 4b illustrates the impact of oxidation concentration on the density of GO block material. As the oxidation concentration affects gh and gh affects the density of GO block material, a quadratic function is used to fit the relationship between the oxidation concentration and the density of GO material. The decidable coefficients’ R-square values were 0.99394 and 1.0, respectively.
The density of the deposition model was calculated using gh = 0.54 nm and an oxidation concentration of 20% for all hydroxyl groups; the density of the obtained GO block material is 1.83 g/cm3. When α is 0.15, the density of the model is approximately 0.274 g/cm3 according to Equation (1). It should be noted that the experimental density of the GO membranes is approximately 1.1 g/cm3. We compressed the model so that the GO membranes generated by the deposition model match the experimental density. A folding factor η was obtained as a ratio to calculate the corresponding number of layers of the relaxed model. (η ≈ 0.25) The compression process simulates the collapse of stacked GO flakes. Considering the distribution of each GO flake, the number of layers in the deposition model is computed using Equation (2):
l = η l b l g
where η is the coefficient used to convert density, lb is the layer number of the GO block, and lg is the layer number of GO flakes in each GO block. After compressing the model, its density increases, indicating the removal of interlayer channels, while the distribution of nanopores remains unaffected. Furthermore, the main conclusions drawn from the model are not affected. To investigate the relationship between the sizes of GO flakes and the porosity of the model, this study categorized the nanopores in the deposition model by size and analyzed their distribution.

3. Results and Discussion

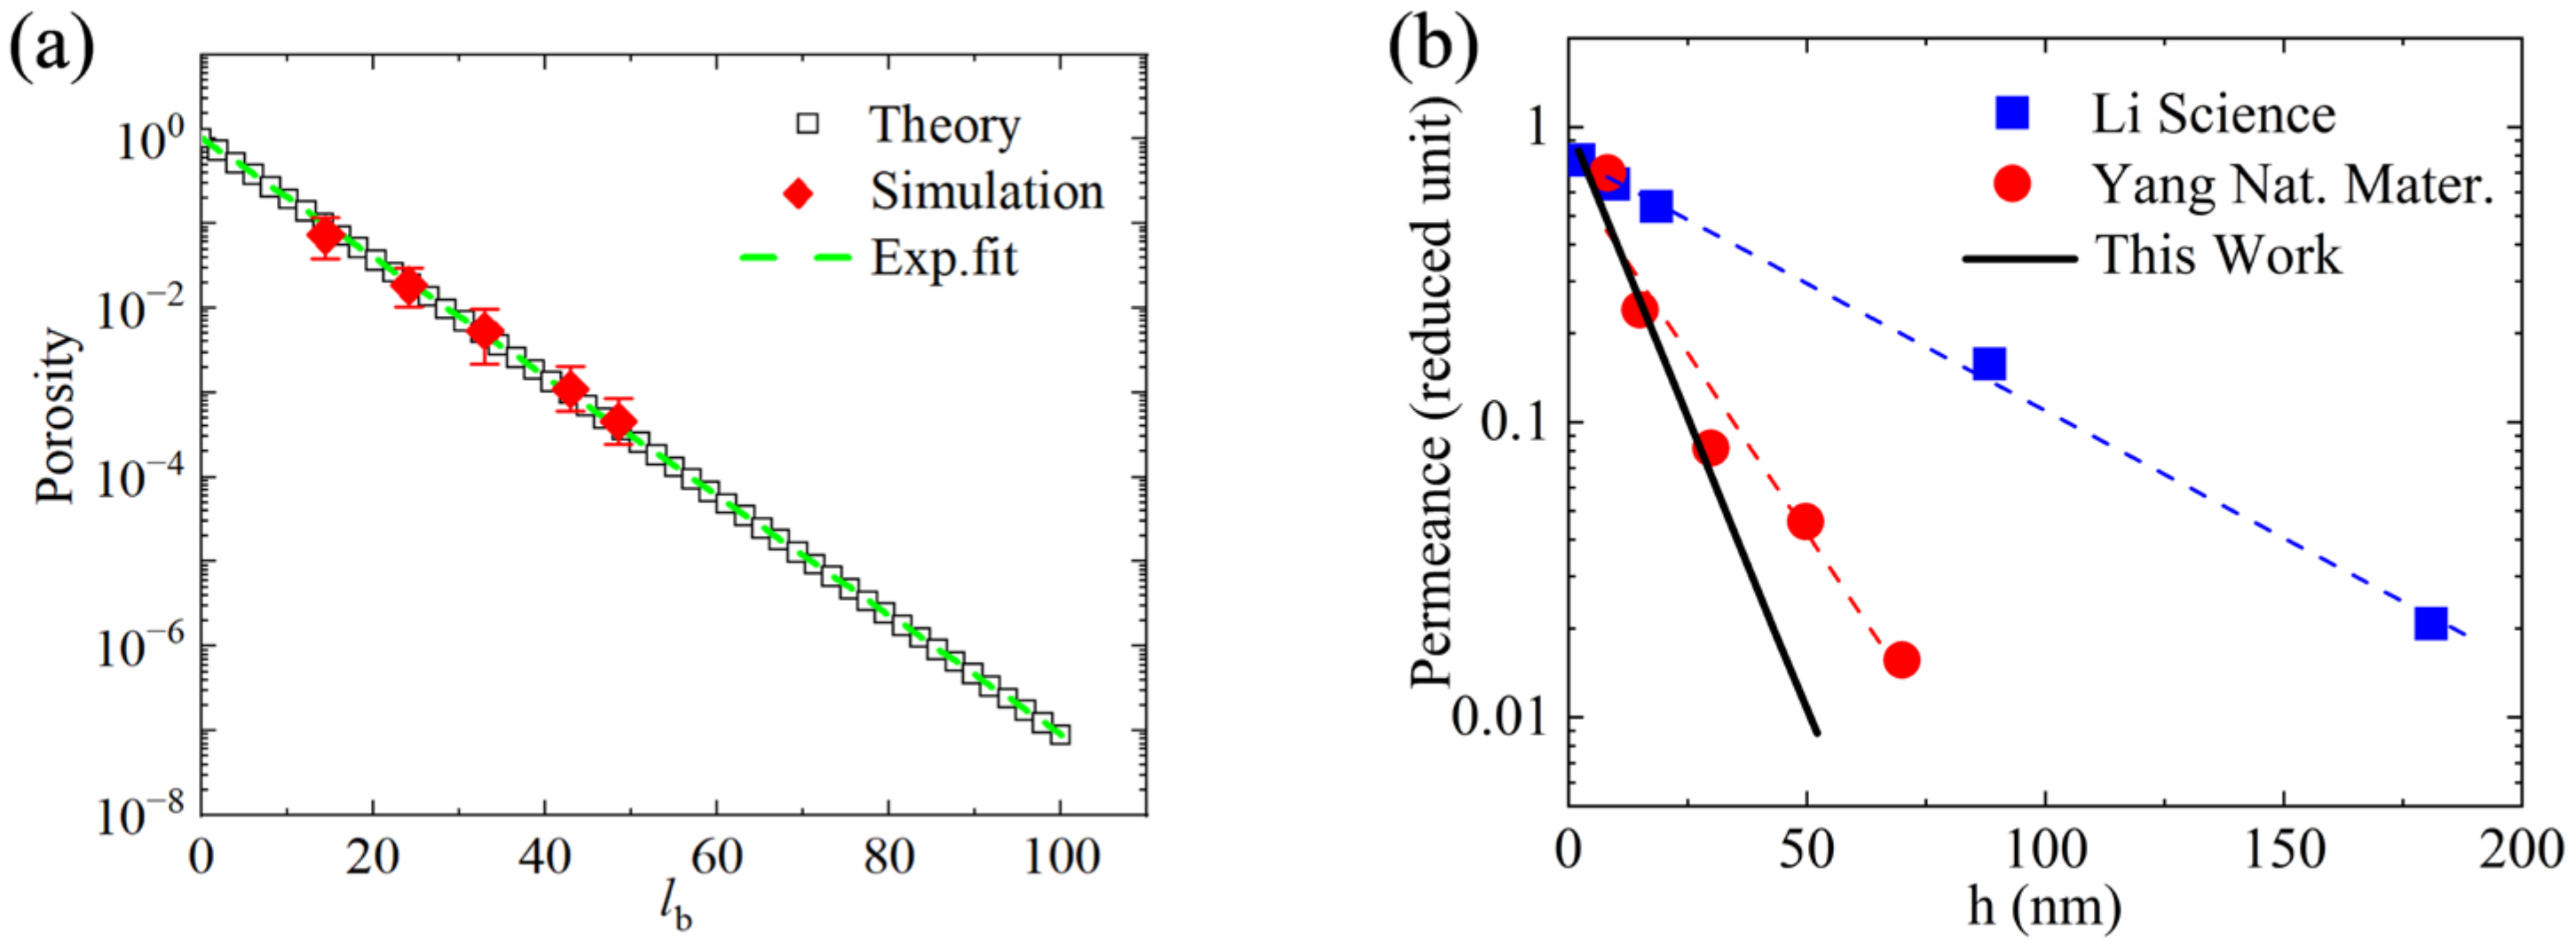
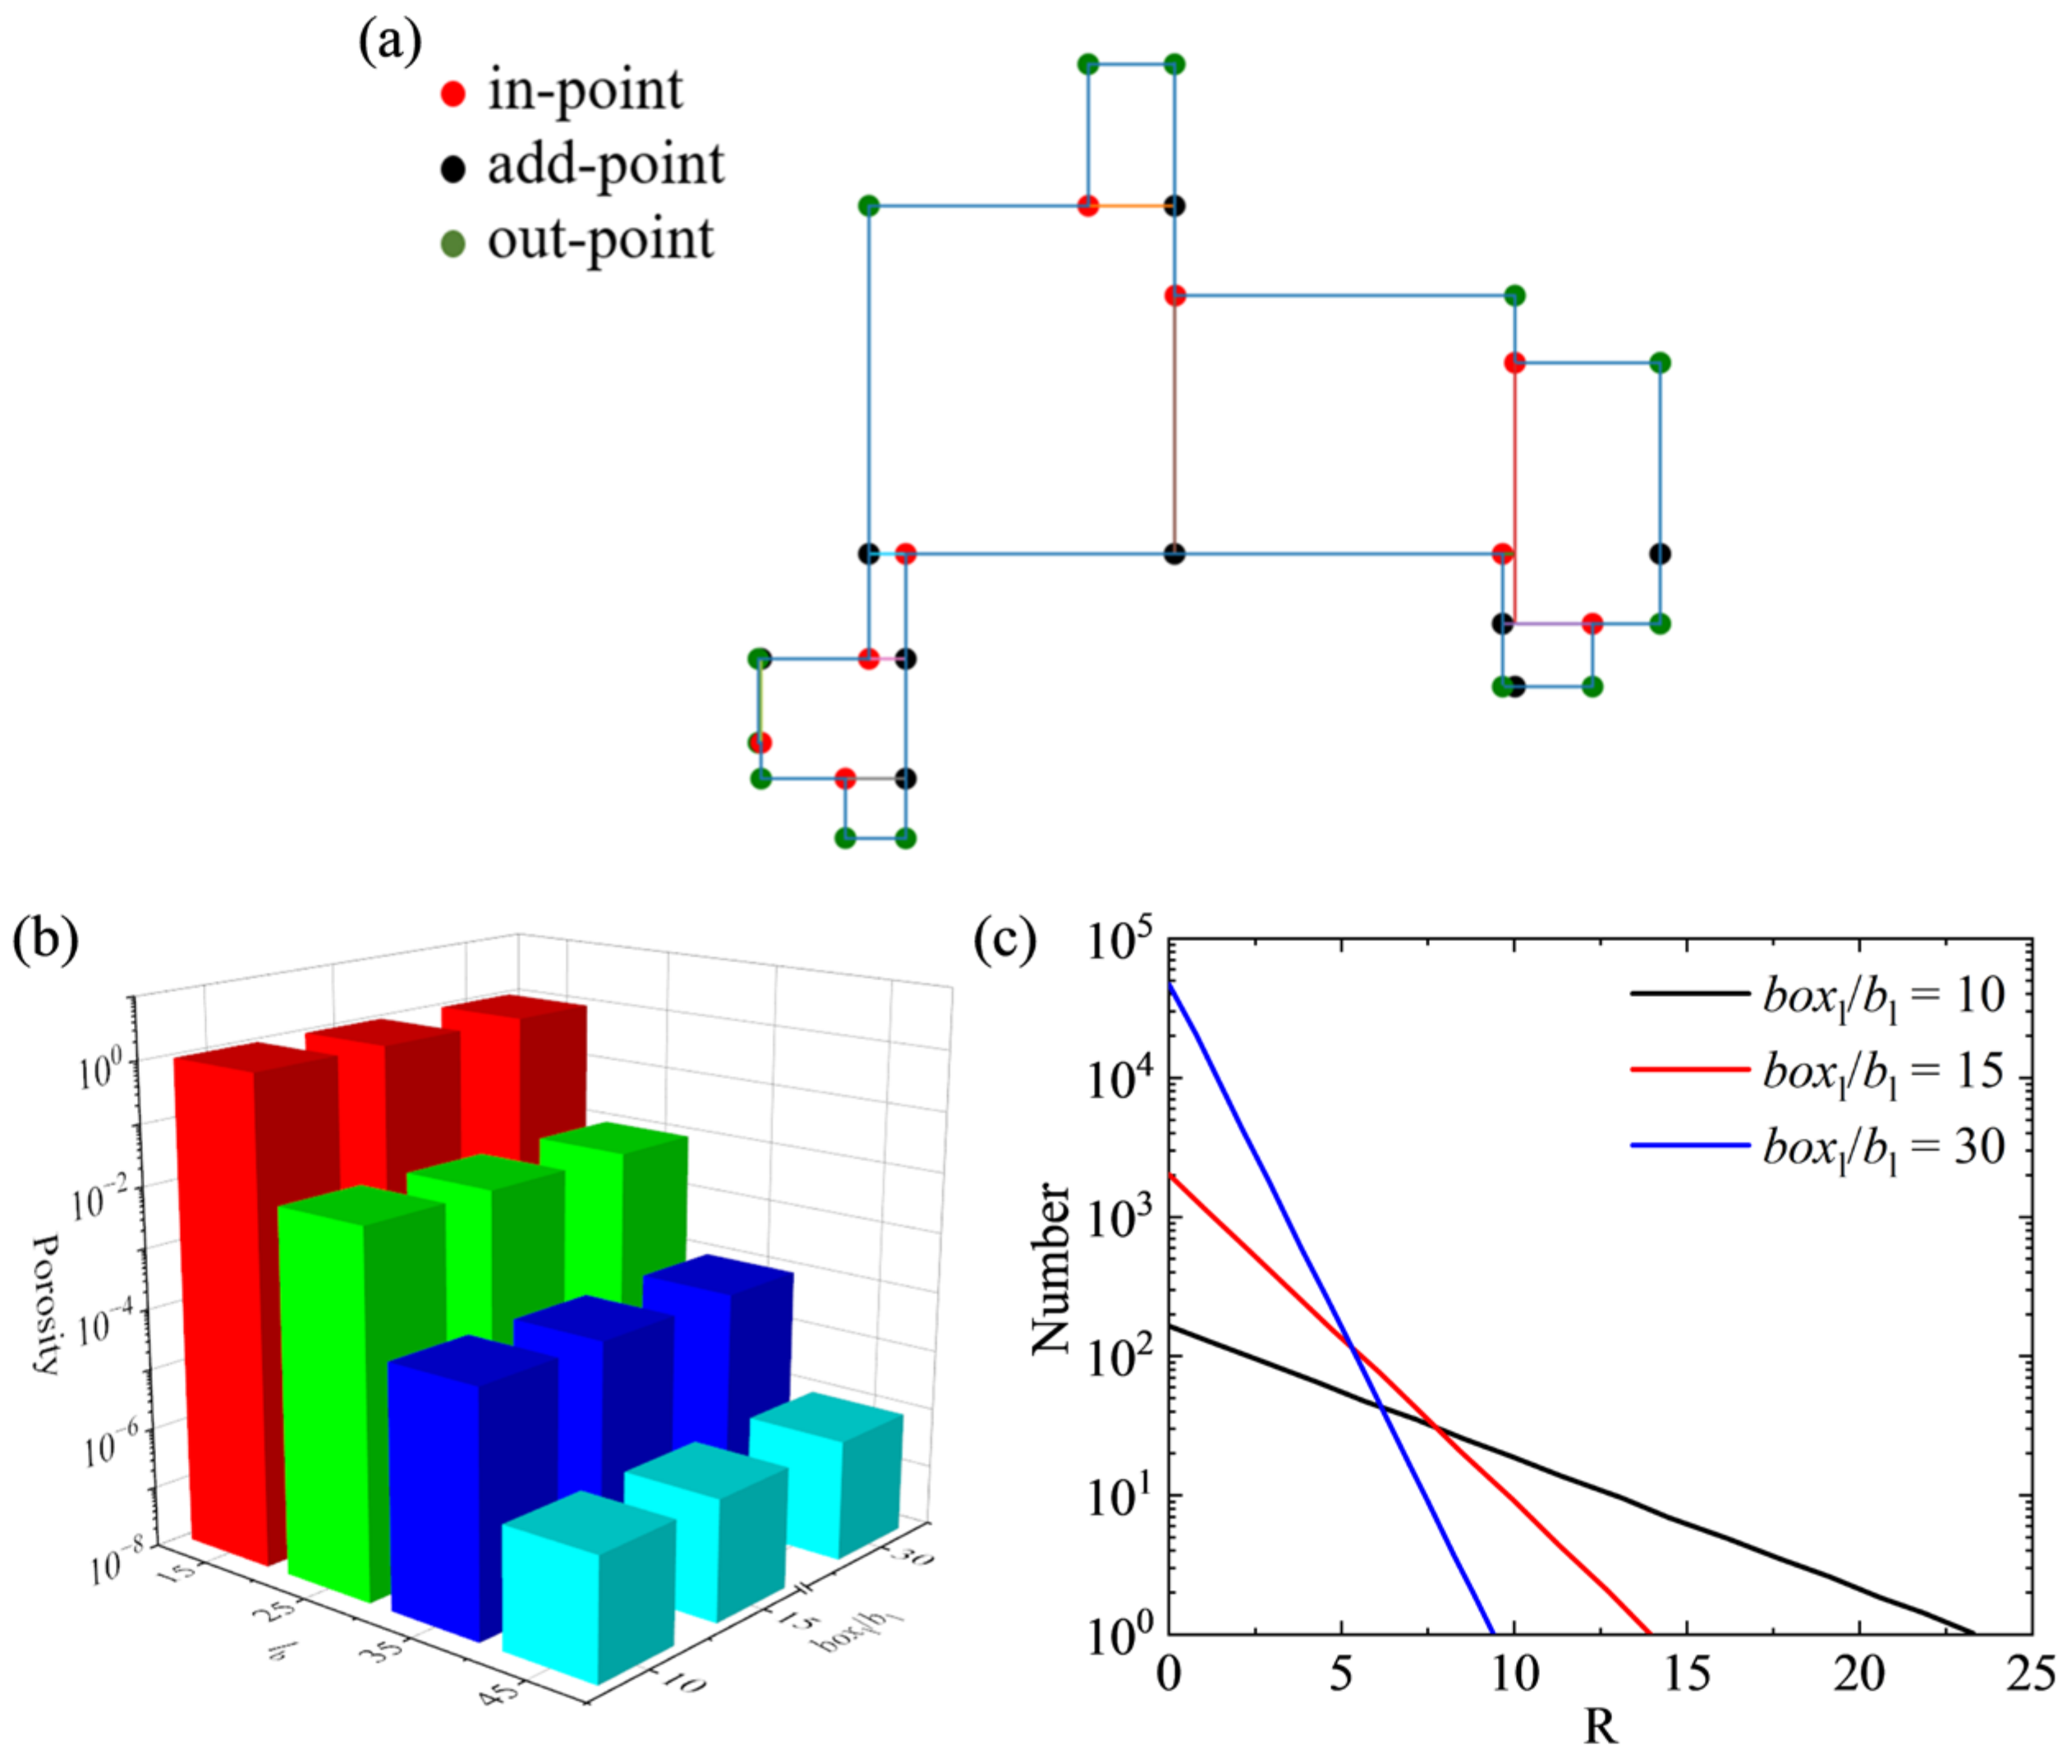
3.1. Porosity Calculate

Given that the GO flakes in each layer of the deposition model do not overlap, the coverage of each layer of GO membranes can be determined by counting the number of GO flakes in each layer. The coverage of the n-layer GO membranes can then be obtained.
This study compared and analyzed the total nanopore area of GO membranes formed by different thicknesses of GO blocks through analytical and numerical simulations. In the analytical approach, the α = 0.15 of each layer from the simulation results is used as a known condition, and the theoretical values are shown in Figure 5a. It can be observed that the porosity of the total membranes of the deposition model decreases exponentially as the lb increases. The exponential fitting formula used is y = exp (−0.16252 × x). The area of the nanopores generated by the deposition model is then summed to obtain the porosity values corresponding to different numbers of GO block layers, and the simulation results are obtained as shown in Figure 5a. The good agreement between the simulated and derived results further confirms the validity and reasonableness of our findings.
In this study, we establish a proportional relationship between the area of the nanopore and gas flux using the reduced unit. By combining Equation (2) with Figure 5a, we obtain the relationship between the gas permeability of the deposition model and the membrane thickness, as shown by the black line in Figure 5b. The exponential fitting formula is y = 1.03 × exp (−0.0908 × x). We observe that as the membrane thickness increases, the gas permeability of the membrane decreases exponentially. Combining the results from previous studies, it is evident that both the simulation and experimental results consistently demonstrate an exponential decrease in gas flux with increasing membrane thickness, as depicted in Figure 5b [13,14]. These findings indicate that our deposition model is both scientific and reasonable. There is a discrepancy between the simulation and experimental results due to the ideal model’s failure to account for the adsorption factor.

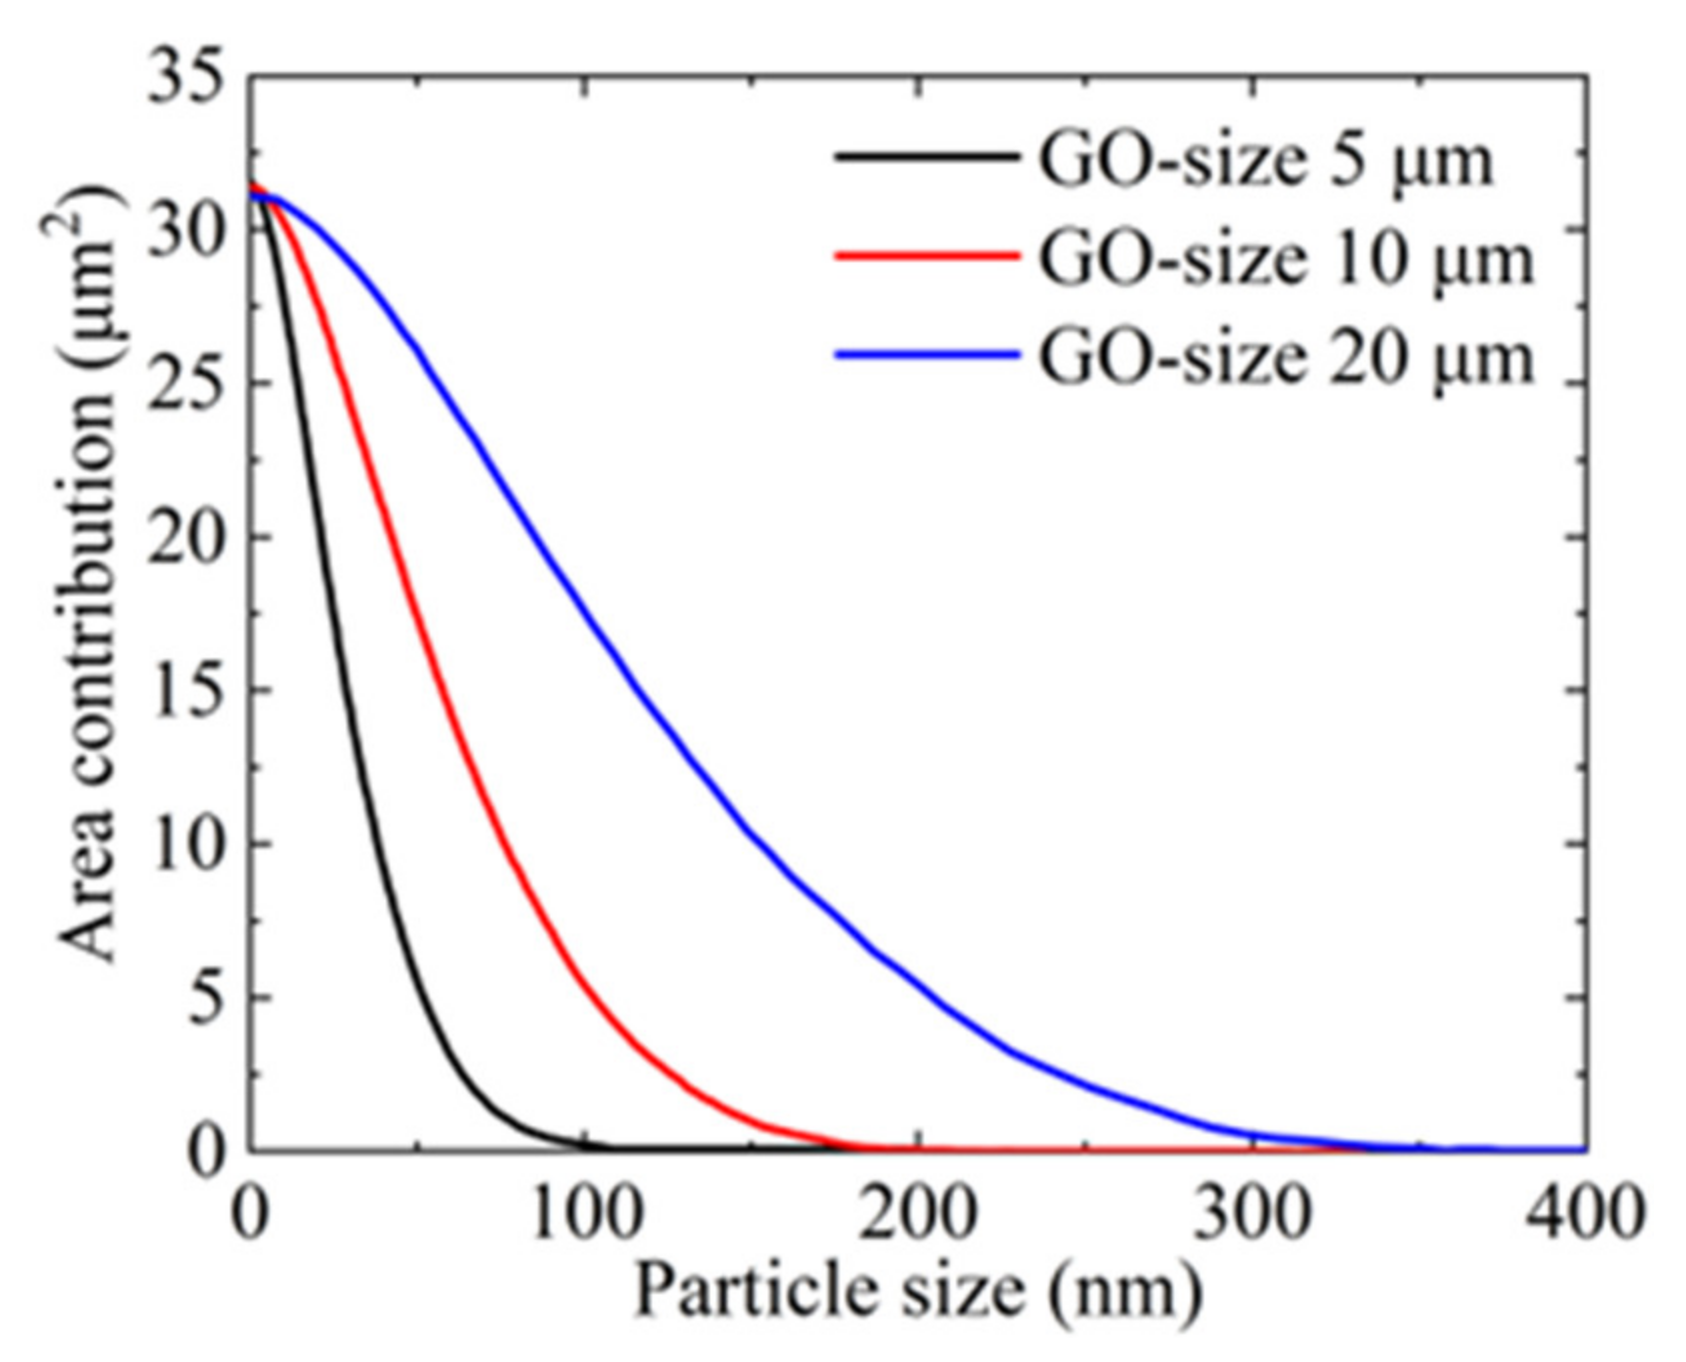
3.2. Effect of GO Flakes on the Formation of Holes

We further investigated the relationship between the size of the GO flakes and resulting porosity by subdividing the nanopores in the deposition model and analyzing the distribution of nanopores of different sizes. In Figure 6a, representative nanopores generated by the deposition model are presented. The nanopores are formed based on the in points and out points, and auxiliary add points are included for dividing the nanopores. Additionally, we connect the lines of the shortest strings corresponding to each in point along with the lines of the nanopore boundaries. To avoid intersecting strings, we truncate the strings as required. Based on this, the size of each nanopore can be counted, where the largest area nanopore determines the size of the particles that can be filtered.
Figure 6b illustrates that the total nanopore area of the deposition model decreases with an increasing thickness of lb. Figure 6c shows the distribution of nanopores with different sizes after subdividing the nanopores in GO membranes at lb = 35. By combining the findings in Figure 6b,c, it can be concluded that the total nanopore area is independent of the sizes of the GO flake, but the sizes of the flakes affect the distribution of nanopores with different sizes. Specifically, under the same lb, smaller flakes result in a higher number of small nanopores and a lower number of large nanopores, decreasing the probability of large molecules passing through. Conversely, larger flakes result in a higher number of large nanopores, increasing the probability of both large and small molecules passing through.
From the properties mentioned above, we can infer that an increase in the thickness of the GO film leads to a decrease in the porosity index. Additionally, with the same membrane thickness, the probability of larger nanopores increases as the sizes of the GO flakes used increases. Therefore, we can make more versatile filtration membranes by adjusting the number of GO flakes and using larger GO flakes.
Based on the investigation of the contribution of different sizes of GO flakes to the nanopore area during filtration, it can be concluded from the results presented in Figure 7 that the sizes of the GO flakes can be adjusted to control the sizes of the nanopores. For instance, by setting the membrane thickness at 30 nm and the membrane area at 1 mm2, the size of the GO flakes can be adjusted to 10 μm to prevent the passage of particles larger than 200 nm through the membranes. As illustrated in Table 2, the sizes of some particles are provided.

3.3. Promotional Applications

Here, we propose an ideal model for separating viruses using GO membranes. As shown in Figure 8a,b, the GO membranes that feature columnar-array pores can be employed for separating viruses from the surrounding environment. By varying the diameter size D of the cylinders, we can obtain GO membranes with adjustable sizes of nanopores, which can be used to filter particles of different sizes, such as gas molecules, ions, viruses, and macromolecules. Figure 8c,d depicts the top and side views of the proposed GO membrane filtration process. Previous studies [37] have shown that GO films possess remarkable local stability and self-healing properties, which enable them to maintain excellent stability even in porous structures. Our results are in good agreement with previous studies. It is helpful for further underscoring the potential of GO-derived materials for various applications.
The application of GO membrane filtration holds great promise because not only can it filter particles through its nanopores, but also its surface exhibits strong adsorption for viruses, making it an effective barrier to their passage. For instance, oxygen-containing functional groups on the surface of the GO membranes can form hydrogen bonds with the protein shells of viruses, resulting in significant adsorption. This paper categorizes the main filtration applications of GO membranes into three categories: gas molecules, ions, and large-size particles, such as viruses. The conclusions drawn from this study can serve as a guide for future experimental work.
This paper offers valuable insights for the design and fabrication of GO filtration membranes. Through the manipulation of the number and sizes of GO flakes, we can customize the properties of the membranes to meet specific application requirements. This opens up new potential applications for GO membranes, including the filtration of larger particles, such as viruses, in addition to gas and ion filtration. However, practical production is currently hindered by limitations in experimental technology.

4. Conclusions and Future Perspectives

This study reveals that strategic adjustments to the size and thickness of GO flakes can regulate the size, quantity, and distribution of nanopores in resulting GO membranes, facilitating the mass production of GO filtration membranes for various applications. Consequently, the scope of GO membrane uses can be expanded. These findings provide a theoretical reference for industrial GO membrane filtration performance design. By achieving molecular-level control during the self-assembly stages of GO membranes, the field of membrane filtration can enhance precision and efficiency, leading to improved filtration processes.

Author Contributions

Conceptualization, N.M., N.W. and J.Y.; methodology, N.M.; software, K.X.; validation, N.M. and K.X.; formal analysis, K.X.; investigation, N.M.; resources, J.G.; data curation, K.X.; writing—original draft preparation, N.M. and J.Y.; writing—review and editing, N.M. and N.W.; visualization, K.X.; supervision, N.W. and J.Y. All authors have read and agreed to the published version of the manuscript.

Funding

This research was supported by the China Postdoctoral Science Foundation (No.2020M570731).

Data Availability Statement

The data presented in this study are available on request from the corresponding author.

Conflicts of Interest

The authors declare no conflict of interest.

References

  1. Kwon, O.; Choi, Y.; Choi, E.; Kim, M.; Woo, Y.C.; Kim, D.W. Fabrication Techniques for Graphene Oxide-Based Molecular Separation Membranes: Towards Industrial Application. Nanomaterials 2021, 11, 757. [Google Scholar] [CrossRef] [PubMed]
  2. Yu, M.; Noble, R.D.; Falconer, J.L. Zeolite Membranes: Microstructure Characterization and Permeation Mechanisms. Accounts Chem. Res. 2011, 44, 1196–1206. [Google Scholar] [CrossRef] [PubMed]
  3. De Vos, R.M.; Verweij, H. High-Selectivity, High-Flux Silica Membranes for Gas Separation. Science 1998, 279, 1710–1711. [Google Scholar] [CrossRef]
  4. Shiflett, M.B.; Foley, H.C. Ultrasonic Deposition of High-Selectivity Nanoporous Carbon Membranes. Science 1999, 285, 1902–1905. [Google Scholar] [CrossRef]
  5. Yaqoob, A.A.; Ibrahim, M.N.M.; Ahmad, A.; Vijaya Bhaskar Reddy, A. Toxicology and Environmental Application of Carbon Nanocomposite. In Environmental Remediation Through Carbon Based Nano Composites; Springer: Singapore, 2021; pp. 1–18. [Google Scholar]
  6. Park, H.B.; Jung, C.H.; Lee, Y.M.; Hill, A.J.; Pas, S.J.; Mudie, S.T.; Van Wagner, E.; Freeman, B.D.; Cookson, D.J. Polymers with Cavities Tuned for Fast Selective Transport of Small Molecules and Ions. Science 2007, 318, 254–258. [Google Scholar] [CrossRef]
  7. Umar, K.; Yaqoob, A.A.; Ibrahim, M.N.M.; Parveen, T.; Safian, M.T.-u. Environmental Applications of Smart Polymer Composites. In Smart Polymer Nanocomposites; Woodhead Publishing: Sawston, UK, 2021; pp. 295–312. [Google Scholar]
  8. Lee, C.; Wei, X.; Kysar, J.W.; Hone, J. Measurement of the Elastic Properties and Intrinsic Strength of Monolayer Graphene. Science 2008, 321, 385–388. [Google Scholar] [CrossRef] [PubMed]
  9. Singh, R.S.; Li, D.; Xiong, Q.; Santoso, I.; Yu, X.; Chen, W.; Rusydi, A.; Wee, A.T.S. Anomalous Photoresponse in the Deep-Ultraviolet Due to Resonant Excitonic Effects in Oxygen Plasma Treated Few-Layer Graphene. Carbon 2016, 106, 330–335. [Google Scholar] [CrossRef]
  10. Qiu, R.; Xiao, J.; Chen, X.D.; Selomulya, C.; Zhang, X.; Woo, M.W. Relationship between Desalination Performance of Graphene Oxide Membranes and Edge Functional Groups. ACS Appl. Mater. Inter. 2020, 12, 4769–4776. [Google Scholar] [CrossRef]
  11. Nair, R.R.; Wu, H.A.; Jayaram, P.N.; Grigorieva, I.V.; Geim, A.K. Unimpeded Permeation of Water through Helium-Leak-Tight Graphene-Based Membranes. Science 2012, 335, 442–444. [Google Scholar] [CrossRef] [PubMed]
  12. Kim, H.W.; Yoon, H.W.; Yoon, S.-M.; Yoo, B.M.; Ahn, B.K.; Cho, Y.H.; Shin, H.J.; Yang, H.; Paik, U.; Kwon, S.; et al. Selective Gas Transport Through Few-Layered Graphene and Graphene Oxide Membranes. Science 2013, 342, 91–95. [Google Scholar] [CrossRef] [PubMed]
  13. Li, H.; Song, Z.; Zhang, X.; Huang, Y.; Li, S.; Mao, Y.; Ploehn, H.J.; Bao, Y.; Yu, M. Ultrathin, Molecular-Sieving Graphene Oxide Membranes for Selective Hydrogen Separation. Science 2013, 342, 95–98. [Google Scholar] [CrossRef] [PubMed]
  14. Yang, Q.; Su, Y.; Chi, C.; Cherian, C.T.; Huang, K.; Kravets, V.G.; Wang, F.C.; Zhang, J.C.; Pratt, A.; Grigorenko, A.N.; et al. Ultrathin Graphene-Based Membrane with Precise Molecular Sieving and Ultrafast Solvent Permeation. Nat. Mater. 2017, 16, 1198–1202. [Google Scholar] [CrossRef] [PubMed]
  15. Han, Y.; Xu, Z.; Gao, C. Ultrathin Graphene Nanofiltration Membrane for Water Purification. Adv. Funct. Mater. 2013, 23, 3693–3700. [Google Scholar] [CrossRef]
  16. Joshi, R.K.; Carbone, P.; Wang, F.C.; Kravets, V.G.; Su, Y.; Grigorieva, I.V.; Wu, H.A.; Geim, A.K.; Nair, R.R. Precise and Ultrafast Molecular Sieving through Graphene Oxide Membranes. Science 2014, 343, 752–754. [Google Scholar] [CrossRef] [PubMed]
  17. Abraham, J.; Vasu, K.S.; Williams, C.D.; Gopinadhan, K.; Su, Y.; Cherian, C.T.; Dix, J.; Prestat, E.; Haigh, S.J.; Grigorieva, I.V.; et al. Tunable Sieving of Ions Using Graphene Oxide Membranes. Nat. Nanotechnol. 2017, 12, 546–550. [Google Scholar] [CrossRef] [PubMed]
  18. Sun, P.; Liu, H.; Wang, K.; Zhong, M.; Wu, D.; Zhu, H. Selective Ion Transport Through Functionalized Graphene Membranes Based on Delicate Ion–Graphene Interactions. J. Phys. Chem. C 2014, 118, 19396–19401. [Google Scholar] [CrossRef]
  19. Sun, P.; Zheng, F.; Zhu, M.; Song, Z.; Wang, K.; Zhong, M.; Wu, D.; Little, R.B.; Xu, Z.; Zhu, H. Selective Trans-Membrane Transport of Alkali and Alkaline Earth Cations Through Graphene Oxide Membranes Based on Cation-π Interactions. ACS Nano 2014, 8, 850–859. [Google Scholar] [CrossRef]
  20. Morelos-Gomez, A.; Terashima, S.; Yamanaka, A.; Cruz-Silva, R.; Ortiz-Medina, J.; Sánchez-Salas, R.; Fajardo-Díaz, J.L.; Muñoz-Sandoval, E.; López-Urías, F.; Takeuchi, K.; et al. Graphene Oxide Membranes for Lactose-Free Milk. Carbon 2021, 181, 118–129. [Google Scholar] [CrossRef]
  21. Su, Y.; Kravets, V.G.; Wong, S.L.; Waters, J.; Geim, A.K.; Nair, R.R. Impermeable Barrier Films and Protective Coatings Based on Reduced Graphene Oxide. Nat. Commun. 2014, 5, 4843–4847. [Google Scholar] [CrossRef]
  22. Kanwal, A.; Yaqoob, A.A.; Siddique, A.; Bhawani, S.A.; Ibrahim, M.N.M.; Umar, K. Hybrid Nanocomposites Based on Graphene and its Derivatives: From Preparation to Applications. In Graphene and Nanoparticles Hybrid Nanocomposites: From Preparation to Applications; Springer: Singapore, 2021; pp. 261–281. [Google Scholar]
  23. Huang, H.; Song, Z.; Wei, N.; Shi, L.; Mao, Y.; Ying, Y.; Sun, L.; Xu, Z.; Peng, X. Ultrafast Viscous Water Flow Through Nanostrand-Channelled Graphene Oxide Membranes. Nat. Commun. 2013, 4, 2979–2987. [Google Scholar] [CrossRef]
  24. Han, Y.; Jiang, Y.; Gao, C. High-Flux Graphene Oxide Nanofiltration Membrane Intercalated by Carbon Nanotubes. ACS Appl. Mater. Inter. 2015, 7, 8147–8155. [Google Scholar] [CrossRef] [PubMed]
  25. Hu, M.; Mi, B. Enabling Graphene Oxide Nanosheets as Water Separation Membranes. Environ. Sci. Technol. 2013, 47, 3715–3723. [Google Scholar] [CrossRef]
  26. Khansanami, M.; Esfandiar, A. High Flux and Complete Dyes Removal from Water by Reduced Graphene Oxide Laminate on Poly Vinylidene Fluoride/Graphene Oxide Membranes. Environ. Res. 2021, 201, 111576. [Google Scholar] [CrossRef]
  27. Beluci, N.d.C.L.; Homem, N.C.; Amorim, M.T.S.P.; Bergamasco, R.; Vieira, A.M.S. Biopolymer Extracted from Moringa Oleifera Lam. in Conjunction with Graphene Oxide to Modify Membrane Surfaces. Environ. Technol. 2020, 41, 3069–3080. [Google Scholar] [CrossRef] [PubMed]
  28. Borges, D.D.; Woellner, C.F.; Autreto, P.A.; Galvao, D.S. Water/Alcohol Separation in Graphene Oxide Membranes: Insights from Molecular Dynamics and Monte Carlo Simulations. Mrs Adv. 2018, 3, 109–114. [Google Scholar] [CrossRef]
  29. Zhang, Y.; Wang, C.; Wang, C.; Zhang, Y.; Zhao, J.; Wei, N. Lamellar Water Induced Quantized Interlayer Spacing of Nanochannels Walls. Green Energy Environ. 2022. [Google Scholar] [CrossRef]
  30. Huang, P.Y.; Ruiz-Vargas, C.S.; Van Der Zande, A.M.; Whitney, W.S.; Levendorf, M.P.; Kevek, J.W.; Garg, S.; Alden, J.S.; Hustedt, C.J.; Zhu, Y. Grains and Grain Boundaries in Single-Layer Graphene Atomic Patchwork Quilts. Nature 2011, 469, 389–392. [Google Scholar] [CrossRef]
  31. Duong, D.L.; Han, G.H.; Lee, S.M.; Gunes, F.; Kim, E.S.; Kim, S.T.; Kim, H.; Ta, Q.H.; So, K.P.; Yoon, S.J.; et al. Probing Graphene Grain Boundaries with Optical Microscopy. Nature 2012, 490, 235–239. [Google Scholar] [CrossRef]
  32. Madauß, L.; Foller, T.; Plass, J.; Kumar, P.V.; Musso, T.; Dunkhorst, K.; Joshi, R.; Schleberger, M. Selective Proton Transport for Hydrogen Production Using Graphene Oxide Membranes. J. Phys. Chem. Lett. 2020, 11, 9415–9420. [Google Scholar] [CrossRef]
  33. Valencia, L.; Monti, S.; Kumar, S.; Zhu, C.; Liu, P.; Yu, S.; Mathew, A.P. Nanocellulose/Graphene Oxide Layered Membranes: Elucidating Their Behaviour During Filtration of Water and Metal Ions in Real Time. Nanoscale 2019, 11, 22413–22422. [Google Scholar] [CrossRef]
  34. Giri, A.K.; Teixeira, F.; Cordeiro, M.N.D. Salt Separation from Water Using Graphene Oxide Nanochannels: A Molecular Dynamics Simulation Study. Desalination 2019, 460, 1–14. [Google Scholar] [CrossRef]
  35. Saidi, P.; Béland, L.K.; Daymond, M.R. Graphene Oxide Membranes for Water Isotope Filtration: Insight at the Nano-and Microscale. J. Phys. Chem. C 2020, 124, 26864–26873. [Google Scholar] [CrossRef]
  36. Shih, C.-J.; Lin, S.; Sharma, R.; Strano, M.S.; Blankschtein, D. Understanding the pH-Dependent Behavior of Graphene Oxide Aqueous Solutions: A Comparative Experimental and Molecular Dynamics Simulation Study. Langmuir 2012, 28, 235–241. [Google Scholar] [CrossRef] [PubMed]
  37. Liu, Y.; Xu, Z. Multimodal and Self-Healable Interfaces Enable Strong and Tough Graphene-Derived Materials. J. Mech. Phys. Solids. 2014, 70, 30–41. [Google Scholar] [CrossRef]
Figure 1. (a) shows the intermediate process of GO membranes formation using the deposition method, with the ns value of 1 in each GO block; (b) is cross-sectional TEM images of ultrathin GO membranes [12]; (c) is a side-view schematic diagram of a GO membrane model; (d) is the SEM images of GO membranes [12]; (e) illustrates the top-view experimental diagram of GO membranes. The red circles represent the structural defects of the GO membrane prepared by experiment. The red squares represent the nanopores in the GO membrane model, which serve as channels for gas transport. Reprinted with permission from Ref. [12]. Copyright, 2013, the American Association for the Advancement of Science.
Processes 11 01520 g001
Figure 2. (a) shows the relationship between the α and the boxl/bl; (b) shows the relationship between the α and the lb. The two green lines in the panel indicate the average coverage of 0.15 and 0.075 from top to bottom, respectively. The initial decrease of α is indicated by arrow and dashed squares. The layer number of GO blocks in each model is represented by the horizontal coordinate of the intersection of 0.075 and the image; (c) shows the probability distribution of the occurrence of the lb of the GO membrane model for the same nb. The final number of lb is taken as the average of multiple simulations.
Processes 11 01520 g002
Figure 3. The GO flake collapses in (a) the single-lap and (b) the bilayer-lap channels and the gh changes abruptly, respectively.
Processes 11 01520 g003
Figure 4. The gh (a) and density of the GO block material (b) as functions of oxidation concentrations.
Processes 11 01520 g004
Figure 5. (a) displays the exponential relationship between the lb and the porosity of the deposition model; (b) presents a comparison and verification of the gas permeation capacity of the GO membranes as a function of the GO block layer thickness in this study, with the experimental results reported in the literature [13,14].
Processes 11 01520 g005
Figure 6. (a) shows the representative nanopores generated by the deposition model; (b) shows the variation of porosity with different lb and boxl/bl; (c) exhibits the distribution of nanopores with different sizes upon subdividing the nanopores at lb = 35.
Processes 11 01520 g006
Figure 7. When the thickness of the membranes is certain, the sizes of different GO flakes affect the area contributed by the nanopores to the filtration of particles of different sizes.
Processes 11 01520 g007
Figure 8. (a,b) show a schematic diagram of the preparation process of the GO membranes using cylinders placed on a substrate to control the size of nanopores. D represents the diameter dimension of the cylinder; (c,d) are the top view and side view schematic diagrams of the GO membranes filtration process for large-size particles, respectively.
Processes 11 01520 g008
Table 1. The meaning of the abbreviations of the variables in the text.
Abbreviation of the VariableMeans
boxlBox length
boxwBox width
blGO block length
bwGO block width
bhGO block height
nbNumber of GO block
nsNumber of the flake in the GO block
lbLayer number of GO block
lgThe number of layers in the GO block
lblThe number of layer where the GO block is located
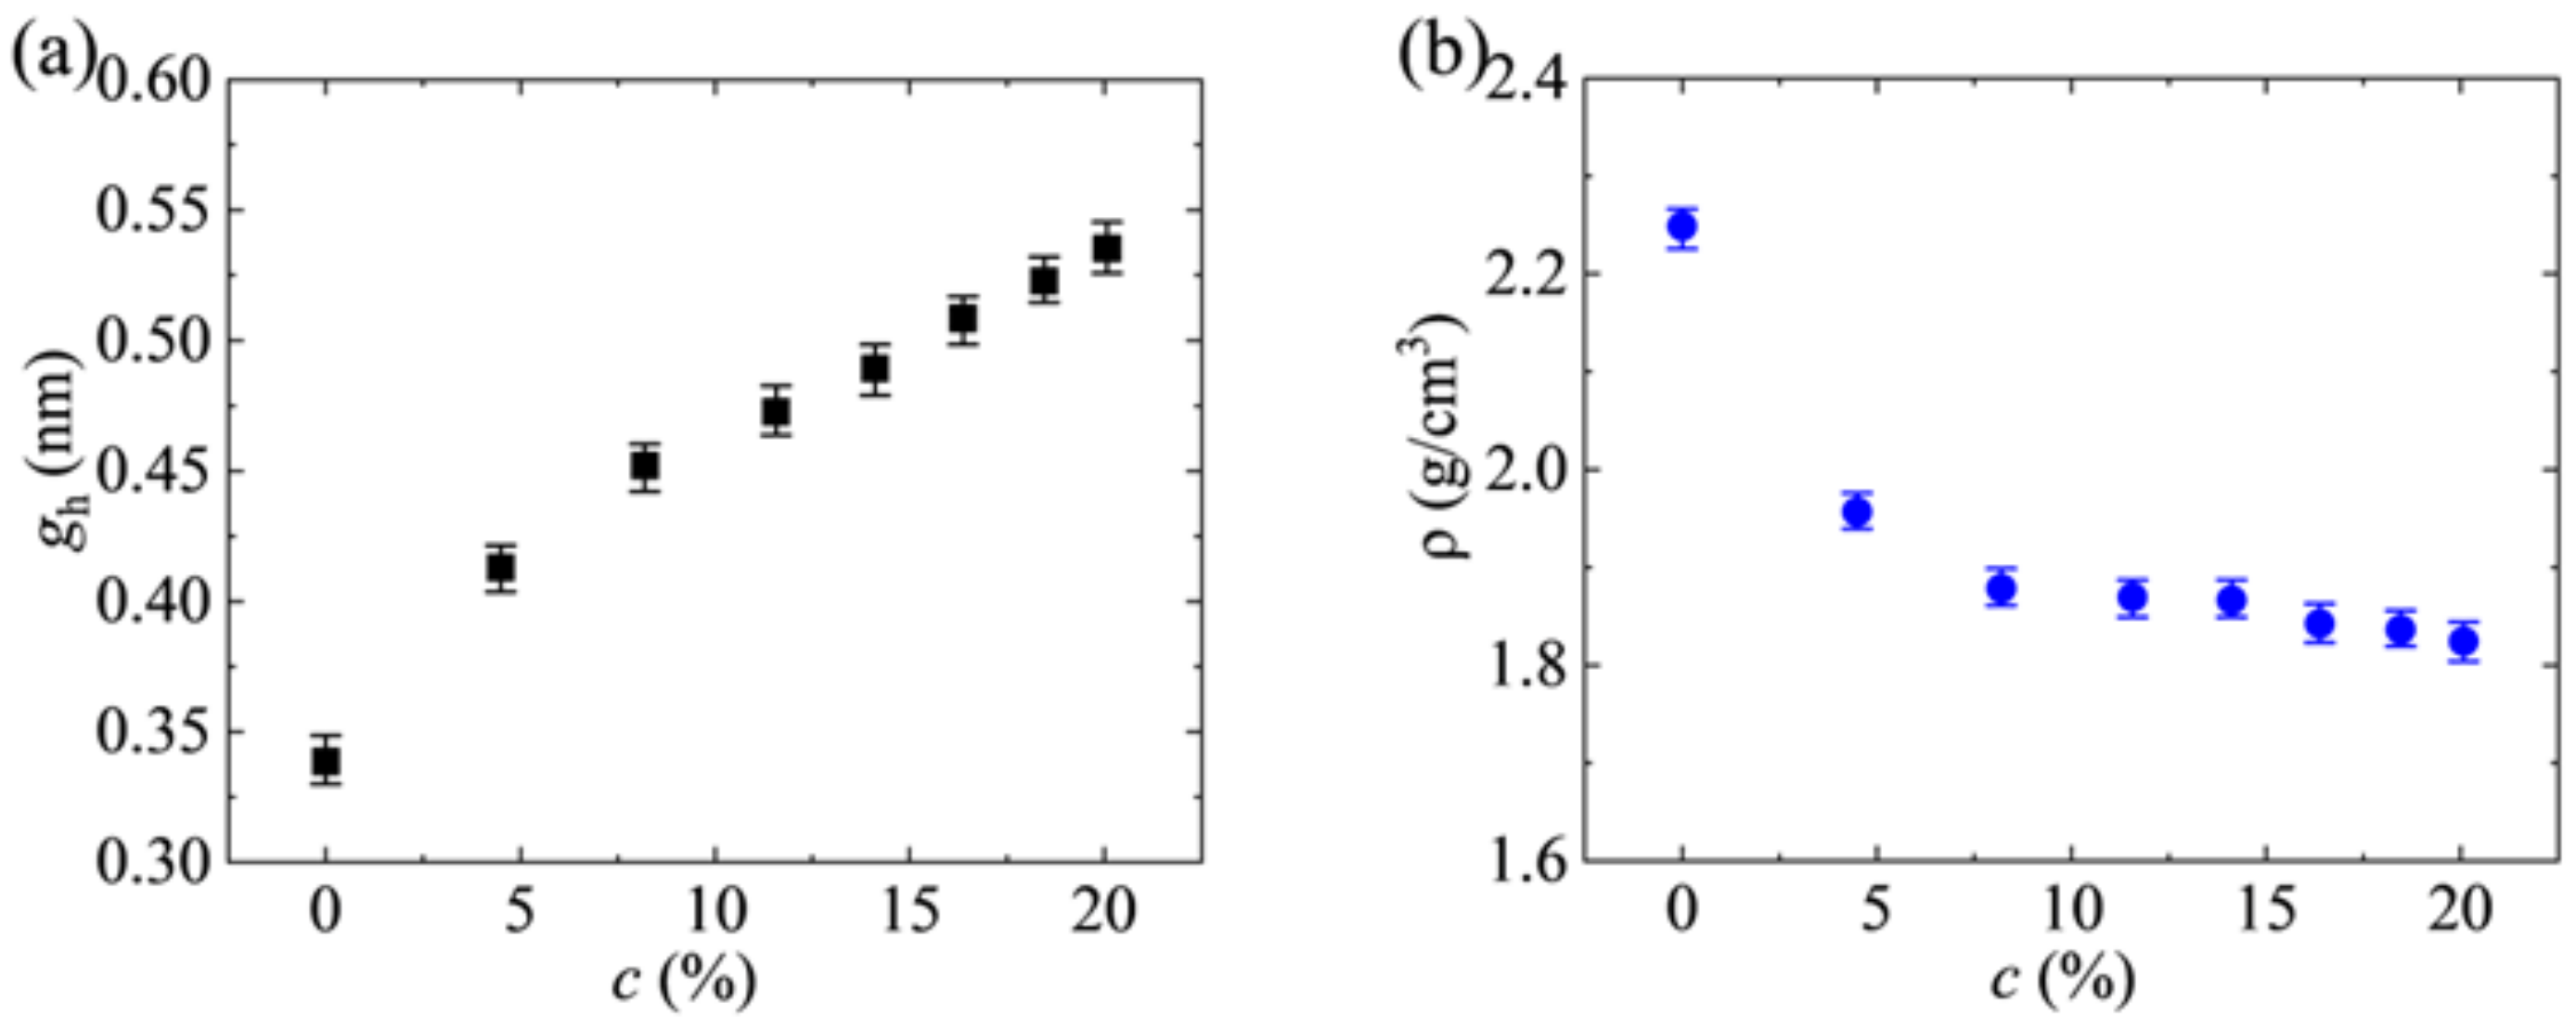
ghInterlayer spacing of GO flakes
αThe average coverage of GO blocks in each layer
cOxidation concentration of GO flakes
Table 2. Sizes of some particles.
ParticleParticle Size (μm)
Viruses0.005–0.2
Tobacco smoke0.01–1
Dust0.01–100
Bacteria0.05–40
Fungus debris and spores0.7–80
Human skin cells1–25
Pollens10–100
Hair17–100
Sand80–750
Disclaimer/Publisher’s Note: The statements, opinions and data contained in all publications are solely those of the individual author(s) and contributor(s) and not of MDPI and/or the editor(s). MDPI and/or the editor(s) disclaim responsibility for any injury to people or property resulting from any ideas, methods, instructions or products referred to in the content.

