


Study on the Hydraulic Characteristics of an Eccentric Tapering Outlet Pressure Box Culvert in a Pumping Station

Abstract
:1. Introduction
2. Physical Model Test and Numerical Simulation
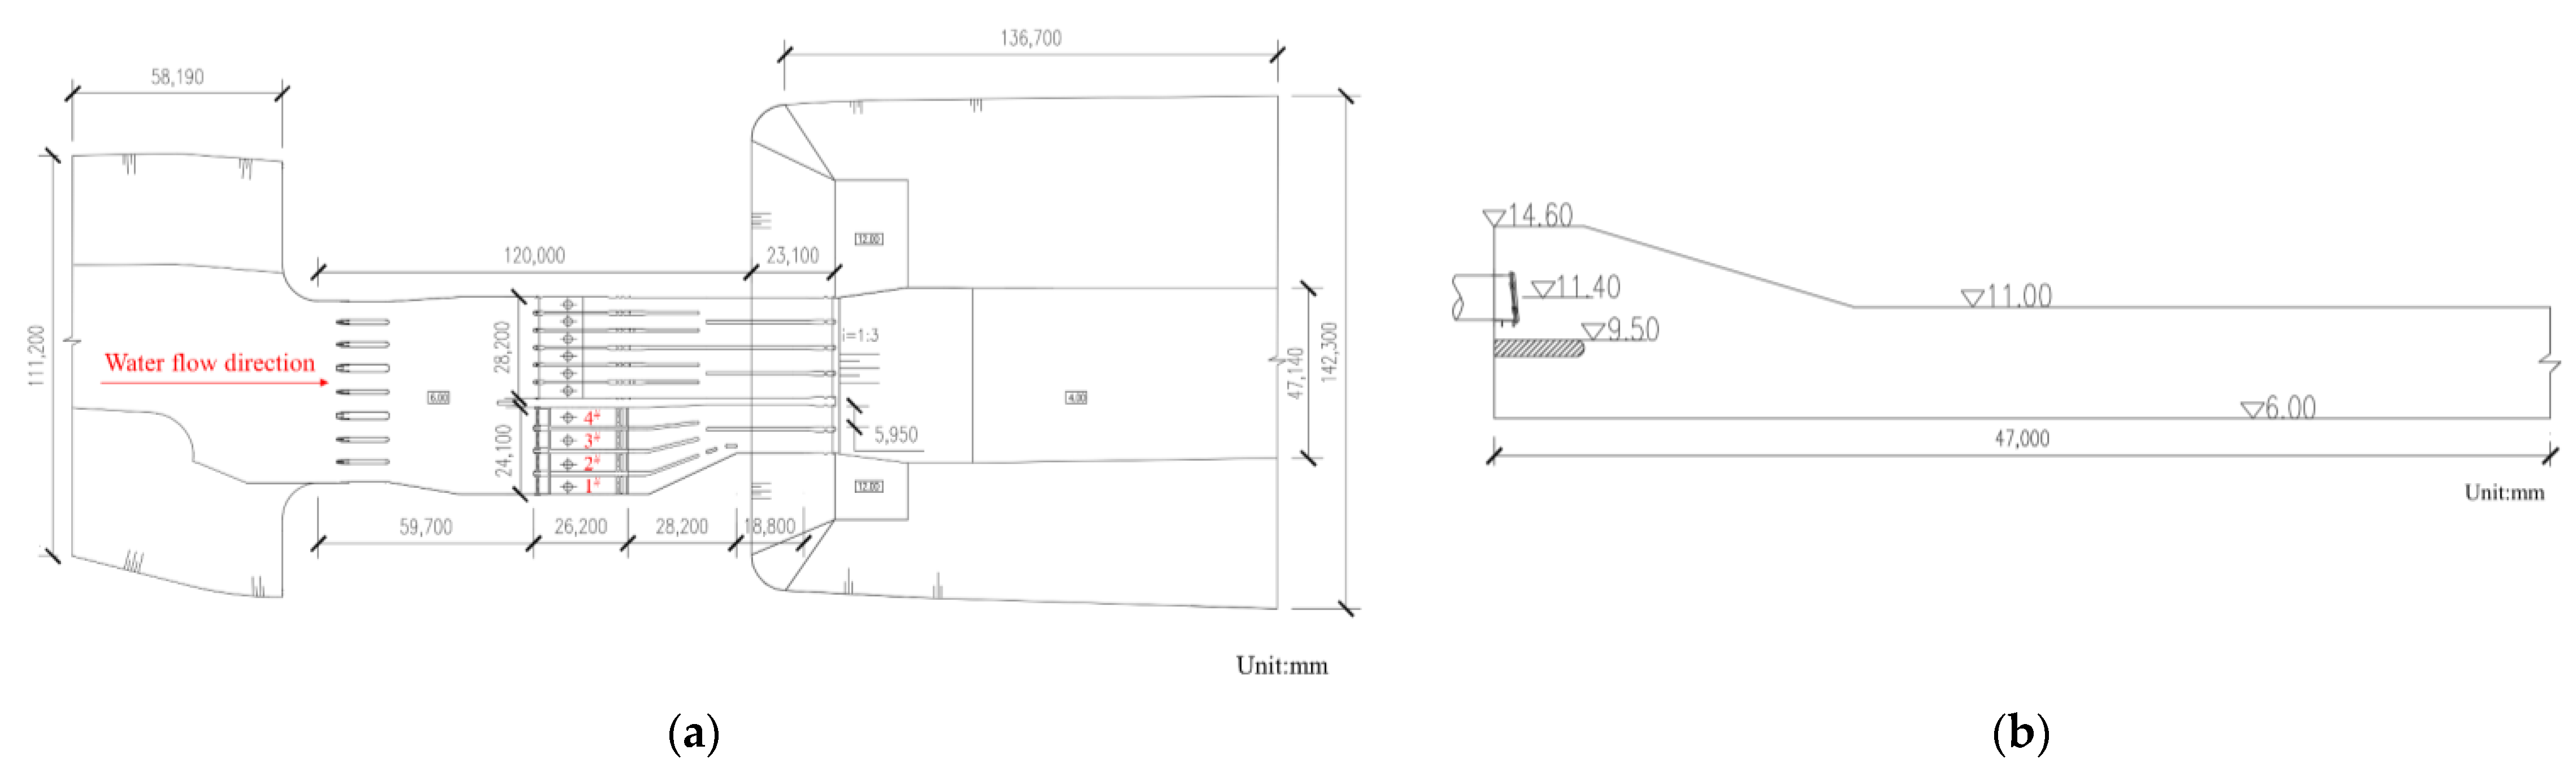
2.1. Project Overview
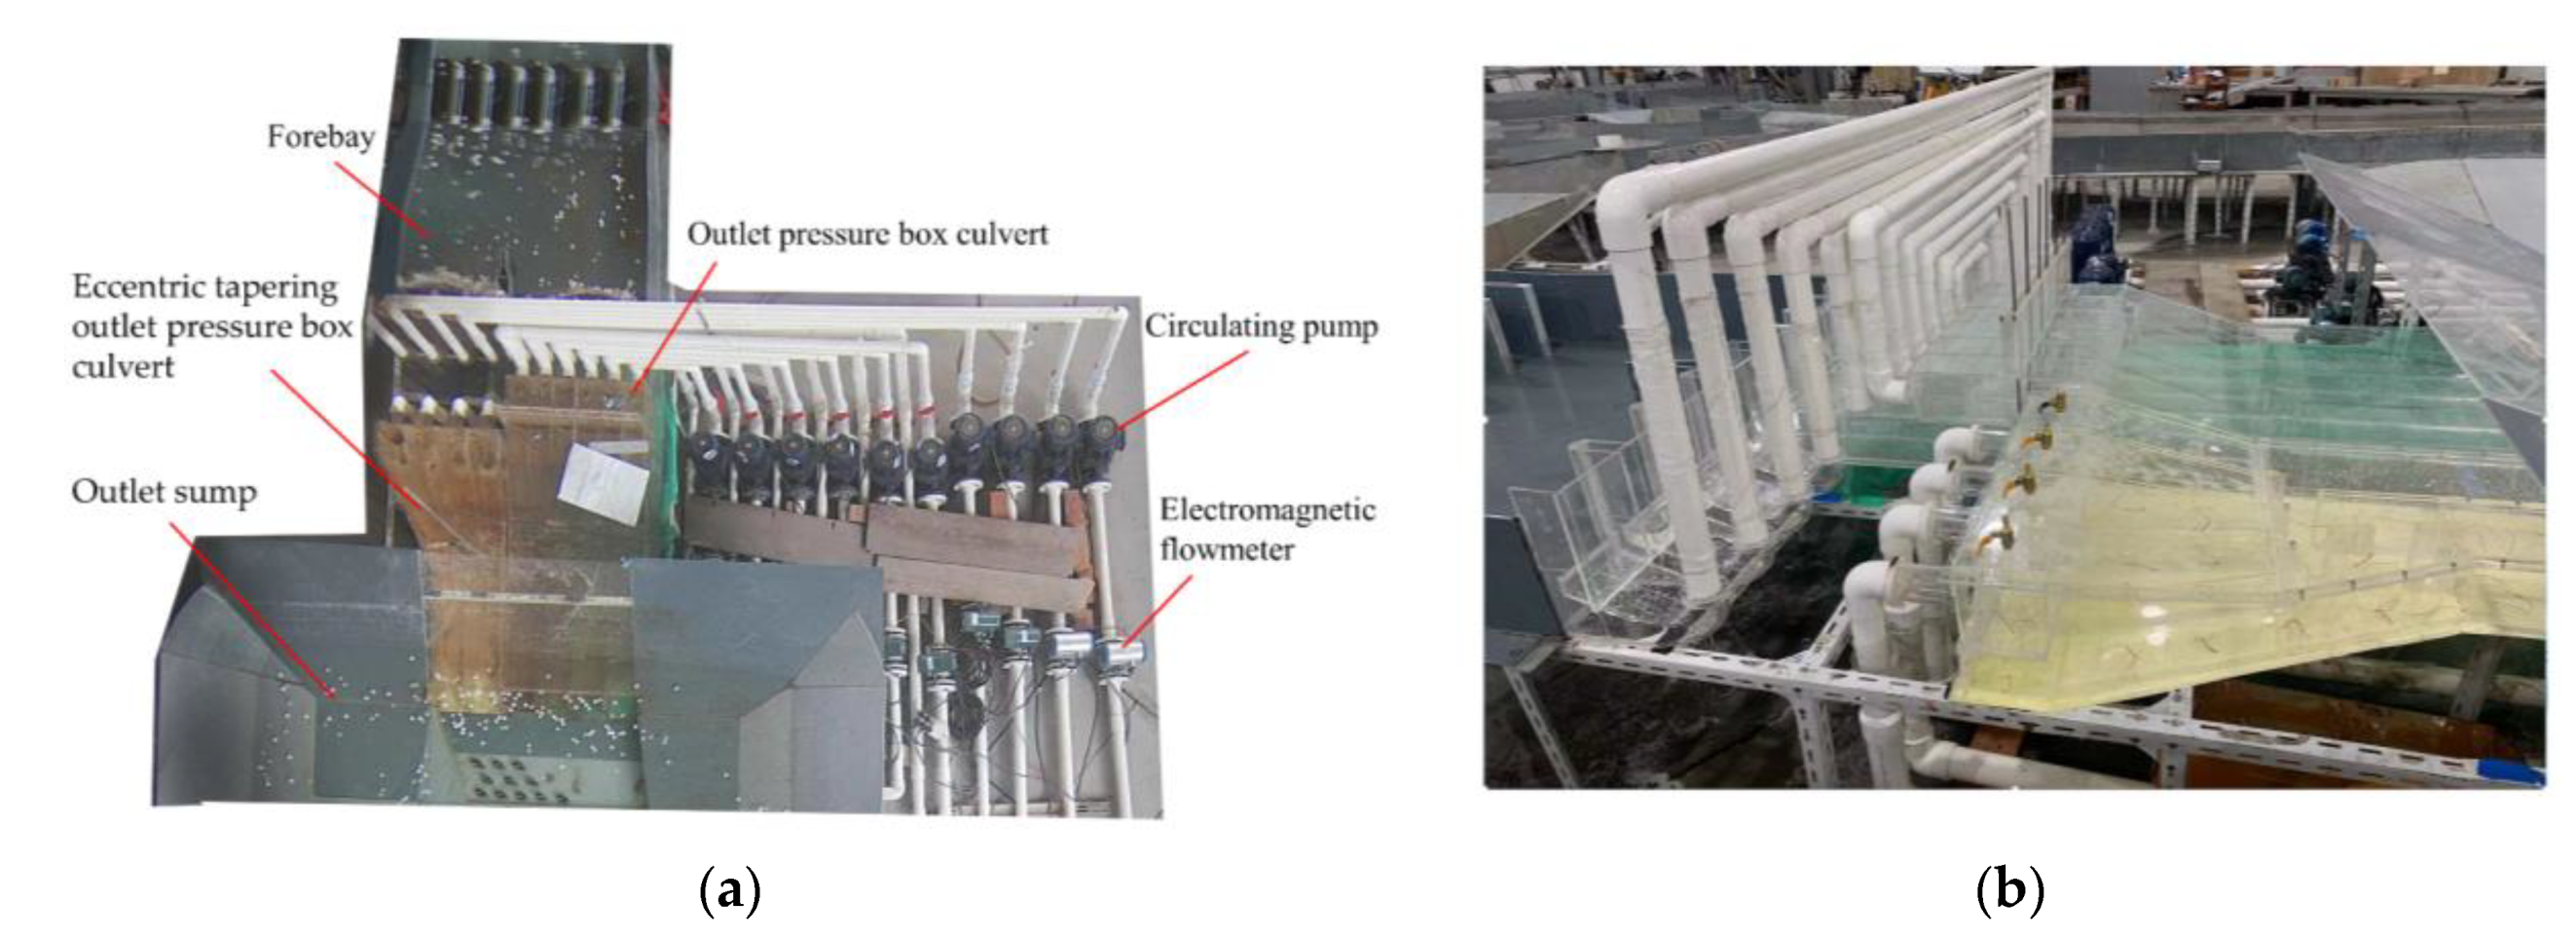
2.2. Physical Model
2.2.1. Similarity Criterion
2.2.2. Model Layout
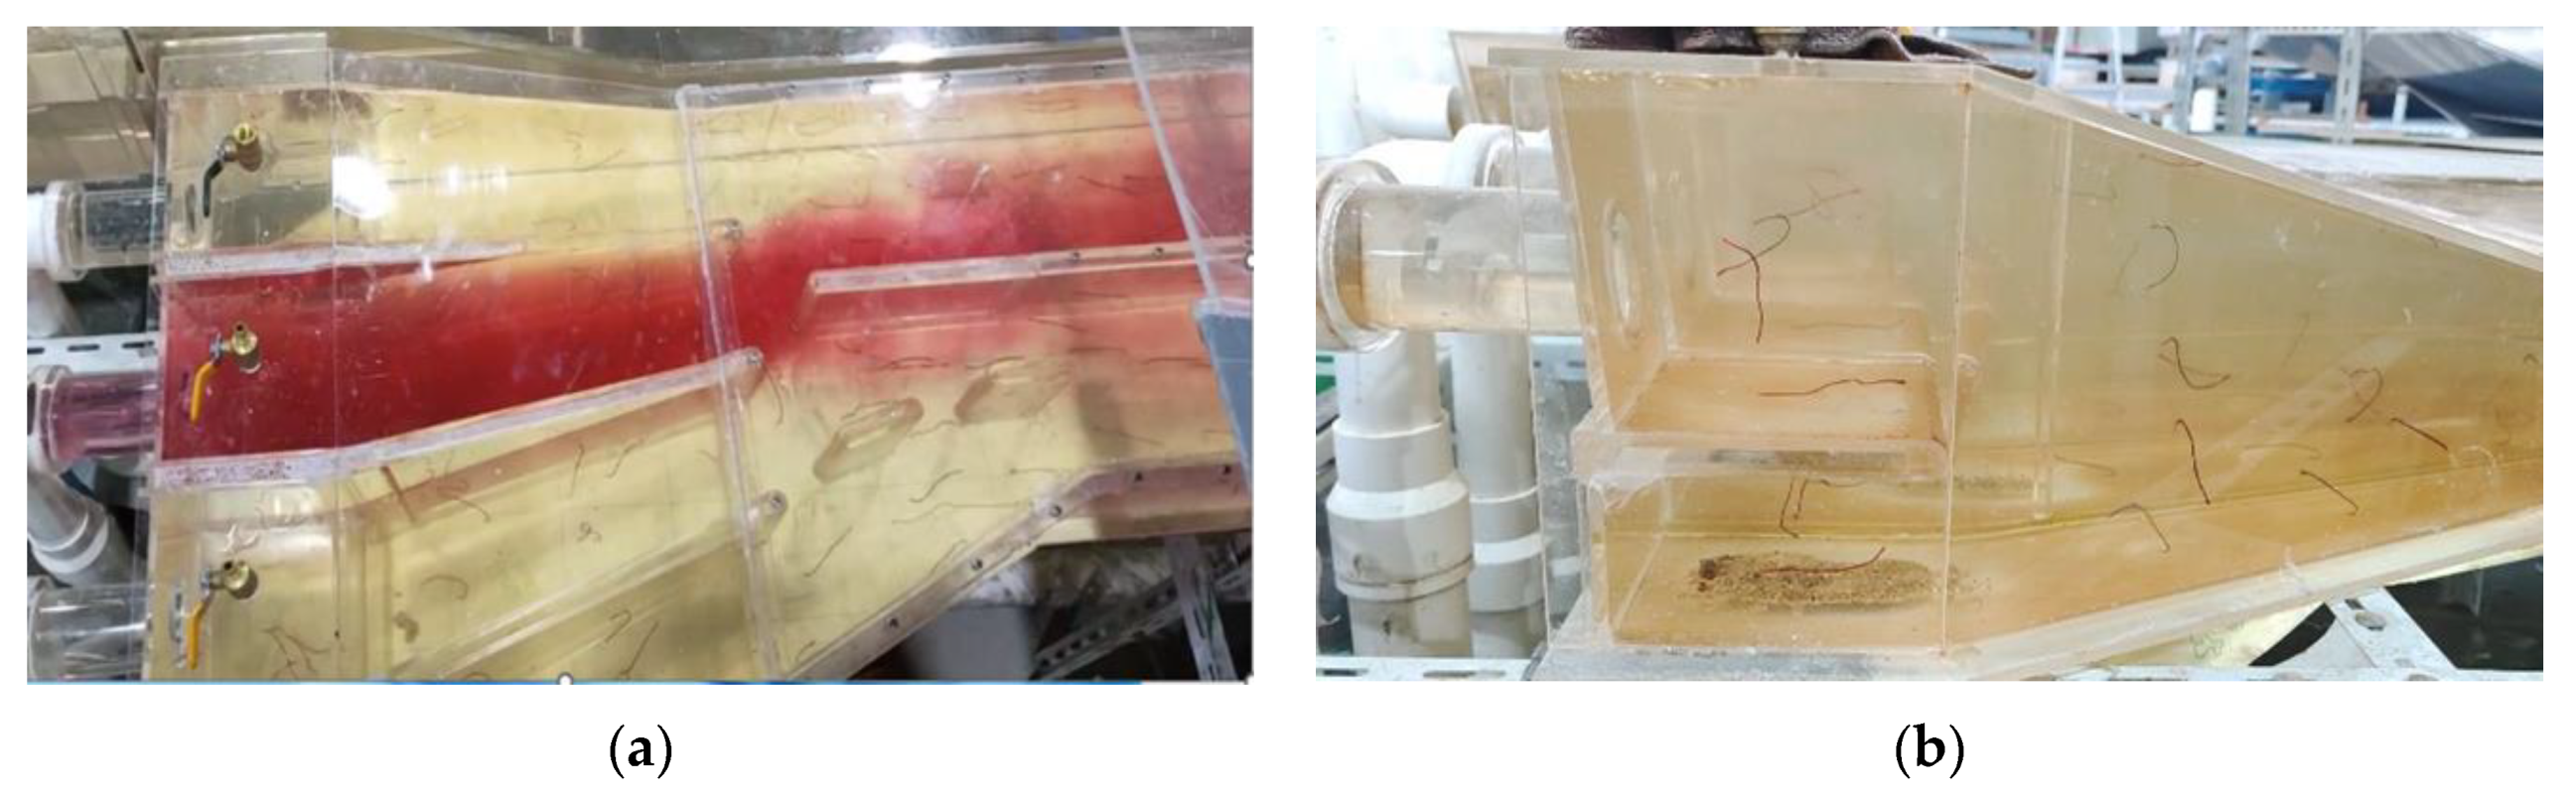
2.2.3. Flow Pattern Study
2.3. Numerical Simulation
2.3.1. Geometric Model
2.3.2. Governing Equations and Turbulent Flow Models
2.3.3. Grid Independence Analysis
2.3.4. Convergence of Grid
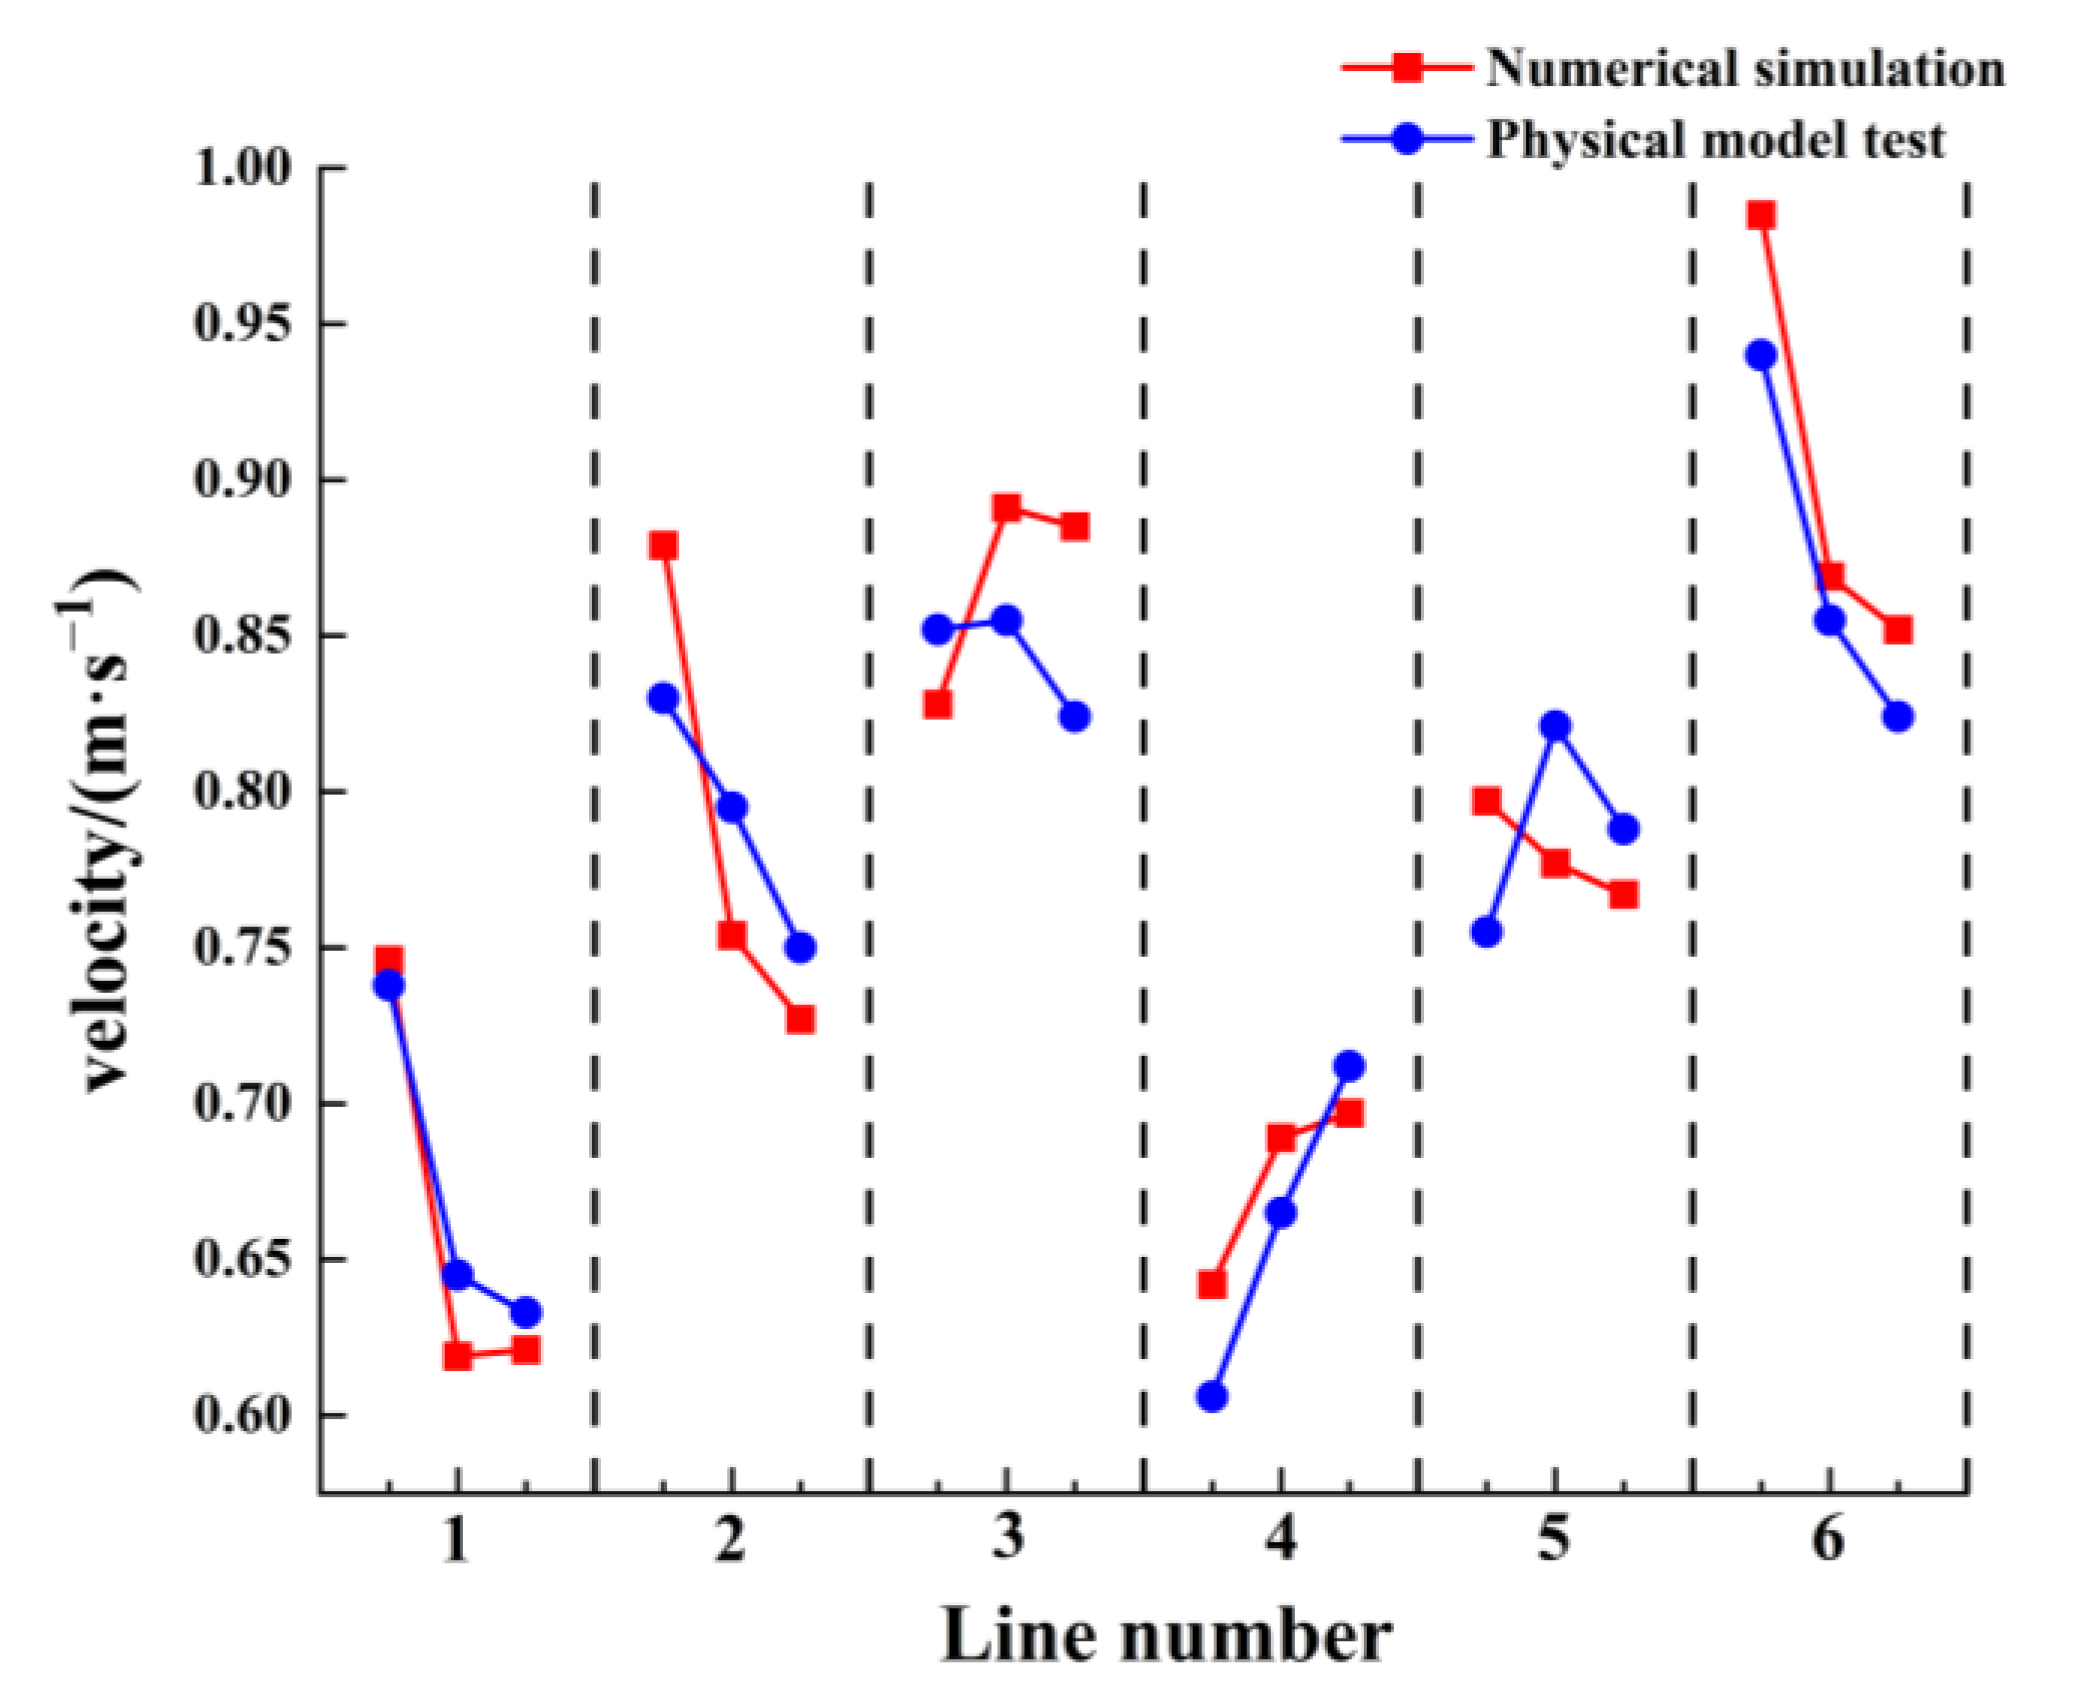
2.4. Numerical Simulation Reliability Verification
3. Analysis and Discussion
3.1. Optimization Scheme Design
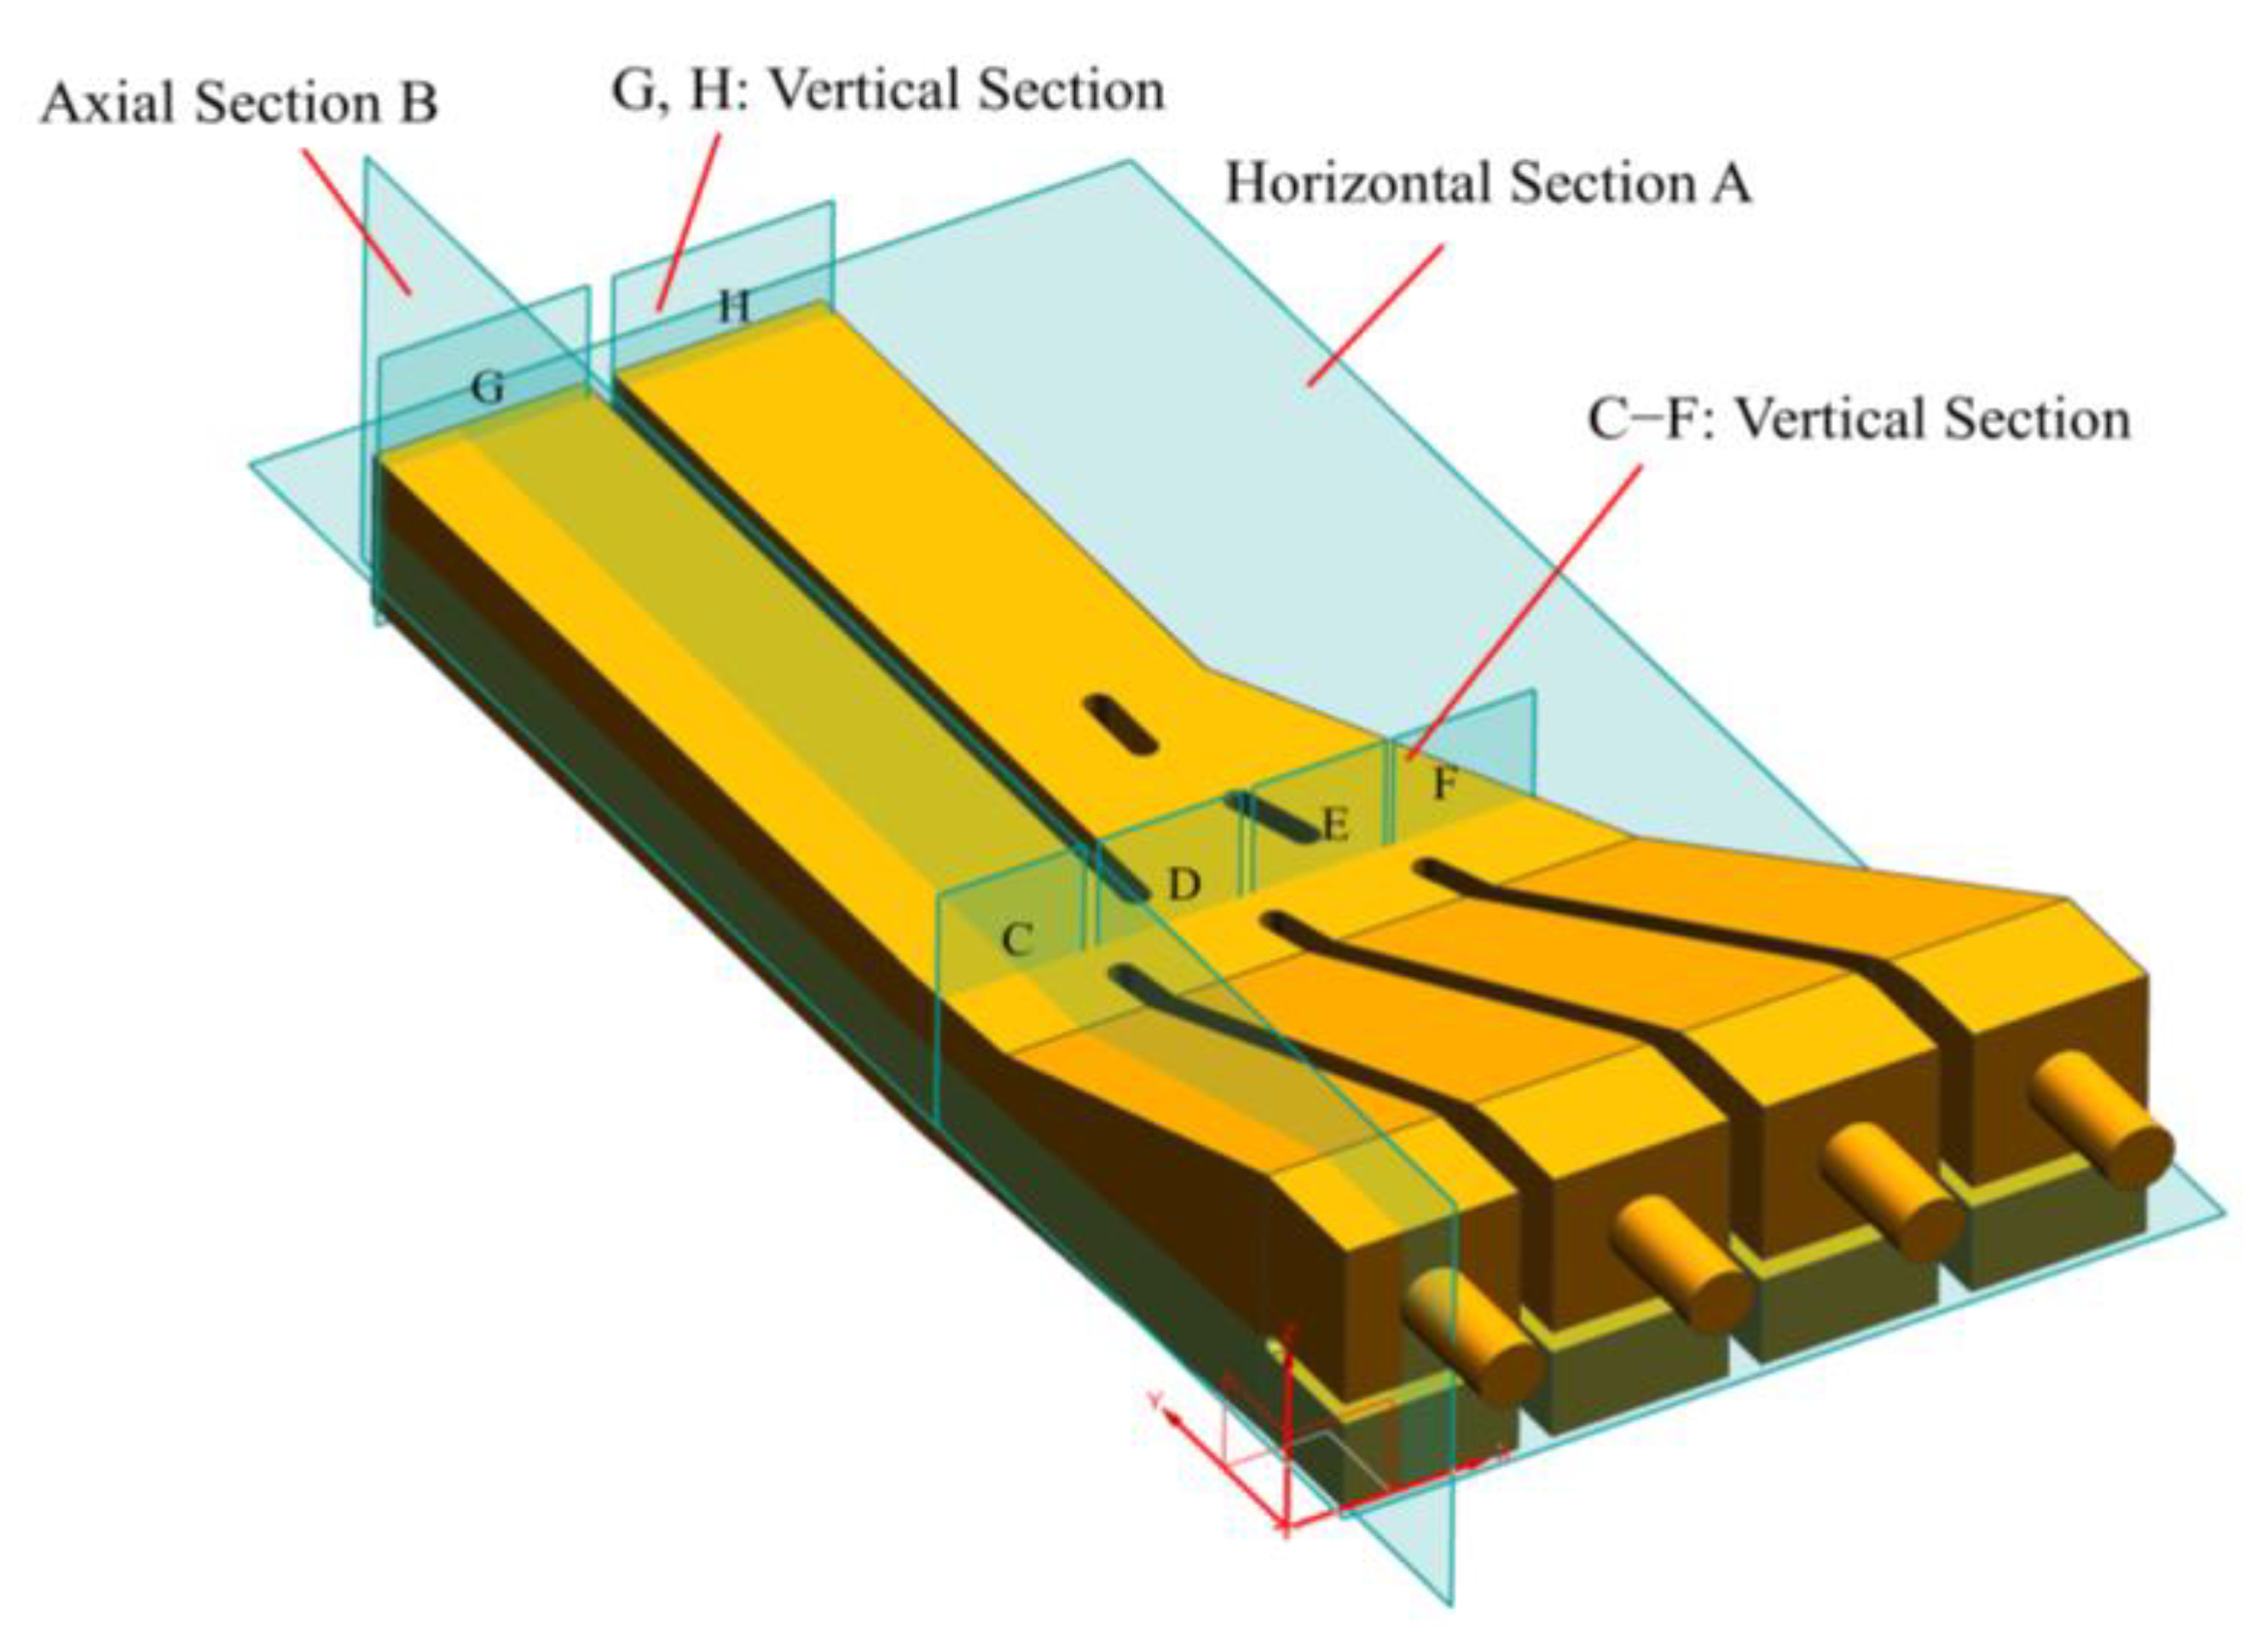
3.2. Characteristic Section Arrangement
3.3. Hydraulic Characteristic Analysis
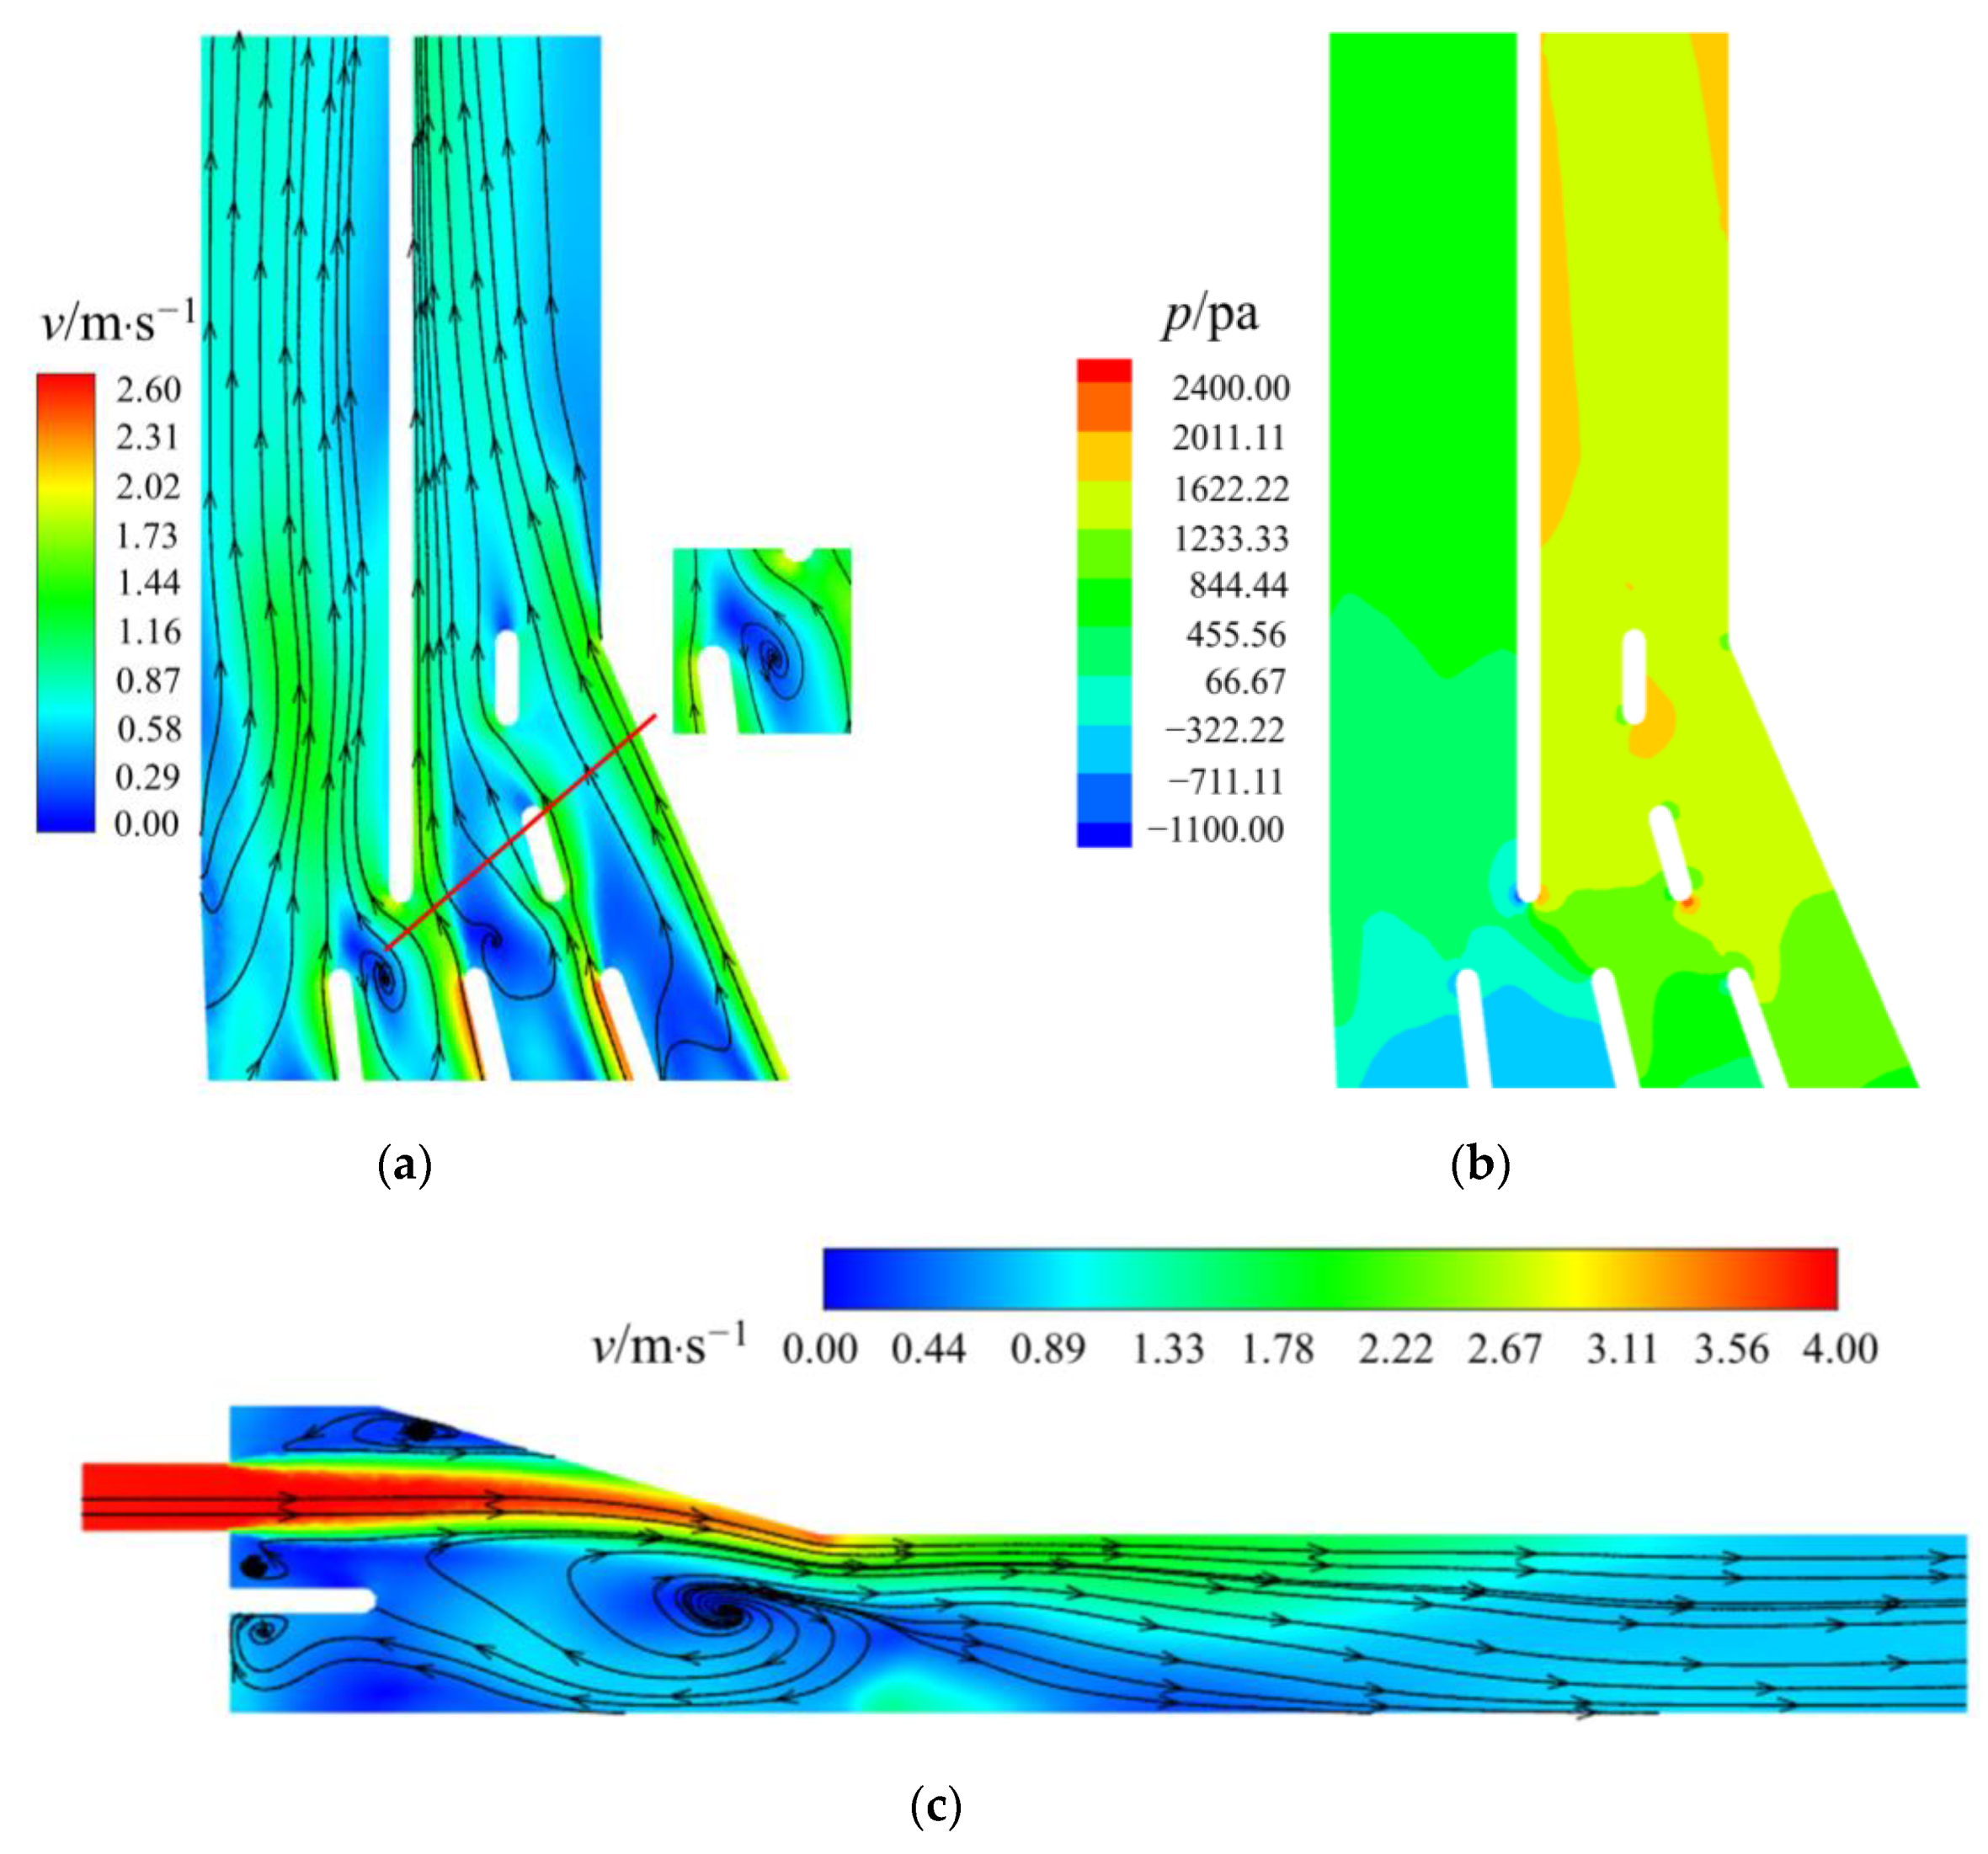
3.3.1. Original Scheme
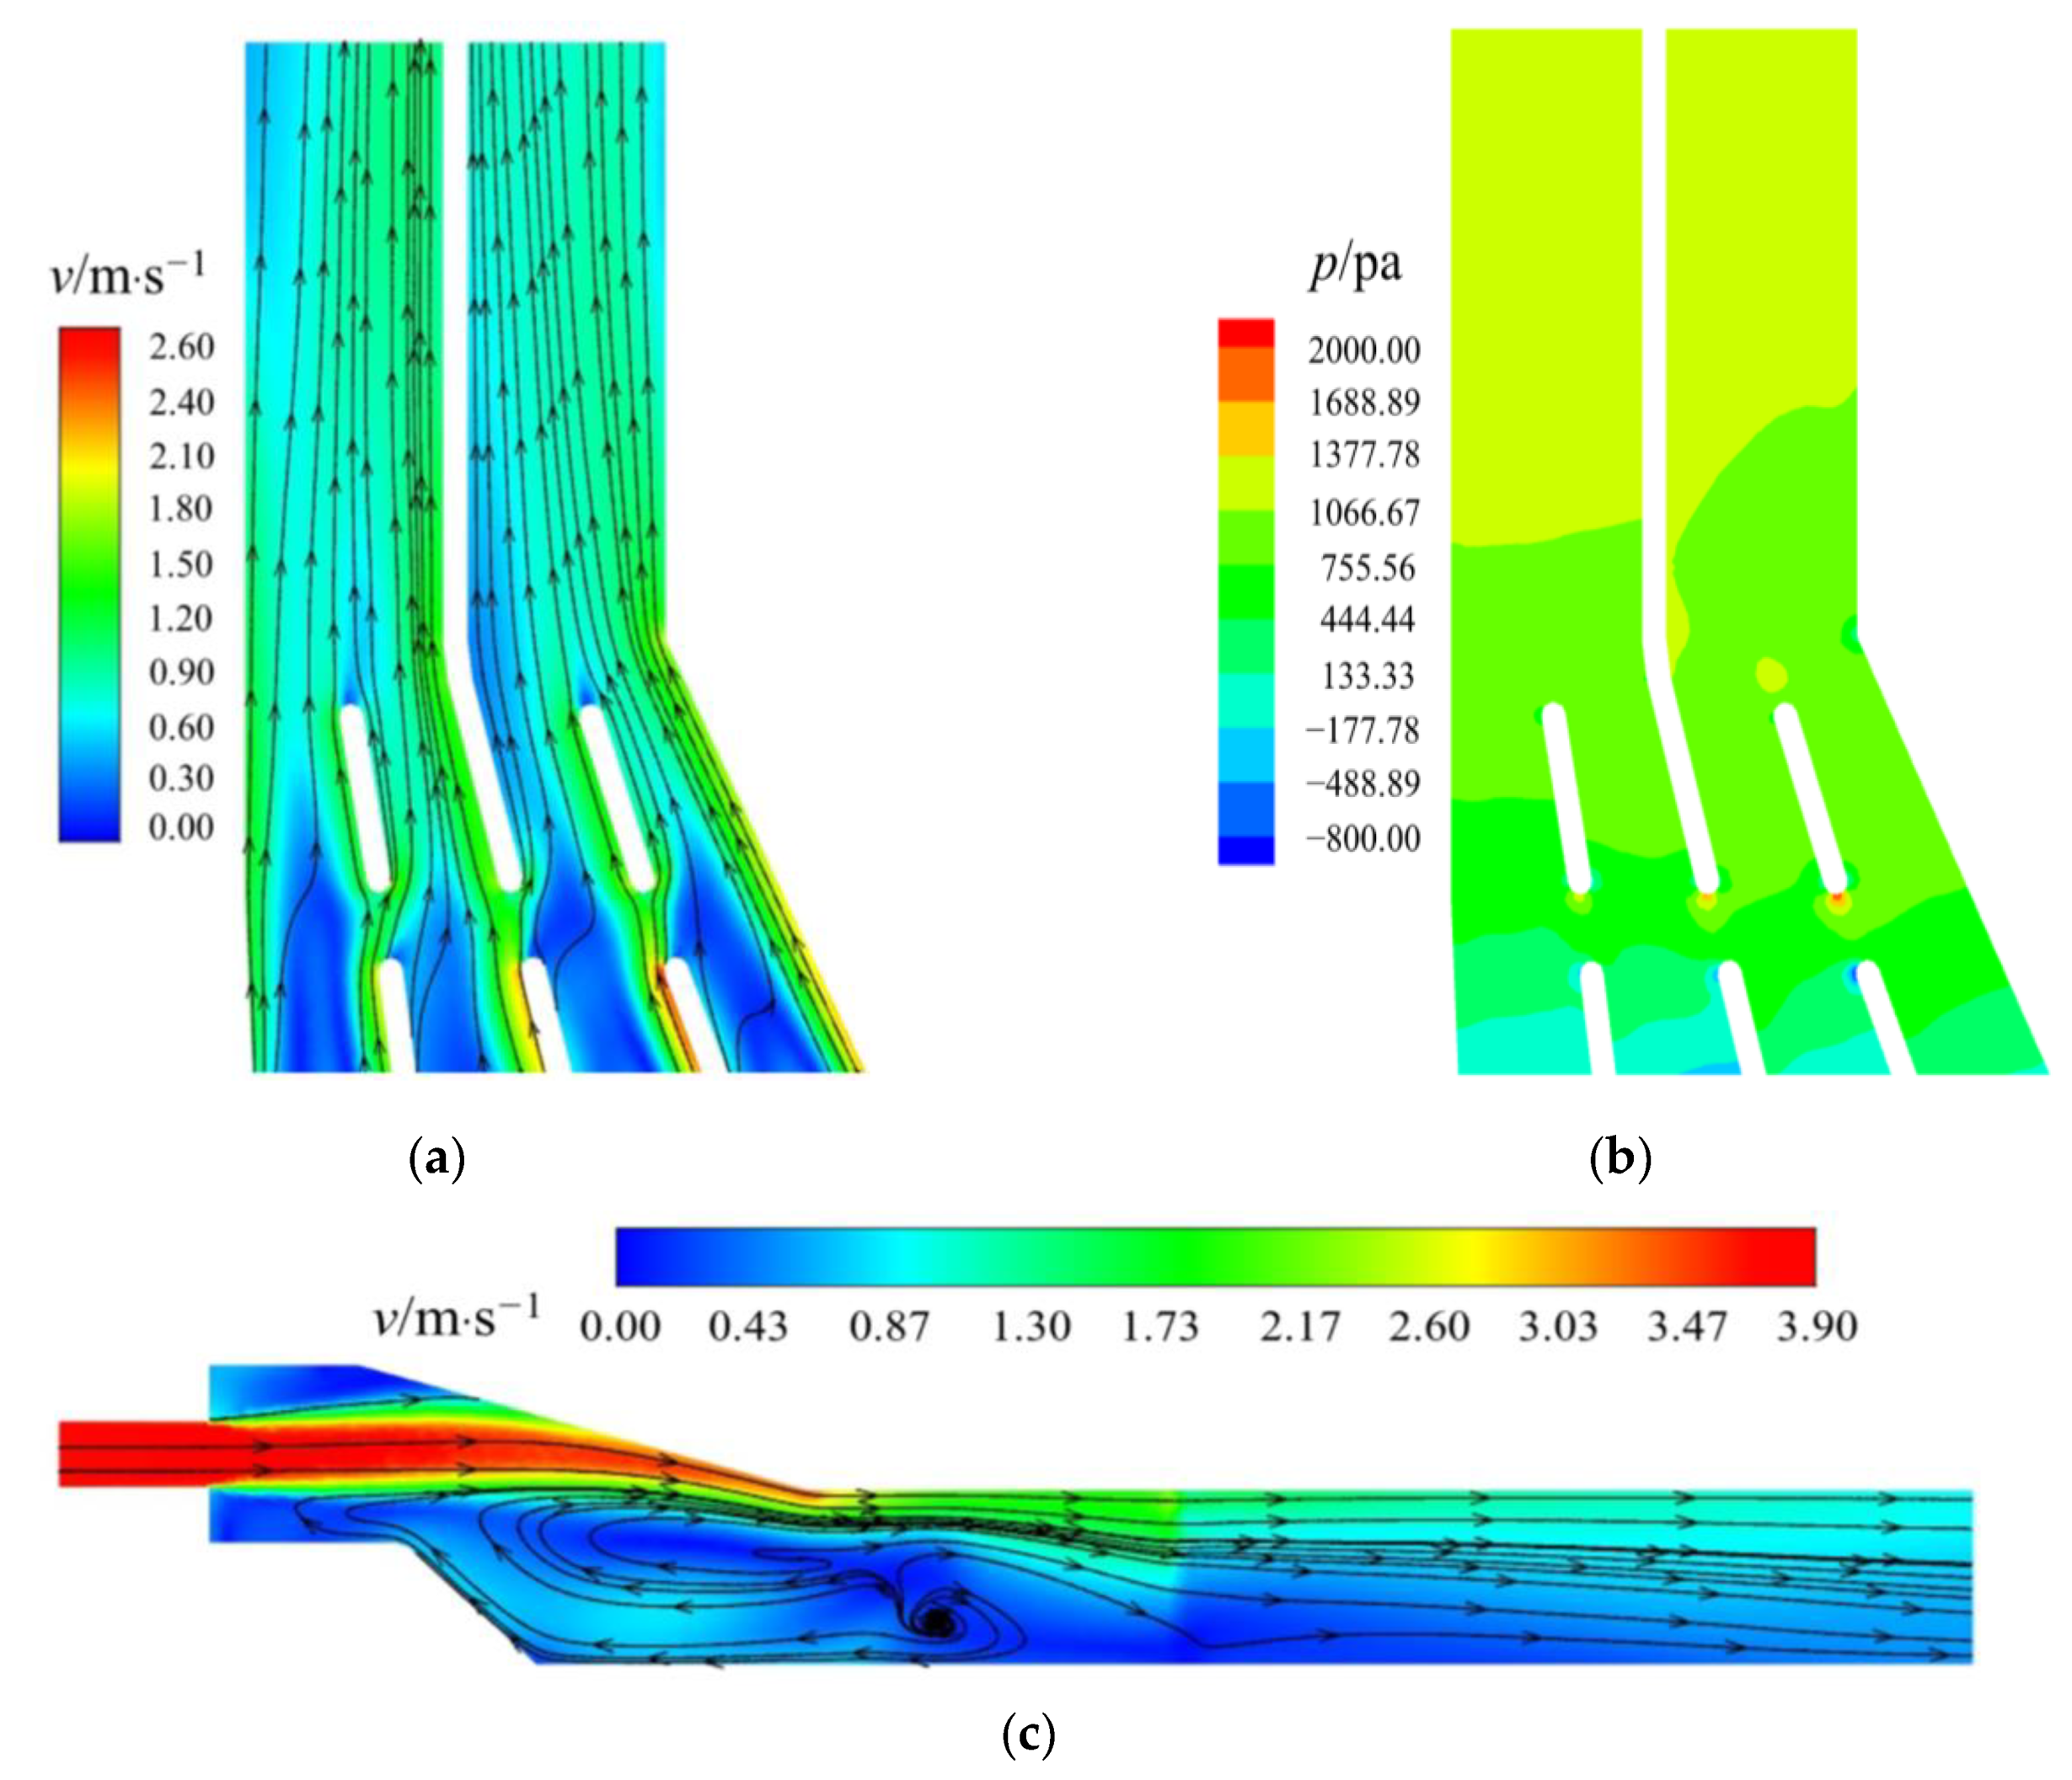
3.3.2. Optimization Scheme 1
3.3.3. Optimization Scheme 2
3.4. Quantitative Evaluation of Optimization Effect
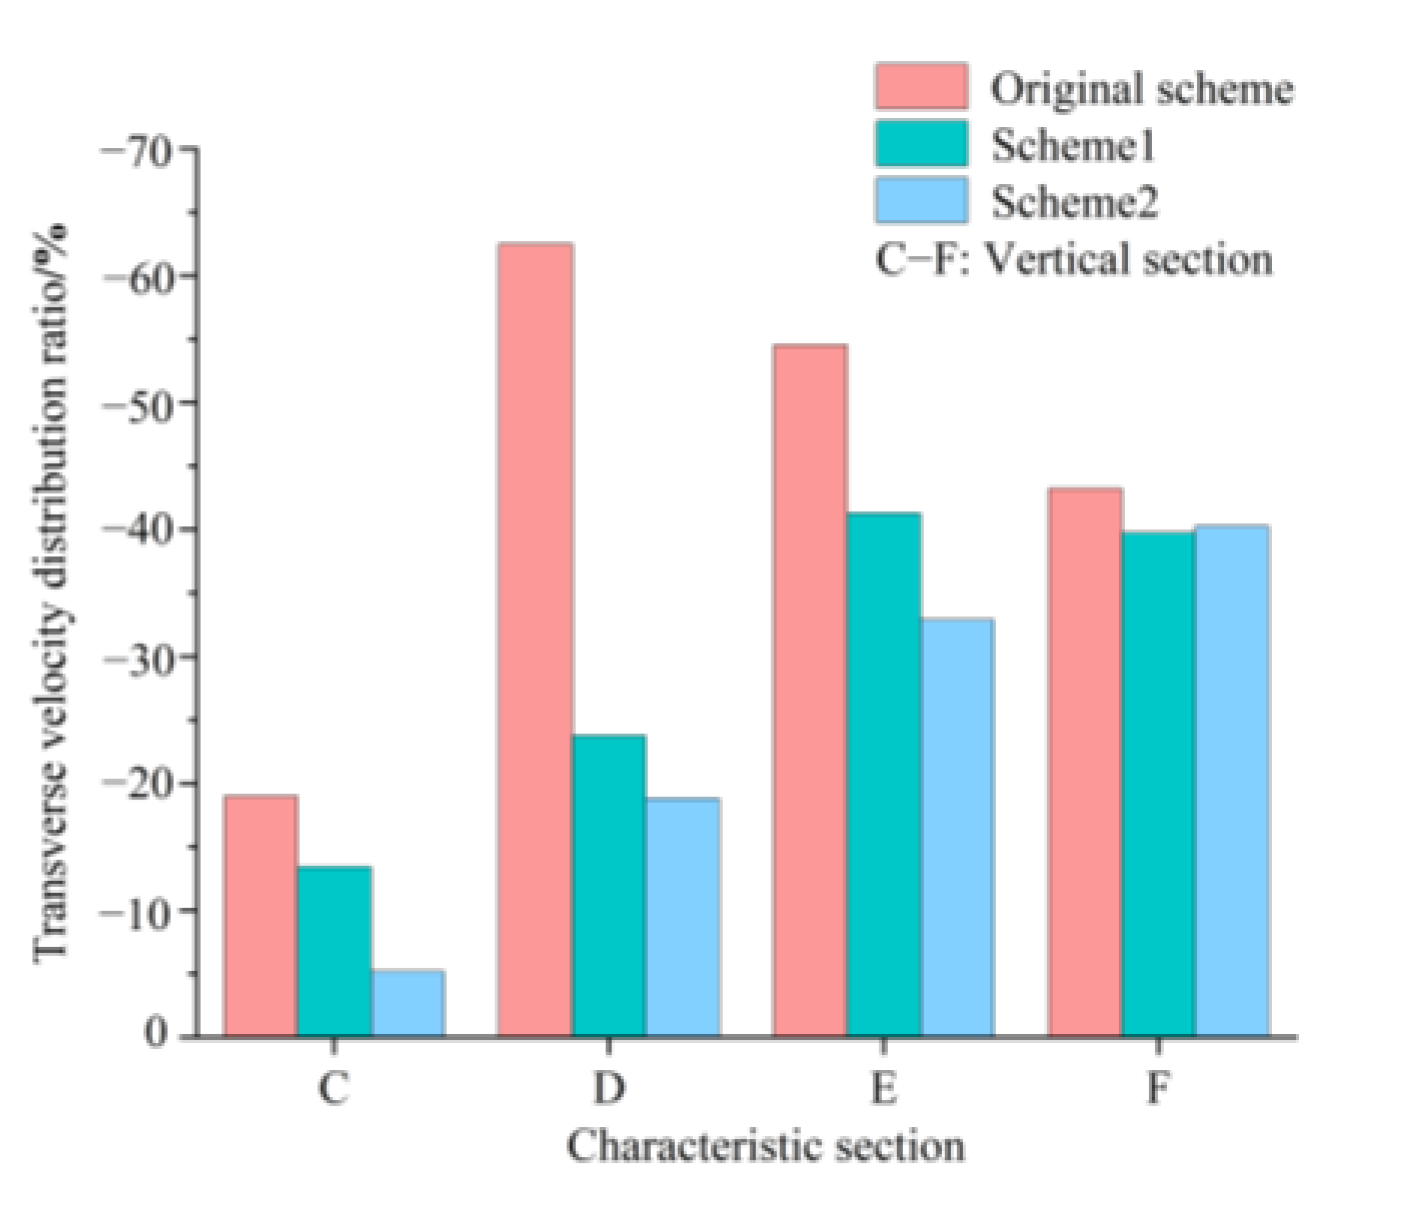
3.4.1. Transverse Velocity Distribution Ratio
3.4.2. Average Angle of the Axial Velocity and Axial Velocity Uniformity
3.4.3. Pressure Distribution
3.5. The Best Scheme
4. Conclusions
- (1)
- In the absence of optimization measures, there are adverse flow patterns, such as bias flow, reflux, and flow separation, inside the eccentric tapering outlet pressure box culvert, which will increase the head loss and affect the outlet efficiency of the pumping station;
- (2)
- All the optimization schemes can improve the flow pattern of the eccentric tapering outlet pressure box culvert. Among them, the combination scheme of “diversion pier position and angle with deflecting flow baseplate” has the best optimization effect, as it significantly improves the bad flow pattern and makes the outlet velocity distribution uniform. The transverse velocity distribution ratio was reduced, especially on the characteristic section D, which was reduced by 43.68%. The axial velocity uniformity and the average angle of the axial velocity were increased by 14.97% and 7.39° on average. The pressure distribution was more uniform, and the minimum pressure difference on both sides of the long diversion pier was reduced to 21.21 Pa;
- (3)
- It is of great significance to synthesize evaluation indexes for the optimization of hydraulic structure. The evaluation indexes proposed in this paper has guiding significance for the analysis of hydraulic characteristics in hydraulic engineering and the comparison and selection of optimal schemes. In particular, it provides optimization schemes and new evaluation indexes for the optimization of eccentric tapering outlet pressure box culvert in the expanded pumping station. In view of the advantages of the new optimization scheme and evaluation index, it is worth further promotion and consideration;
- (4)
- Our research illustrates that the combination scheme of “diversion pier position and angle with deflecting flow baseplate” is an effective scheme to improve the bad flow pattern when the four units are running at the same time. However, it should be noted that the current research is only based on limited conditions. In the future, in-depth researches can be carried out for different unit operating conditions to ensure that there will still be no bad flow patterns in the box culvert under wider range of conditions. Therefore, the future research focus should be placed on the size and length of diversion pier and deflecting flow baseplate under multiple working conditions.
Author Contributions
Funding
Data Availability Statement
Conflicts of Interest
References
- Kan, K.; Zhang, Q.; Xu, Z.; Chen, H.; Zheng, Y.; Zhou, D.; Binama, M. Study on a horizontal axial flow pump during runaway process with bidirectional operating conditions. Sci. Rep. 2021, 11, 1–21. [Google Scholar] [CrossRef]
- Luo, C.; Du, K.; Qi, W.; Cheng, L.; Huang, X.; Lu, J. Investigation on the effect of the shaft transition form on the inflow pattern and hydrodynamic characteristics of the pre-shaft tubular pump device. Front. Energy Res. 2022, 10, 955492. [Google Scholar] [CrossRef]
- Shi, L.; Zhang, W.; Jiao, H.; Tang, F.; Wang, L.; Sun, D.; Shi, W. Numerical simulation and experimental study on the comparison of the hydraulic characteristics of an axial-flow pump and a full tubular pump. Renew. Energy 2020, 153, 1455–1464. [Google Scholar] [CrossRef]
- Shi, L.; Zhu, J.; Tang, F.; Wang, C. Multi-disciplinary optimization design of axial flow pump impellers based on the approximation model. Energies 2020, 13, 779. [Google Scholar] [CrossRef]
- Yang, F.; Li, Z.; Yuan, Y.; Lin, Z.; Zhou, G.; Ji, Q. Study on vortex flow and pressure fluctuation in dustpan-shaped conduit of a low head axial-flow pump as turbine. Renew. Energy 2022, 196, 856–869. [Google Scholar] [CrossRef]
- Zhou, J.; Zhao, M.; Wang, C.; Gao, Z. Optimal Design of Diversion Piers of Lateral Intake Pumping Station Based on Orthogonal Test. Shock Vib. 2021, 2021, 6616456. [Google Scholar] [CrossRef]
- Zhou, J.; Zhong, Z.; Liang, J.; Shi, X. Three-dimensional Numerical Simulation of Side-intake Forebay of Pumping Station. J. Irrig. Drain. 2015, 34, 52–55. [Google Scholar]
- Zi, D.; Wang, F.; Yao, Z.; Hou, Y.; Yang, E. Effects analysis on rectifying intake flow field for large scale pumping station with combined diversion piers. Trans. Chin. Soc. Agric. Eng. 2015, 31, 71–77. [Google Scholar]
- Song, W.; Pang, Y.; Shi, X.; Xu, Q. Study on the Rectification of Forebay in Pumping Station. Math. Probl. Eng. 2018, 2018, 2876980. [Google Scholar] [CrossRef]
- Can, L.; Chao, L. Numerical simulation and improvement of side-intake characteristics of multi-unit pumping station. J. Hydroelectr. Eng. 2015, 34, 207–214. [Google Scholar]
- Luo, C.; Qian, J.; Liu, C.; Chen, F.; Xu, J.; Zhou, Q. Numerical simulation and test verification on diversion pier rectifying flow in forebay of pumping station for asymmetric combined sluice-pump station project. Trans. Chin. Soc. Agric. Eng. 2015, 31, 100–108. [Google Scholar]
- Kadam, P.; Chavan, D. CFD Analysis of Flow in Pump Sump to Check Suitability for Better Performance of Pump. Int. J. Mech. Eng. Robot. 2013, 1, 59–65. [Google Scholar]
- Zhao, H.; Yang, F.; Liu, C.; Chen, S.; He, J. Numerical simulation of side-intake flow for fluid meliorating of pumping stations. Water Resour. Hydropower Eng. 2017, 48, 79–84. [Google Scholar]
- Zhang, Y.; Song, S.; Chen, Y.; Liu, X.; Fu, X. Numerical Simulation of Rectification Measures for Side-direction Forebay in Pump Station. China Rural Water Hydropower 2016, 5, 117–120. [Google Scholar]
- Chen, H.-X.; Guo, J.-H. Numerical simulation of 3-D turbulent flow in the multi-intakes sump of the pump station. J. Hydrodyn. 2007, 19, 42–47. [Google Scholar] [CrossRef]
- Xia, C.; Cheng, L.; Zhao, G.; Yu, L.; Wu, M.; Xu, W. Numerical simulation of flow pattern in forebay of pump station with single row of square columns. Adv. Sci. Technol. Water Resour. 2017, 37, 53–58. [Google Scholar]
- Nguyen, V.; Vo, T. Centrıfugal Pump Design: An Optimization. Eurasia Proc. Sci. Technol. Eng. Math. 2022, 17, 136–151. [Google Scholar] [CrossRef]
- Chen, Z.; Nguyen, V.; Inagaki, M.; Choi, Y.D. Performance of an Open Ducted Type Very Low Head Cross-Flow Turbine. GMSARN Int. J. 2015, 9, 23–28. [Google Scholar]
- Yang, F.; Zhang, Y.; Liu, C.; Wang, T.; Jiang, D.; Jin, Y. Numerical and Experimental Investigations of Flow Pattern and Anti-Vortex Measures of Forebay in a Multi-Unit Pumping Station. Water 2021, 13, 935. [Google Scholar] [CrossRef]
- Luo, C.; He, Y.; Shang, Y.; Cong, X.; Ding, C.; Cheng, L.; Lei, S. Flow Characteristics and Anti-Vortex in a Pump Station with Laterally Asymmetric Inflow. Processes 2022, 10, 2398. [Google Scholar] [CrossRef]
- Xu, W.; Cheng, L.; Du, K.; Yu, L.; Ge, Y.; Zhang, J. Numerical and Experimental Research on Rectification Measures for a Contraction Diversion Pier in a Pumping Station. J. Mar. Sci. Eng 2022, 10, 1437. [Google Scholar] [CrossRef]
- Nasr, A.; Yang, F.; Zhang, Y.; Wang, T.; Hassan, M. Analysis of the Flow Pattern and Flow Rectification Measures of the Side-Intake Forebay in a Multi-Unit Pumping Station. Water 2021, 13, 2025. [Google Scholar] [CrossRef]
- Zhang, C.; Yan, H.; Jamil, M.T.; Yu, Y. Improvement of the Flow Pattern of a Forebay with a Side-Intake Pumping Station by Diversion Piers Based on Orthogonal Test Method. Water 2022, 14, 2663. [Google Scholar] [CrossRef]
- Ansar, M.; Nakato, T. Experimental study of 3D pump-intake flows with and without cross flow. J. Hydrol. Eng. 2001, 127, 825–834. [Google Scholar] [CrossRef]
- Rajendran, V.; Constantinescu, S.; Patel, V. Experimental validation of numerical model of flow in pump-intake bays. J. Hydraul. Eng. 1999, 125, 1119–1125. [Google Scholar] [CrossRef]
- Caishui, H. Three-dimensional Numerical Analysis of Flow Pattern in Pressure Forebay of Hydropower Station. Procedia Eng. 2012, 28, 128–135. [Google Scholar] [CrossRef]
- Xiao, H.; Wang, J.; Liu, Z.; Liu, W. A consistent SIMPLE algorithm with extra explicit prediction—SIMPLEPC. Int. J. Heat Mass Transf. 2018, 120, 1255–1265. [Google Scholar] [CrossRef]
- Shaheed, R.; Mohammadian, A.; Gildeh, H.K. A comparison of standard k–ε and realizable k–ε turbulence models in curved and confluent channels. Environ. Fluid Mech. 2019, 19, 543–568. [Google Scholar] [CrossRef]
- Xu, B.; Liu, J.; Lu, W. Optimization Design of Y-Shaped Settling Diversion Wall Based on Orthogonal Test. Machines 2022, 10, 91. [Google Scholar] [CrossRef]
- Stern, F.; Wilson, R.V.; Coleman, H.W.; Paterson, E.G. Comprehensive Approach to Verification and Validation of CFD Simulations—Part 1: Methodology and Procedures. J. Fluid Mech. 2001, 123, 792. [Google Scholar] [CrossRef]
- Savage, B.M.; Crookston, B.M.; Paxson, G.S. Physical and Numerical Modeling of Large Headwater Ratios for a 15 Labyrinth Spillway. J. Hydraul. Eng. 2016, 142, 04016046. [Google Scholar] [CrossRef]
- Liu, H.; Liu, M.; Bai, Y.; Du, H.; Dong, L. Grid convergence based on GCI for centrifugal pump. J. Jiangsu Univ. 2014, 35, 279–283. [Google Scholar]


| Total Number of Grid Points | ||||
|---|---|---|---|---|
| 563,013 | 0.790 | |||
| 843,844 | 1.250 | 0.782 | 1.013 | 1.131 |
| 1,628,496 | 1.333 | 0.777 | 0.639 | 0.497 |
| Scheme | Optimization Measure | Dimension | |
|---|---|---|---|
| 0 | Original scheme |  | 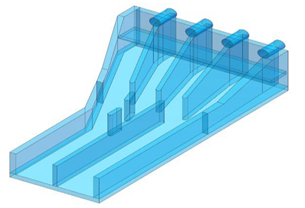 |
| 1 | Position and angle of diversion pier | 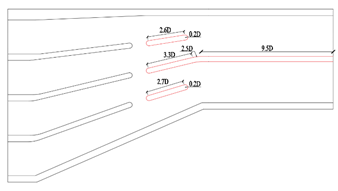 | 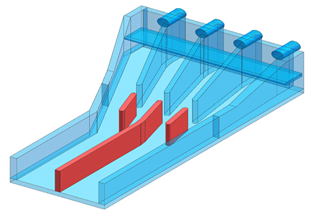 |
| 2 | Deflecting flow baseplate |  | 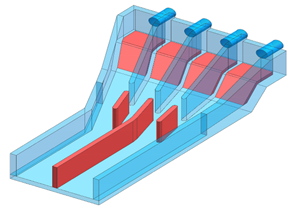 |
| Scheme | Section G | Section H | ||
|---|---|---|---|---|
| Original scheme | 69.70 | 78.38 | 68.60 | 80.18 |
| Scheme 1 | 79.51 | 84.41 | 80.04 | 81.34 |
| Scheme 2 | 87.15 | 86.61 | 81.09 | 86.73 |
Disclaimer/Publisher’s Note: The statements, opinions and data contained in all publications are solely those of the individual author(s) and contributor(s) and not of MDPI and/or the editor(s). MDPI and/or the editor(s) disclaim responsibility for any injury to people or property resulting from any ideas, methods, instructions or products referred to in the content. |
© 2023 by the authors. Licensee MDPI, Basel, Switzerland. This article is an open access article distributed under the terms and conditions of the Creative Commons Attribution (CC BY) license (https://creativecommons.org/licenses/by/4.0/).
Share and Cite
Chen, Y.-X.; Xi, B.; Chen, Z.; Shen, S. Study on the Hydraulic Characteristics of an Eccentric Tapering Outlet Pressure Box Culvert in a Pumping Station. Processes 2023, 11, 1598. https://doi.org/10.3390/pr11061598
Chen Y-X, Xi B, Chen Z, Shen S. Study on the Hydraulic Characteristics of an Eccentric Tapering Outlet Pressure Box Culvert in a Pumping Station. Processes. 2023; 11(6):1598. https://doi.org/10.3390/pr11061598
Chicago/Turabian StyleChen, Ye-Xin, Bin Xi, Zhigang Chen, and Shixuan Shen. 2023. "Study on the Hydraulic Characteristics of an Eccentric Tapering Outlet Pressure Box Culvert in a Pumping Station" Processes 11, no. 6: 1598. https://doi.org/10.3390/pr11061598