Article

Phenolic Content, Antioxidant Capacity, and Browning Impact of Apple Slices during Microwave Drying: A Chemometric Approach

by
Vasile Darie Soproni
1,
Livia Bandici
1,*,
Alin Cristian Teusdea
2,*,
Francisc Ioan Hathazi
1,
Mircea Nicolae Arion
1,
Carmen Otilia Molnar
1,
Teodor Leuca
1,
Claudia Andrada Dalea
3 and
Simona Ioana Vicas
4
1
Department of Electrical Engineering, University of Oradea, 410087 Oradea, Romania
2
Department of Environmental Engineering, University of Oradea, 410087 Oradea, Romania
3
Department of Psycho-Neuroscience and Recovery, University of Oradea, 410087 Oradea, Romania
4
Department of Food Engineering, University of Oradea, 410087 Oradea, Romania
*
Authors to whom correspondence should be addressed.
Processes 2023, 11(6), 1601; https://doi.org/10.3390/pr11061601
Submission received: 19 April 2023 / Revised: 16 May 2023 / Accepted: 18 May 2023 / Published: 23 May 2023
(This article belongs to the Special Issue Advances in Food Processes Modeling)

Abstract

:
Apples represent a category of products frequently consumed by people, owing both to their beneficial effects on human health and to their antioxidant effects. Microwave (MW) treatment is a simple and fast method that can be used successfully in the food industry to obtain dry apple slices, rich in bioactive compounds and with a pleasant aspect. This study presents the effect of applying microwave treating to apple slices from two cultivars (Golden Delicious and Idared), for three, four, and five minutes, respectively, at a power of 450 W, in order to reduce the browning effect. For this purpose, the browning index (BI), chromatic parameters (CIE L*a*b*), total phenolic content (Folin-Ciocâlteu method), and antioxidant capacity (by Ferric Reducing Antioxidant Power (FRAP assay) were evaluated in the case of apple slices before and after MW treatment. Based on the results obtained, it can be argued that the microwave treatment results in a significant increase in the total phenolic content and enhances antioxidant capacity in the case of both apple cultivars. Apples from the Idared cultivar have a higher total phenolic content than apples from the Golden cultivar, and this concentration increased by 56.14% and 48.9%, respectively, after MW treatment. In terms of antioxidant capacity, Idared apples also recorded a higher value compared to Golden cultivars. According to the results of the multivariate analysis, there are variations between the two apple categories with regard to the phenolic content and the browning process; browning was inhibited at the five-minute exposure to microwaves. The apple processing domain may use our findings in order to produce high-quality finished products, with a pleasant aspect, which retain the bioactive compounds of the fruit.

1. Introduction

Apples are an excellent source of biologically active compounds with antioxidant effects that are beneficial to the body [1]. Apples can be consumed both fresh and dried. The high moisture content in fruits plays an important role in their storage. After being harvested, the fresh product is dried to prolong shelf life and to avoid waste and spoilage. The moisture of the apples is removed through evaporation during the relatively simple process of drying [2]. The antioxidants help fight the harmful effects of free radicals, which influence premature aging. Moisture reduction or drying by simultaneous mass and heat transfer is widely used to increase storage life, facilitate transportation, and maintain the post-harvest quality of dried fruits and vegetables [3]. The reduction of energy consumption and of the processing time and the improvement of product quality are the parameters that are taken into account for the application of new technologies.
For fruit drying, traditional methods are used in most cases, which require time; the drying speed is reduced, with a high risk of increasing the microbial load [4]. There are 51 various drying methods, which vary depending on the characteristics of the product and the desired drying period [2].
The classic industrial methods require a rather long drying time, the quality of the obtained product is not the best, and in many cases, there is a high energy consumption [5]. Instead, the drying in a microwave field is increasingly used for the dehydration of fruits and vegetables. In the presence of microwaves, there is a vibration between the water molecules in fruits and vegetables, thus causing the rapid loss of moisture [6].
There is a need to develop alternative strategies that contribute to environmental and economic factors and support the nutritional and general quality of agricultural products. In this context, the drying process is one of the most important conservation techniques for extending the storage life and availability of fruits, maintaining the nutritional components at high values, using traditional food products, reducing transport and storage costs, and presenting new ways of consumption. Due to the increased demand for nutritious ready-to-eat products (such as snacks, breakfast, bakery products) in recent years, the food dehydration industry, including dried apples, has become an important market segment, to keep pace with the alert lifestyle of consumers. Among the techniques covered, conventional hot air drying is widely used in industry because it allows uniform processing conditions, is easy to use, and better dried products are obtained, meeting the optimal drying conditions [7,8,9].
Innovative technologies used recently have achieved significant progress in preserving the qualitative properties of fruits after the preservation process. Microwave processing is one of the solutions used, because it allows the improvement of the drying technology by reducing the processing time and operational costs [10,11]. The microwave field quickly penetrates the product by heating it with an inverse temperature gradient, resulting in an increase in the temperature of the product simultaneously with a rapid evaporation of water [12,13].

Microwave Processing

Fruit drying is a complex process involving several factors that affect their quality: the sample used, its microstructure, the chemical composition, the sample preparation method, and the drying conditions. During drying, the fruits go through different changes due to the simultaneously generated effects of heating, mass transfer, and chemical reactions [14].
The classical drying has been studied in many articles from a qualitative point of view. The low quality of the products and the high energy consumption due to the long drying time are the most important problems that cause the degradation of fruits during conventional drying. During hot air drying, due to long processing time (slow heating from the outside to the inside of products), their nutritional and sensory qualities are lost, and the products subjected to drying are harder and rougher.
Compared to fresh fruits (control sample), during their thermal processing, total flavonoid content, total phenolic content, and antioxidant capacity are reduced [15].
Apples provide phenolic compounds in large quantities. In practice, for various food products there are methods to improve the antioxidant status and oxidative stability using apple polyphenols without considerably affecting the physicochemical properties or taste, odor, and color. This is done by optimizing process parameters to achieve best performance and the highest antioxidant capacity [16].
In an effort to highlight the qualitative aspect of dried foods, new drying technologies have been developed by improving and optimizing existing drying methods and by maximizing quality attributes such as structure, color, aroma, etc. [17]. In continuous microwave heating processes, the movements of the molecules and atoms of the bioactive compounds are accelerated, which increases the frequency of molecular collisions until the energy produced triggers the chemical drying reactions, doubling every 10 °C [18]. Prolonged exposure of the sample in the drying process can lead to the degradation of food quality attributes resulting in a reduction of the antioxidant reactions of bioactive compounds [19]. Recent research has addressed different food drying methods (natural sun drying, hot air conveyor belt drying, electric resistance oven drying, microwave field drying, etc.). In some situations, the methods listed above are combined to benefit from the advantages of each technology and optimize the drying process, thus resulting in hybrid/mixed drying methods [20]. Microwave drying, however, is an innovative food processing method that uses the thermal energy of high-frequency electromagnetic waves to achieve high drying efficiency. This method determines minor losses in the nutritional and physical qualities of the products subjected to drying compared to the conventional drying, by reducing color change and decreasing the degradation reaction of the nutritional components. These advantages are obtained on account of decreasing the processing time compared to classical methods, due to the reduction of enzymatic browning. Through microwave drying, the fruits are dehydrated, browning is inhibited, and the enzymes are partially inactivated. The fruit dehydrated with the help of MW preserve their color and aspect and no longer require a bleaching process [21,22].
The microwave processing conditions (power density, drying time, temperature of the product undergoing drying, and the presence of the air jet in the oven) influence not only the physical but also the nutritional qualities of apple chips.
The increase of the microwave power and of the processing temperature, as well as the reduction of the drying time, inactivate the deterioration reactions and shorten the duration of the degradation of the biochemical reaction determining a better color and preserving both a greater number of nutrients and the microstructure of the product [23].
On the other hand, an uncontrolled heating at high temperatures causes the fast degradation of nutrients, which are sensitive to high temperatures, along with acceleration of browning during drying, with the microstructure of the sample becoming more porous; in some cases, cracks appear on its surface due to its high internal pressure.
Microwave heating of food is caused by the coupling of the electrical energy of the high-frequency electromagnetic field in the oven with the molecular structure of the processed food [24]. As a result, there is a rapid heating in the entire volume of the material at the same time, which takes place at the molecular level by reorienting the dipolar molecules in the product according to the variation of the electromagnetic field. This generates thermal agitation due to ionic polarization and dipolar rotation (molecular friction). Microwave heating also depends on the state of the constituents, free or bound, where the bound ions have a much lower microwave absorption capacity than those in a free state [25].
The volumetric heating capacity (Q) in the case of microwave field processing is directly proportional to the electric field strength:
Q = 2πfꜪ0E2
where: f is the microwave frequency; E is the intensity of the electric field; 0 is the free space permittivity (physical constant); ″ represents the dielectric loss factor that shows the absorption capacity of the material.
An important factor in the case of microwave heating is the thermal conductivity of the food, k. A high thermal conductivity determines faster heating, and the thermal capacity cp of the food shows the thermal response of the product subjected to microwave processing. The thermal diffusion α is an important material property that includes the thermal conductivity (k), the thermal capacity (cp), and the density of the material (ρ):
α = k/(ρ cp)
In the case of a controlled drying process, an efficient evaporation of moisture is observed on the surface of the product, and, during the rest period, there is a redistribution of temperature and moisture inside of it, when the water particles are transported from the inside to the evaporation area. This orderly migration of moisture to the surface of the sample protects it from overheating and decreasing in quality, in turn increasing the effectiveness of drying by reducing the processing time [26]. Exposure to high temperatures is avoided when optimal power densities and processing times are used.
In our study, we processed two apple cultivars (Golden Delicious and Idared) that are different in both structure and color. Idared is juicier and browns faster than Golden Delicious. In order to determine the best time to prevent apples against browning, a microwave treatment (power 450 W) for three, four, and five minutes to slices of yellow and red apples (Golden Delicious and Idared cultivars) was applied. To monitor this process, the browning index (BI) was determined for MW treated or untreated apple slice samples. In addition, the chromatic parameters (CIE L*a*b*), the total phenolic content (Folin-Ciocâlteu method), and the antioxidant capacity (Ferric Reducing Antioxidant Power (FRAP assay) were determined in the MW treated or untreated apple slice samples. All the results obtained were investigated using chemometric multivariate analysis.

2. Materials and Methods

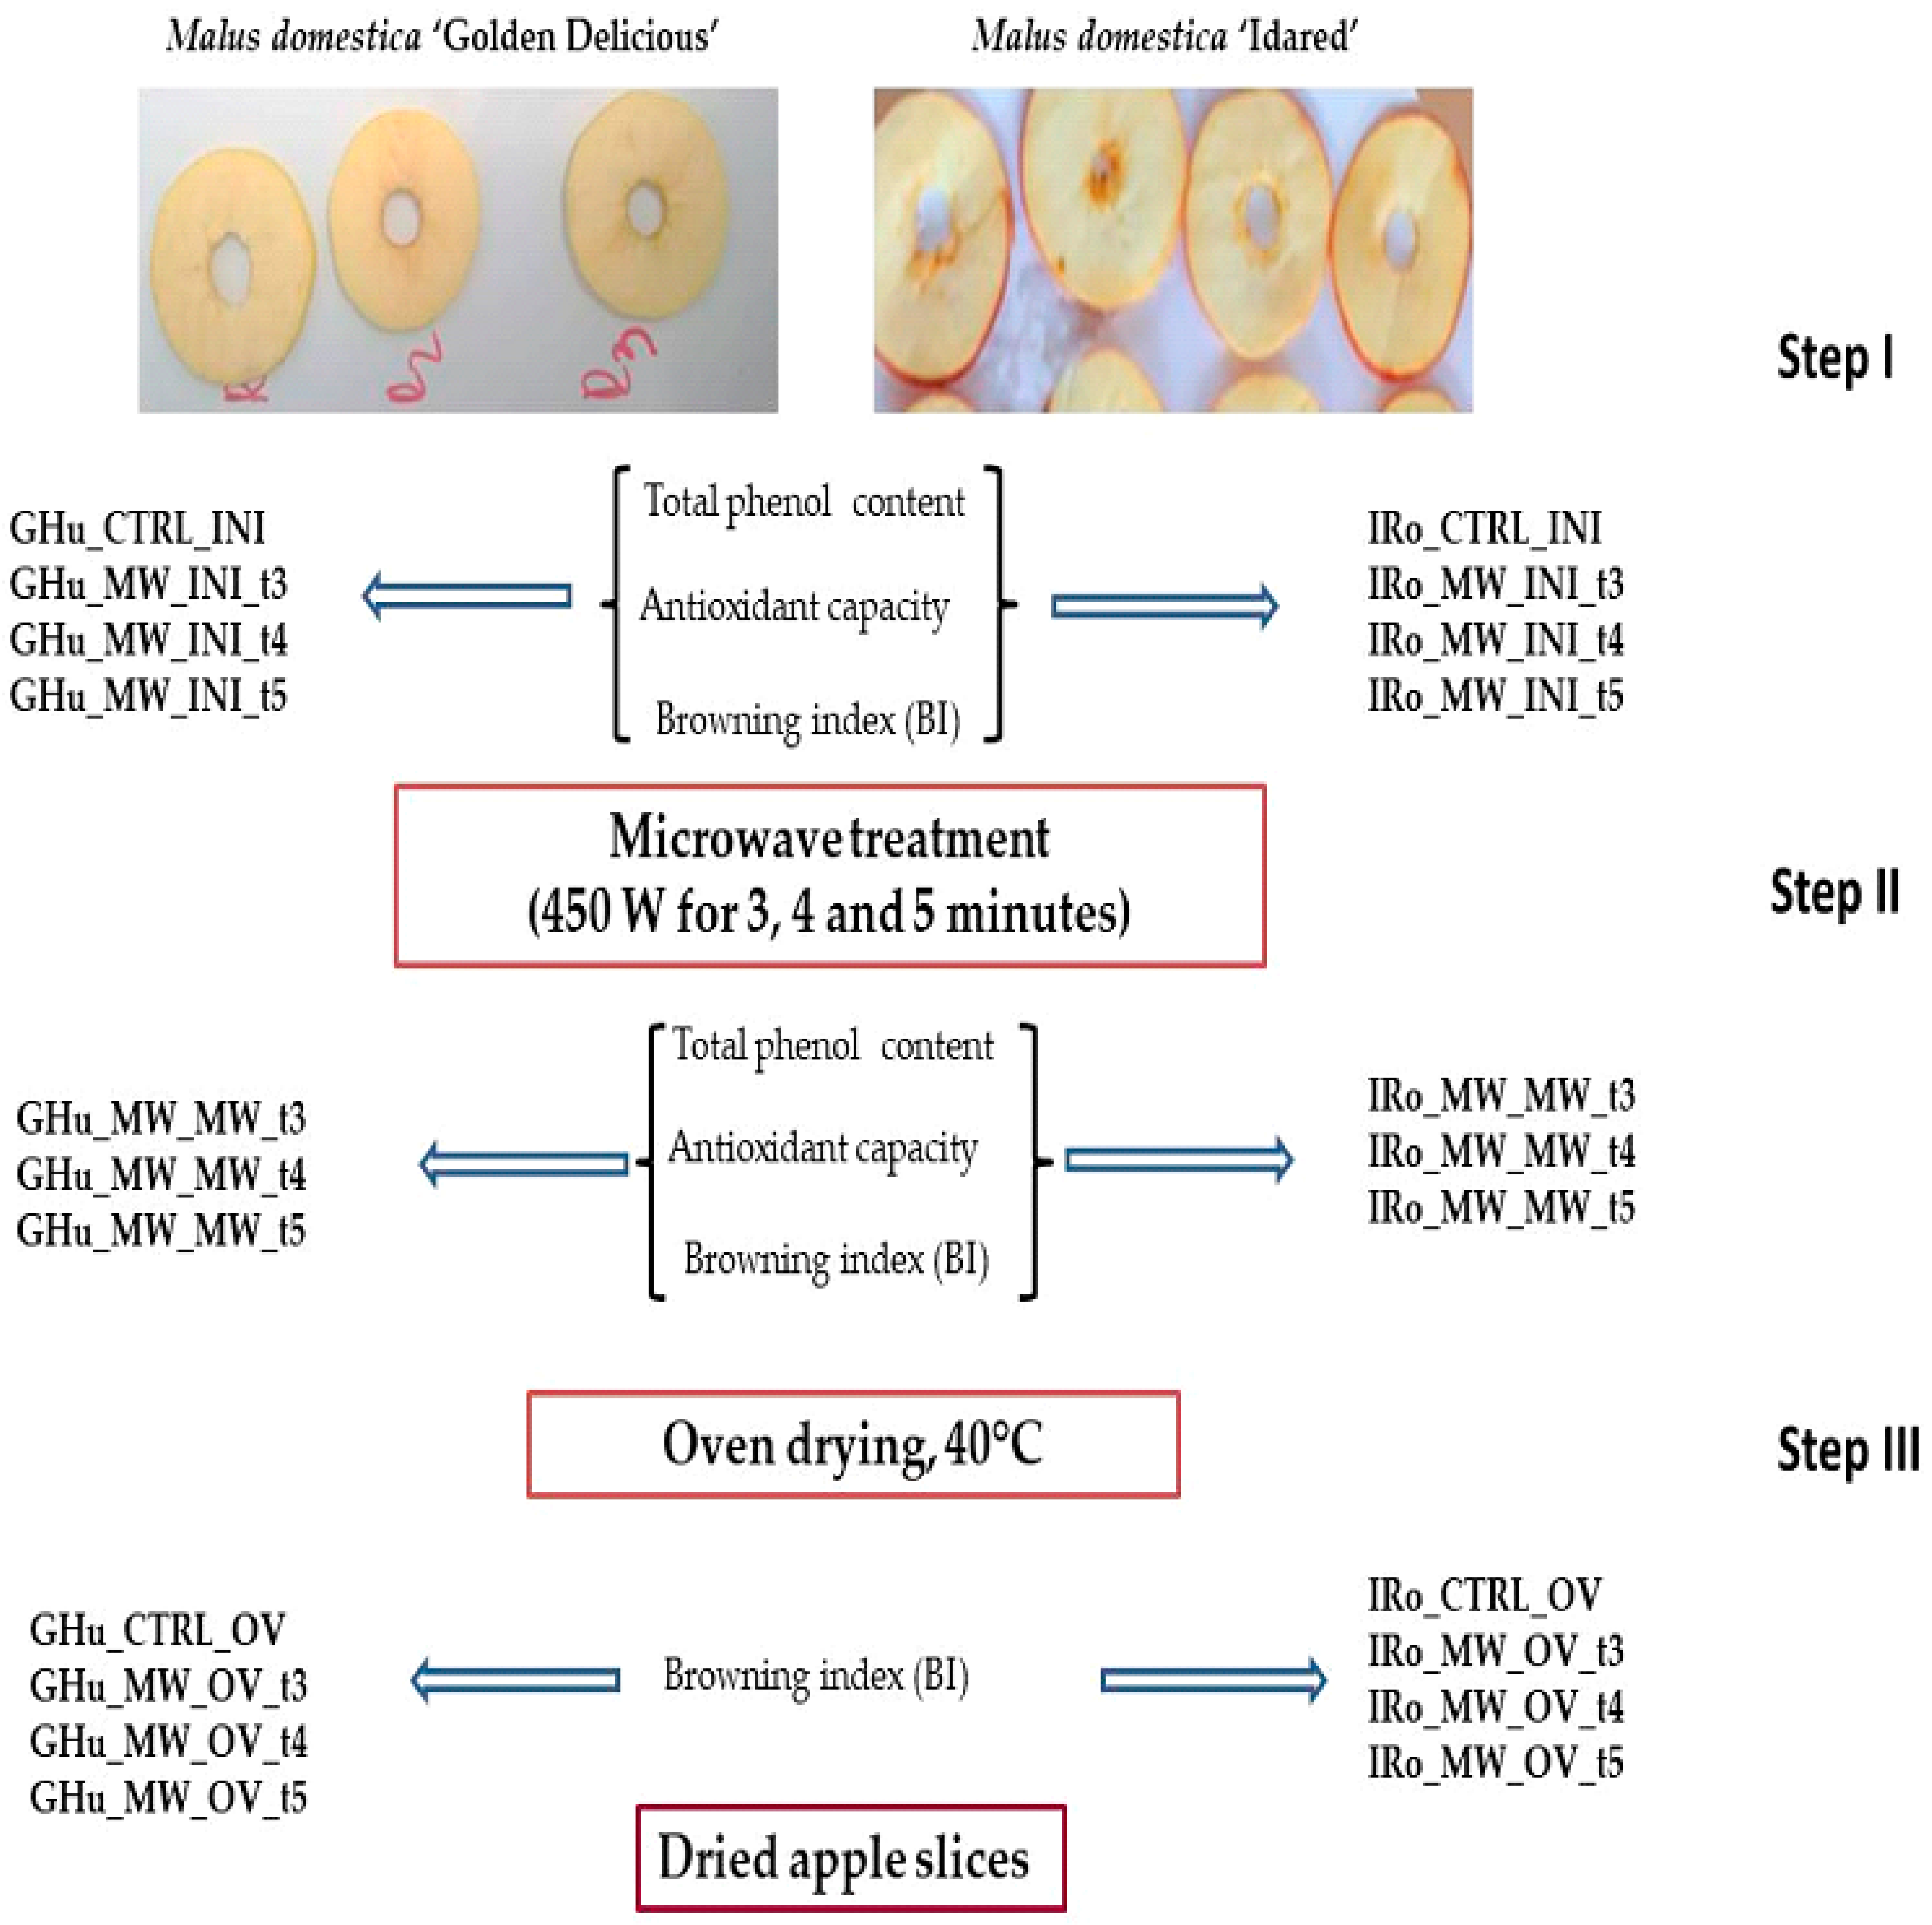
2.1. Experimental Design (DOE)

The samples used in this experiment were apple fruits (Malus domestica) harvested in 2022. The yellow apple cultivar Golden Delicious and the red cultivar Idared were used. The DOE is shown in Figure 1. During the initial stage, the apples were washed, dried, and cut into thick slices (5 mm) using a ceramic knife. The seeds were removed and in the second step the samples were subjected to high frequency electromagnetic field (MW) treatment that consist in a power of 450 W at three different time periods (three, four, and five minutes). Before and after the MW treatment, the samples were weighed and total phenolic content, antioxidant capacity, and browning index were analyzed. For both apple cultivars, slices of apples not subjected to MW treatments were also used, representing the control/untreated sample. The temperature before and after the MW treatments was also monitored using the FLUKE Thermography camera. In the third step, a part of the apple slices treated with MW at the mentioned times were subjected to the biochemical analyzes described below, while the other apple samples underwent a convection oven drying treatment (OV) at 40 °C until a constant apple chip mass was reached (Figure 1). Images taken during our study are presented in Supplementary Materials (Figure S1).
In compliance with this process, four factors were considered in the DOE (see sample coding in Table 1):
  • the first factor, the apple cultivar with two levels: Golden (GHu) and Idared (IRo);
  • the second factor, the sample with two levels: CTRL and MW, denoting the untreated samples (CTRL) and the treated samples (MW);
  • the third factor, the phase with three levels: INI, MW, and OV, representing the three types of applied treatments: untreated (INI), microwave treatment (MW), and convection drying treatment (OV);
  • the fourth factor, the microwave treatment time period with three active levels: t3, t4, and t5, corresponding to microwave exposure times of three, four, and five minutes; also, the untreated INI samples could have the code of t0 for this factor.

2.2. Chromatic Analysis

Apple chips were scanned with Canon CanoScan 9000 F at 600 dpi image resolution and 24 bit color depth. The images were pre-processed so as to retain only the useful apple tissue part without any background and foreground noise or objects. The images were coded in RGB chromatic space and transformed in CIE L*a*b* chromatic space for further statistical analysis of the samples. All the image processing was done in MATLAB R2022b (CWL License from MathWorks, 1 Apple Hill Drive, Natick, MA, USA) custom-made application designer programs.

2.3. The Determination of the Browning Index (BI)

The browning index was monitored before and after the MW treatment, and after drying in the oven. The browning index (BI) values were obtained following chromatic image analysis. Making digital images of the sliced apple samples involved scanning them with a Canon CanoScan 9000 F scanner at a resolution of 600 dpi.
The browning index (BI) was calculated with the following equations [27]:
    BI   % = x 0.31 0.17 × 100
where,
x = a * + 1.75 × L * 5.645 × L * + a * 3.012 × b *
L* value indicates lightness, and a* and b* are chromaticity coordinates.

2.4. Total Phenolic Content (FC) and Antioxidant Capacity of MW Treated or Untreated Apple Slices

The apple slices before and after MW treatment were homogenized with 70% alcohol in a ratio of 1:1 g/v, centrifuged at 5000 rpm for twenty minutes, and the supernatant was used to determine total phenolic content and antioxidant capacity. The total phenolic content was determined according to the Folin–Ciocâlteu method [28] with minor changes [29]. In brief, 100 µL of supernatant were mixed with 1700 µL of distilled water, 200 µL of Folin–Ciocâlteu reagent (freshly prepared, dilution 1:10, v/v), and 1000 µL of 7.5% Na2CO3 solution. After 2 h in the dark, the absorbance of samples was measured at 765 nm using a spectrophotometer (Shimadzu 1240 mini UV–Vis, Kyoto, Japan). The results were expressed as mg GAE (gallic acid equivalent)/100 g based on the calibration curve of gallic acid.
The antioxidant capacity of MW treated or untreated apple slices was evaluated based on the reduction of Fe3+ from the tripyridyltriazine Fe(TPTZ)3+ complex, to the blue colored complex-Fe(TPTZ)2+ in an acid medium [30]. The working FRAP solution was freshly prepared by mixing 300 mM of acetate buffer, 20 mM of FeCl3 ·6 H2O solution, and 10 mM of TPTZ solution in the ratio 10:1:1 (v/v/v). In short, a volume of 100 µL of the apple slice sample was allowed to react with 500 µL of FRAP working solution and 2 mL of distilled water, for 1 h, in the dark [31]. The absorbance was measured at 595 nm using the Shimadzu 1240 mini UV–Vis spectrophotometer. The results were expressed in µmolTrolox equivalents (TE)/100 g.

2.5. Statistical Analysis

The univariate four-way ANOVA (p = 0.05) test was applied to the sample values—though only the fourth level interaction factor sample means were presented in the paper. Multiple pairwise comparisons of sample means were done using the post-hoc Dunn–Sidak test (p = 0.05), after the ANOVA test. In addition, the main effects for all the factors were generated.
Nonlinear regressions of the time series for FRAP, FC, and BI parameters were performed in order to investigate the functional relation over time and to emphasize the possible asymptotic behavior of the parameters. Multivariate analysis of all parameters and samples (organized by the fourth level interaction factor) was conducted in order to get the possible clustering information and the best factor level combinations that can be applied in industrial processing.
All statistical data analyses and graphic representations were performed with GraphPad Prism v06 (GraphPad Software, 225 Franklin Street. Fl. 26, Boston, MA 02110, USA) and MATLAB R2022b (CWL License from MathWorks, 1 Apple Hill Drive, Natick, MA 01760-2098, USA) custom-made application designer programs, including the chromatic samples analysis.

3. Results and Discussions

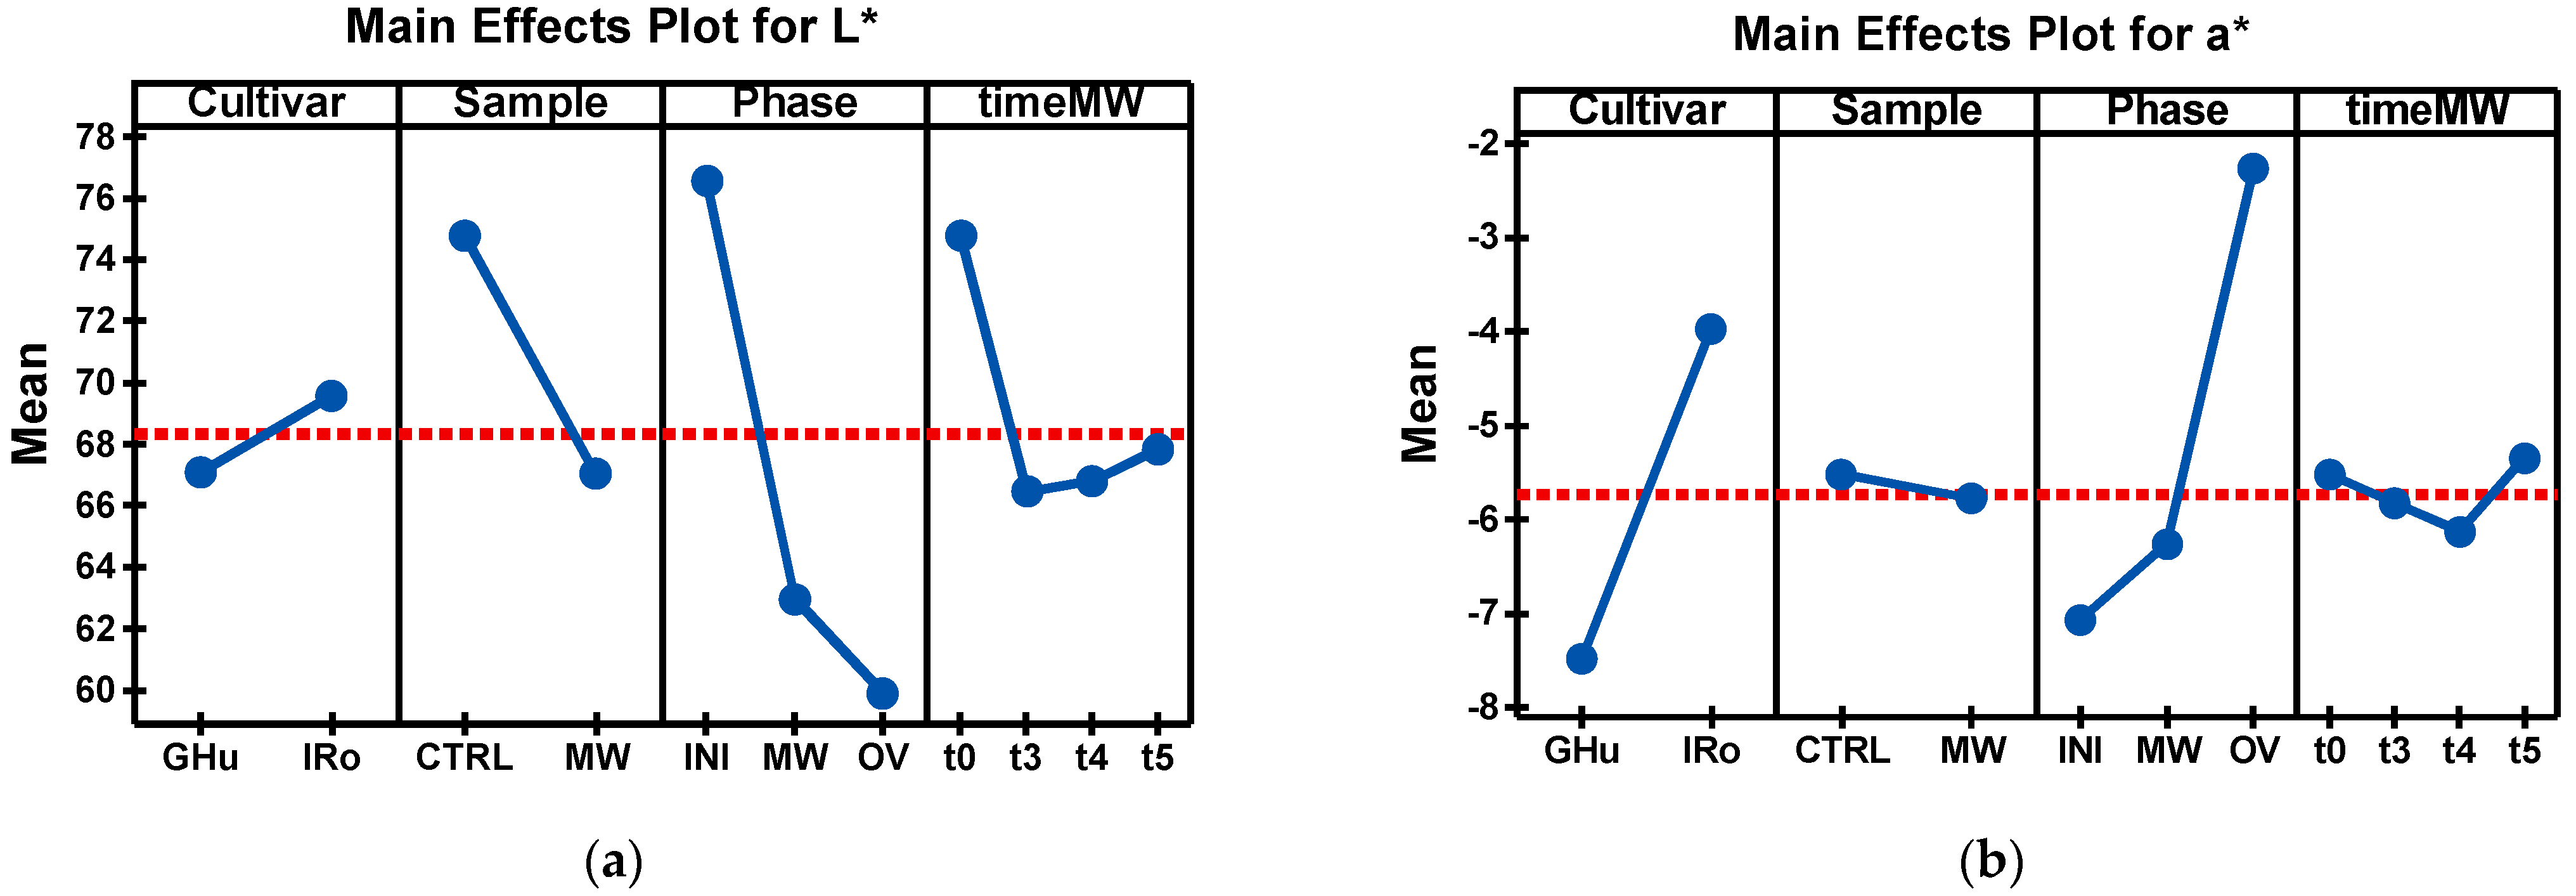
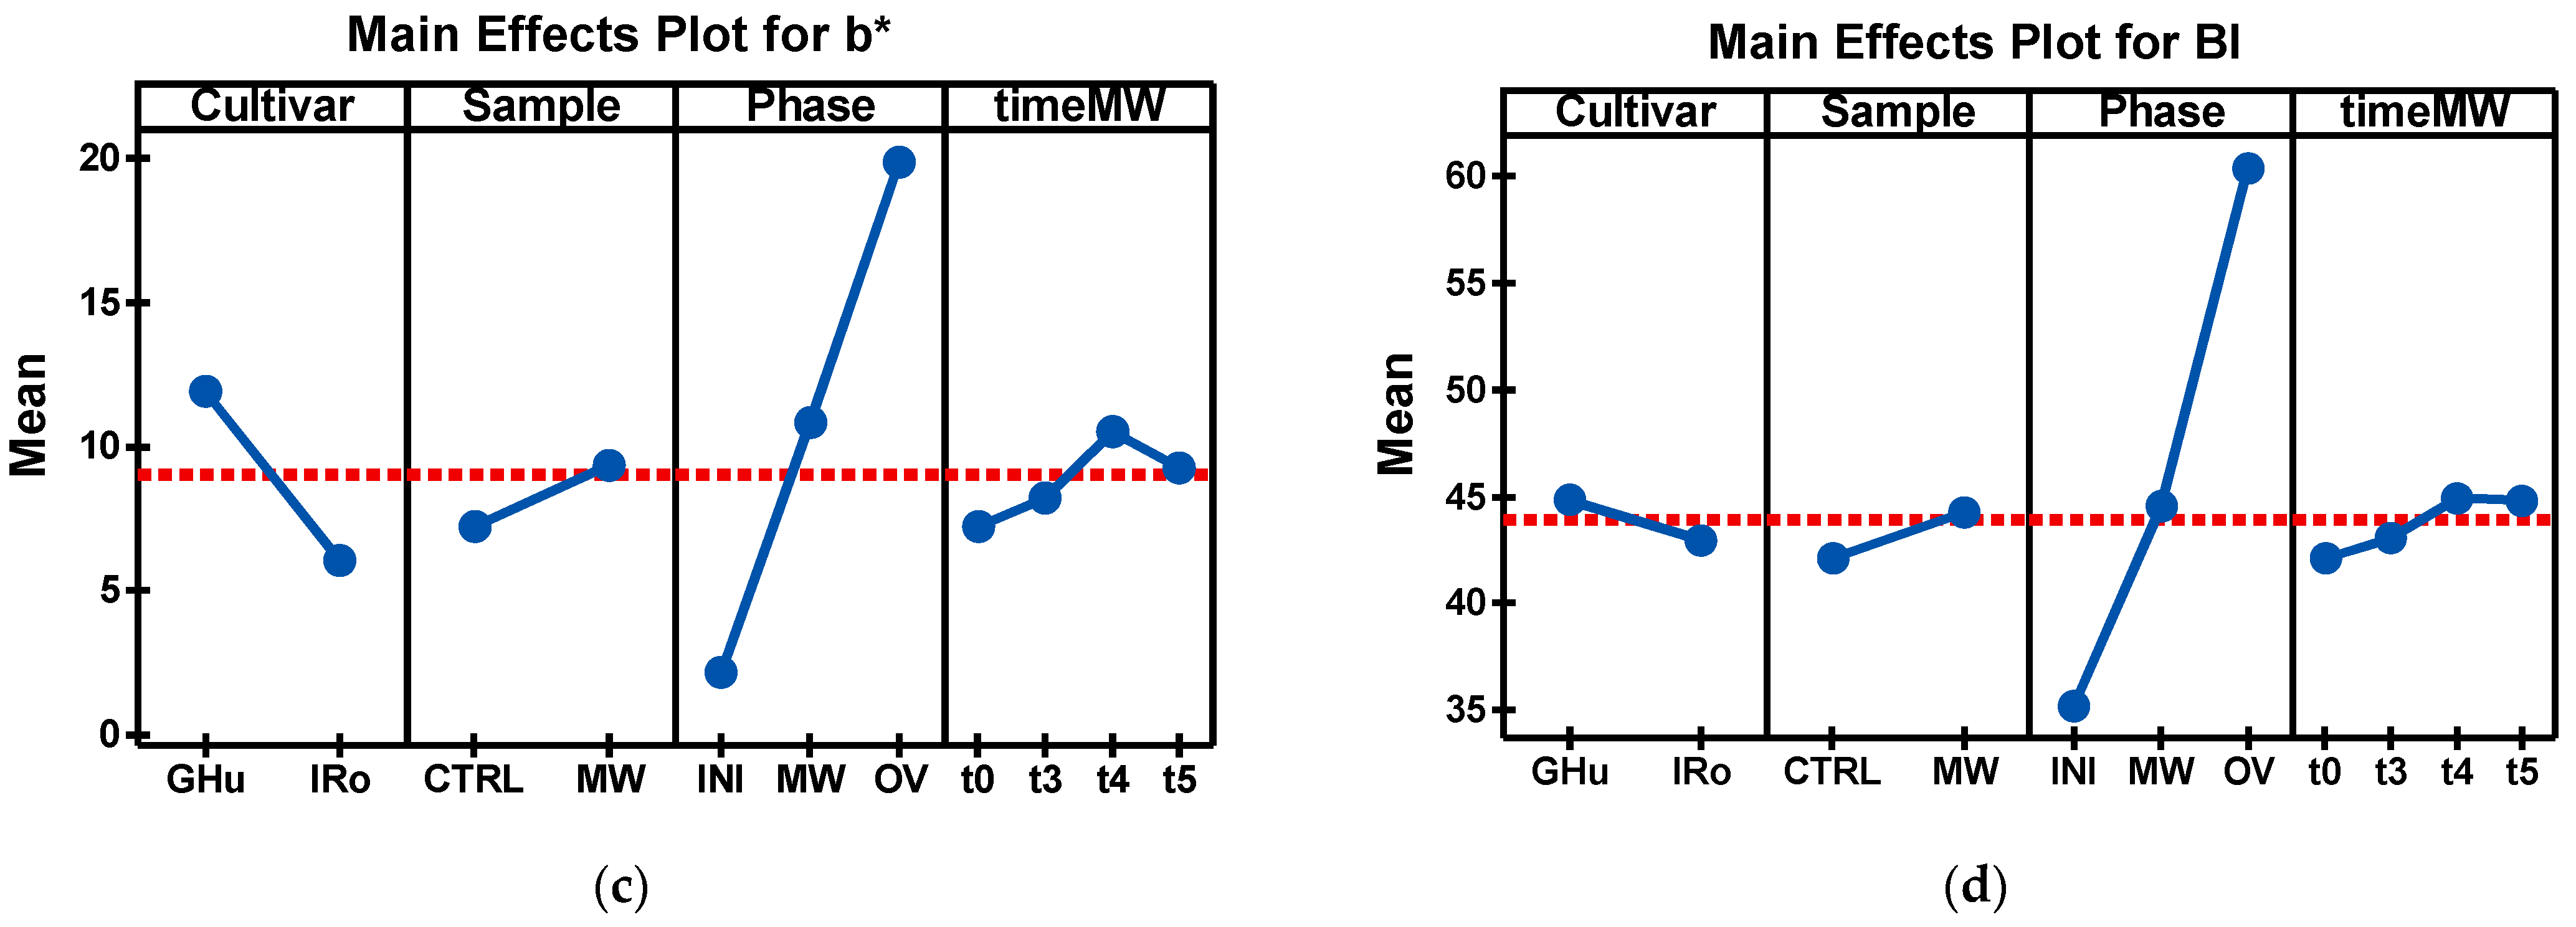
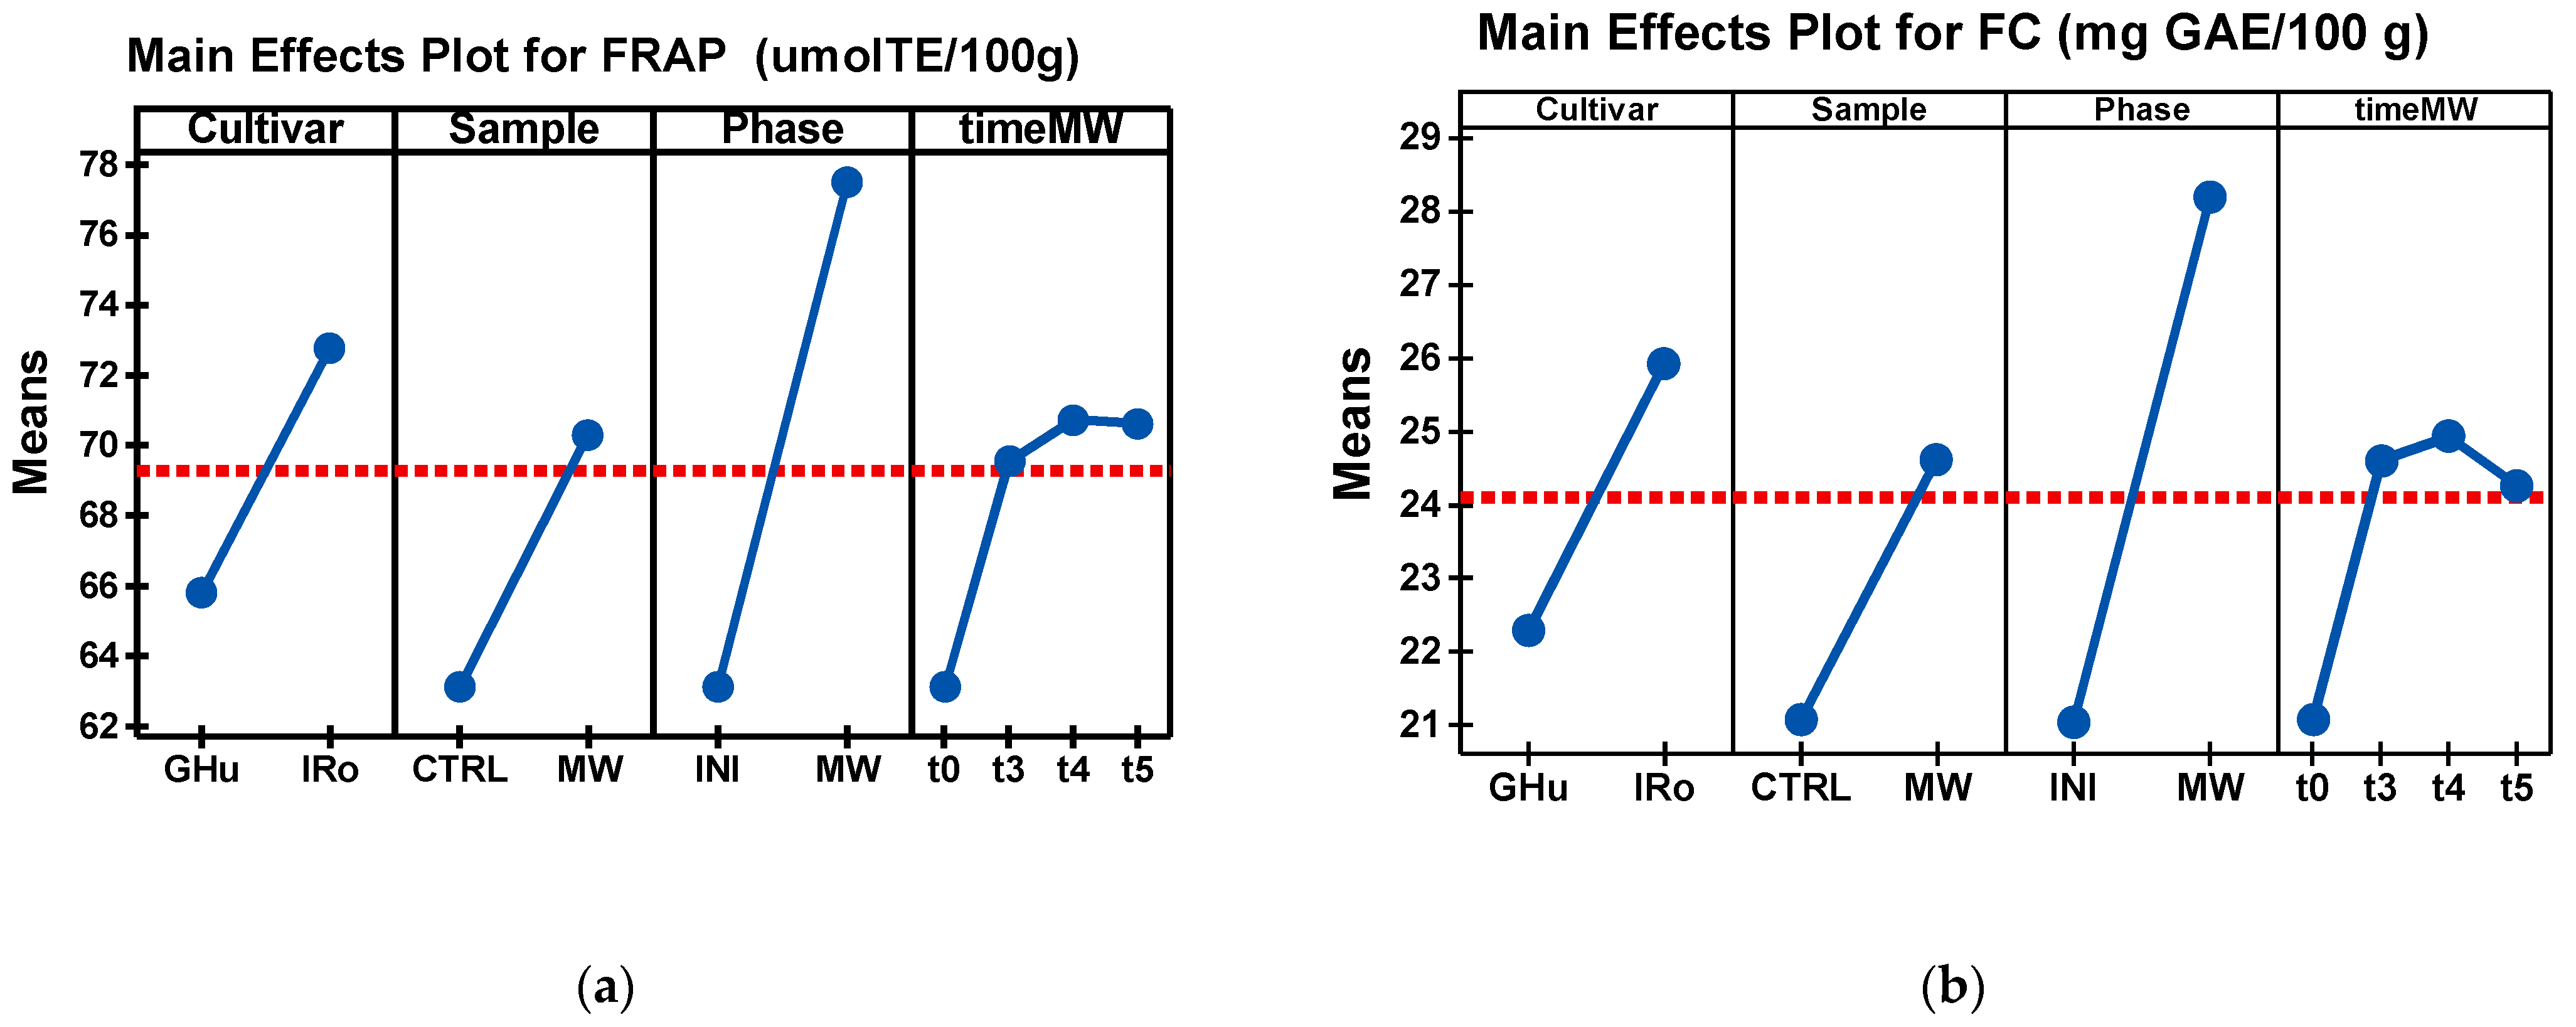
3.1. Univariate Analysis

The browning index (BI) values were obtained by chromatic image analysis (Table 2). The BI was monitored in three stages of the experimental plan (Figure 1): before MW treatment (control/untreated sample, coded CTRL_INI and MW_INI sample, at t3, t4, and t5 min for Golden and Idared apple slices), after MW treatment (coded MW_MW, at t3, t4, and t5 min for both apple cultivars), and after drying in the oven at 40 °C (control/untreated sample, coded CTRL_OV and MW_OV samples).
Graphic comparisons of chromatic parameters, L*, a*, b*, and BI calculated for factor Cultivar*Sample*Phase*time MW levels are shown in Figure 2.
The chromatic parameters, L*, a*, b*, and BI, were highly affected by the phase factor, next by the cultivar factor, and lastly by the time MW and sample factor (see Figure 2a–d). Following the application of MW, a decrease in L* and an increase in a* and b* chromatic parameters can be observed in comparison to the initial samples in both apple cultivars. Additionally, drying in the oven causes the value of L* to significantly decrease when compared to the treatment with MW, while the values of a* and b* increase significantly when compared to the samples treated with MW (Table 2, Figure 2a–c). Chahbani et al., 2018, who employed a different plant matrix, also noted changes in the color characteristics. As a result, in the case of peas, the fresh peas had a significantly different color from the control samples, with an increase in the a* value and decreases in the L* and b* values [14].
The highest browning mean was achieved by the oven drying process (OV) followed by the MW treatment. The GHu cultivar has a higher browning index than the IRo one and then the BI grand mean. Time stamps t0 and t3 have lower BI values than the t4, t5, and BI grand mean. These facts rise the possibility that the sample IRo_MW_MW_t3 could have the lowest browning index value among the MW treated samples.
Enzymatic browning is usually measured using physical markers like surface color or biochemical indices like polyphenol oxidase activity. CIE L*a*b* coordinates have been the most widely used color system for physical indicators based on color [32,33]. Fruit browning indicators have been established based on CIE L*a*b* coordinates [34,35]. One of the most widespread markers of browning in food products containing sugar is the browning index (BI) [34].
The total phenolic content and antioxidant capacity of apple slices subjected to different MW treatments are presented in Table 3. The graphic comparisons of bioactive compound parameters, FRAP and FC, calculated for factor Cultivar*Sample*Phase*time MW levels are shown in Figure 3.
Of the two apple cultivars studied, Idared apples are a richer source of phenols compared to Golden apples. The microwave treatment results in a significant increase in the total phenolic content for both apple cultivars. For example, in the case of apple slices, there was an increase in total phenolic content of 48.9% and 56.14% for Golden Delicious and Idared apple slices, respectively. The decrease in moisture content and associated rise in concentrations are probably responsible for this. Similar results were obtained by [2] who investigated the effect of microwaves and oven drying on the quality of four apple cultivars (Golden, Granny, Smith, Pink Lady, and Starking). In the case of MW, the authors applied two powers, 180 W and 540 W, which led to an increase in the concentration of phenols in the case of the Golden cultivar by three or four times compared to the initial concentration. In another study [35], different MW powers, located between 90 and 900W, were applied to apple samples and the results showed that, following the treatment, the concentration of some compounds decreased (vitamin C, anthocyanins, amino nitrogen) while the total flavonoid content and the total phenolic content increased. In particular, the treatment with a power of 900 W for 75 s resulted in a 115% increase in total phenolic content compared to the control sample.
Interestingly, the increase in MW treatment time did not show any statistical changes in terms of phenolic content (Table 3). A similar trend was observed in the case of antioxidant capacity, which increased significantly after the MW treatments.
During the microwave treatment of a material, the water content, which is the most typical absorbing phase for microwave energy, is important [35]. When microwave energy is applied to fruits, water content plays the most important role as an absorbing phase. Other studies have also reported that the phenolic content was increased after the microwave treatments of the fruits [27,36]. Around 70 °C is the temperature that was observed after the MW treatment, and in such conditions, vitamin C, an endogenous antioxidant that plays a protective role in preventing fruit browning, is destroyed [19]. Chahbani et al., 2018 [14] examined the impact of microwave power effects (100, 300, and 450 W) on the drying kinetics of green peas. According to the authors’ results, peas dried at 100 W had the highest concentration of phenolic compounds, as determined by LC-ESI-MS analysis and the activity of DPPH radical scavengers. Green peas dried in the microwave at 100 W appear to have remarkable antioxidant capabilities [14].
In order to create the optimal conditions for high-level compound extraction, Ref [36] evaluated the impact of microwave treatment (250 and 500 W) on phenolic compounds and antioxidant activity of citrus mandarin pomace. With increasing MW irradiation power, an increase in total flavonoid concentration (estimated in terms of flavanol, flavanones, and flavonol) was noticed. On the other hand, there was a significant decrease in content when pomace was exposed to 250 W for 15 min, indicating that extended times of exposure were harmful for flavonoids. The treatment with 250 W for 10 min provided most favorable results.
The increase in bioactive compounds and antioxidant capacity after microwave pretreatment of apple raw material was observed by [35] and the explanation lies in the fact that some enzymes in the fruit tissue were activated and stimulate other substances in flavonoids and phenols.
The antioxidant capacity parameters, FRAP and FC, were also highly affected by the phase factor, next by the cultivar, time MW, and sample factor (see Figure 3a,b). The highest FRAP and FC values are achieved by the MW treatment, compared to the INI samples. The IRo cultivar has higher FRAP and FC values than the GHu one and even than the grand mean. Time stamps t3, t4, and t5 have higher FRAP and FC values than t0 and even the grand mean. These facts rise the possibility that the MW treated samples of IRo could have the highest FRAP and FC values among the MW treated samples.

3.2. Nonlinear Regression

All analyzed parameters were measured at four-time stamps: initially (zero minutes, i.e., without MW treatment) and three, four, and five minutes with MW treatment. Because one of the aims of the experimental work is to provide practical application hints, nonlinear regressions of the time series of the FRAP, FC, and BI parameters were also done. Only a single nonlinear regression function was used (although several other functions were tested, the presented one gave the best R2 values for all three parameters) (see Table 4, Table 5 and Table 6). The FRAP and FC parameters have higher R2 values (0.67–0.95) than the chromatic parameter BI R2 values (0.42–0.54).
Figure 4a–c shows the graphic comparisons of results for the nonlinear regression of the FRAP, FC, and BI time series for cultivar factor levels.
After a determined time period, the nonlinear regression function (i.e., inverse Gaussian function) performs an asymptotic saturation of parameter values. The FRAP time series values for IRo samples are higher than the GHu samples (for all MW time stamps), but the start value for IRo is also higher than for GHu. Moreover, the untreated FRAP value gap between IRo and GHu, is halved at the asymptotic regions. The same behavior is present for the FC parameter, but the initial gap between IRo and GHu untreated values gets 7.5 times smaller at the asymptotic regions. The browning index, BI parameter, has a different behavior than the FRAP and FC parameters. Initially, the BI value for IRo is higher than GHu, but the asymptotic values for GHu is higher than IRo. This fact proves that, due to the different cellular matrix of the two apple cultivars, the polyphenol oxidase enzyme activity, that is responsible for the browning process, for the GHu samples, is cancelled after a longer period of MW treatment than for IRo samples.
To describe the exact time stamp of the start of the asymptotic region, the first derivative of the time series was calculated. From the first derivative cancelling equation the asymptotic starting time stamp was derived (Table 7).
The asymptotic starting time stamps of FRAP, FC, and BI, for IRo samples are higher than for GHu. For FRAP and FC, the differences between cultivar levels are much smaller—six times and nine times, respectively—than for the browning index (BI) parameter. This result implies that there is a huge difference between the cultivar cellular matrix from the browning process point of view.

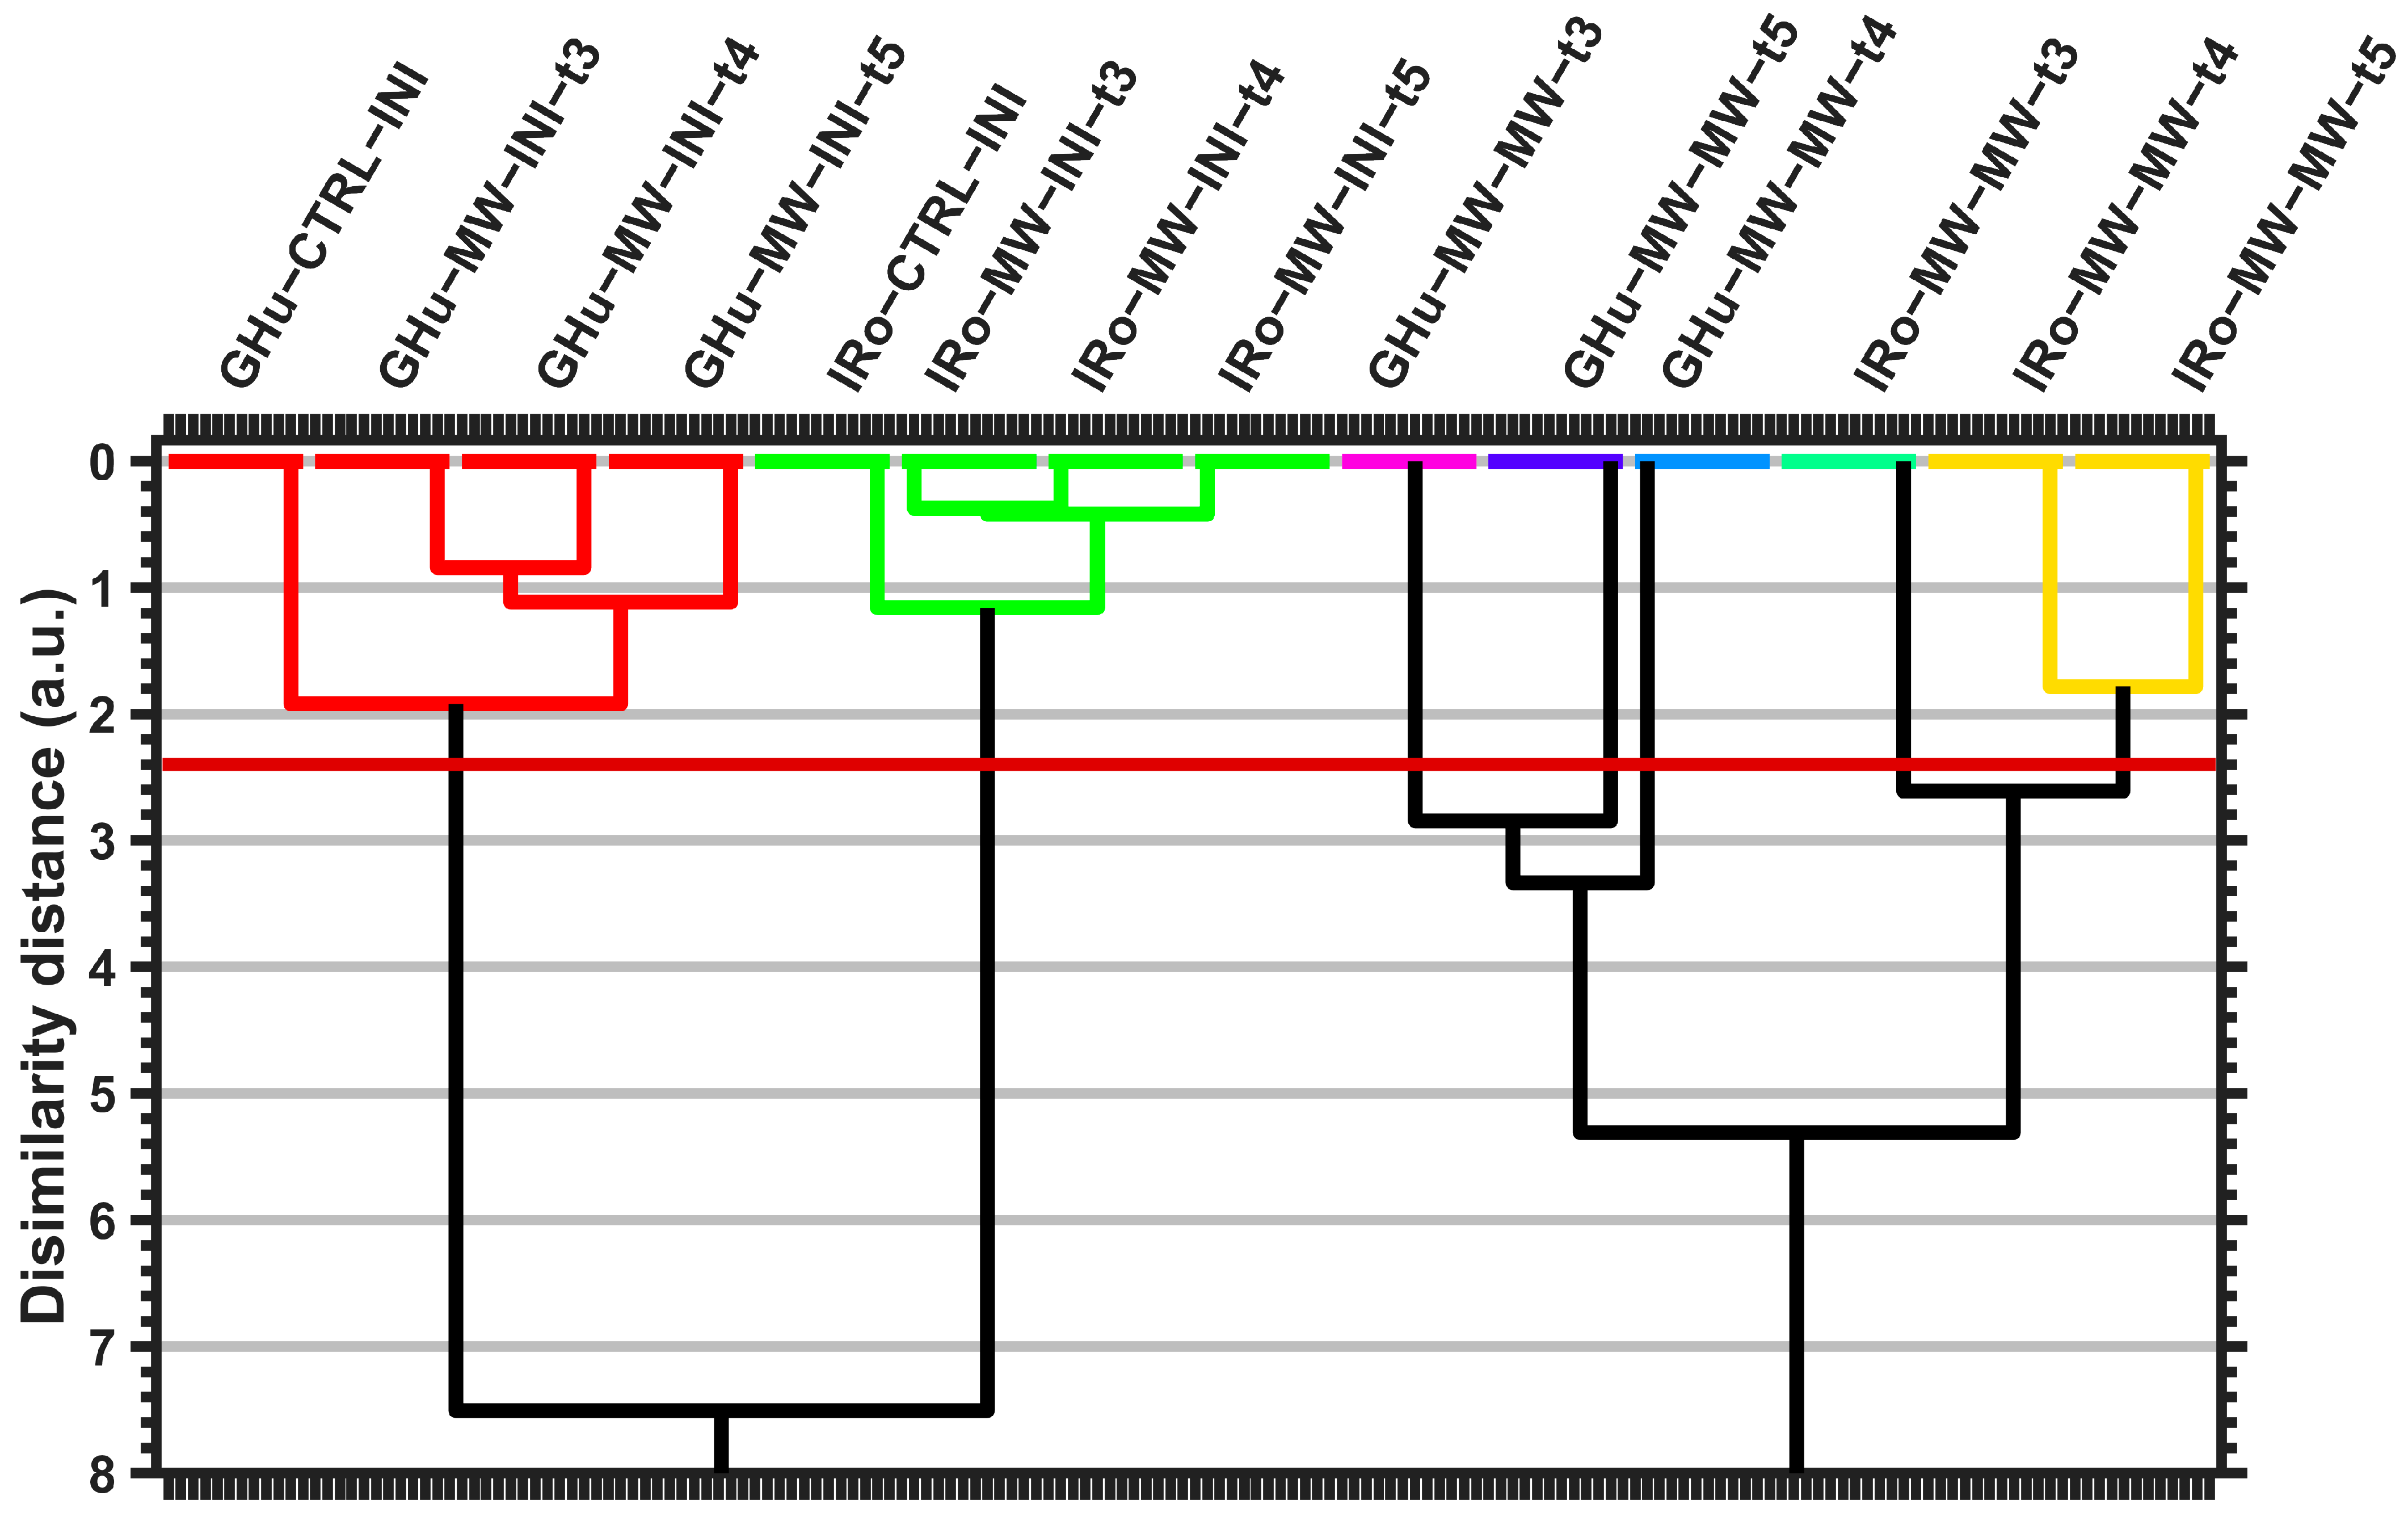
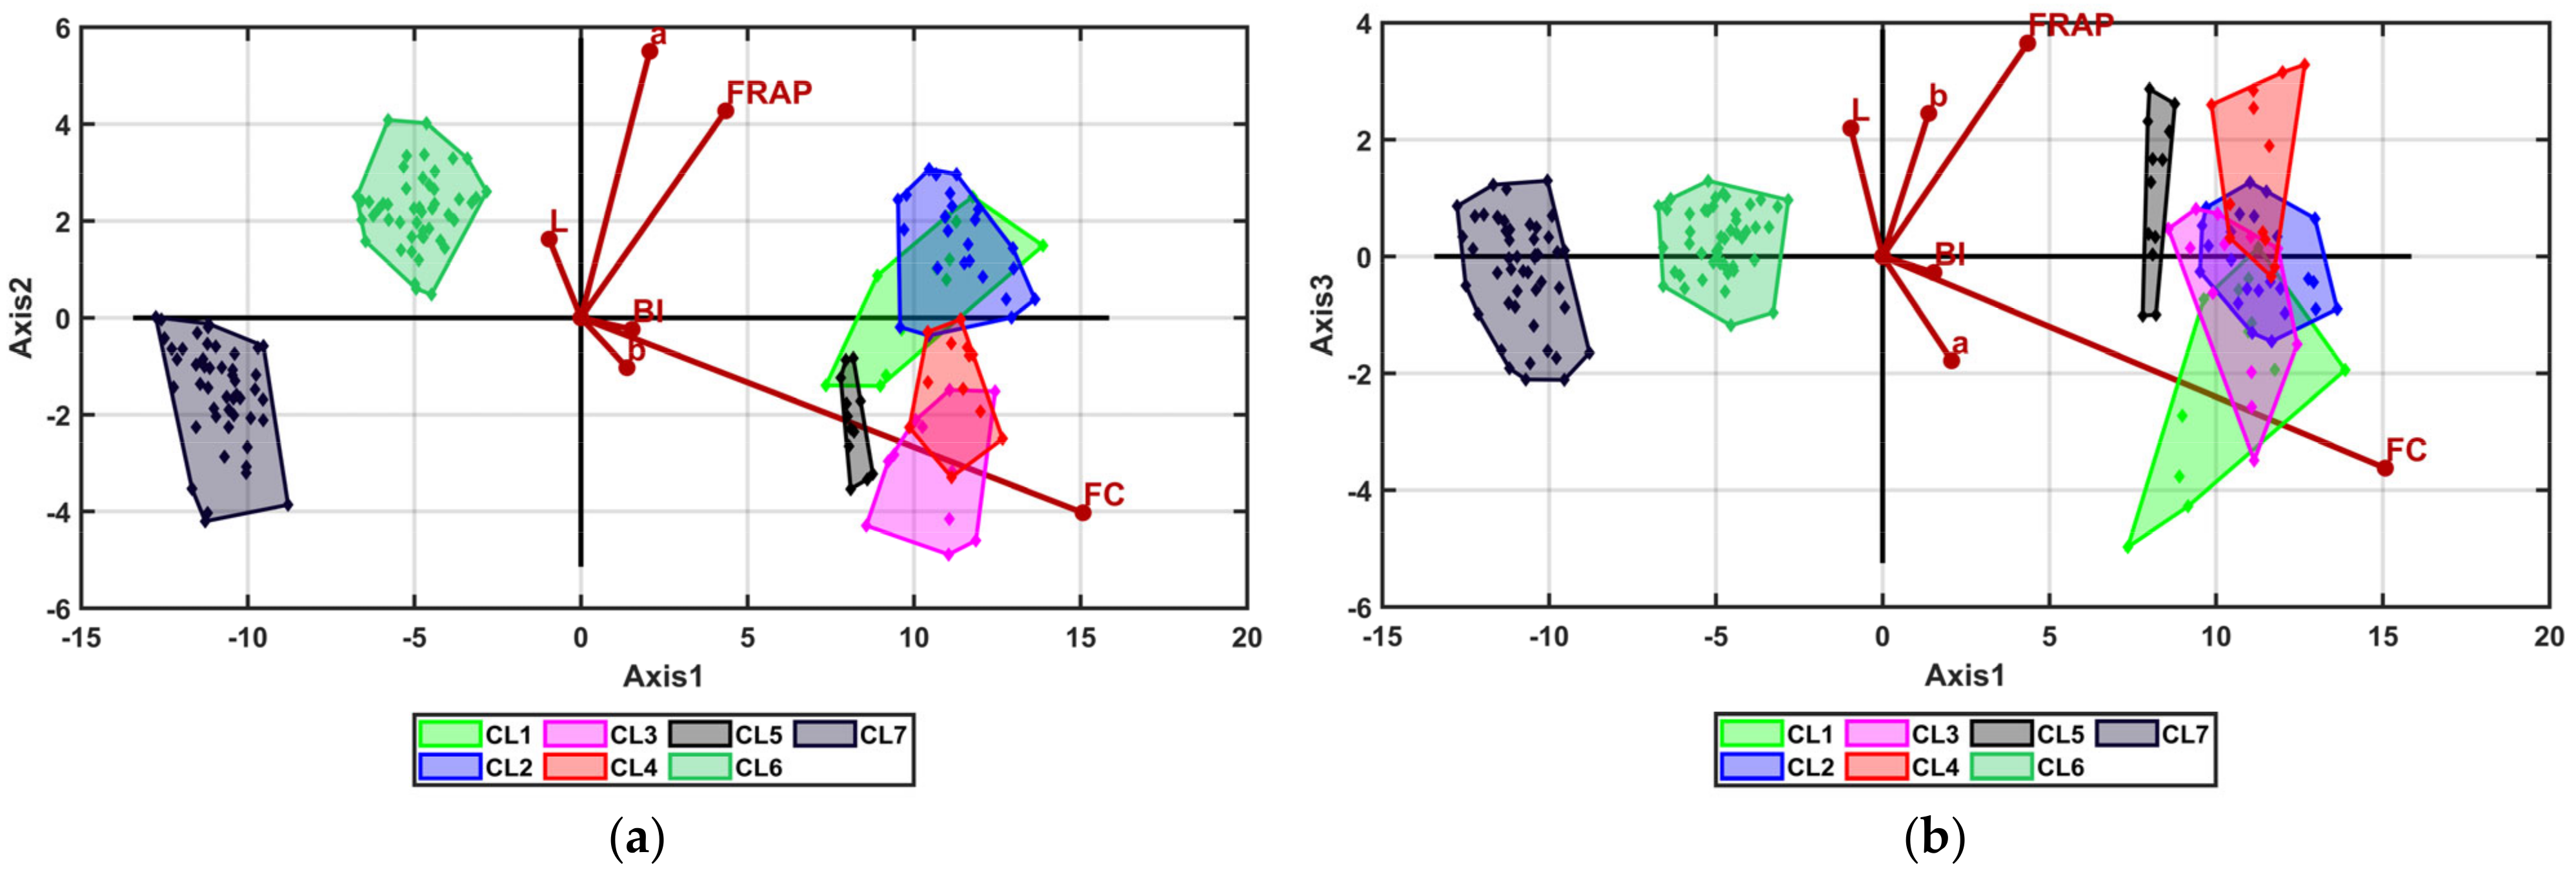
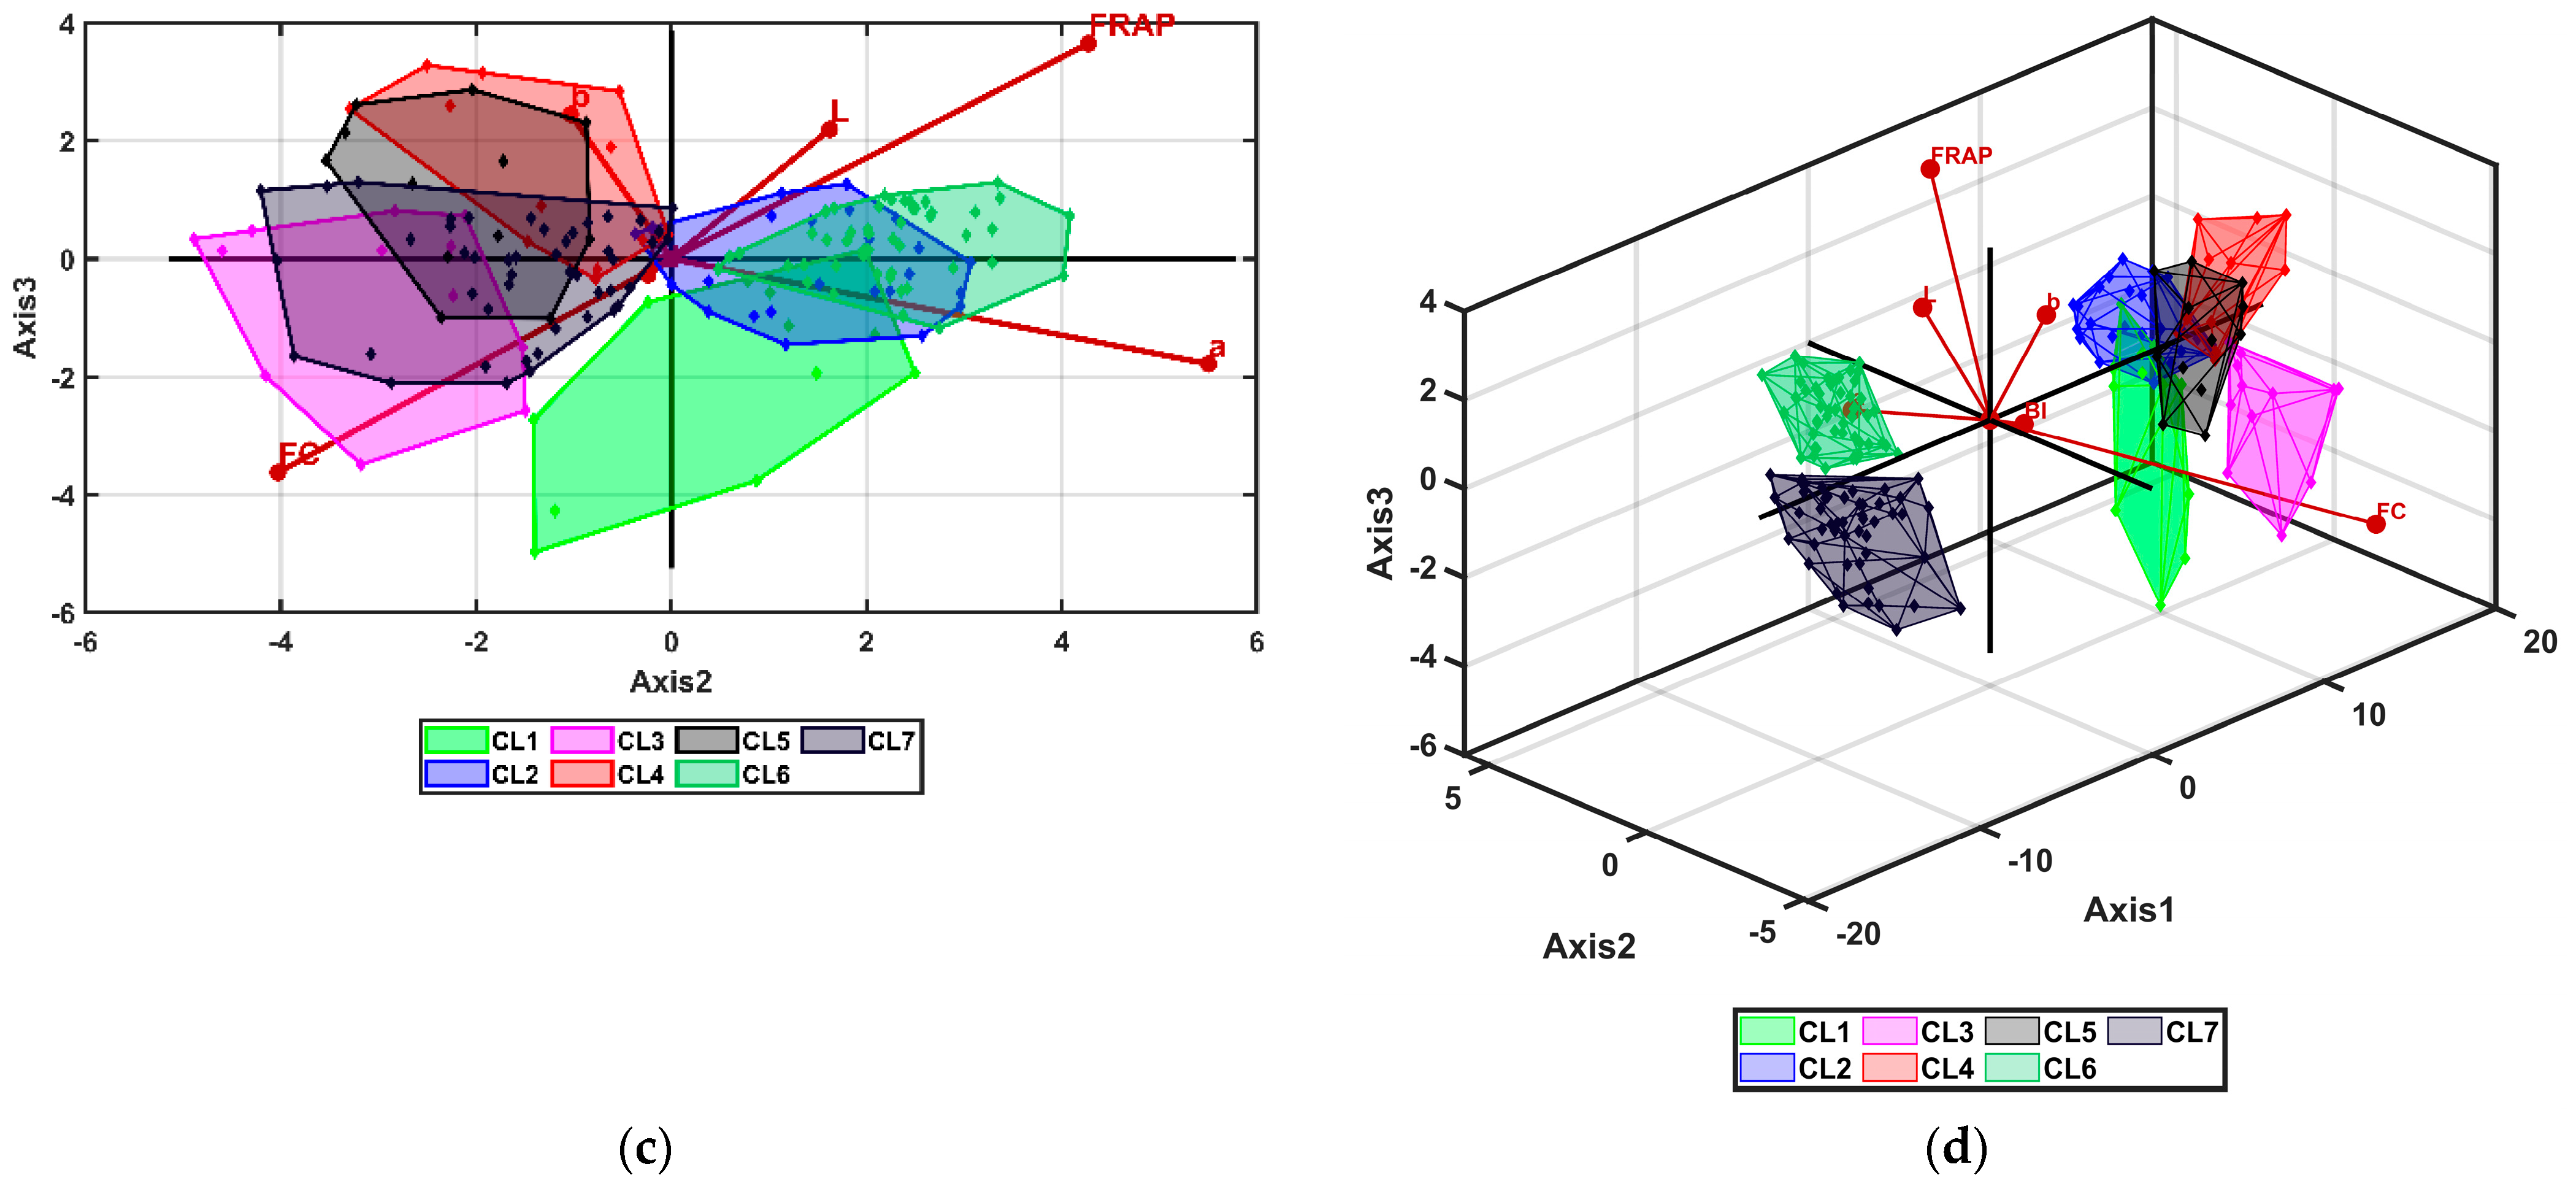
3.3. Multivariate Analysis

For each analyzed sample the chromatic parameters (CIE L*a*b*, and the browning index), and the bioactive compounds (i.e., phenols, antioxidant capacity (FC), with antioxidant activity (FRAP) were determined. For each sample, the values corresponding to these parameters constitute the multivariate sample profile. In order to obtain the sample clusters, multivariate comparison tests between the samples were done based on their profiles. The multivariate sample comparisons were performed with a multivariate sequence that consisted of the following methods: Principal Component Analysis (PCA), Linear Discriminant Analysis (LDA), Multivariate ANOVA (MANOVA) (p = 0.05), and Hierarchical Cluster Analysis (HCA). This multivariate sequence was intended because PCA, LDA, and HCA do not provide results with statistical significances attached. Only the MANOVA method can generate statistical results with statistical significances (p = 0.05) for pairwise comparisons of the samples.
The PCA method emphasizes, on the first principal axis (PC1), the samples with the largest variance and the variables that generate that variance. The second principal axis (PC2) generates the second largest variance samples and variable arrangement, in an orthogonal mode compared to the PC1—and so forth.
The results of the PCA are graphically displayed in Figure 4 as 2D and 3D biplots. The biplots represent, in principal axes, both the samples (as colored convex-hulls) and the variable vectors. In Figure 4, the samples were plotted with colored convex hulls and the variable vectors with lines starting from the center of the principal axes. The variable vector tips are pointing out in the direction with the highest levels of the corresponding variables. In the opposite direction, the lowest levels of the same variables are located. In this way, the orthogonal projection of the sample’s points on the variable’s vectors will generate the PCA multivariate comparisons of the samples. Furthermore, the PCA offers information about the correlations between the variables, based on the multivariate profiles of the samples. The smaller the angle between the variable’s vectors, the higher the correlation of the corresponding variables.
The distribution of the variable vectors from Figure 4a reveals a very important aspect of the DOE, that the lightness, L*, is negatively correlated with the browning index (BI). This result was expected because the unwanted browning process reduces the lightness of the samples. On the other hand, the control/untreated samples, GHu_CTRL_INI, GHu_MW_INI, IRo_CTRL_INI, and IRo_MW_INI, have the points with geometrical projections situated on the tip of the lightness, L* (i.e., the highest levels of L*) and situated in the opposite direction of the browning index (BI) (i.e., the lowest levels of BI). This last result should be interpreted as a relative multivariate comparison between the samples analyzed. All the other samples are situated at the opposite location in relation to the L* and BI vectors. The chromatic vectors a* and b* show the IRo and GHu cultivars, respectively. The IRo cultivar is a red apple and that is the reason the samples are pointed out by the a* chromatic vector—a* chromatic positive values denote the red hues. In the same way the b* chromatic vector points out the GHu cultivar samples that is a yellow apple—b* chromatic positive values denote the yellow hues.
The bioactive compound vectors, FRAP and FC, point out the microwave treated samples (MW_MW) for both analyzed cultivars, GHu and IRo. The control/untreated samples are placed at the opposite directions of the tips of these vectors. As regards the phenolic content, all samples taken from the IRo cultivar have a higher content than the samples from the GHu cultivar. Furthermore, the MW treated apple sample that has the best multivariate profile of chromatic and phenolic content is the IRo_MW_MW_t3, followed by IRo_MW_MW_t4 and IRo_MW_MW_t5; the next samples are GHu_MW_MW_t3, followed by GHu_MW_MW_t4, and GHu_MW_MW_t5.
The PCA results (Figure 4) suggest that there is a possible clustering of the samples; two separate groups are emphasized: first, GHu_CTRL_INI and all GHu_MW_INI and second, IRo_CTRL_INI and all IRo_MW_INI samples. The MW treated samples are already clustered in two groups: first, the GHu_MW_MW_t3, t4, t5 samples and second, the IRo_MW_MW_t3, t4, t5 samples. These sample groups are deeply overlapping across the time MW factor levels, and superficially overlapping between the cultivar factor levels. This is the reason why the LDA, MANOVA (p = 0.05), and HCA multivariate methods were used. The aim of these methods was to find out if there was a sample clustering mostly between time MW factor levels (t3, t4, and t5) and secondly between the cultivar factor levels. The LDA multivariate method was applied over the variable values (i.e., multivariate profiles) of all the analyzed samples and variables. This method generates the canonical coordinates of the samples and variables. In this multivariate canonical space, the Euclidean distances between the samples are forced to increase, and consequently a better sample discrimination is achieved. Graphical results of the LDA method are presented in 2D and 3D biplots (Figure 5a,b). The distances between samples are indeed maximized and there are several separations between the samples of time MW factor levels (t3, t4, and t5) and secondly between the cultivar factor levels.
The canonical coordinates of the samples are used to calculate multiple pairwise comparisons with the MANOVA (p = 0.05) method. The statistical significances of the comparisons are presented in Table 8. The comparisons that achieved higher p-values than p = 0.05 denote that the involved samples have no statistically significant differences of the multivariate profiles (i.e., are components of the same cluster)—these cases were marked with red for the background.
The results of the graphic representation of the MANOVA and HCA methods are presented in Figure 6 and Figure 7.
The HCA dendrogram shows the clustering dynamics that at first separates the untreated samples from the MW treated samples (i.e., the levels of the phase factor). Next, both the untreated and the MW treated samples are separated by the levels of cultivar factor. In this step, the untreated samples are finally separated. Furthermore, the separation is made by levels of the time MW factor levels. Heatmap from Figure 7 also shows how the variables contribute to the clustering process of the samples. In this way, the final results of the overall multivariate analysis are presented in Table 9 as cluster sample content; in addition, they are presented graphically in Figure 8. All the multivariate results, and, therefore, the conclusions, have a 95% accuracy, as a result of the MANOVA method, p = 0.05.

4. Conclusions

In this study we analyzed the relationship between the drying conditions and the quality of the processed apples, especially their phenolic content, color change, and browning index. Two apple cultivars (Golden and Idared) were treated in the microwave oven at 450 W for three, four, and five minutes, respectively, to partially avoid the browning process. Results of the chromatic image analysis included CIELab parameters and an estimation of the apple slices’ browning index (BI) throughout the MW and OV processes.
Comparing the two cultivars under investigation, the Idared apple has more phenols than the Golden apple. Total phenolic content and antioxidant capacity also showed significant increases after MW treatment as compared to the start of the study. This study determined the optimum processing conditions, including processing duration, for apples in order to produce a high-quality, visually pleasing end product that retains its original attributes. According to our results, both cultivars of apple slices had a significant increase in total phenolic content and antioxidant activity after MW treatment at 450 W for four minutes.

Supplementary Materials

The following supporting information can be downloaded at: https://www.mdpi.com/article/10.3390/pr11061601/s1, Figure S1: The apple slices before (a) and after (b) MW treatment. (c) The drying apple slices in the oven at 40 °C; Figure S2: Graphical comparison of chromatic parameters, L*, a*, b*, and BI, calculated for factor Cultivar*Sample*Phase*time MW levels. Figure S3: Graphical comparison of bioactive compounds parameters, FRAP and FC, calculated for factor Cultivar*Sample*Phase*time MW levels. Figure S4: Graphical comparisons of the results of the nonlinear regression of the FRAP (a), FC (b), and BI (c) time series for Cultivar factor levels.

Author Contributions

Conceptualization, L.B., T.L., S.I.V. and F.I.H.; methodology, V.D.S., M.N.A., C.A.D. and C.O.M.; experimental system setup F.I.H. and M.N.A., experimental validation and sampling during experiment, V.D.S., M.N.A., C.A.D., T.L. and C.O.M.; statistical analysis and data software, A.C.T.; formal analysis, S.I.V. and A.C.T.; investigation, S.I.V. and A.C.T.; resources, V.D.S., S.I.V. and A.C.T.; writing—original draft preparation, L.B., S.I.V. and A.C.T.; writing—review and editing, L.B. and S.I.V.; visualization, C.O.M.; supervision, L.B.; project administration, L.B.; funding acquisition, L.B. All authors have read and agreed to the published version of the manuscript.

Funding

This work was co-funded by the University of Oradea from the Research grant no. 127/25.06.2021.

Data Availability Statement

Not applicable.

Acknowledgments

This work was carried out using the equipment purchased through the project POS-CCE 1843/48800, Increasing the capacity of research-development of the interdisciplinary laboratories for the technologies in electrical engineering, funded by the European Regional Development Fund through the Sectoral Operational Program Increase of the Economic Competitiveness–POS-CCE 2007-2013.

Conflicts of Interest

The authors declare no conflict of interest.

References

  1. Cömert, E.D.; Mogol, B.A.; Gökmen, V. Relationship between color and antioxidant capacity of fruits and vegetables. Curr. Res. Food Sci. 2020, 2, 1–10. [Google Scholar] [CrossRef] [PubMed]
  2. Al Juhaimi, F.; Uslu, N.; Bozkurt, D.; Ghafoor, K.; Babiker, E.E.; Özcan, M.M. Effects of oven and microwave drying on phenolic contents and antioxidant activities in four apple cultivars. Qual. Assur. Saf. Crop. Foods 2016, 8, 51–55. [Google Scholar] [CrossRef]
  3. Szychowski, P.J.; Lech, K.; Sendra-Nadal, E.; Hernández, F.; Figiel, A.; Wojdyło, A.; Carbonell-Barrachina, A.A. Kinetics, biocompounds, antioxidant activity, and sensory attributes of quinces as affected by drying method. Food Chem. 2018, 255, 157–164. [Google Scholar] [CrossRef]
  4. Xu, Y.; Xiao, Y.; Lagnika, C.; Song, J.; Li, D.; Liu, C.; Jiang, N.; Zhang, M.; Duan, X. A comparative study of drying methods onphysical characteristics, nutritional properties and antioxidant capacity of broccoli. Dry. Technol. 2020, 38, 1378–1388. [Google Scholar] [CrossRef]
  5. Wang, R.; Ding, S.; Zhao, D.; Wang, Z.; Wu, J.; Hu, X. Effect of dehydration methods on antioxidant activities, phenolic contents, cyclic nucleotides, and volatiles of jujube fruits. Food Sci. Biotechnol. 2016, 25, 137–143. [Google Scholar] [CrossRef] [PubMed]
  6. Bhattacharya, M.; Punathil, L.; Basak, T. A theoretical analysis on the effect of containers on the microwave heating of materials. Int. Communic. Heat Mass Transf. 2017, 82, 145–153. [Google Scholar] [CrossRef]
  7. Yao, L.; Fan, L.; Duan, Z. Effect of different pretreatments followed by hot-air and far-infrared drying on the bioactive compounds, phsicochemical property and microstructure of mango slices. Food Chem. 2020, 305, 125477. [Google Scholar] [CrossRef]
  8. Doymaz, I. Effect of citric acid and blanching pre-treatments on drying and rehydration of Amasya red apples. Food Bioprod. Process. 2010, 88, 124–132. [Google Scholar] [CrossRef]
  9. Kingsly, R.P.; Goyal, R.K.; ManiKaantan, M.R.; Ilyas, S.M. Effects of pre-treatments and drying air temperature on drying behaviour of peach slice. Int. J. Food Sci. Tecnol. 2007, 42, 65–69. [Google Scholar] [CrossRef]
  10. Onwude, D.I.; Hashim, N.; Chen, G. Recent advances of novel thermal combined hot air drying of agricultural crops. Trends Food Sci. Technol. 2016, 57, 132–145. [Google Scholar] [CrossRef]
  11. Ekezie, F.G.C.; Sun, D.W.; Han, Z.; Cheng, J.H. Microwave-assisted food processing technologies for enhancing product quality and process efficiency. A review of recent developments. Trends Food Sci. Technol. 2017, 67, 58–69. [Google Scholar] [CrossRef]
  12. Fathi-Achachlouei, B.; Azadmard-Damirchi, S.; Zahedi, Y.; Shaddel, R. Microwave pretreatment as a promising strategy for increment of nutraceutical content and extraction yield of oil from milk thistle seed. Ind. Crop. Prod. 2019, 128, 527–533. [Google Scholar] [CrossRef]
  13. Nowacka, M.; Wiktor, A.; Anuszewska, A.; Dadan, M.; Rybak, K.; Witrowa-Rajchert, D. The application of unconventional technologies as pulsed electric field ultrasound and microwave-vacuum drying in the production of dried cranberry snacks. Ultrason. Sonochem. 2019, 56, 1–13. [Google Scholar] [CrossRef]
  14. Chahbani, A.; Fakhfakh, N.; Balti, M.A.; Mabrouk, M.; El-Hatmi, H.; Zouari, N.; Kechaou, N. Microwave drying effects on drying kinetics, bioactive compounds and antioxidant activity of green peas (Pisum sativum L.). Food Biosci. 2018, 25, 32–38. [Google Scholar] [CrossRef]
  15. Aguilera, J.M.; Lillford, P.J. Structure property relationships in foods. In Food Materials Science; Springer: Berlin/Heidelberg, Germany, 2008; pp. 229–253. [Google Scholar]
  16. López-Fernández, O.; Bohrer, B.M.; Munekata, P.E.S.; Domínguez, R.; Pateiro, M.; Lorenzo, J.M. Improving oxidative stability of foods with apple-derived polyphenols. Compr. Rev. Food Sci. Food Saf. 2022, 21, 296–320. [Google Scholar] [CrossRef] [PubMed]
  17. Talebzadeh, S.L.; Fatemi, H.; Azizi, M.; Kaveh, M.; Nik, A.S.; Szymanek, M.; Kulig, R. Interaction of Different Drying Methods and Storage on Appearance, Surface Structure, Energy, and Quality of Berberis vulgaris var. asperma. Foods 2022, 11, 3003. [Google Scholar] [CrossRef]
  18. Sablani, S. Drying of Fruits and Vegetables: Retention of Nutritional/Functional Quality. Dry. Technol. 2006, 24, 123–135. [Google Scholar] [CrossRef]
  19. Barsa, C.; Normand, M.; Peleg, M. On Models of the Temperature Effect on the Rate of Chemical Reaction and Biological Processes in Foods. Food Eng. Rev. 2012, 4, 191–202. [Google Scholar] [CrossRef]
  20. Defraeye, T. Towards more efficient intermittent drying of fruit: Insight from combined hygrothermal-quality modelling. Innov. Food Sci. Emerg. Technol. 2016, 38, 262–271. [Google Scholar] [CrossRef]
  21. Indiarto, R.; Asyifaa, A.H.; Adiningsih, F.C.A.; Aulia, G.A.; Achmad, S.R. Conventional And Advanced Food-Drying Technology: A Current Review. Int. J. Sci. Technol. Res. 2021, 10, 99–107. [Google Scholar]
  22. Rahman, M.S. Handbook of Food Preservation, 3rd ed.; Taylor & Francis Group: Abingdon, UK, 2020; ISBN 978-1-4987-4048-7. [Google Scholar]
  23. Sinha, N.K.; Sidhu, J.; Barta, J.; Wu, J.; Pilar Cano, M. Handbook of Fruits and Fruit Processing, 2nd ed.; Wiley-Blackwell: South Gate, CA, USA, 2012; ISBN 978-081308949. [Google Scholar]
  24. Önal, B.; Adiletta, G.; Di Matteo, M.; Russo, P.; Ramos, I.N.; Silva, C.L.M. Microwave and Ultrasound Pre-Treatments for Drying of the “Rocha” Pear: Impact on Phytochemical Parameters, Color Changes and Drying Kinetics. Foods 2021, 10, 853. [Google Scholar] [CrossRef] [PubMed]
  25. Metaxas, A.C.; Meredith, R.J. Industrial Microwave Heating; Peter Peregrinus Ltd. (IEE): London, UK, 1983. [Google Scholar]
  26. Decareau, R.V.; Peterson, R.A. Microwave Processing and Engineering; Ellis Horwood Ltd. & VCH Publisher: Deerfield Beach, FL, USA, 1986; ISBN 978-3527262106. [Google Scholar]
  27. Prusky, D. Reduction of incidence of postharvest quality losses, and future prospects. Food Secur. 2011, 3, 463–474. [Google Scholar] [CrossRef]
  28. Singleton, V.L.; Orthofer, R.; Lamuela-Raventós, R.M. Analysis of total phenols and other oxidation substrates and antioxidants by means of Folin-Ciocalteu reagent. In Methods in Enzymology; Oxidants and Antioxidants Part A; Academic Press: Cambridge, MA, USA, 1999; Volume 299, pp. 152–178. [Google Scholar]
  29. Bandici, L.; Teuşdea, A.; Milian Pavel, O.; Ramona Memete, A.; Ioana Vicas, S.; Vasile Timar, A.; Emil Bandici, G. The Use of Microwaves in the Process of Reducing the Browning of Apple Slices. In Proceedings of the International Conference on Engineering of Modern Electric Systems (EMES), Oradea, Romania, 10–11 June 2021. [Google Scholar]
  30. Benzie, I.F.F.; Strain, J.J. The ferric reducing ability of plasma (FRAP) as a measure of “antioxidant power”: The FRAP assay. Anal. Biochem. 1996, 239, 70–76. [Google Scholar] [CrossRef] [PubMed]
  31. Bandici, L.; Teusdea, A.C.; Soproni, V.D.; Hathazi, F.I.; Arion, M.N.; Molnar, C.O.; Vicas, S.I. The Influence of Microwave Treatments on Bioactive Compounds and Antioxidant Capacity of Mentha piperita L. Materials 2022, 15, 7789. [Google Scholar] [CrossRef]
  32. Lunadei, L.; Diezma Iglesias, B.; Lleó García, L.; Galleguillos, P. Enzymatic Browning in Fresh-Cut Apple Slices Measured by Different Kinds of Image Algorithms. In Proceedings of the Vi Congreso Iberico de Agrolngenieria, Évora, Portugal, 5–7 September 2011. [Google Scholar]
  33. Lu, S.; Luo, Y.; Turner, E.; Feng, H. Efficacy of sodium chlorite as an inhibitor of enzymatic browning in apple slices. Food Chem. 2007, 104, 824–829. [Google Scholar] [CrossRef]
  34. Memete, A.R.; Sărac, I.; Teusdea, A.C.; Budău, R.; Bei, M.; Vicas, S.I. Bioactive Compounds and Antioxidant Capacity of Several Blackberry (Rubus spp.) Fruits Cultivars Grown in Romania. Horticulturae 2023, 9, 556. [Google Scholar] [CrossRef]
  35. Zhang, S.; Zhang, R. Effects of Microwave Pretreatment of Apple Raw Material on the Nutrients and Antioxidant Activities of Apple Juice. J. Food Proc. 2014, 2014, e824050. [Google Scholar] [CrossRef]
  36. Hayat, K.; Zhang, X.; Farooq, U.; Abbas, S.; Xia, S.; Jia, C.; Zhong, F.; Zhang, J. Effect of Microwave Treatment on Phenolic Content and Antioxidant Activity of Citrus Mandarin Pomace. Food Chem. 2010, 123, 423–429. [Google Scholar] [CrossRef]
Figure 1. Experimental design (DOE).
Processes 11 01601 g001
Figure 2. Graphic comparisons of the main effects of the analyzed factors (cultivar, sample, phase and, microwave time) for chromatic parameters, L*, a*, b*, and BI. The red dotted line represents the DOE grand mean. (a) the main effects given by the chromatic parameter L*; (b) the main effects given by the chromatic parameter a*; (c) the main effects given by the chromatic parameter b*; (d) the main effects given by the browning index (BI). GHu—Golden apple cultivar; IRo—Idared apple cultivar; CTRL—control sample, MW—microwave treatment; OV—oven treatment; t0, t3, t4, and t5—the time of treatment, without, with 3 min, 4 min, and 5 min, respectively.
Processes 11 01601 g002aProcesses 11 01601 g002b
Figure 3. Graphic comparisons of the main effects of the analyzed factors for antioxidant capacity (using FRAP assay) (a), and for total phenolic content (FC) (b). The red dotted line represents the DOE grand mean. GHu—Golden apple cultivar; IRo—Idared apple cultivar; CTRL—control sample, MW—microwave treatment; OV—oven treatment; t0, t3, t4, and t5—the time of treatment, without, with 3 min, 4 min, and 5 min, respectively.
Processes 11 01601 g003
Figure 4. Biplots of the PCA results: (a) 2D representation for PC1 and PC2 principal components; (b) 2D representation for PC1 and PC3 principal components; (c) 2D representation for PC2 and PC3 principal components and (d) 3D representation for PC1, PC2, and PC3 principal components. The rendering colors for the samples convex-hulls are arbitrary and are used only to visually discriminate the samples.
Processes 11 01601 g004
Figure 5. Biplots of the LDA results: (a) 2D representation for Axis1 and Axis2 canonical components; (b) 3D representation for Axis1, Axis2, and Axis3 canonical components. The rendering colors for the samples convex-hulls are arbitrary and are used only to visually discriminate the samples.
Processes 11 01601 g005
Figure 6. Cluster analysis of the HCA results: dendrogram representation of sample groups with the cut-off red line that generates the clusters. Different colors for grouping horizontal lines denote a sample cluster.
Processes 11 01601 g006
Figure 7. Cluster analysis of the MANOVA (p = 0.05) results: heatmap representation of sample groups. Different colors for grouping horizontal lines denote a sample cluster.
Processes 11 01601 g007
Figure 8. Biplots of the LDA results with emphasize on the clusters: (a) 2D representation for Axis1 and Axis2 canonical components; (b) 2D representation for Axis1 and Axis3 canonical components; (c) 2D representation for Axis2 and Axis3 canonical components; (d) 3D representation for Axis1, Axis2, and Axis3 canonical components. The rendering colors for the clusters convex-hulls are arbitrary and are used only to visually discriminate the samples.
Processes 11 01601 g008aProcesses 11 01601 g008b
Table 1. DOE coding of apple chip samples. (Phase marked with “x” was applied and phase with “-” was not applied to the sample.).
PhaseINIMWOVExplanation
Sample Index
GHu_CTRL_INIx--untreated GHu, CTRL sample
GHu_CTRL_OV--xOV treated GHu, CTRL sample
GHu_MW_INIx--untreated GHu, MW sample
GHu_MW_MW_tX-x-MW treated GHu sample with tX minutes
GHu_MW_OV_tX-xxMW treated GHu sample with tX minutes and after OV treatment
IRo_CTRL_INIx--untreated IRo, CTRL sample
IRo_CTRL_OV--xOV treated IRo, CTRL sample
IRo_MW_INIx--untreated IRo, MW sample
IRo_MW_MW_tX-x-MW treated IRo sample with tX minutes
IRo_MW_OV_tX-xxMW treated IRo sample with tX minutes, and after OV treatment
Table 2. Chromatic parameters, including the browning index (BI) calculated for the interaction factor Cultivar*Sample*Phase*time MW levels. Data are displayed as mean and standard deviation. Pairwise comparisons of the means were done after four-way ANOVA (p = 0.05) with post-hoc Dunn–Sidak test (p = 0.05)—different letters describe statistically significant different means.
Cultivar*Sample*
Phase*Time MW
RGBL*a*b*BI
GHu_CTRL_INI213.90 a
± 9.82
196.20 a
± 7.82
144.62 a
± 10.58
79.30 a
± 3.20
−9.37 h
± 1.23
1.95 d,e,f ± 3.4532.41 h
± 2.88
GHu_MW_INI_t3205.89 a,b ± 13.60187.50 a,b ± 12.49136.19 a,b ± 15.3675.88 a,b
± 5.00
−8.67 h
± 1.10
3.28 d,e,f
± 4.72
34.48 g,h
± 4.12
GHu_MW_INI_t4199.43 a,b
± 16.09
182.17 a,b ± 15.16129.45 b
± 17.57
73.72 a,b
± 6.02
−9.01 h
± 0.90
4.73 d,e
± 3.77
35.46 e,f,g,h
± 4.23
GHu_MW_INI_t5203.30 a,b
± 8.90
184.49 a ± 8.19135.24 a,b ± 6.9574.69 a,b
± 3.29
−8.16 g,h
± 1.01
2.57 d,e,f
± 1.60
34.58 f,g,h
± 1.90
GHu_MW_MW_t3161.46 e,f,g
± 6.16
145.37 d,e,f
± 5.47
88.89 d
± 14.74
60.49 e,f
± 2.20
−8.32 g,h
± 0.97
12.67 b,c
± 7.12
43.70 d,e,f,g
± 7.75
GHu_MW_MW_t4166.60 e,f,g
± 6.95
147.44 d,e,f
± 5.12
82.73 d
± 12.96
61.43 e,f
± 2.11
−7.95 f,g,h
± 1.00
17.62 b
± 6.59
49.47 c,d,e
± 7.14
GHu_MW_MW_t5171.16 d,e,f
± 6.00
150.75 d,e,f
± 3.58
88.55 d
± 11.17
62.84 d,e,f
± 1.55
−7.35 e,f,g,h
± 1.20
15.76 b
± 6.17
48.17 c,d,e,f
± 6.21
GHu_CTRL_OV200.26 a,b
± 6.43
170.75 b,c
± 7.65
98.48 c,d
± 12.59
70.86 b,c
± 2.66
−5.65 c,d,e,f
± 1.79
19.41 a,b
± 4.34
53.07 b,c,d
± 5.81
GHu_MW_OV_t3143.13 g
± 3.91
119.05 g
± 6.96
49.83 e
± 20.06
50.95 h
± 2.44
−4.19 c,d
± 1.41
24.75 a
± 8.95
64.41 a,b
± 12.54
GHu_MW_OV_t4156.98 f,g
± 7.21
129.21 g
± 9.01
51.02 e
± 22.85
55.15 g,h
± 3.37
−3.94 c,d
± 1.00
28.52 a
± 9.02
67.78 a
± 11.08
GHu_MW_OV_t5153.97 f,g ± 11.96126.46 g
± 14.70
55.70 e
± 29.86
54.14 g,h
± 5.48
−3.21 b,c
± 1.71
24.82 a
± 11.60
65.55 a
± 15.43
IRo_CTRL_INI211.72 a,b ± 8.19183.97 a,b
± 9.66
137.17 a,b
± 10.36
75.92 a,b
± 3.40
−4.44 c,d
± 2.01
2.63 d,e,f
± 3.03
38.81 e,f,g,h
± 5.34
IRo_MW_INI_t3215.61 a,b ± 5.42190.59 a
± 6.77
144.43 a
± 8.85
78.13 a,b
± 2.35
−5.77 c,d,e
± 1.17
0.71 f
± 2.90
35.16 g,h
± 4.09
IRo_MW_INI_t4213.25 a,b ± 6.26188.71 a
± 6.86
143.37 a
± 7.52
77.41 a
± 2.44
−5.77 d,e,f,g
± 1.27
0.46 f
± 2.04
34.97 g,h
± 3.66
IRo_MW_INI_t5213.83 a
± 6.33
188.21 a
± 9.09
142.57 a,b
± 10.29
77.34 a
± 3.04
−5.36 c,d,e
± 1.81
0.94 e,f
± 2.95
35.95 e,f,g,h
± 5.04
IRo_MW_MW_t3172.44 d,e
± 8.15
150.17 d,e,f
± 7.14
107.90 c
± 10.11
63.08 d,e,f
± 2.88
−4.52 c,d
± 1.09
4.25 d,e
± 4.31
39.78 d,e,f,g,h
± 4.79
IRo_MW_MW_t4176.95 d,e
± 5.66
155.31 c,d,e
± 3.37
107.61 c
± 5.87
64.67 c,d,e,f
± 1.64
−5.41 c,d,e
± 1.18
6.61 c,d
± 2.86
41.12 d,e,f,g,h ± 2.69
IRo_MW_MW_t5182.51 c,d
± 5.48
155.93 c,d
± 5.73
106.52 c
± 7.92
65.55 c,d,e
± 1.97
−3.82 c,d
± 1.72
8.34 c,d
± 3.92
45.38 d,e,f,g,h
± 5.48
IRo_CTRL_OV192.28 b,c
± 18.34
153.83 c,d
± 18.80
96.01 c,d
± 17.95
65.59 c,d
± 6.86
0.25 a
± 1.97
15.47 b
± 3.12
58.31 a,b,c
± 6.06
IRo_MW_OV_t3172.34 d,e
± 9.71
137.24 f,g
± 13.92
83.73 d
± 23.68
59.33 f,g,h
± 4.94
0.44 a
± 2.43
15.09 b
± 9.02
59.03 a,b,c
± 13.65
IRo_MW_OV_t4172.74 d,e
± 12.08
139.37 e,f,g
± 14.16
80.76 d
± 24.45
59.82 e,f,g
± 5.26
−0.85 a,b
± 1.40
17.42 b
± 8.82
59.72 a,b,c
± 11.86
IRo_MW_OV_t5179.25 d,e
± 6.45
145.98 d,e,f
± 8.57
91.86 d
± 16.65
62.39 d,e,f
± 3.06
−0.96 a
± 0.84
13.80 b
± 6.85
55.34 a,b,c
± 8.39
The abbreviations of the samples are given in Table 1; L*, a*, b*—chromatic parameters; BI—browning index.
Table 3. Biochemical parameters, calculated for the interaction factor Cultivar*Sample*Phase*time MW levels. Data are displayed as mean and standard deviation. Pairwise comparisons of the means were done after four-way ANOVA (p = 0.05) with post-hoc Dunn–Sidak test (p = 0.05)—different letters describe statistically significant different means.
Cultivar*Sample
*Phase*Time MW
FRAP (µmol TE/100 g)FC (mg GAE/100 g)
GHu_CTRL_INI62.42 g ± 3.1218.47 e ± 0.96
GHu_MW_INI_t362.61 g ± 6.8918.30 e ± 0.91
GHu_MW_INI_t462.58 g ± 2.9218.47 e ± 0.96
GHu_MW_INI_t562.42 g ± 5.8718.30 e ± 0.91
GHu_MW_MW_t375.75 c,d ± 1.8027.77 c ± 2.11
GHu_MW_MW_t476.35 b,c ± 1.4527.44 c ± 0.15
GHu_MW_MW_t578.24 a,b ± 1.1227.30 b,c ± 1.73
IRo_CTRL_INI68.83 e,f ± 1.5518.61 d ± 2.04
IRo_MW_INI_t368.67 f ± 1.9418.44 d ± 2.63
IRo_MW_INI_t468.79 e,f ± 0.6918.49 d ± 3.41
IRo_MW_INI_t568.92 d,e ± 1.4518.63 d ± 1.99
IRo_MW_MW_t376.24 a ± 4.7528.64 a,b ± 0.58
IRo_MW_MW_t479.20 a ± 0.6029.52 a ± 0.84
IRo_MW_MW_t579.41 a,b ± 1.3028.36 a,b,c ± 1.19
Table 4. Results of the nonlinear regression of the FRAP time series for cultivar factor levels.
FRAP (umol TE/100 g)GHuIRo
Inverse Gaussian FunctionY = Ymax − k1 × exp ((−1) × X2/(k22))
Best-fit values
Ymax77.7380.33
k114.789.782
k22.2183.043
Std. Error
Ymax0.38541.283
k10.54821.397
k20.14670.5572
Goodness of fit
Degrees of freedom4545
R square0.95290.6799
Adjusted R square0.95090.6656
Table 5. Results of the nonlinear regression of the FC time series for cultivar factor levels.
FC (mg GAE/100 g)GHuIRo
Inverse Gaussian functionY = Ymax − k1 × exp((−1) × X2/(k22))
Best-fit values
Ymax28.628.95
k110.148.012
k21.6671.795
Std. Error
Ymax0.15550.1087
k10.27850.1842
k20.064650.06026
Goodness of fit
Degrees of freedom5757
R square0.95890.9708
Adjusted R square0.95740.9698
Table 6. Results of the nonlinear regression of the BI time series for cultivar factor levels.
BIGHuIRo
Inverse Gaussian functionY = Ymax − k1 ×exp ((−1) × X2/(k22))
Best-fit values
Ymax50.3845.230
k116.259.250
k22.9853.881
Std. Error
Ymax1.3921.159
k12.0511.455
k20.45720.679
Goodness of fit
Degrees of freedom5757
R square0.54350.4407
Adjusted R square0.52750.4211
Table 7. Results of the asymptotic starting time stamp from nonlinear regression of the FRAP, FC, and BI time series for cultivar factor levels.
TimeMW (min)GHuIRo
FRAP6.576.87
FC4.754.95
BI8.3410.15
Table 8. Statistical significance p-values generated by the MANOVA (p = 0.05) method in the post-hoc pairwise multiple comparisons. The number bolded and with red background color prescribe no statistically significant difference between the means of the corresponding compared samples.
MANOVA,
p-Values
GHu_CTRL_INIGHu_MW_INI_t3GHu_MW_INI_t4GHu_MW_INI_t5GHu_MW_MW_t3GHu_MW_MW_t4GHu_MW_MW_t5IRo_CTRL_INIIRo_MW_INI_t3IRo_MW_INI_t4IRo_MW_INI_t5IRo_MW_MW_t3IRo_MW_MW_t4IRo_MW_MW_t5
GHu_CTRL_INI 0.33660.04160.08370.00000.00000.00000.00000.00000.00000.00000.00000.00000.0000
GHu_MW_INI_t30.3366 0.75900.74780.00000.00000.00000.00000.00000.00000.00000.00000.00000.0000
GHu_MW_INI_t40.04160.7590 0.46280.00000.00000.00000.00000.00000.00000.00000.00000.00000.0000
GHu_MW_INI_t50.08370.74780.4628 0.00000.00000.00000.00000.00000.00000.00000.00000.00000.0000
GHu_MW_MW_t30.00000.00000.00000.0000 0.00040.00300.00000.00000.00000.00000.00000.00000.0000
GHu_MW_MW_t40.00000.00000.00000.00000.0004 0.00190.00000.00000.00000.00000.00000.00000.0000
GHu_MW_MW_t50.00000.00000.00000.00000.00300.0019 0.00000.00000.00000.00000.00010.00090.0002
IRo_CTRL_INI0.00000.00000.00000.00000.00000.00000.0000 0.42790.43490.76550.00000.00000.0000
IRo_MW_INI_t30.00000.00000.00000.00000.00000.00000.00000.4279 0.99470.98930.00000.00000.0000
IRo_MW_INI_t40.00000.00000.00000.00000.00000.00000.00000.43490.9947 0.99200.00000.00000.0000
IRo_MW_INI_t50.00000.00000.00000.00000.00000.00000.00000.76550.98930.9920 0.00000.00000.0000
IRo_MW_MW_t30.00000.00000.00000.00000.00000.00000.00010.00000.00000.00000.0000 0.00810.0034
IRo_MW_MW_t40.00000.00000.00000.00000.00000.00000.00090.00000.00000.00000.00000.0081 0.0560
IRo_MW_MW_t50.00000.00000.00000.00000.00000.00000.00020.00000.00000.00000.00000.00340.0560
Table 9. AHC results on Axis1-Axis11, MANOVA’s canonical coordinates.
Cluster_1Cluster_2Cluster_3Cluster_4Cluster_5Cluster_6Cluster_7
IRo_MW_MW_t3IRo_MW_MW_t4GHu_MW_MW_t3GHu_MW_MW_t5GHu_MW_MW_t4IRo_CTRL_INIIRo_MW_INI_t4GHu_CTRL_INIGHu_MW_INI_t4
IRo_MW_MW_t5 IRo_MW_INI_t3IRo_MW_INI_t5GHu_MW_INI_t3GHu_MW_INI_t5
Disclaimer/Publisher’s Note: The statements, opinions and data contained in all publications are solely those of the individual author(s) and contributor(s) and not of MDPI and/or the editor(s). MDPI and/or the editor(s) disclaim responsibility for any injury to people or property resulting from any ideas, methods, instructions or products referred to in the content.

