Abstract
The production of titanium dioxide via the sulfuric acid process generates large amounts of acidic wastewater. Investigating the possibility of reusing this wastewater after deep treatment can reduce pollutant discharge and conserve water resources. In a pilot study, a dual-membrane method of ultrafiltration (UF) and reverse osmosis (RO) was employed to perform deep treatments of sulfuric-acid–titanium-dioxide wastewater. The findings showed that the multimedia and precision filters reduced the turbidity of water from an external drainage to as low as 0.18 NTU, with a turbidity removal rate of approximately 50%, reaching a maximum of 68%. When the UF effluent had a membrane flux of 70–100 L/m2 h and a water production rate of 85–90%, the SDI15 was <5.0 and the turbidity was <1.0, meeting RO water supply requirements. Additionally, RO achieved a TDS removal rate of >95%, a CODCr removal rate of 85%, and a desalination rate of >98.5%. At a smooth operation system water recovery rate of 50%, the highest system recovery rate obtained was 64%. The water produced via RO adhered to reuse water standards. UF/RO deep treatment of sulfuric-acid–titanium-dioxide production wastewater and its reuse can realize comprehensive wastewater use and conserve water resources.
1. Introduction
Titanium dioxide is a widely used white pigment with excellent properties and is commonly used in industries related to coatings, plastics, paper, chemical fibers, printing inks, rubbers, and cosmetics, among others. Industrial production processes of titanium dioxide mainly depend on sulfuric acid and chloride methods [1,2]. In China, the sulfuric acid process is widely used owing to its mature technology, simple equipment requirements, and low cost of raw materials, including ilmenite and sulfuric acid. In 2020, the sulfuric acid process accounted for 90% of the total production of titanium dioxide in China and ~50% of the total production of titanium dioxide worldwide. However, the process poses some disadvantages, including long production timelines with only intermittent operation, difficulties in controlling product quality, and emissions of wastewater and byproducts. The amount of discharge wastewater generated per ton of product using the sulfuric acid method is 65–100 m3, which is ~70% higher than that generated per ton of product using the chlorination method [3,4]. Nevertheless, by reusing a large amount of wastewater, the sulfuric acid process can considerably reduce its dependency on water resources [5,6,7].
Wastewater derived from the sulfuric acid processing of titanium dioxide typically has a low pH (1–2) and contains high concentrations of suspended solids, organic compounds, and total dissolved solids (TDSs; primarily Fe2+, Mg2+, Na+, Cl−, SO42−) [8,9]. The main process for treating titanium dioxide wastewater generated during the sulfuric acid process in the middle section is two-stage neutralization and aeration sedimentation. During two-stage neutralization, the first stage uses CaCO3 to neutralize the wastewater pH to 4 before Ca(OH)2 is used in the second stage to attain a pH of 7. Subsequently, compressed air is introduced, flocculants are added, and sedimentation treatment is conducted [10,11,12]. The treated wastewater still contains a certain amount of suspended solids, a small amount of organic matter, and a large amount of TDS, and it is thus still far from reusable.
Reverse osmosis (RO) is a promising treatment method for recycling sulfuric-acid–titanium-dioxide wastewater; the desalination rate generally exceeds 98% for this method [13]. Appropriate pretreatment is necessary before RO to eliminate the fouling of RO membranes by organic matter, particles, and suspended solids in sulfuric-acid–titanium-dioxide wastewater, which can substantially deteriorate membrane performance and shorten the service life of the membrane [14,15]. Compared with conventional filtration (e.g., sand filter), ultrafiltration (UF) technology can effectively remove macromolecules and impurities between 0.001 and 0.1 μm, which is thus a promising pretreatment before the RO unit based on decreasing SDI15 and turbidity [16,17]. To reduce ultrafiltration membrane pollution and extend the service life of the ultrafiltration membrane, it is essential to pretreat the ultrafiltration influent to remove large particles. Many studies have described the use of RO coupled with UF for seawater or brackish water desalination, chemical wastewater treatment, and printing and dyeing wastewater treatment, but only few studies have examined sulfuric-acid–titanium-dioxide wastewater treatment [18,19,20,21].
In this study, the UF/RO dual-membrane method was used for the deep treatment of sulfuric-acid–titanium-dioxide wastewater. The treatment system comprised a multimedia filter, a security filter, a hollow-fiber UF membrane, and an ultralow-pressure RO composite membrane arranged into three membrane elements in one and two stages. The removal effectiveness of each filter and membrane element with respect to pollutants was analyzed. The removal of organic matter by the multimedia filter was studied using three-dimensional fluorescence spectroscopy, and the removal of ions via RO was analyzed using anion chromatography and atomic absorption spectroscopy. The study of optimal operating parameters for UF and RO can provide key technical parameters for engineering applications.
2. Materials and Methods
2.1. Properties of Wastewater
The wastewater treated in this study was generated by a titanium dioxide production enterprise located in Panzhihua, Sichuan Province, hereafter referred to as Enterprise 1. This enterprise used the sulfuric acid method to produce titanium dioxide, and its wastewater was considered representative of the quality of wastewater commonly produced by similar enterprises. Furthermore, Enterprise 1 used the two-stage neutralization and two-stage precipitation method for wastewater treatment; this method is commonly used in domestic sulfuric-acid–titanium-dioxide plants. The first stage of neutralization involved the use of CaCO3 to neutralize the wastewater to pH 4, and the second stage involved the addition of lime milk to further neutralize the wastewater to pH 7. Compressed air was introduced to oxidize part of the Fe2+ in the wastewater to Fe3+ and reduce the chemical oxygen demand by dichromate (CODCr) of the wastewater. Finally, a flocculant was added for two-stage sedimentation. The production wastewater generated during the production process used by Enterprise 1 was highly acidic and contained high concentrations of FeSO4. The external drainage of the enterprise includes the effluent water after neutralization and precipitation treatments. In this study, we used the external drainage of the enterprise as the influent for the double membrane method. Table 1 presents detailed information regarding the water quality of the wastewater treated in this study.

Table 1.
Enterprise 1 water quality.
2.2. Test Flow and Equipment
The experimental flow chart is presented in Figure 1. The experiment focused on the deep treatment of external drainage after the neutralization treatment of titanium dioxide produced through the sulfuric acid process using the UF/RO method. The main pilot plant used for the deep treatment comprised an activated-carbon–quartz-sand double-layer media filter, a precision filter, a UF unit, and an RO unit.
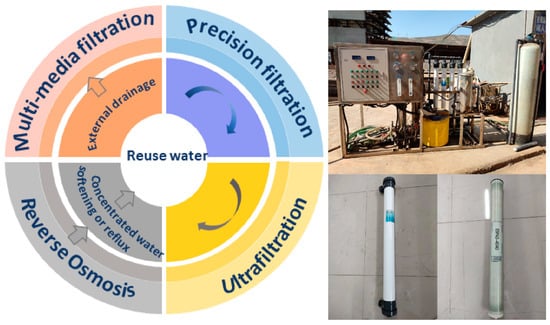
Figure 1.
Experimental flow chart and photographs showing the pilot plant and membranes.
2.2.1. Activated-Carbon–Quartz-Sand Double-Layer Media Filter
The process system was equipped with a pressure-type multimedia filter comprising a glass steel tank with a side-mounted water collector and was filled with an activated-carbon–quartz-sand double-layer filter media. The filter was fitted with a manual control valve enabling switching from filtration mode to positive washing and backwashing modes.
2.2.2. Precision Filter
The pretreated raw water underwent further filtration through a precision filter to ensure that the UF feed water satisfied the requirements of membrane element usage. The precision filter was fitted with five 20-inch polypropylene meltblown cartridges, each with a 5 μm precision rating. Under the influence of filtration pressure, impurities in the original liquid were retained by the polypropylene meltblown cartridge, effectively eliminating suspended materials and fine particles in the water to meet the requirements of the RO membrane component pertaining to incoming water. The polypropylene meltblown cartridge was designed with uniform pore sizes, high filtration precision (5 μm), and strong interception capacity and exhibited acid and alkali resistance and high water flux; moreover, it had low operating costs. It was considered to be the standard configuration for the feed water pretreatment stage in the membrane units of UF, RO, and nanofiltration devices.
2.2.3. Ultrafiltration Unit
The ultrafiltration unit uses an HFUF-IAO90 hollow fiber ultrafiltration membrane module made of PVDF membrane material. Four groups of membrane modules were vertically arranged with an effective membrane area of 10 m2 per single membrane module. The water production flux ranged from 0.5 to 0.7 m3/h, and the MWCO ranged between 50 and 60 kDa (Table 2).
Table 2.
HFUF-IAO90 PVDF membrane parameters.
2.2.4. Reverse Osmosis Unit
The RO rack was fabricated using 304 stainless steel and incorporated a flushing solenoid valve for RO device design. The flushing solenoid valve enabled RO start/stop flushing, automatic flushing, and other critical operational steps. Furthermore, the high-pressure pump was a vertical multistage centrifugal pump made of stainless steel. It elevated the incoming water of the RO unit membrane module to a predetermined pressure suitable for overcoming the osmotic pressure, allowing water molecules to pass through the RO membrane. The RO unit was equipped with the ESPA2-4040 rolled high-desalination-rate polyamide composite membrane (Table 3) and was arranged in two stages; the first stage was connected in parallel with two membrane modules to enhance operational stability.
Table 3.
Reverse osmosis membrane parameters.
2.3. Analytical Methods
Analyses of Na+, Ca2+, Mg2+, Cl−, and SO42− were conducted using a Dionex ICS-1100 ion chromatography instrument (Thermo Fisher Scientific Inc., Waltham, MA, USA). CS12A and AS11-HC columns were used to analyze cations and anions, respectively. Alkalinity concentrations were determined using the acid–base indicator titration method. Furthermore, pH values were measured using a pH meter (PB-10, Sartorius Scientific Instruments Co., Ltd., Gottingen, Germany). An Ultrameter II 6PFC portable multifunctional meter (Myron L Company, Carlsbad, CA, USA) was used to measure TDS. Turbidity measurements were captured using a turbidimeter (TL2310, Hach Company, Loveland, Larimer County, CO, USA). The CODCr (using potassium dichromate (K2Cr2O7) as an oxidant) was measured according to the fast-digestion–spectrophotometric method using a 5B-1F(V8) fast digestion meter (Lianhua Environmental Protection Technology Co., Ltd., Lanzhou, China).
3. Results and Discussion
3.1. UF Pretreatment Operation and Water Quality Analysis
3.1.1. UF Pretreatment and Ultrafiltration Tests
UF pretreatment incorporated two levels of filtration, i.e., using multimedia and precision filters. In the multimedia filter, activated-carbon–quartz-sand filtration media were used to effectively adsorb suspended and organic matter in the incoming water and reduce its turbidity and chromaticity. The precision filter comprised a 5 μm filter element capable of quantitatively filtering suspended matter from the incoming water and guaranteeing the stability of the UF incoming water quality (Figure 2A).
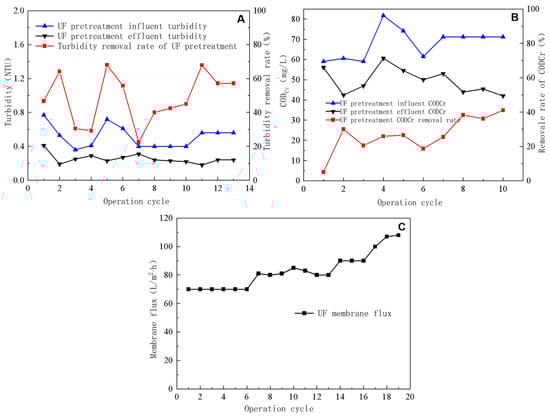
Figure 2.
Removal efficiency of turbidity by ultrafiltration pretreatment (A), impact of ultrafiltration pretreatment on CODCr removal efficiency (B), and ultrafiltration flux (C).
The turbidity levels of the external drainage remained below 0.8 NTU; however, owing to the changing quality of external-drainage water over time, the turbidity of the feed water from UF pretreatment (Figure 2A) fluctuated between 0.3 and 0.8 NTU, with most readings ranging from 0.4 to 0.6 NTU. This suggests that the external drainage suspended matter content remained relatively low. The multimedia and precision filters considerably reduced the turbidity level, usually to <0.4 NTU, with a minimum of 0.18 NTU. The turbidity removal rate averaged ~50%, reaching a maximum of 68%. These results indicate that activated carbon and quartz sand in the multimedia filter removed substantial amounts of particulate and suspended matter from water. The external-drainage CODCr varied from 50 to 75 mg/L, which was reduced to 40–50 mg/L after multimedia and precision filtration. The CODCr removal rate reached ~30%, implying that activated-carbon–quartz-sand moderately affected wastewater CODCr removal (Figure 2B).
During the UF test, the pressure difference across the membrane remained constant, and the UF-produced water was directed into an intermediate tank equipped with a single membrane module. Figure 2C illustrates the UF-concentrated-water flow rate, produced water flow rate, and total flow rate during the test. During the UF test, the concentrated-water flow rate remained constant at ~100 L/h and the total flow rate was 700, 800, 900, and 1000 L/h. Moreover, the membrane flux was 70, 80, 90, and 100 L/m2·h and the water production rate was between 85 and 90%. The operating time for each operation cycle was 5 min.
3.1.2. Effect of UF Flux and Backwashing on the Removal Effect
The ability of UF to remove influent turbidity was evaluated under various membrane flux conditions; the removal rate generally declined with an increasing membrane flux. As illustrated in Figure 3A, the UF influent turbidity following pretreatment ranged between 0.2 and 0.3 NTU, with the UF module membrane flux set at 70 L/m2·h from the first to third operating cycle, 80 L/m2·h from the fourth to ninth cycle, 90 L/m2·h from the tenth to thirteenth cycle, and 100 L/m2·h from the fourteenth to sixteenth cycle. Different membrane flux conditions resulted in the average ultrafiltration effluent turbidity level ranging between 0.12 and 0.14 NTU (at a membrane flux of 70–100 L/m2·h). The removal rate demonstrated a gradual decline as the membrane flux increased, with average turbidity removal rates of 58%, 54%, 22%, and 32% at membrane fluxes of 70, 80, 90, and 100 L/m2·h, respectively.
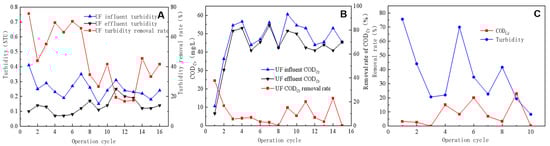
Figure 3.
Efficiency of ultrafiltration in removing turbidity from inlet and outlet water (A), CODCr removal efficiency of ultrafiltration effluent (B), and the impact of backwashing on CODCr and turbidity removal efficiency (C).
Figure 3B illustrates the changes in CODCr and removal rate of the UF inlet and outlet water. The membrane fluxes used were 70 L/m2·h from the first to fifth operation cycle, 80 L/m2·h from the sixth to tenth cycle, 90 L/m2·h from the eleventh to thirteenth cycle, and 108 L/m2·h from the fourteenth to fifteenth cycle. At a membrane flux of 70 L/m2·h, the UF average influent and effluent CODCr values were 40.4 and 36.5 mg/L, respectively, with an average removal rate of 14.6%. At a membrane flux of 80 L/m2·h, the average influent and effluent CODCr values were 52.1 mg/L and 48.8 mg/L, respectively, with an average removal rate of 5.9%. At a membrane flux of 90 L/m2·h, the average influent and effluent CODCr values were 47.5 mg/L and 42.4 mg/L, respectively, with an average removal rate of 10.0%. The UF performance in removing CODCr from the influent was average, with an average removal rate of only 10%. Although UF exhibits a moderate CODCr removal efficacy, its uniformly distributed small pore size enabled it to eliminate turbidity effectively, which made it beneficial in maintaining the RO feed water quality.
During the fourth, sixth, and ninth operation cycles, the backwash duration lasted for 10 s. As indicated in Figure 3C, the use of backwash significantly enhanced the CODCr removal rate, which increased from <10% in the preceding cycle to 15%, 20%, and 23%, respectively, during the three backwash cycles. In the cycle following the backwash, the removal rate of CODCr started to decrease slowly. Conversely, the backwashing process did not conspicuously affect the turbidity removal rate, with changes in the turbidity removal rate showing a certain periodicity but not being synchronized with the backwashing cycle. A potential reason for this was the already low turbidity of the influent water coupled with the limited capacity of the UF system for reducing turbidity, which reduced the effect of the backwashing process on turbidity reduction [22,23].
3.1.3. SDI15 and Feasibility of UF-Produced Water as RO Feed Water
The soft density index is a crucial water quality index that indicates the concentration of particles, colloids, and various other substances that may clog water purification equipment. The average SDI15 value of UF-produced water obtained during the test was 0.7, indicating a lower content of particles compared with the requirement of SDI15 < 5.0 for RO feed water (Table 4). Therefore, the UF-produced water meets the SDI15 requirement for RO feed water.
Table 4.
Reverse osmosis membrane feed water quality requirements and ultrafiltration-produced water quality.
3.1.4. Feasibility of UF-Produced Water as RO Feed Water
To extend the operating life of RO and reduce operating costs, RO feed water is required to meet the conditions presented in Table 4. Therefore, before setting up RO with different pretreatment equipment according to the conditions of the feed water quality, the UF and multimedia filter were used for pretreatment and to reduce membrane contamination. This process enabled the reduction in suspended matter, colloidal substances, and microorganisms in the feed water, thereby reducing RO membrane surface deposition and the clogging of membrane pores; it also reduced CaCO3, CaSO4, and other insoluble salts involved in RO membrane surface scaling, thereby blocking the membrane pores, resulting in a reduction in membrane flux. The process also protected membrane filaments. Pretreatment can reduce the particulate matter in the feed water, ensure the stability of RO feed water quality, and can avoid mechanical or chemical damage to the membrane element. The indexes of RO feed water during the test are shown in Table 4. The quality of UF-produced water was significantly better than the RO feed water quality requirements; compared with the external drainage, the turbidity of UF-produced water was significantly reduced, which is conducive to reducing RO membrane contamination.
Table 4 lists the conditions that must be met by the RO feed water to extend the operating life of the RO device while reducing its operating costs. Therefore, before the RO process, it is essential to determine the pretreatment equipment to be used based on the feed water quality conditions. In this test, UF and multimedia filters were used as pretreatment to achieve the following objectives: (1) Reduce membrane contamination by minimizing suspended matter, colloidal substances, and microorganisms in the feed water, which may deposit or clog RO membrane pores. Moreover, this process also decreases the influence of insoluble salts such as CaCO3 and CaSO4 on the RO membrane surface because such materials can block membrane pores and decrease membrane flux. (2) Protect membrane filaments via pretreatment that decreases the particulate matter in feed water, stabilizes the RO feed water quality, and prevents mechanical or chemical damage to the membrane element. The RO feed water indices depicted in Table 4 show that the quality of UF-produced water during the test was significantly better than the RO feed water quality requirements. Compared with external drainage, UF-produced water turbidity substantially reduced, which assisted in reducing RO membrane contamination.
3.2. Analysis of RO Test Results
The neutralization treatment, pretreatment, and UF processes of titanium dioxide wastewater fulfill the feed water requirements necessary for RO treatment. The key goal of the deep treatment of titanium dioxide wastewater is to remove different types of ions from water, ultimately enhancing the standard of water to that of reusable water.
3.2.1. RO-Produced Water Quality
After the RO process, a significant reduction in feed water conductivity was observed, as shown in Figure 4A, which compares data on the conductivity and removal differences between RO feed water and produced water. The feed water conductivity ranged between 6500 and 10,100 μS/cm, whereas that of the produced water was mainly in the range of 80–110 μS/cm, with a conductivity removal rate exceeding 98.5%. The degree of conductivity reduction in RO-treated water provided essential information about the effectiveness of the RO membrane desalination rate, which in this case showed a high desalination efficiency of ≥98.5%.
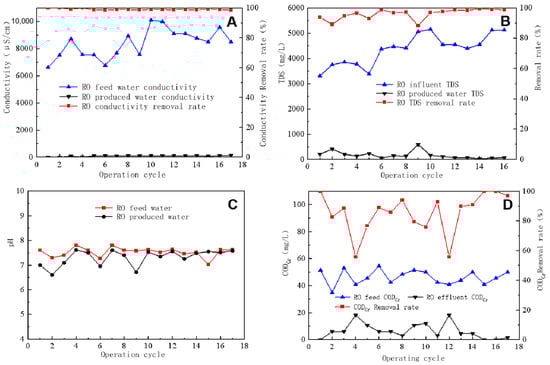
Figure 4.
Conductivity reduction (A), TDS removal efficiency (B), pH level of inlet and outlet water (C), and CODCr removal efficiency (D) of reverse osmosis.
TDS refers to all dissolved solids in water that can pass through a 0.45 μm filter membrane and includes various salts and particulates. Figure 4B shows that TDS in RO-produced water averaged ~100 mg/L, with an average removal rate of 95%. Figure 4C indicates that the pH of both RO feed water and produced water ranged between 7 and 8, with the average pH of the feed water being 7.5 and that of the produced water being 7.5. The pH of the feed water was higher than that of the produced water because RO can remove dissolved ions but not dissolved gases. In water, CO2 exists in equilibrium with HCO3−. When water flows through the RO membrane, HCO3− is retained by the membrane, whereas CO2 passes into the produced water through the membrane, breaking the equilibrium and shifting the balance to the right. This results in the pH of RO-produced water being lower than that of feed water. The pH value of RO-concentrated water was higher than that of the RO feed water because CO2 was retained in the water concentrated via RO, whereas the HCO3− and CO32− plasmas were retained in the water concentrated by the membrane, breaking the equilibrium and shifting the balance to the left. In turn, a part of H+ was consumed, resulting in a higher pH value of concentrated water than feed water. Figure 4D demonstrates that the CODCr of the RO feed water ranged between 40 and 50 mg/L, whereas that of the produced water averaged ~5 mg/L, with an average removal rate of >85%. RO technology is highly effective in removing most pollutants from water, including the organic matter contributing to CODCr.
In addition, RO was highly effective in removing common anions and cations. Figure 5 shows the results of separately analyzing four types of ions (total hardness, SO42−, Cl−, and Na+) during the RO operation. The concentrations of these ions in RO feed water and produced water were analyzed. The obtained results revealed that the total hardness of the feed water averaged 2108 mg/L, the Na+ concentration averaged 878 mg/L, the SO42− concentration averaged 3736 mg/L, and the Cl− concentration averaged 414 mg/L. The average removal rates for the four types of ions were 95.6%, 94%, 89.5%, and 94.1%, respectively. These findings indicate that the RO membrane is highly effective in eliminating common anions and cations from water.
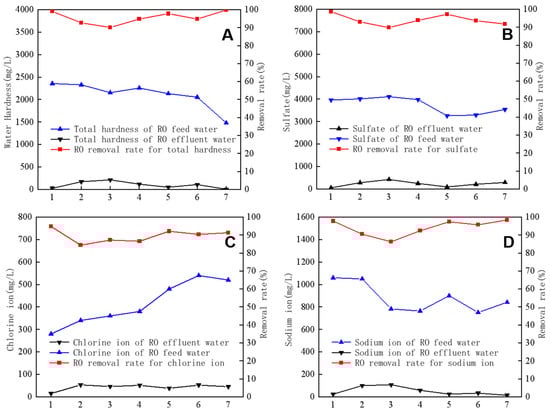
Figure 5.
Removal efficiency of total hardness (A), SO42− (B), Cl− (C), and Na+ (D) by reverse osmosis.
After stable system operation, an analysis of the RO feed water and produced water quality indexes (Table 5) was found to exhibit a highly satisfactory removal efficiency for most indicators. Moreover, inorganic anions and cations had removal rates exceeding 90%. The produced water indicators conformed to water quality standard restrictions for recycled water used for various types of industrial water (including cooling water, washing water, boiler make-up water, process and product water) as specified in “Water Quality of Industrial Water for Urban Wastewater Recycling” (GB/T 19923-2005). Thus, the produced water can serve as a supplementary water source for various industrial water applications.
Table 5.
Analysis of the water quality of reverse osmosis water.
3.2.2. RO Operating Parameters
RO pressure parameters mainly encompass premembrane pressures, intersegment pressures, and postmembrane pressures. The pre- and postmembrane pressures act on the RO inlet and production water, respectively. The pressure difference across the RO membrane was the difference between pre- and postmembrane pressure, while the intersegment pressure referred to the pressure between two RO segments. Table 6 displays the three section pressures for the RO clear water test using tap water with a system recovery rate of 50%. The second set of data presents the pressures of the three sections at the maximum flow rate of the inlet water as clear water.
Table 6.
Reverse osmosis water test pressure.
Figure 6A shows the pressure changes that occur during RO operation after feeding actual wastewater. The pressure difference across the membrane remained at ~0.01 Mpa, whereas the pressure increased gradually with the increasing length of the operation cycle from 0.6 Mpa to 0.84 Mpa. Pressure changes were related to the water quality of RO feed water. If the feed water salt content and conductivity were high, the corresponding feed water osmotic pressure also increased. Consequently, the pressure of the feed water increased with salt concentration levels. Because the transmembrane pressure difference in an RO system is equal to the difference between the pressure before and after the membrane, the transmembrane pressure difference remains relatively consistent throughout the operation cycle, at ~0.01 Mpa. This indicates that the RO membrane experienced only minor pollution during the test period and that there was a modest accumulation of pollutants on the membrane surface and in membrane pores. The RO membrane flux gradually decreased with the increasing length of the operating cycle (Figure 6B). This reduction in flux results from the accumulation of inorganic salts and other contaminants on the RO membrane surface, which clog the membrane pores and decrease the actual permeable membrane area (i.e., the effective membrane area). During the eighth and eleventh operating cycles, the RO-concentrated water valve was opened for 10 s, causing a slowdown in the reduction trend of membrane flux. During the twelfth to fourteenth operating cycles, the RO-concentrated water valve remained closed and the membrane flux recovered. The valve was employed to discharge RO feed water from the concentrated water side at the maximum flow rate, thereby bypassing the membrane and providing a form of RO backwashing. After opening the valve, some contaminants blocking the membrane pores were flushed away and the membrane flux was restored. During the testing period, the RO system used a one-stage, two-stage, and three-branch membrane module, with concentrated water from the two parallel membrane modules in the first stage entering the third membrane module. The final produced water and concentrated-water flow rates corresponded to the total produced and concentrated water of the system. Assuming a similar recovery rate for each of the three modules, the recovery rate could be calculated using the system recovery rate. Figure 6C illustrates the actual produced water flow rate, concentrated-water flow rate, and recovery rate during the test. The RO-produced water flow rate showed relative stability starting at 7 LPM, gradually decreasing to ~5 LPM and eventually increasing to 7 LPM during the eleventh operating cycle. Conversely, the RO-concentrated-water flow rate exhibited a gradual decreasing trend. Although increasing the concentrated-water flow rate using a concentrated-water-regulating valve is possible, this process would lead to a decrease in the recovery rate. The recovery rate increased from 44% at the beginning to a steady 52% with the highest recovery rate reaching 64%. The recovery rate of a single membrane module was ~30%, with maximum and minimum rates of 40% and 25%, respectively.
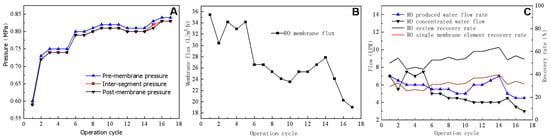
Figure 6.
Effects of pressure (A), membrane flux (B), and flow and recovery rates (C) on the reverse osmosis process.
3.2.3. Three-Dimensional Fluorescence Spectroscopy
UF has an interception range of 50 to 60 kDa molecular weight, which makes it highly effective for removing large-molecule organic matter; however, during testing, it was observed that UF had a lower removal rate for CODCr (10% average), indicating that the molecular weight of the organic matter contributing to CODCr was mostly less than 50 kDa.
Among the dissolved organic substances found in water, most are fluorescent substances, such as oil, grease, protein, and humic acid. These substances correspond to specific fluorescence centers on three-dimensional fluorescence profiles. By examining changes in the fluorescence characteristic peaks and fluorescence intensity in the three-dimensional fluorescence profiles (EEM) of the influent and UF influent and effluent, and analyzing the changes in concentration and class of fluorescent-like substances in each filtration step, it is possible to derive such changes. EEMs provide fluorescence centers for three significant classes of substances, namely protein-like, humic-acid-like, and fulvic-acid-like.
Figure 7 shows the EEM plots for water samples corresponding to two different times (1, 2) of secondary treatment effluent from Enterprise 1; these reflect the total influent, UF influent, and produced water sections. The two water samples exhibited two distinct fluorescence peaks, A and B, centered at λEx/λEm = 280/340 to 350 nm and λEx/λEm = 230/350 nm, respectively; peak B is the main peak and peak A is the second strongest peak. The fluorescence peak intensity ratios (Peak A/Peak B) were 0.635 and 0.658, respectively. These results differed from the characteristic peaks of municipal wastewater because the substances represented by the characteristic peaks of municipal wastewater were protein-like, whereas industrial wastewater mainly contained non-protein-like substances (e.g., aromatic compounds). As a result, their characteristic peaks were markedly different, indicating that titanium dioxide wastewater demonstrates typical industrial wastewater characteristics with low concentrations of protein-like substances. This can mitigate membrane contamination caused by proteins in the dual-membrane process [24].
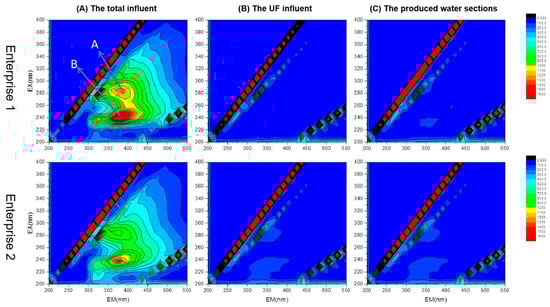
Figure 7.
EEM spectrum analysis of water treated with dual-membrane system; pre- and post-ultrafiltration.
Comparing the three-dimensional fluorescence profiles of UF influent water and enterprise external drainage water showed that fluorescence peaks A and B disappeared after passing through the multimedia and security filters. This indicates that quartz-sand–activated-carbon and precision filtration remove organic substance effects in titanium dioxide wastewater via distinct pathways.
4. Conclusions
The deep treatment of sulfuric-acid-processed titanium dioxide effluent was addressed using a dual-membrane method combining UF and RO. The feasibility of this method for deep treatment was investigated, leading to the following conclusions:
(1) Pretreatments, including the usage of multimedia and security filters and UF, can reduce influent turbidity, CODCr, and organic matter concentration. The removal rate of UF pretreatment on influent turbidity ranged from approximately 50% to 68%, with the influent turbidity exhibiting a decline to below 0.4 NTU after treatment. The CODCr removal rate approximated 30%, and the CODCr of the UF influent decreased to <50 mg/L. The three-dimensional fluorescence spectra presented industrial wastewater characteristics, and most organic pollutants were removed via UF pretreatment. In this regard, UF pretreatment was found to effectively reduce the influent turbidity and CODCr.
(2) UF water perfectly met RO feed water requirements. The turbidity removal rate decreased with the increasing UF membrane flux. The best outcome in terms of turbidity was attained when the membrane flux was 70 L/m2·h. Membrane flux did not substantially affect CODCr removal. UF backwashing improved the CODCr removal rate but only marginally affected turbidity removal. The SDI15 and turbidity of UF water were <5.0 and <1.0, respectively, both of which fulfilled RO influent requirements.
(3) The RO system enables a considerable reduction in water pollutant concentration. The RO membrane reduced the incoming water conductivity by >98.5%, and the TDS removal rate exceeded 95%. The pH of the incoming water was higher than that of the produced water but lower than that of the concentrated water. Furthermore, the CODCr removal rate was ~85%, and the concentrations of various anions and cations were considerably reduced. All produced water quality indicators fulfilled industrial water quality requirements.
Author Contributions
Conceptualization, P.Y. and R.W.; methodology, L.L. and S.L.; software, Y.D.; investigation, P.Y. and R.W.; resources, P.Y. and R.W.; writing—original draft preparation, L.L.; writing—review and editing, L.L., P.Y. and R.W.; supervision, P.Y. and R.W.; project administration, P.Y. and R.W.; funding acquisition, P.Y. All authors have read and agreed to the published version of the manuscript.
Funding
This research received no external funding.
Institutional Review Board Statement
Not applicable.
Informed Consent Statement
Not applicable.
Data Availability Statement
The data is unavailable due to privacy or ethical restrictions.
Conflicts of Interest
The authors declare no conflict of interest.
References
- Tu, J.X.; Hu, L.Z.; Mohammed, K.J.; Le, B.N.; Chen, P.R.; Ali, E.; Ali, H.E.; Sun, L. Application of logistic regression, support vector machine and random forest on the effects of titanium dioxide nanoparticles using macroalgae in treatment of certain risk factors associated with kidney injuries. Environ. Res. 2023, 220, 115167. [Google Scholar] [CrossRef] [PubMed]
- Pervez, M.N.; Bilgiç, B.; Mahboubi, A.; Uwineza, C.; Zarra, T.; Belgiorno, V.; Naddeo, V.; Taherzadeh, M.J. Double-stage membrane-assisted anaerobic digestion process intensification for production and recovery of volatile fatty acids from food waste. Sci. Total Environ. 2022, 825, 154084. [Google Scholar] [CrossRef] [PubMed]
- Zhou, G. Sulfuric Acid Production of Titanium White Waste Water Comprehensive Research. Master’s Thesis, Jiangsu University, Zhenjiang, China, 2020. [Google Scholar] [CrossRef]
- Peng, W.B.; Yun, J.J.; Ding, B.C.; Bai, Z.G.; Xiao, W.Y.; Wang, X.H. Study on treatment of titanium dioxide post-treatment wastewater by chloride process with membrane integrated technology. Inorg. Chem. Ind. 2020, 52, 4. [Google Scholar]
- Sun, Y.; Wu, M.H.; Tong, T.Z.; Liu, P.; Tang, P.; Gan, Z.W.; Yang, P.; He, Q.P.; Liu, B.C. Organic compounds in Weiyuan shale gas produced water: Identification, detection and rejection by ultrafiltration-reverse osmosis processes. Chem. Eng. J. 2021, 412, 128699. [Google Scholar] [CrossRef]
- Petrinic, I.; Korenak, J.; Povodnik, D.; Hélix-Nielsen, C. A feasibility study of ultrafiltration/reverse osmosis (UF/RO)-based wastewater treatment and reuse in the metal finishing industry. J. Clean. Prod. 2015, 101, 292–300. [Google Scholar] [CrossRef]
- Huang, X.F.; Ling, J.; Xu, J.C.; Feng, Y.; Li, G.M. Advanced treatment of wastewater from an iron and steel enterprise by a constructed wetland/ultrafiltration/reverse osmosis process. Desalination 2011, 269, 41–49. [Google Scholar] [CrossRef]
- Zhang, H.; Li, H. Experimental study on the stepwise treatment of titanium dioxide acid wastewater by sulfuric acid process. Inorg. Chem. Ind. 2017, 49, 58–60. [Google Scholar]
- Li, G.; Zhao, Q.; Yu, L.; Hao, S.J. Experimental study on the treatment of titanium dioxide wastewater by sulfuric acid process. Ind. Water Treat. 2007, 4, 25–27. [Google Scholar]
- Sun, L. Treatment of waste acid and wastewater in titanium dioxide production by sulfuric acid method. Chem. Manag. 2022, 20, 34–36. [Google Scholar]
- Huang, S.; Yang, M. Study on the treatment process of titanium dioxide production wastewater by sulfuric acid method. Guangdong Agric. Sci. 2009, 7, 190–191. [Google Scholar]
- Ming, L. Treatment of titanium dioxide wastewater by two-stage neutralization, aeration oxidation and precipitation. Ind. Water Treat. 2018, 38, 97–99. [Google Scholar]
- Rodríguez-Vidal, F.J.; García-Valverde, M.; Ortega-Azabache, B.; González-Martínez, Á.; Bellido-Fernández, A. Characterization of urban and industrial wastewaters using excitation-emission matrix (EEM) fluorescence: Searching for specific fingerprints. J. Environ. Manag. 2020, 263, 110396. [Google Scholar] [CrossRef]
- Piemonte, V.; Prisciandaro, M.; Mascis, L.; Di Paola, L.; Barba, D. Reverse osmosis membranes for treatment of produced water: A process analysis. Desalin. Water Treat. 2015, 55, 565–574. [Google Scholar] [CrossRef]
- Ebrahimi, M.; Kovacs, Z.; Schneider, M.; Mund, P.; Bolduan, P.; Czermak, P. Multistage filtration process for efficient treatment of oil-field produced water using ceramic membranes. Desalin. Water Treat. 2012, 42, 17–23. [Google Scholar] [CrossRef]
- Rosberg, R. Ultrafiltration (new technology), a viable cost-saving pretreatment for reverse osmosis and nanofiltration—A new approach to reduce costs. Desalination 1997, 110, 107–113. [Google Scholar] [CrossRef]
- Riley, S.M.; Ahoor, D.C.; Regnery, J.; Cath, T.Y. Tracking oil and gas wastewater-derived organic matter in a hybrid biofilter membrane treatment system: A multi-analytical approach. Sci. Total Environ. 2018, 613–614, 208–217. [Google Scholar] [CrossRef]
- Jeong, S.; Choi, Y.J.; Nguyen, T.V.; Vigneswaran, S.; Hwang, T.M. Submerged membrane hybrid systems as pretreatment in seawater reverse osmosis (SWRO): Optimisation and fouling mechanism determination. J. Membr. Sci. 2012, 411–412, 173–181. [Google Scholar] [CrossRef]
- Xue, D. Advanced treatment of chemical wastewater by membrane method. Petrochem. Saf. Environ. Prot. Technol. 2008, 24, 61–64. [Google Scholar]
- Wei, N.; Zhang, Y.Q.; Ji, K. Research and application of membrane separation technology in printing and dyeing wastewater reuse. Water Purif. Technol. 2009, 28, 1–5. [Google Scholar]
- Wang, Z.G.; Xiao, W.Y.; Ding, B.C.; Qi, X.Y.; Peng, W.H. Study on the treatment of acidic wastewater from titanium dioxide by sulfuric acid process by membrane separation. Inorg. Chem. Ind. 2018, 50, 53–55+66. [Google Scholar]
- Teodosiu, C.; Pastravanu, O.; Macoveanu, M. Neural network models for ultrafiltration and backwashing. Water Res. 2000, 34, 4371–4380. [Google Scholar] [CrossRef]
- Katsoufidou, K.; Yiantsios, S.G.; Karabelas, A.J. A study of ultrafiltration membrane fouling by humic acids and flux recovery by backwashing: Experiments and modeling. J. Membr. Sci. 2005, 266, 40–50. [Google Scholar] [CrossRef]
- Han, Q.; Yan, H.; Zhang, F.; Xue, N.; Wang, Y.; Chu, Y.B.; Gao, B.Y. Trihalomethanes (THMs) precursor fractions removal by coagulation and adsorption for bio-treated municipal wastewater: Molecular weight, hydrophobicity/hydrophily and fluorescence. J. Hazard. Mater. 2015, 297, 119–126. [Google Scholar] [CrossRef] [PubMed]


Disclaimer/Publisher’s Note: The statements, opinions and data contained in all publications are solely those of the individual author(s) and contributor(s) and not of MDPI and/or the editor(s). MDPI and/or the editor(s) disclaim responsibility for any injury to people or property resulting from any ideas, methods, instructions or products referred to in the content. |
© 2023 by the authors. Licensee MDPI, Basel, Switzerland. This article is an open access article distributed under the terms and conditions of the Creative Commons Attribution (CC BY) license (https://creativecommons.org/licenses/by/4.0/).