Article

Research on Pore-Fracture Characteristics and Adsorption Performance of Main Coal Seams in Lvjiatuo Coal Mine

1
Key Laboratory of Coalbed Methane Resource & Reservoir Formation Process, Ministry of Education, China University of Mining and Technology, Xuzhou 221008, China
2
School of Resources and Earth Science, China University of Mining and Technology, Xuzhou 221116, China
3
Institute of Energy, Peking University, Beijing 100871, China
4
Xinjiang Tianchi Energy Co., Ltd., Changji 831100, China
*
Author to whom correspondence should be addressed.
Processes 2023, 11(6), 1700; https://doi.org/10.3390/pr11061700
Submission received: 19 April 2023 / Revised: 14 May 2023 / Accepted: 24 May 2023 / Published: 2 June 2023

Abstract

:
Gas prevention and control have always been the focus of coal mine safety. The pore structure characteristics and gas adsorption characteristics of coal seams are the key factors affecting gas adsorption and diffusion in coal seams. Lvjiatuo Mine has the characteristics of a high gas content when it enters deep mining. In order to clarify the influence of the pore-fracture structure characteristics of main coal seams in the research area on coal seam gas adsorption and diffusion, and to study the differences in gas adsorption and diffusion ability in different coal seams, low-temperature nitrogen adsorption (LT-N2GA), high-pressure mercury intrusion (MIP) and computerized tomography (μ-CT) were used as characterization methods, and methane isothermal adsorption experiments were carried out to systematically study the pore structure characteristics of five groups of coal samples, and the pore-fracture structure characteristics and gas adsorption characteristics of each main coal seam were obtained. The results show that: (1) in the LT-N2GA experiment, the adsorption–desorption curves of all coal samples are of type III, and mainly develop cone-shaped pores or wedge-shaped semi-closed pores, with an average pore size of 1.84~4.84 nm, a total pore volume of 0.0010~0.0023 mL/g, a total specific surface area of 0.16~0.24 m2/g, and a fractal dimension D1 of 1.39~1.87 and D2 of 2.44~2.60. The micropores of L12 are more developed, and the mesopores and macropores of L9 are more developed. (2) In the MIP experiment, the porosity of coal samples is 3.79~6.94%. The porosity of L9 is the highest, the macropore ratio is the highest, and the gas diffusion ability is also the strongest. (3) In the μ-CT experiment, the porosity of L8-2 and L12 is 12.12% and 10.41%, the connectivity is 51.22% and 61.59%, and the Df is 2.39 and 2.30, respectively. The fracture of L12 is more developed, the connectivity is better, and the heterogeneity of the pore of L8-2 is higher. (4) In the isothermal adsorption experiment of methane, the gas adsorption capacity basically increases with the increase in the buried depth of the coal seam, and the gas adsorption capacity of the No.12 coal seam is the highest. Based on the pore-fracture structure characteristics and gas adsorption characteristics of the main coal seams in the research area, the gas outburst risk of each coal seam is ranked as follows: No.12 coal seam > No.8 coal seam > No.7 coal seam > No.9 coal seam. The experimental results provide important help for researching the structural characteristics of coal seam pore fractures and preventing gas outbursts during deep coal seam mining.
Keywords:
coal; pore; coal reservoir; CT

1. Introduction

The pores and fractures of coal are the main storage places and diffusion and seepage channels of gas in coal reservoirs, respectively [1,2]. Pores and fractures with different properties cause the accumulation or escape of gas in coal, which can lead to differences in the gas content in a coal seam, and thus affect the safety of a coal mine [3,4]. The quantitative characterization of the pore-fracture structure of coal is the basis for studying the porosity of coal and the diffusion and seepage process of fluid. Micropores in coal are the main adsorption spaces for gas, transition pores and mesopores are diffusion channels for gas, and macropores and fractures are seepage channels for gas [5,6,7,8,9]. In the study area, the gas content of Lvjiatuo Mine is below 6 m3/t during mining, and the overall content is low [10]. However, with the mining reaching deep coal seams, the gas content and emission of coal seam increased, and the maximum gas emissions exceeded 7.5 m3/min, and the mine became a high-gas-outburst mine [11]. However, the pore-fracture structure development, buried depth and gas content of the different main coal seams are different. Therefore, the analysis of the structural characteristics and adsorption properties of coal seam pores and fractures and the quantitative characterization of the coal seam pore-fracture system are important prerequisites for further revealing the law of coal seam gas storage and migration in mining areas [12,13,14,15,16,17].
With the continuous in-depth study of coal pore-fracture structure by scholars, many testing techniques have been used to study the pore-fracture characteristics of coal [18,19,20,21,22,23]. Scanning electron microscopy (SEM) is the most commonly used pore observation technology, and field emission scanning electron microscopy (FE-SEM) and focused ion beam scanning electron microscopy (FIB-SEM), which have higher scanning accuracy, are also widely used in the characterization of coal nanopores. The distribution and connectivity characteristics of coal pores were obtained by Fang et al. [24] using FIB-SEM for the three-dimensional visualization reconstruction of coal sample nanopores. As a relatively new pore visualization testing technology, AFM not only has a high characterization accuracy, reaching less than 10 nm [25], but can also be used to study the mechanical properties of coal pores, so as to study the migration capacity of fluid in coal pores. By combining SEM and AFM, Li et al. [19] found significant differences in the mechanical properties between the coal matrix and minerals, as well as far greater than average adhesion in pores near minerals. Li et al. [26] used LF-NMR technology to accurately characterize the pore-fracture system of coal seam, studied the migration and occurrence law of fluid in coal pores under different saturation pressures, established the relative water saturation model of coal pores, and found that the pore and fissure would be destroyed under high saturation pressure, resulting in the decrease in coal water saturation. Liu et al. [22] used μ-CT imaging technology to establish the micro-three-dimensional pore network ball and stick model of two kinds of coal in Qinshui Basin, and visualized the gas flow in the three-dimensional structure. In recent years, scholars have also begun to apply the small-angle scattering technique with higher observation accuracy to the characterization of coal pores. For example, Vasilenko et al. [16] used neutron small-angle scattering to characterize the pore structure of 27 kinds of coal, studied the correlation between the pore structure of coal and the tendency of coal seams regarding gas outbursts, and found that the surface fractal dimension of coal with outburst risk was higher. However, adsorption experiments of MIP, CO2 and N2 are widely used to obtain pore data. For example, Li et al. [27] found that the intrusion of mercury under high pressure would cause the compression of the coal matrix, resulting in errors relating to porosity. Therefore, they proposed a new and more practical method for correcting pore volume by simplifying the calculation of the compressibility of the coal matrix. Mahamudet et al. [28] used low-temperature liquid nitrogen adsorption (LT-N2GA) and CO2 adsorption experiments to study the pore structure characteristics and changes in coal in a coking process. In summary, our predecessors have completed a lot of work and achieved a vast array of results in coal pore methods, providing methods for the comprehensive analysis of the pore characteristics of different coal reservoirs.
Therefore, this paper intends to use the LT-N2GA experiment and the MIP experiment to jointly characterize the full-scale pore size distribution of coal seam pores in the study area. At the same time, the μ-CT experiment was used to characterize the 3D visualization and the connectivity of coal seam pore fissures. Finally, the methane isothermal adsorption experiment was used to study the adsorption capacity of coal seam pores. In summary, this paper studies the characteristics of the pore–fissure system and the adsorption characteristics of coal seam gas in the main coal seam of the Lvjiatuo mining area through four tests, providing help and reference for the prevention and control of gas disasters in high-gas mines.

2. Sample Collection and Experimental Methods

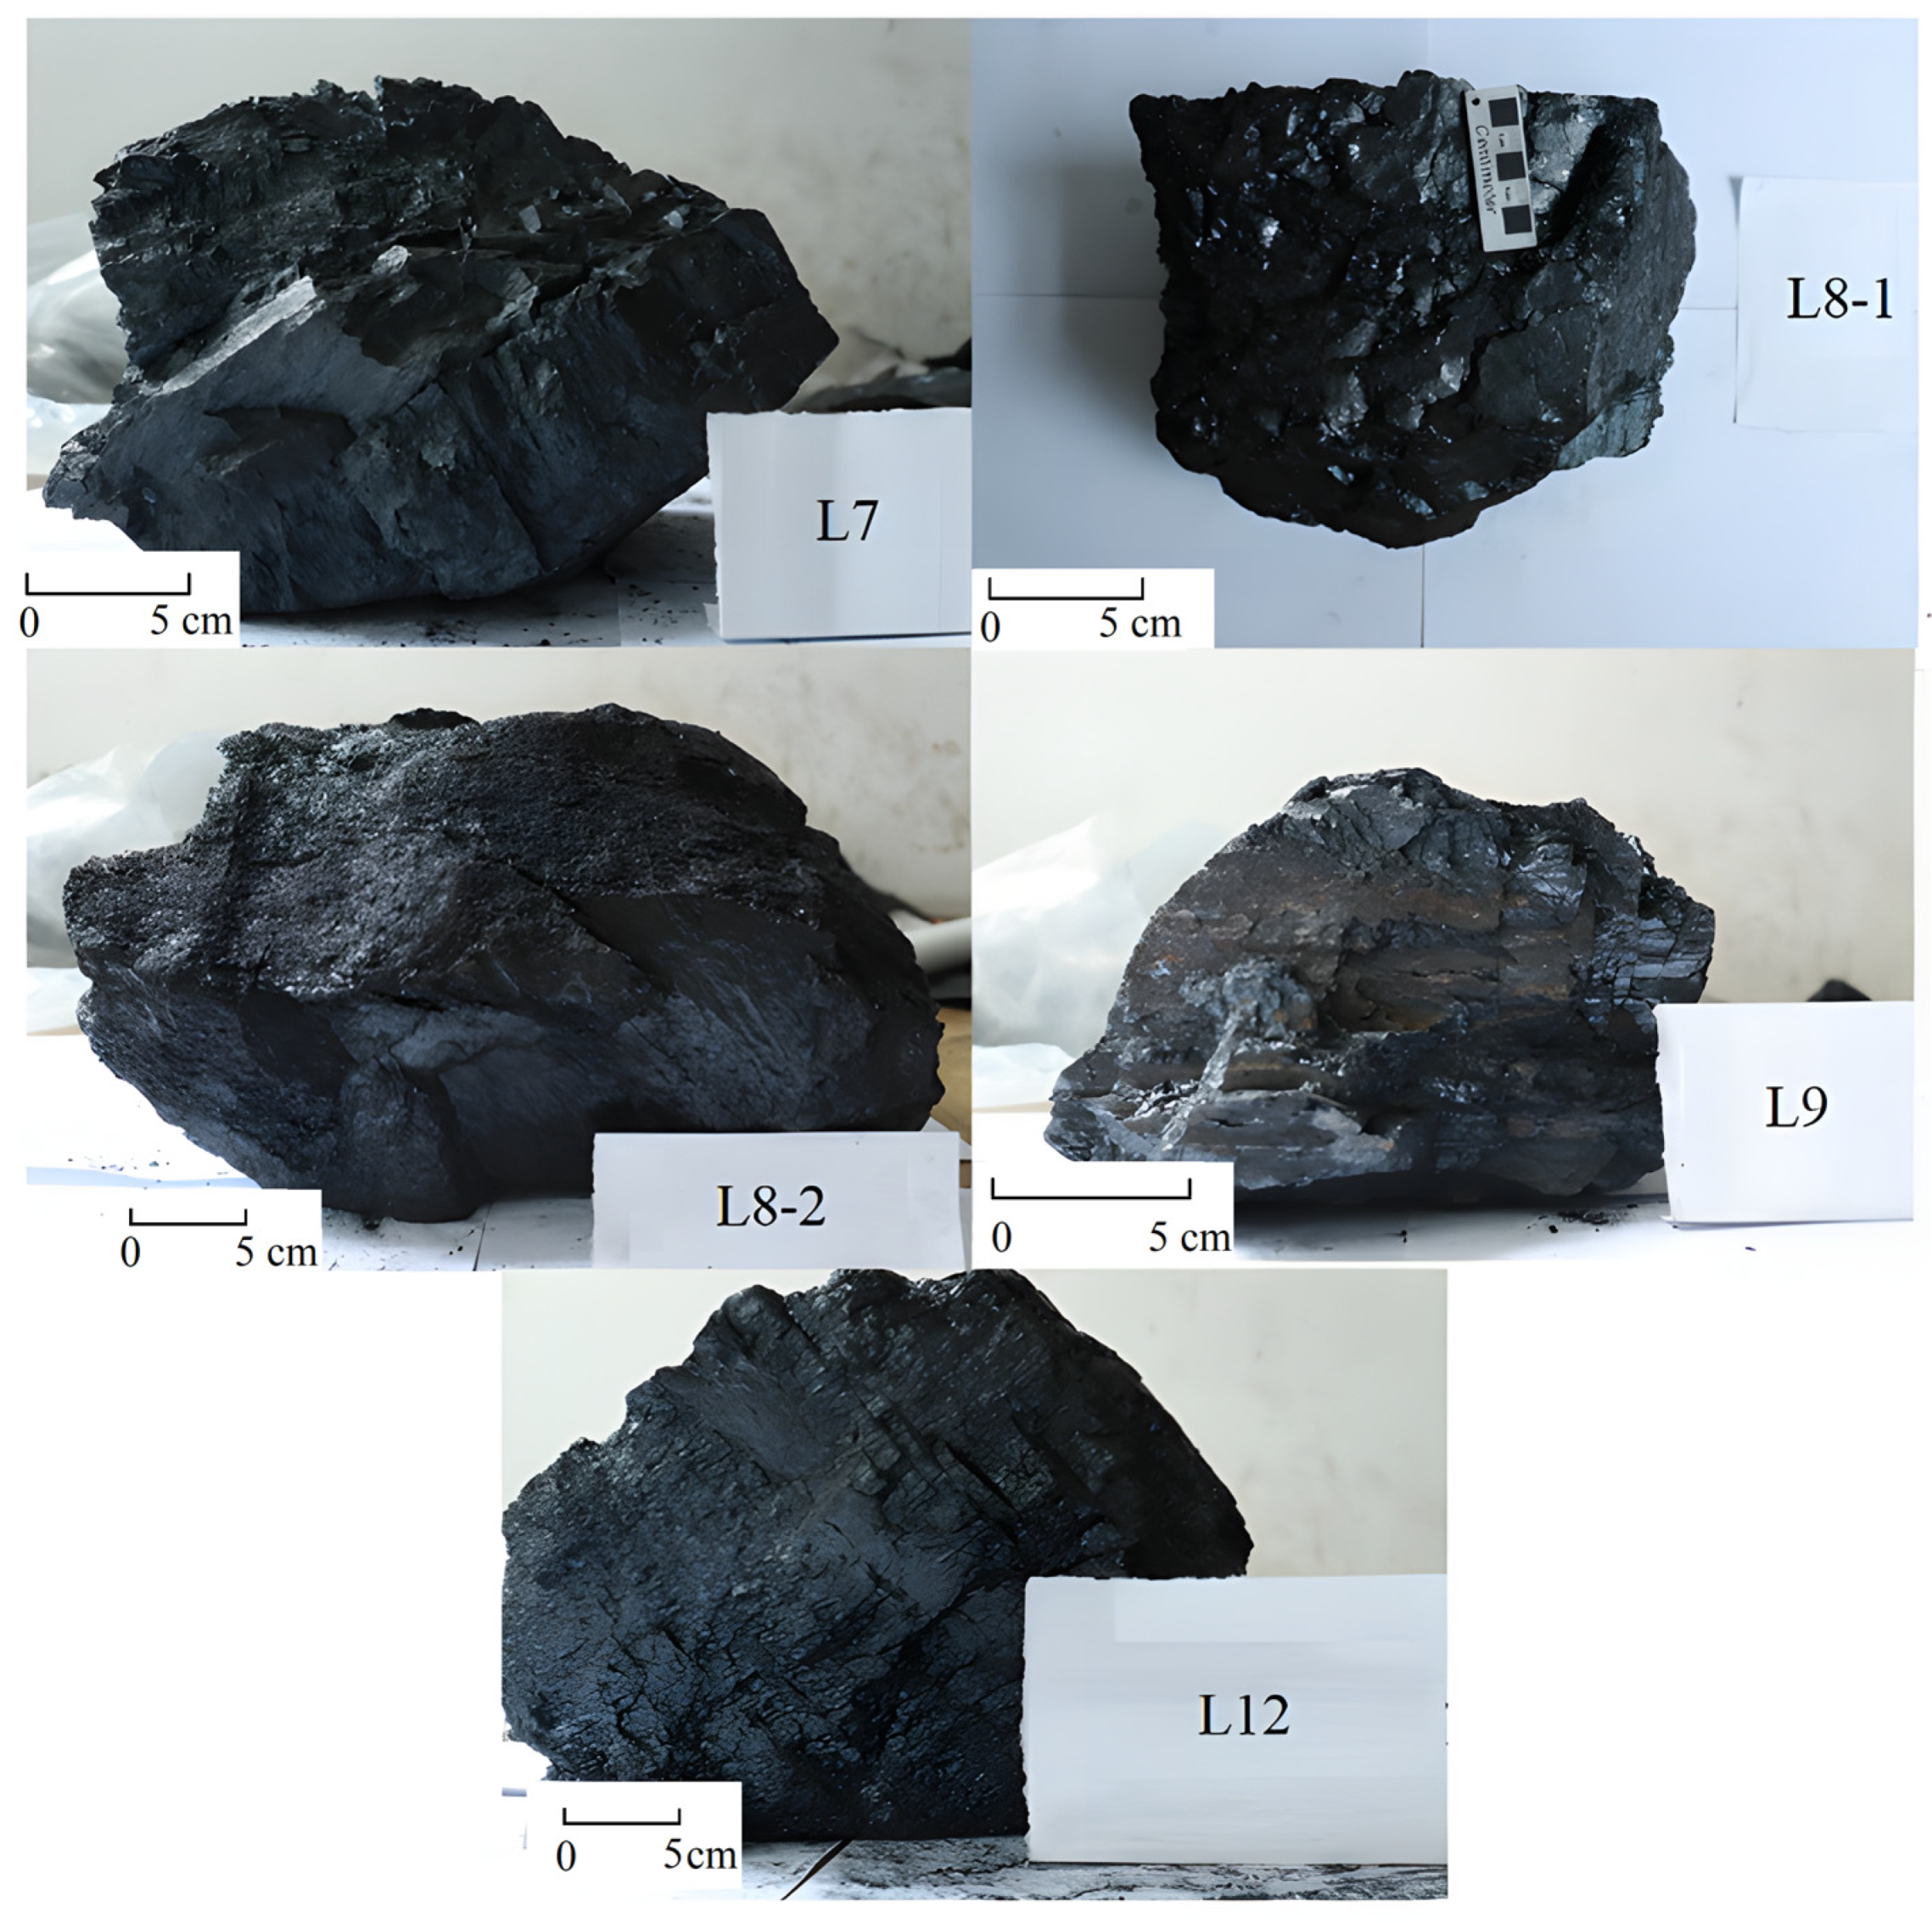
2.1. Sample Collection

There are 6 mining coal seams in Lvjiatuo Mine in the study area, which are Carboniferous-Permian coal seams. The basement of the coal measures is a Cambrian-Ordovician stratum. The overlying caprock of the coal measures comprises Permian and Quaternary strata. The structure of the mining area is dominated by folds and supplemented by faults. Meanwhile, there is magmatic intrusion in some parts of the No.5, No.7, No.9 and No.12 coal seams. In this study, five coal samples were collected from the four main coal seams being mined in Lvjiatuo Mine. The buried depth of coal samples is more than −800 m (Figure 1). Among them, one sample was collected from each of the No.7, No.9 and No.12 coal seams, while two samples were collected from the No.8 coal seam. The L7, L8-1, L9 and L12 samples were obtained near the same sampling point, while sample L8-2 was another sample buried at about 950 m. Details of the samples are shown in Table 1.
The Ro,max of all samples was between 1.42% and 1.55%, indicating that the samples were in the coking coal stage with higher metamorphism. The macroscopic type of each sample was semi-bright to semi-dark briquette. The macroscopic coal rock composition was mainly bright coal and dark coal. The morphology of the samples is shown in Figure 2.

2.2. Experimental Method and Theory

2.2.1. LT-N2GA Experiment

The LT-N2GA experiment was carried out using the Quantachrome Auto-sorb-6B/3B automatic specific surface area and pore size distribution instrument. The samples were crushed, ground and screened to 60~80 meshes multiple times. The treated sample, weighing 5 g, was put into a drying oven, dried in a vacuum at 105 °C for 12 h, and then degassed at 105 °C for 12 h. Then, the low-temperature liquid nitrogen adsorption test was carried out at an experimental temperature of 77.35 K, an adsorption pressure of 101.3 kPa, and a gas relative adsorption equilibrium pressure (P/P0) ranging from 0.01 to 0.995. Gas adsorption in coal pores at low temperature usually includes three processes: single-layer adsorption, multi-layer adsorption and capillary condensation. The adsorption of gas in coal pores under low temperature usually includes three processes: monolayer adsorption, multilayer adsorption and capillary condensation. The Brunauer–Emmett–Teller multilayer adsorption model (BET) is often used to calculate the specific surface area. The Barret–Joyner–Halenda (BJH) model and density-functional theory (DFT) model are commonly used to characterize pore volume and pore size in coal. The BJH model has a high precision in the characterization of the transition pore and mesopore distribution in coal. However, it is not suitable for the characterization of micropore and macropore distribution in coal, while the DFT model can accurately characterize the pore size distribution of micropore in coal.

2.2.2. MIP Experiment

The MIP experiment was performed using the Micromeritics AutoPore 9600 porosity and pore size analyzer. The true density and porosity of the sample were calculated according to the volume density measured at an initial injection pressure of 5 psi (0.034 MPa) and the mercury intake at maximum pressure obtained at a maximum mercury pressure of 60,000 psi (413.700 MPa). The measured pore throat was between 3 μm and 36 μm under the experimental pressure range. Firstly, the samples were cut into cubes with a side length of 1 cm and dried in a vacuum oven at 60 °C for more than 48 h. For the coal rock samples, an expander with 0.412 mL capillary volume was selected. The expander containing the sample was placed into the low-pressure chamber for low pressure analysis. After the low-pressure analysis was completed, the expander that had completed the low-pressure analysis and had been weighed was loaded into the high-pressure bin for high-pressure analysis. The mercury drop value was measured by means of graded continuous, stepwise or ladder pressurization through hydraulic fluid on the mercury surface, and the pressure and corresponding injection volume were recorded. The Washburn equation was used to calculate the pore size in the high-pressure mercury injection experiment [29]. The equation is as follows:
d p = 4 γ c o s θ p
where d p is the pore diameter, m; p is the external pressure, mN/m2; γ is the surface tension of mercury, Mn/m; and θ is the contact angle between mercury and the pore surface.

2.2.3. μ-CT Experiment

The μ-CT experiment used a desktop CT scanner (Germany v|tome|xs180&240) composed of an X-ray source system, a high-precision moving sample stage and a detector system. The coal samples were cut into 5 mm-diameter and 5 mm-height cylinders, which were then placed into the instrument for microscopic CT scanning. The experimental parameters were set as shown in Table 2. After the CT scan was completed, Avizo software was used for three-dimensional reconstruction of coal sample data, and MATLAB software (2022a) was used for the statistics of parameters such as pore diameter, pore volume and connectivity.

2.2.4. Methane Isothermal Adsorption Experiment

Firstly, 150 g of each coal sample was taken to treat to less than 60 mesh, and distilled water was sprayed to pre-wet it. Subsequently, the treated coal samples were placed in a thermostatic container with a temperature of 30 °C and a relative humidity of 97~98%. The samples were weighed every day until the weight of the samples was basically constant within two days, and the balanced water samples were obtained. Then, the methane isothermal adsorption experiment was carried out. The purpose of this experiment was to ensure that the experimental results of isothermal adsorption of coal samples were closest to the experimental results of the original formation conditions.

2.2.5. Fractal Theory

Nowadays, fractal geometry has been proved to be a powerful and reasonable tool to quantitatively describe irregular materials. Fractal theory can be used to characterize the complexity and heterogeneity of the coal pore structure, to understand the surface physical structure of coal, the complex internal pore-fracture system and the occurrence characteristics of coalbed methane. The FHH model is used by many scholars to calculate the fractal dimension of the coal pore structure based on LT-N2GA [30,31,32,33,34].
ln V = K ln [ ln ( P 0 P ) ] + C
K = D 3
where P is the adsorption equilibrium pressure, MPa; V is the gas adsorption capacity at equilibrium pressure, mL; P0 is the adsorption saturated vapor pressure, MPa; K is the fractal dimension factor; C is the constant; and D represents the fractal dimension.
The fractal dimension of pore data based on μ-CT is calculated by means of three-dimensional fractal method [9,35]. The equation is as follows:
D f = lim δ 0 log N ( δ ) log ( δ ) = lim δ 0 log N ( δ ) log ( 1 / δ )
where D f is the three-dimensional fractal dimension; N is the number of boxes containing information in each partition of the 3D grid; and δ is the length of the sides of the three-dimensional cube.

3. Results and Discussion

3.1. Pore Structure Characteristics of LT-N2GA

3.1.1. LT-N2GA Adsorption-Desorption Isotherm

The adsorption–desorption isotherm can characterize the overall morphology and complexity of rock pores. The International Union of Pure and Applied Chemistry (IUPAC) divided adsorption isothermal hysteresis rings into four categories according to different pore morphology [36]. The pore types are open cylindrical pores, parallel plate pores, conical wall pores and ink bottle pores. The adsorption–desorption curves of each sample are shown in Figure 3. The sample L7 has the largest adsorption volume and L8-1 has the smallest adsorption volume. The morphology of adsorption isotherms of other samples is basically the same. At high pressure, the desorption curve has a certain hysteresis phenomenon, with various degrees of hysteresis loops, but the hysteresis phenomenon is not obvious. In addition, the desorption curve, which is close to type Ⅲ, of coal samples is smooth, except for sample L8-1, indicating that all coal samples have open pores and closed pores, many conical pores or wedge-shaped semi-obturator pores, as well as no or few ink-bottle-shaped pores. However, the hysteresis loop of sample L8-1 is relatively wide, indicating that there are more open pores or semi-open pores in the coal sample.

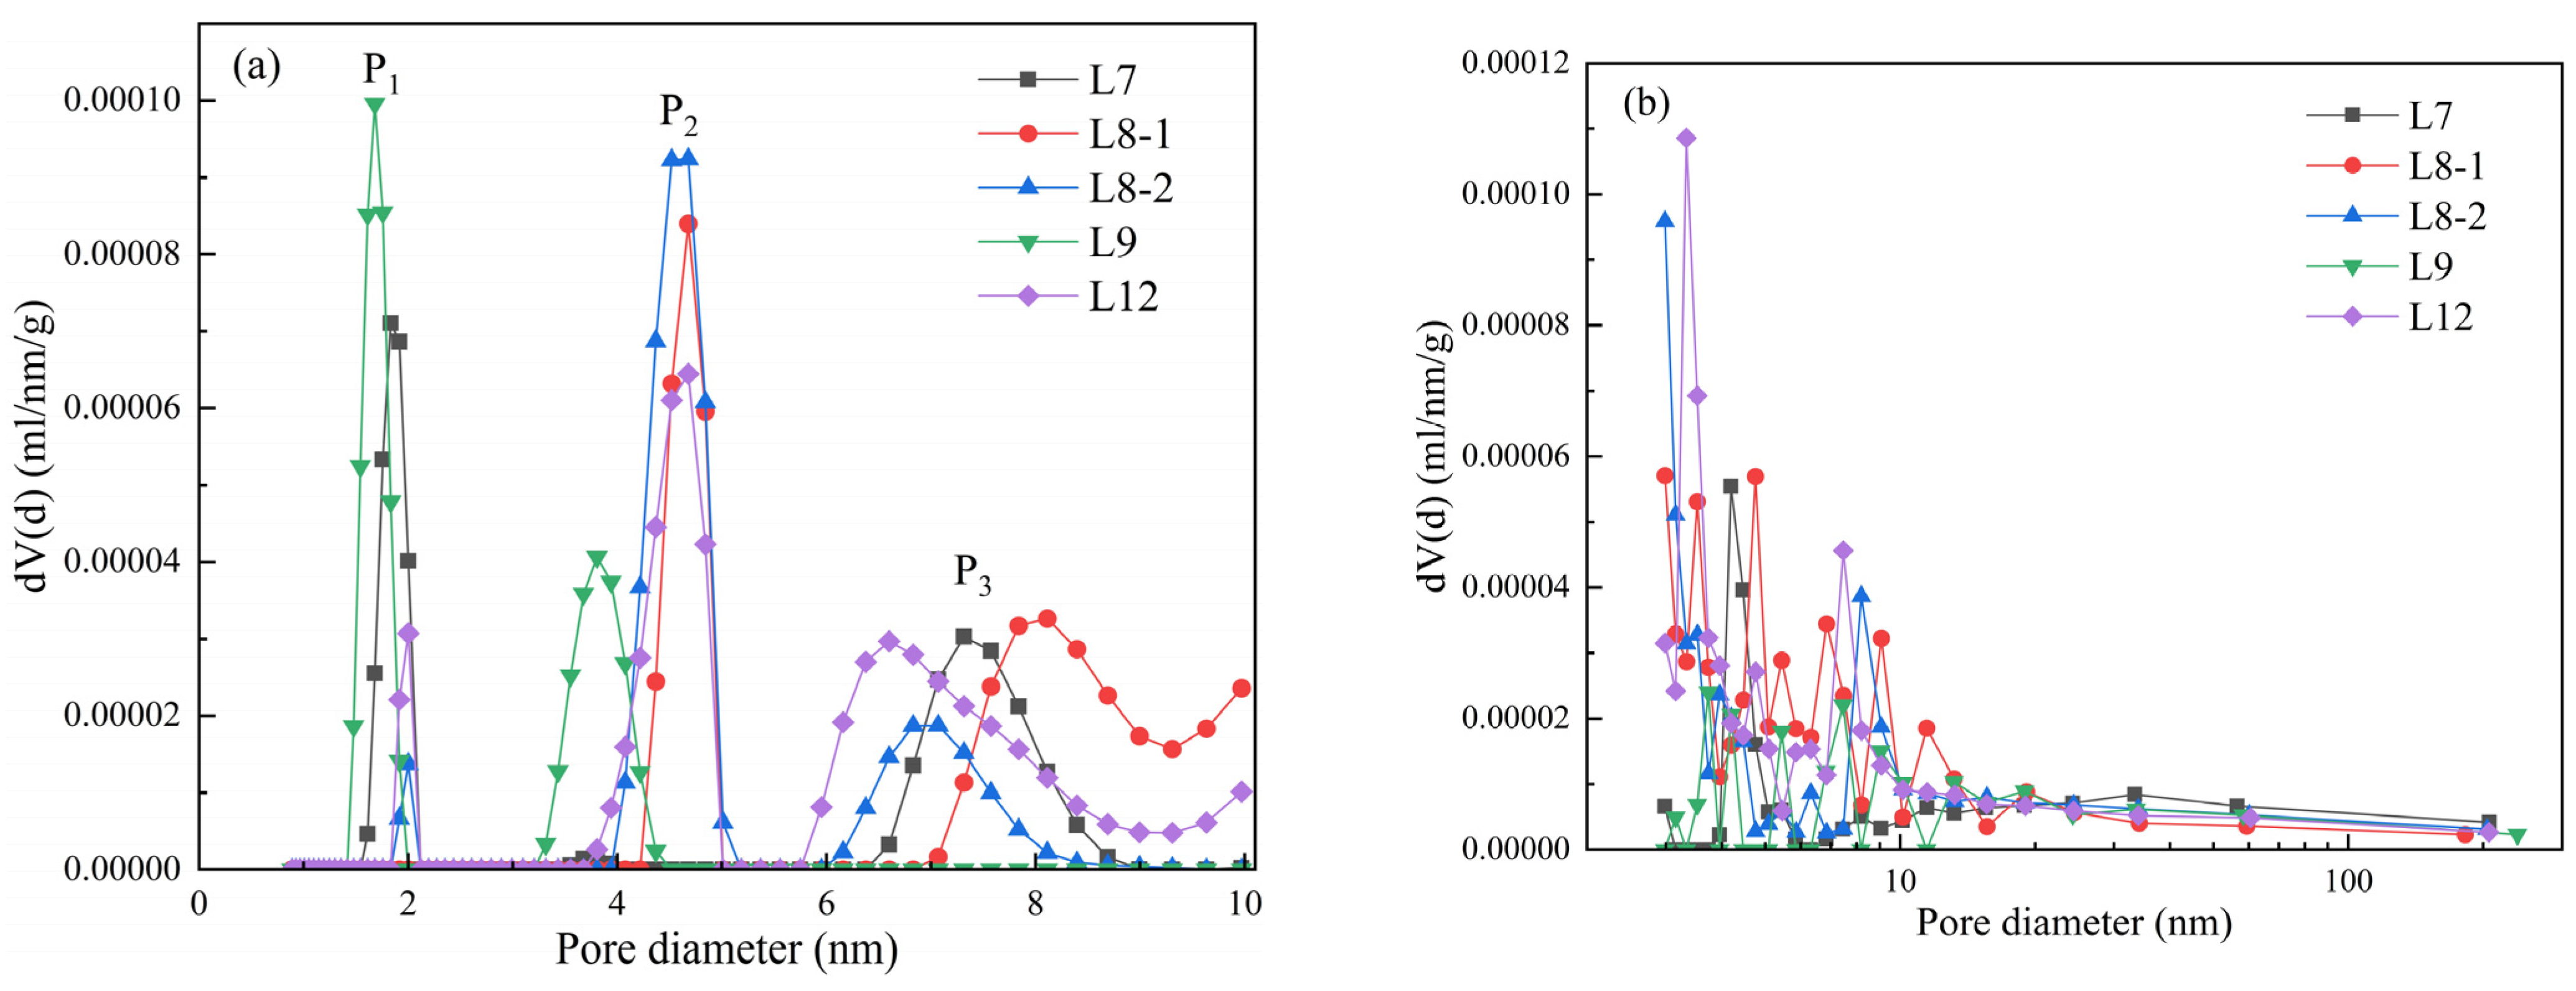
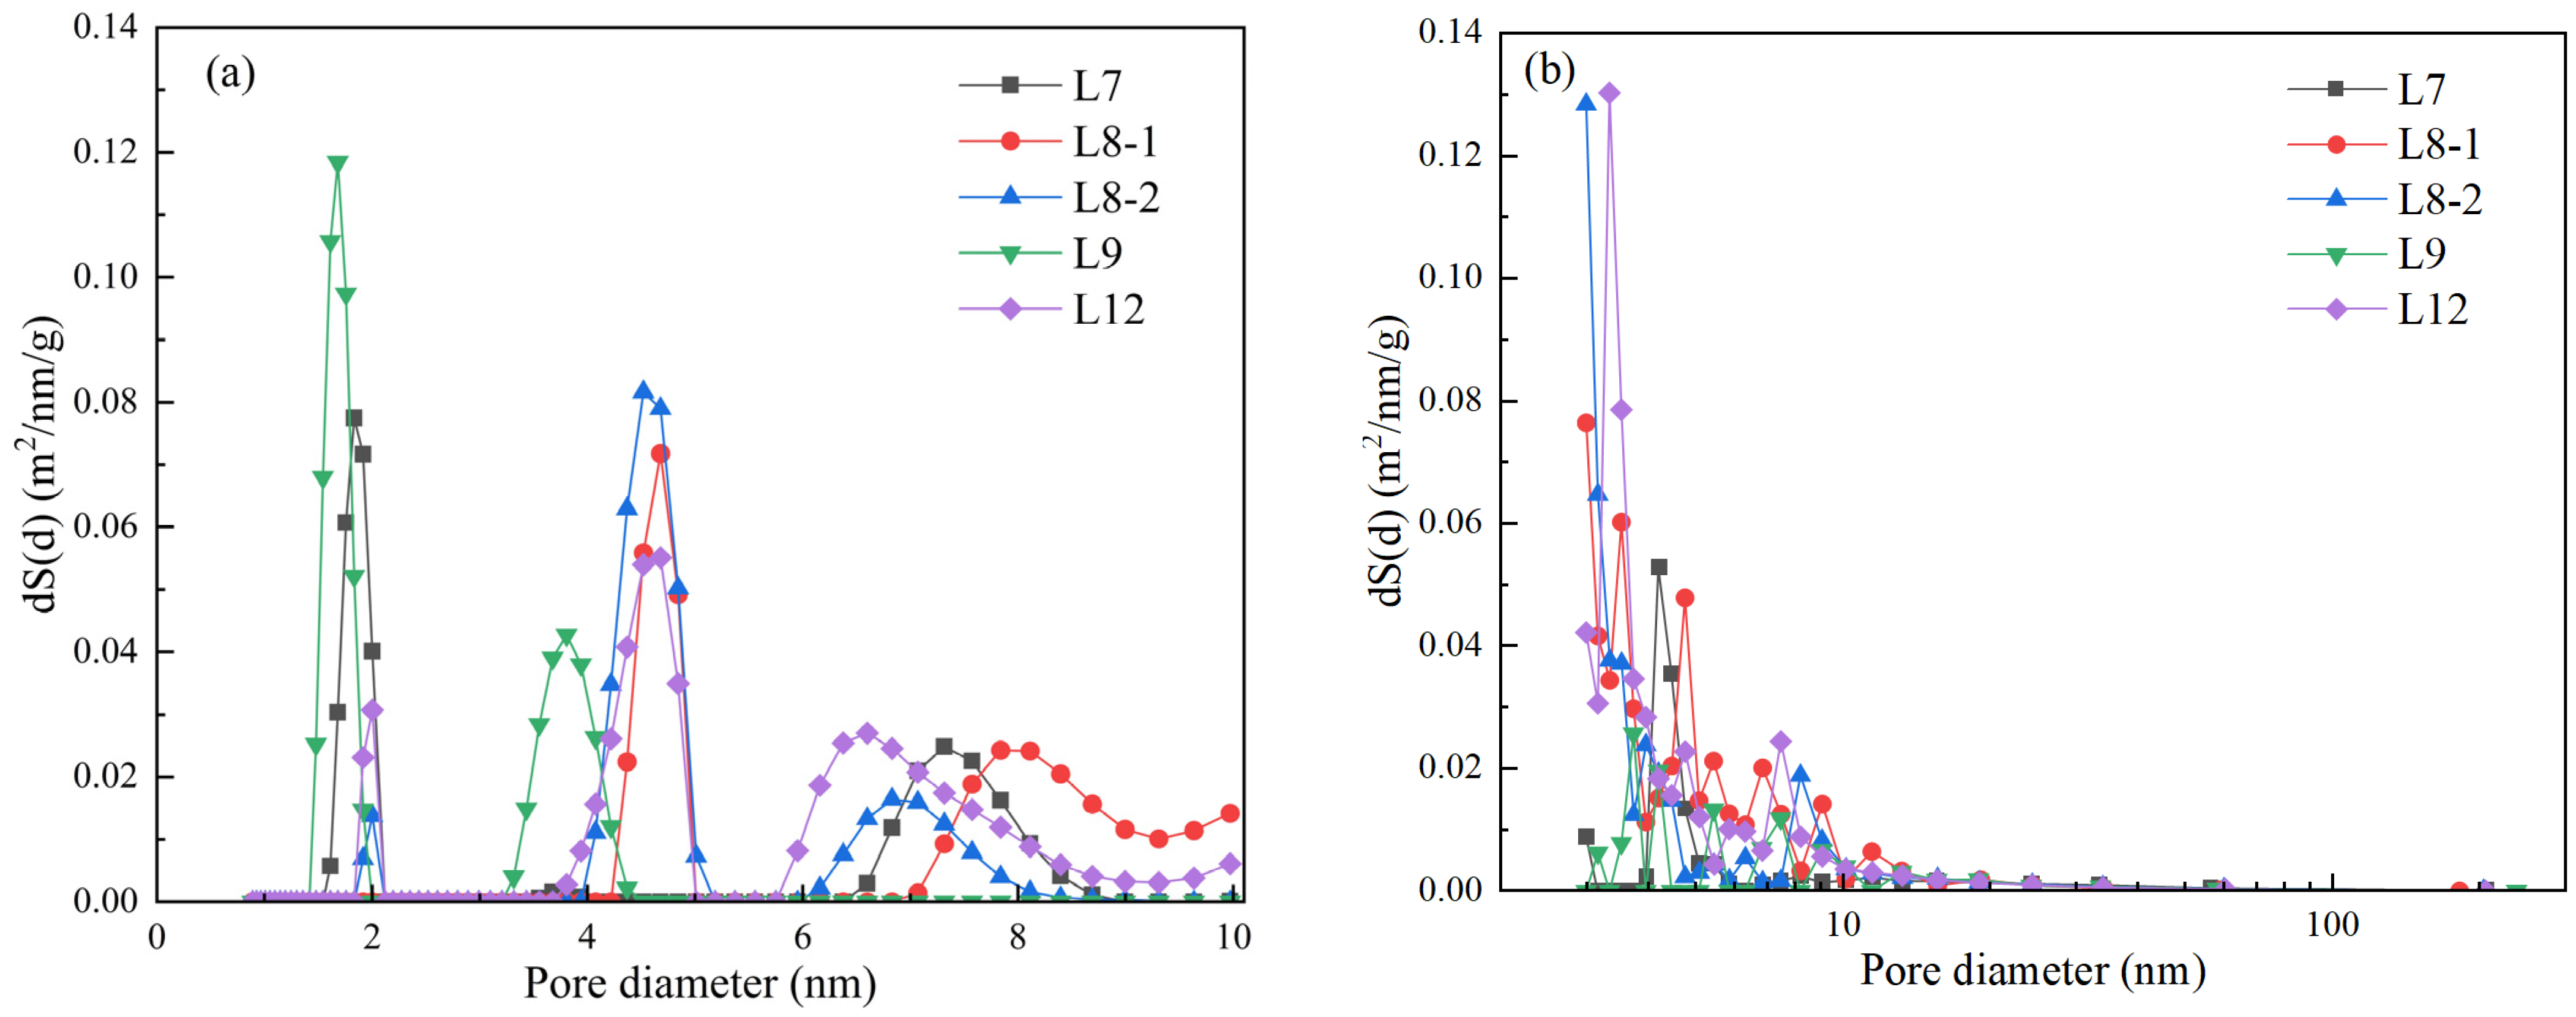
3.1.2. Specific Surface Area and Pore Volume Pore Size Distribution Characteristics

In this paper, the classification of coal pores adopts Hodot’s classification scheme proposed previously, which is widely used [37]: micropores (<10 nm), transition pores (10~100 nm), mesopores (100~1000 nm), and macropores (>1000 nm). The experimental results for the average pore diameter, total specific surface area (SSA) and total pore volume of each sample are shown in Table 3. The total pore volume of the samples ranges from 0.0010 to 0.0023 mL/g, the SSA ranges from 0.16 to 0.24 m2/g, and the average pore diameter ranges 1.85 to 4.84 nm. The total pore volume and average pore size of sample L7 are both the largest, indicating that the pores are the most developed. However, the total specific surface area of sample L7 is the smallest, and micropores and small pores mainly provide the specific surface area, indicating that sample L7 mainly develops mesoporous and macropore. Sample L12 has the largest total specific surface area, indicating that its pores are more developed with micropores and small pores.
The DFT model is more suitable for the characterization of micropores in coal (Figure 4a), while the BJH model is more suitable for the characterization of the pore size distribution of transition pores and mesopores in coal (Figure 4b). It can be seen from Figure 4a that there are three peaks in the micropore stage of less than 10 nm, which are located in the range of 1–2 nm, 3–5 nm and 6–9 nm, respectively. The peaks of P1 and P2 are larger than those of P3, but the peak area is narrower, indicating that the pores with the pore diameter range of 1–2 nm and 3–5 nm are the main contributors to the micropore volume. The pores of sample L9 are mainly distributed in the range of 1–2 nm, the pores of sample L8-1 and sample L8-2 are mainly distributed in the range of 3–5 nm, the pores of sample L7 are mainly distributed in the range of 1–2 nm and 6–9 nm, and the pores of sample L12 are evenly distributed in three peak areas. It can be seen from Figure 5b that the pore volume of each coal seam basically gradually decreases and finally approaches zero with the increase in aperture at the stage of small pores and mesopores with apertures larger than 10 nm. The pores in the range of 10–50 nm contribute most of the pore volume, indicating that in the range of transition pore and mesoporous pore size, the pores of each coal seam are mainly small pores, and only a small number of mesoporous pores exist.
The SSA distribution of micropores based on the DFT model and the SSA distribution of transition pores and mesopores based on the BJH model are shown in Figure 5. The distribution characteristics of SSA curves under different pore diameters in each coal seam are basically consistent with the distribution characteristics of pore volume, and there are three main peaks, which appear in the pore diameters of 1~2 nm, 3~5 nm and 6~9 nm, respectively.
The distribution law of the SSA in the micropore stage of each coal seam is relatively good, and the contribution characteristics of SSA are very similar to the distribution characteristics of pore volume, which shows that pores with pore diameters of 1~2 nm and 3~5 nm are the main contributors to SSA. The main pore diameters of sample L9 are 1–2 nm, those of L8-1, L8-2 and L12 are 4–5 nm and 6–9 nm, and those of sample L7 are 1–2 nm and 6–9 nm. It can be seen from Figure 5b that the SSA of pores with a pore diameter greater than 10 nm is basically provided by pores with a pore size between 10 and 20 nm, and the SSA of pores with a pore size above 20 nm can be basically ignored.
The relationship curve between lnV and ln(ln(P0/P)) was created by using the gas adsorption capacity and relative pressure of the adsorption branch of the adsorption–desorption curve (Figure 6, Table 4). Hysteresis loops appeared when the relative pressure was between 0.45 and 0.5 on the adsorption curve, indicating that the pore structure indicated before and after the relative pressure was significantly different. According to the characteristics of the double-logarithmic curve in Figure 6, the high-pressure and low-pressure sections of the adsorption curve are piecewise linearly fitted with P/P0 = 0.5 as the boundary, then the slopes of fitting straight lines at different pressure sections are calculated. Eventually, Equation (3) is used to calculate the fractal dimension of the coal sample. The results show that there are two different fractal characteristics in the coal sample pores, and the fitting relationship between them is good. The fractal dimension of pores at the low-relative-pressure section (P/P0 < 0.5) is D1, and that at the high-relative-pressure stage (P/P0 > 0.5) is D2. The results show that at the high-relative-pressure stage (P/P0 > 0.5), D2 ranges from 2.4392 to 2.59, with an average of 2.53; At the low relative pressure stage (P/P0 < 0.5), D1 ranges from 1.39 to 1.87 with an average of 1.65. The fractal dimension of pores at the high-relative-pressure stage is higher than that at the low-relative-pressure stage, indicating that the pore structure is more complex, because the adsorbed gas in the low-relative-pressure stage mainly occupies the larger pores, while in the high-pressure stage the gas occupies the micropores.
At the low-relative-pressure stage, the value of lnV changes greatly because the gas adsorption capacity is low in the initial stage, and it increases rapidly when the relative pressure rises to 0.5, but the lnV value is −2.5~−3.5, and the adsorption capacity of each coal sample is still at a low level, indicating that the mesopores and macropores of all coal samples are relatively small. Meanwhile, the variation range of D1 is greater than that of D2, because the macropores and mesopores of each coal sample change greatly, while the micropores change less.
Based on the pore volume and pore SSA characteristics of each pore size range of each coal seam sample, it can be found that the LT-N2GA has a good characterization effect on the micropore pore size stage, and can also be characterized for the transition pores and middle pores to a certain extent. Moreover, as micropores are the main storage place of coal seam gas, it is easier to store gas in the pores with a pore size of 1~2 nm and 6~9 nm in the No.7 coal seam, easier to store gas in the pores with a pore size of 3~5 nm and 6~9 nm in the No.8 and No.12 coal seams, and easier to store gas in the pores with a pore size of 1~2 nm in the No.9 coal seam. The gas storage capacity in the other pore size ranges is relatively weak.

3.2. Pore Structure Characteristics of MIP

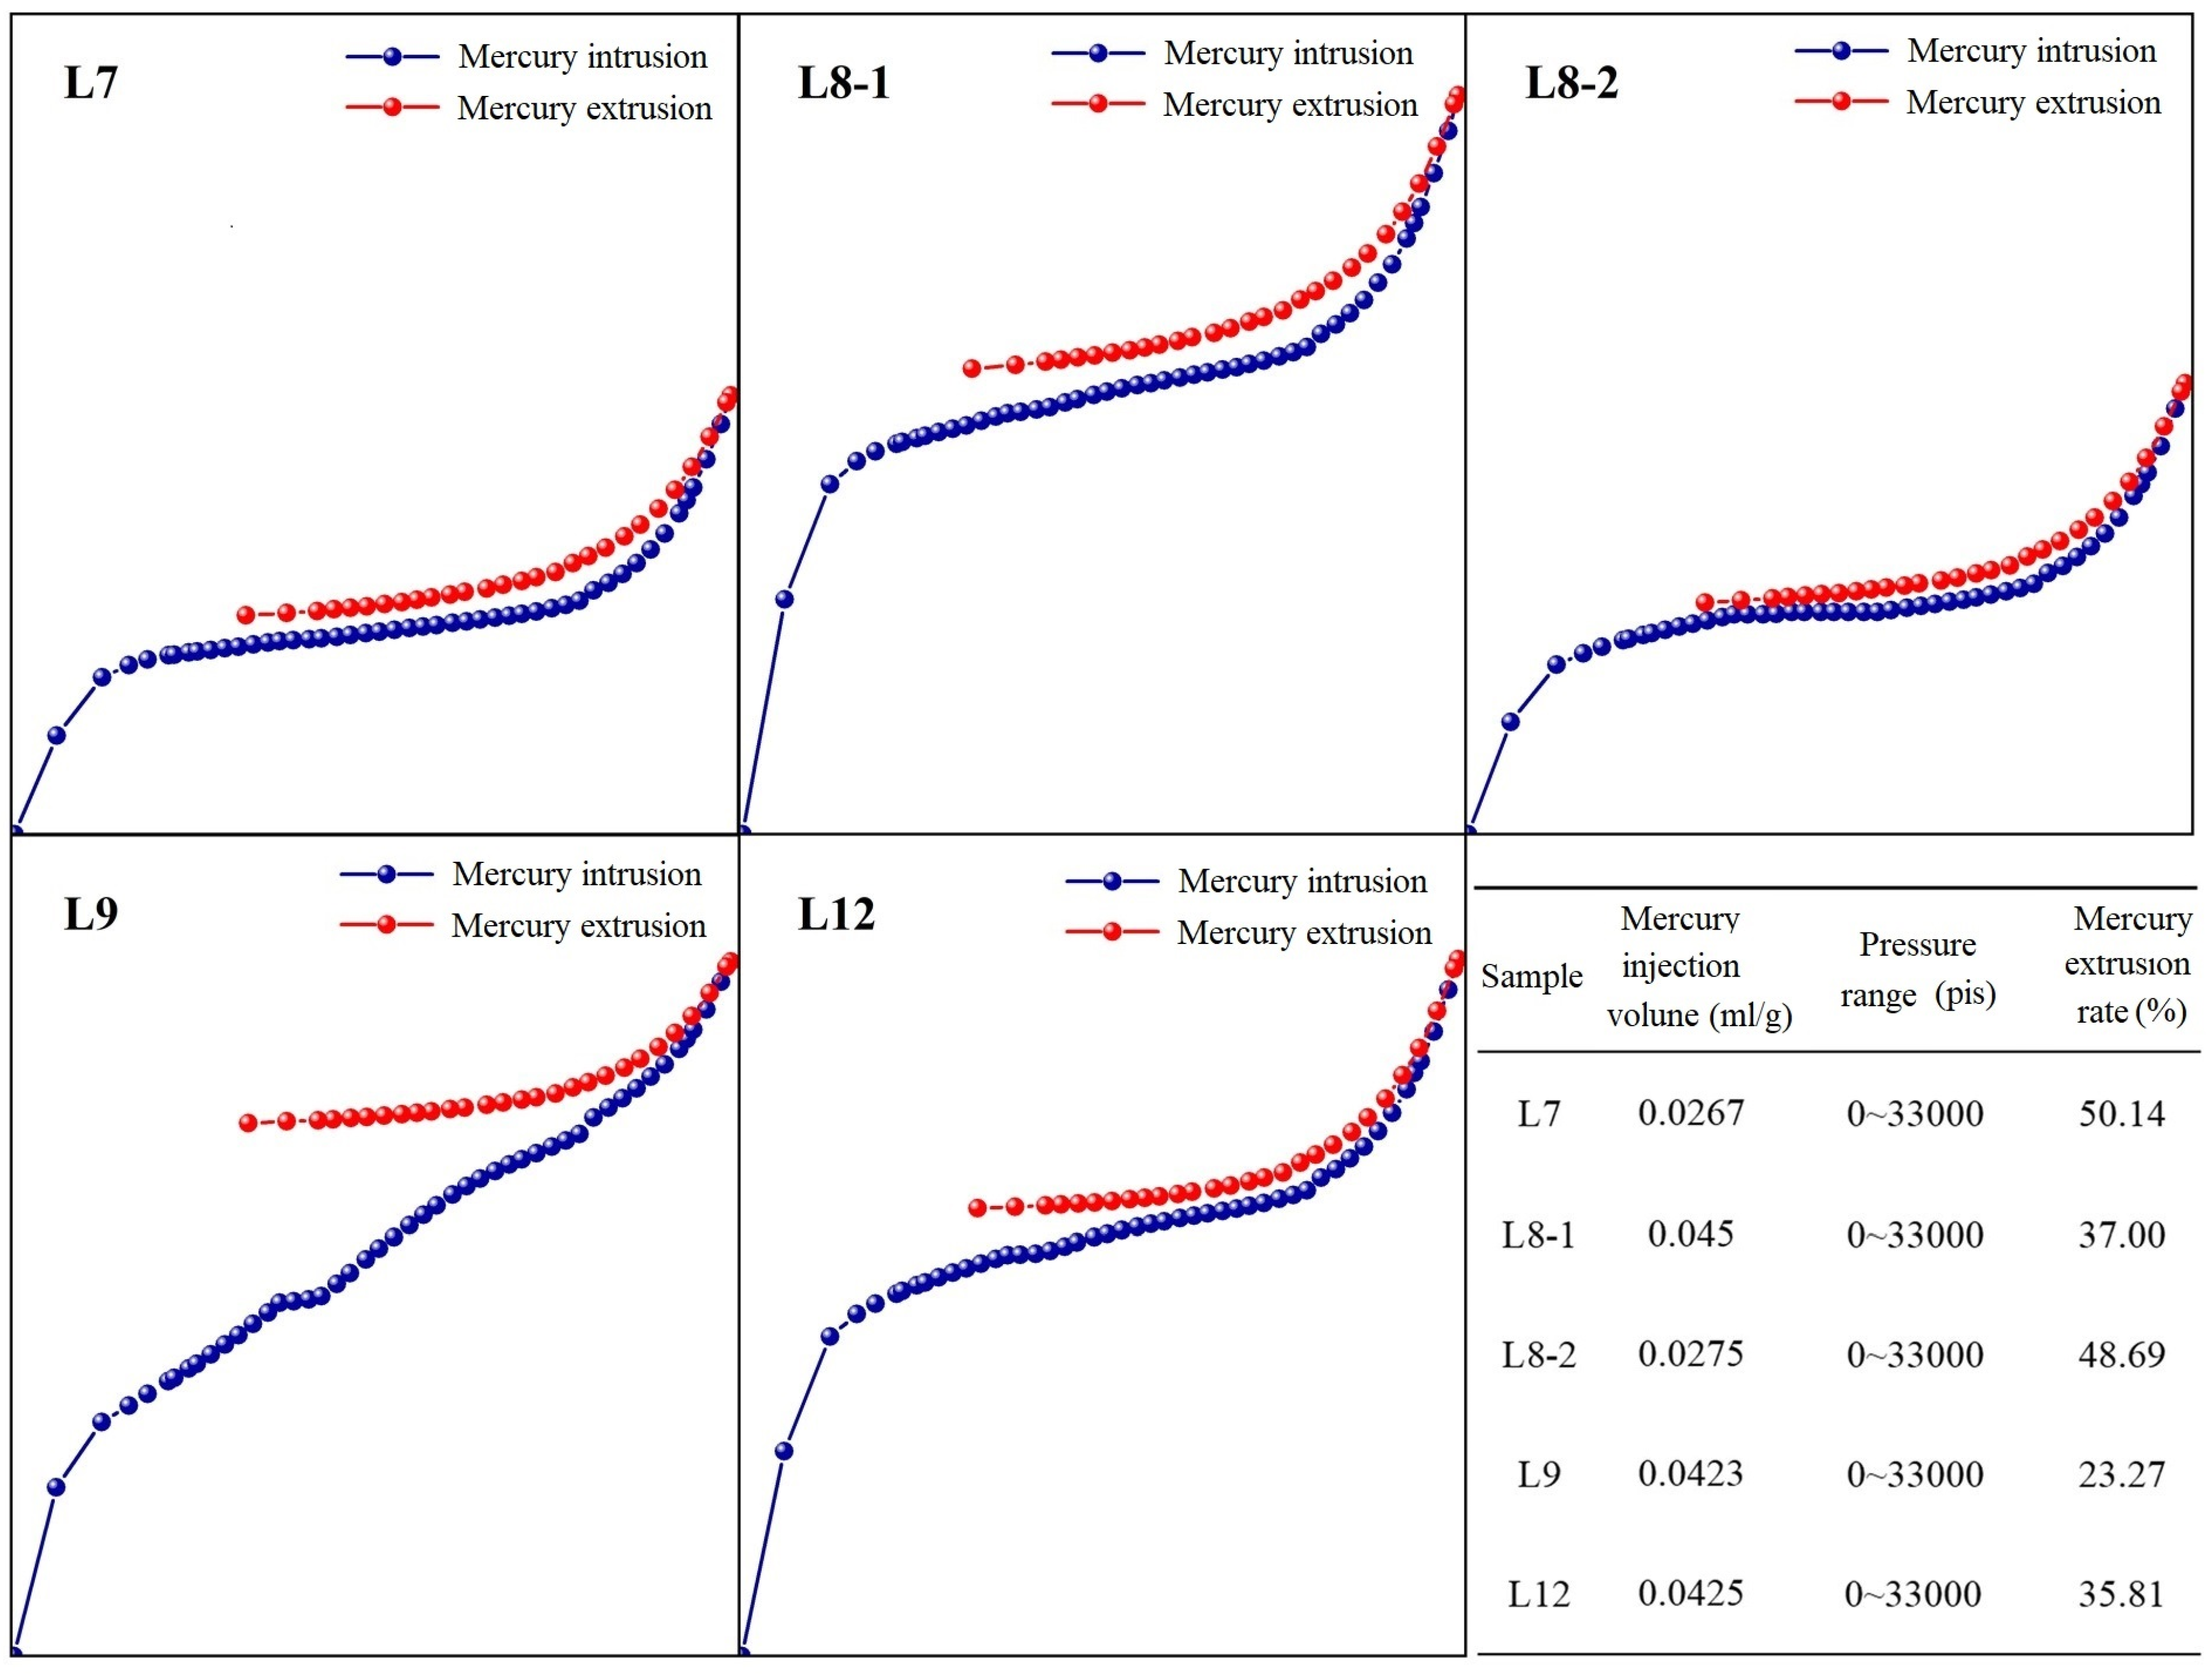
3.2.1. Characteristics of MIP Curve

According to the pressure during the MIP and the corresponding mercury intrusion volume, the mercury intrusion curve (Figure 7) can reflect the pore connectivity and its structural characteristics. As shown in Figure 7, the mercury injection curves of each coal sample show that the cumulative mercury injection volume rises rapidly when the pressure is lower than 1 psia. This is because it is relatively easy for mercury to enter the macropores with better connectivity when the pressure is low. As the pressure increases, the capillary binding force that the mercury needs to overcome when entering pores with relatively small pore size increases, so the growth rate slows. When the pressure reaches a certain level, the mercury injection pressure breaks through the capillary binding force, causing mercury to begin to enter the small pores and micropores. Therefore, the mercury injection volume rises rapidly again at the high-pressure stage with a pressure greater than 3000 psia. Moreover, the mercury injection curve and mercury ejection curve of each coal sample do not coincide, causing the existence of different sizes of hysteresis loops, indicating that there are open or semi-open pores in each coal sample, and the curves of each sample are relatively smooth without obvious inflection points. This also shows that all coal samples have no or very few ink-bottle-shaped pores.
Among them, the hysteresis of sample L7, L8-1 and L9 is more significant than that of L8-2 and L12, indicating that sample L7, L8-1 and L9 have more open pores than other coal samples. Sample L9’s hysteresis loop is the widest, showing a large volume difference between mercury injection and mercury ejection. The hysteresis loops of other coal samples are relatively small, indicating that sample L9 has more open pores and better connectivity than other coal samples. In terms of pore morphology, the pores of the No.9 coal seam are more conducive to gas diffusion and seepage.

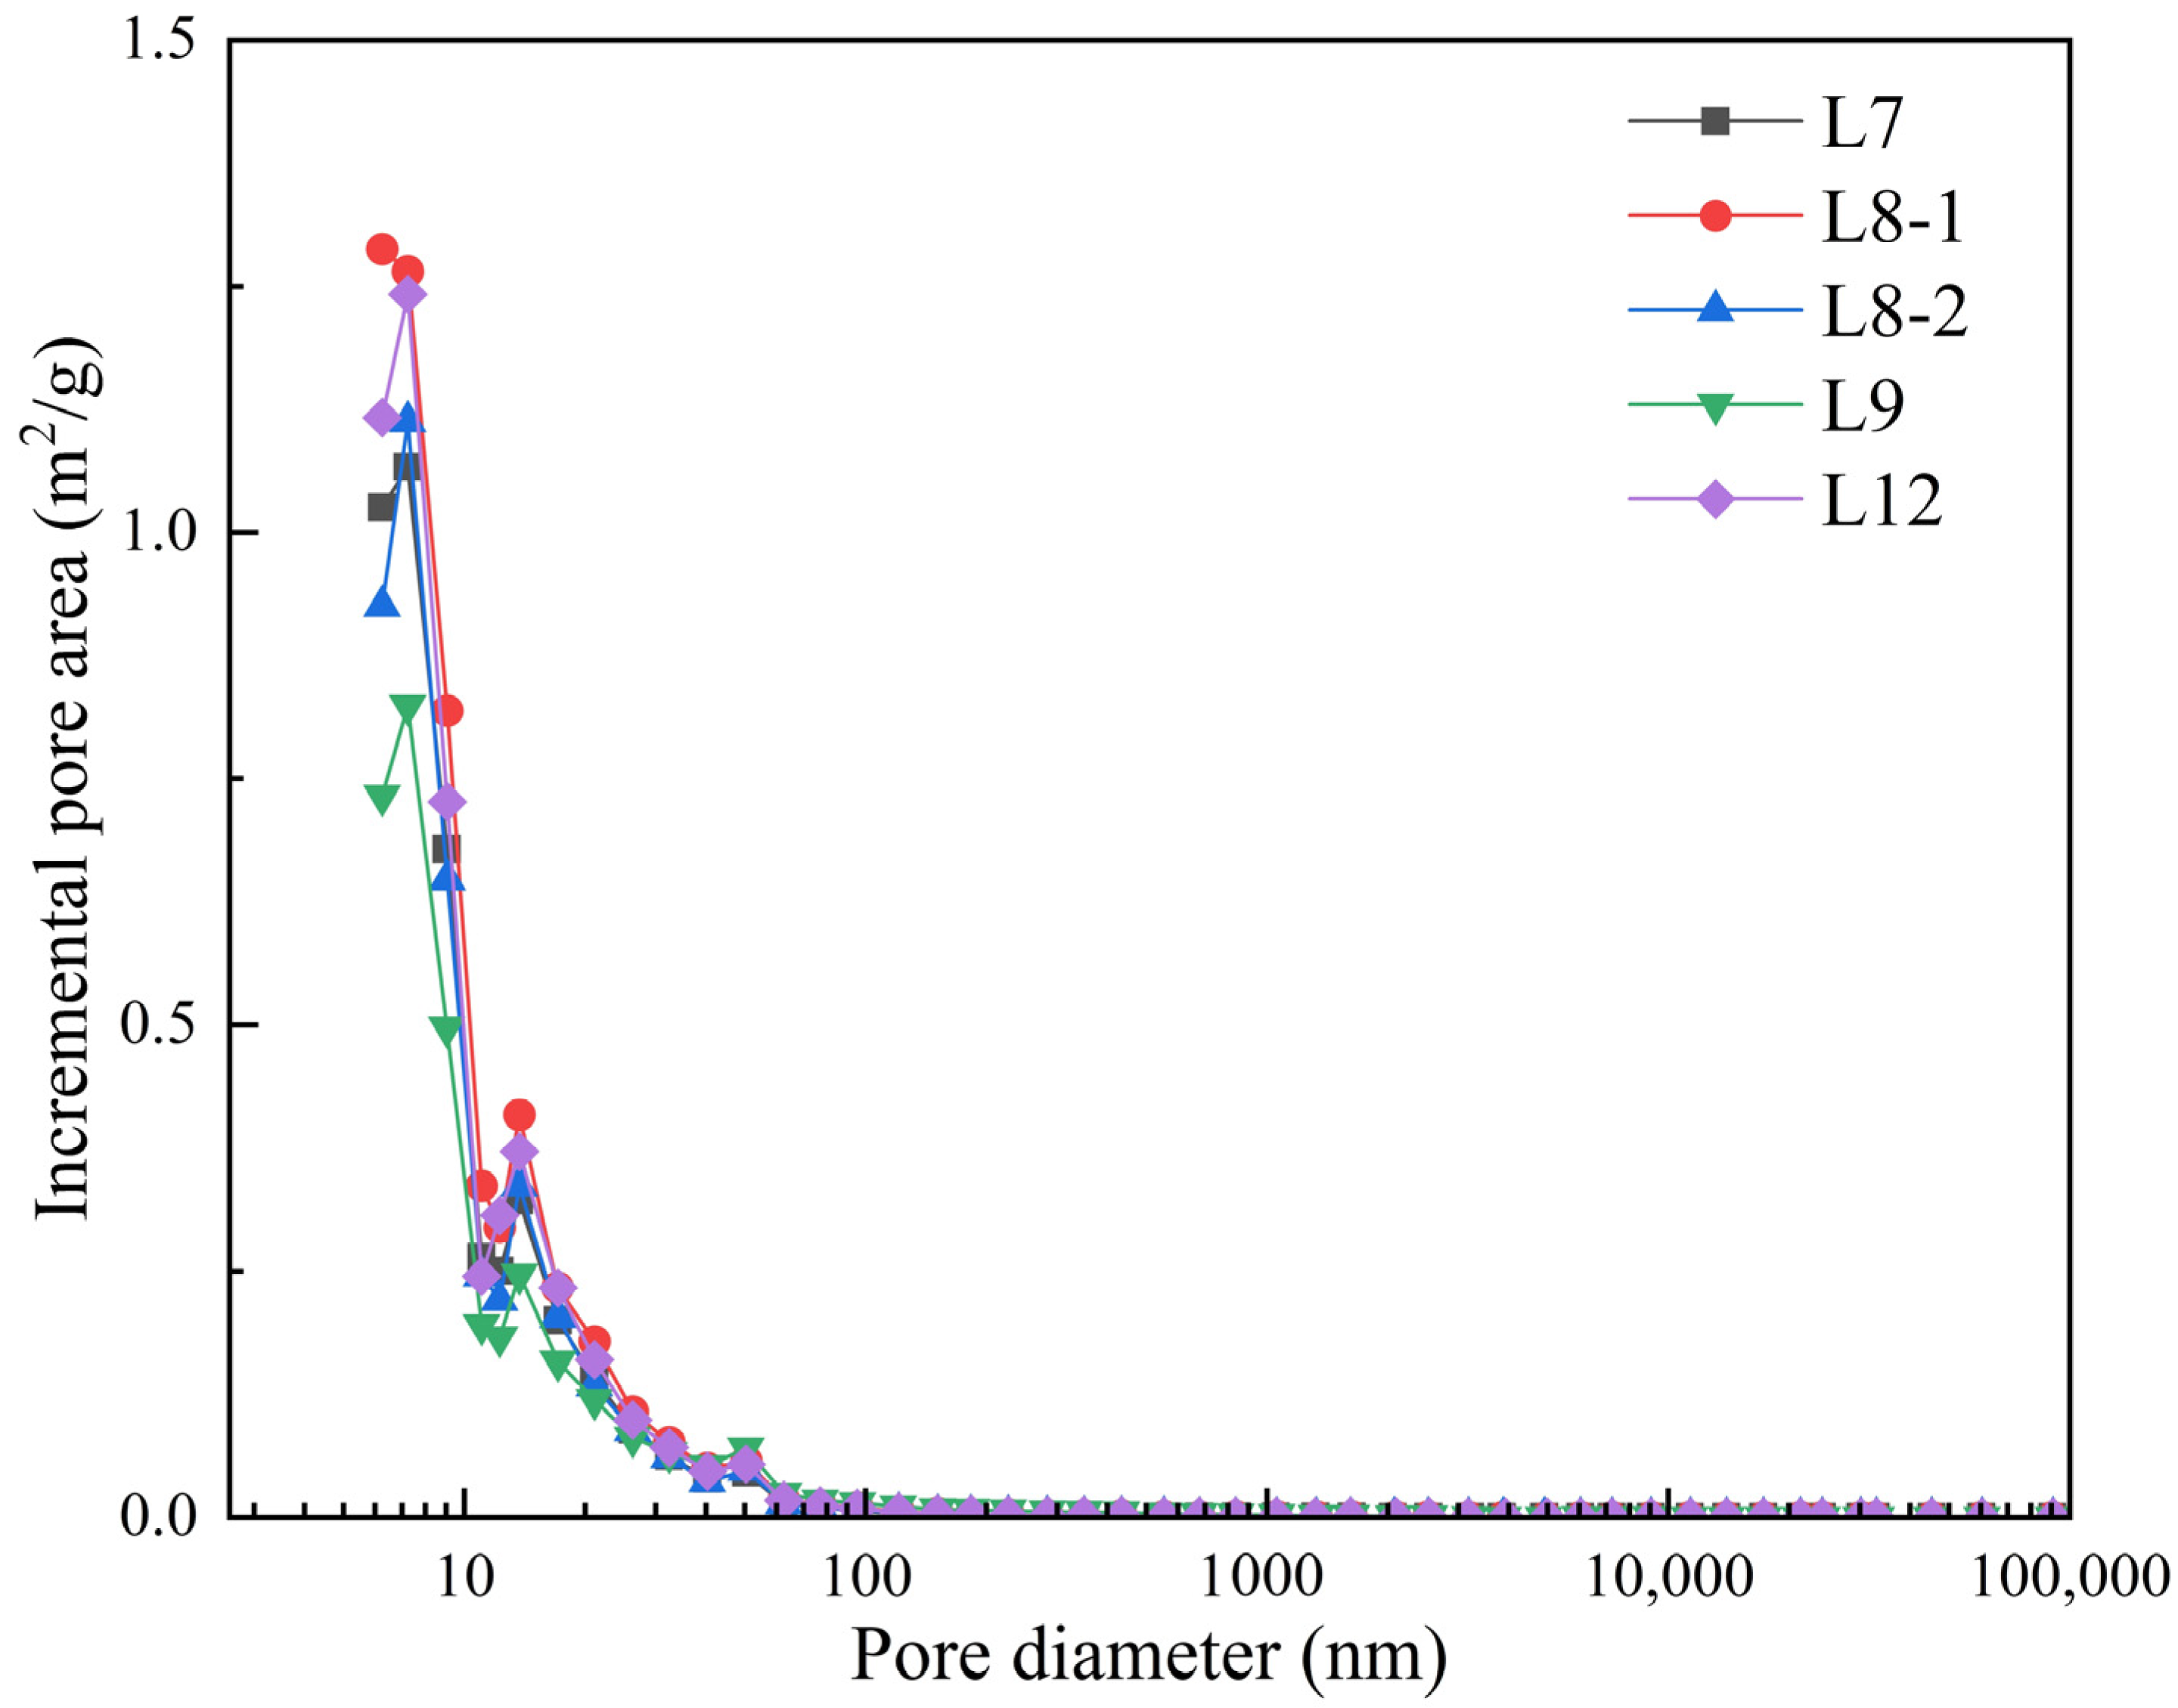
3.2.2. Pore diameter distribution characteristics

As shown in Figure 8 and Table 5, the pore diameter distribution characteristics of all coal samples are similar, with relatively low porosity ranging from 3.79% to 6.94%. The porosity ranking is sample L9 > L12 > L8-1 > L7 > L8-2. The average pore diameter is proportional to the porosity. The stage pore volume decreases when the pore size is less than 100 nm, and then tends to be flat. It begins to rise rapidly when the aperture reaches about 30,000 nm. However, the pore volume of sample L9 was significantly larger than that of other samples in the pore size range of 100~10,000 nm. Except for sample L9, the macropore volume ratio of each coal sample is the highest, ranging from 31.10% to 47.57%. This was followed by the transition pore volume ratio, which was 23.49% to 36.42%. The ratio of micropores is slightly less, and the pore volume accounts for 13–27.03%. The ratio of mesopore is the lowest. The pore size distribution of sample L9 is obviously different from that of other coal samples. The pore capacity ratio of sample L9 is 15.93%, which is significantly higher than that of other coal samples, which is about 5%.
Table 6 shows the SSA characteristics of different pore types of each coal sample. The total pore SSA is 3.351~5.185 m2/g, with an average of 4.466 m2/g. All coal samples show that the SSA of micropores and transition pores accounts for the largest proportion, and the sum of micropores and transition pores accounts for 97.90~99.57% of the total specific surface of pores.
It can be seen from the stage pore SSA and pore diameter relationship curve (Figure 9) that the morphological characteristics of coal sample curves are basically the same. The contribution rate of SSA of sample L9 is significantly lower than that of other coal seams at the micropore stage less than 10 nm. It can also be seen from Table 6 that the large pore SSA ratio of sample L9 is significantly higher than that of other coal seams, which is consistent with the previous pore volume proportion characteristics. This indicates that compared with other coal seams, the large pores of the No.9 coal seam are more developed, and the gas diffusion and seepage capacity of this coal seam is higher, meaning that the pores of this coal seam are more unfavorable to the adsorption of gas.

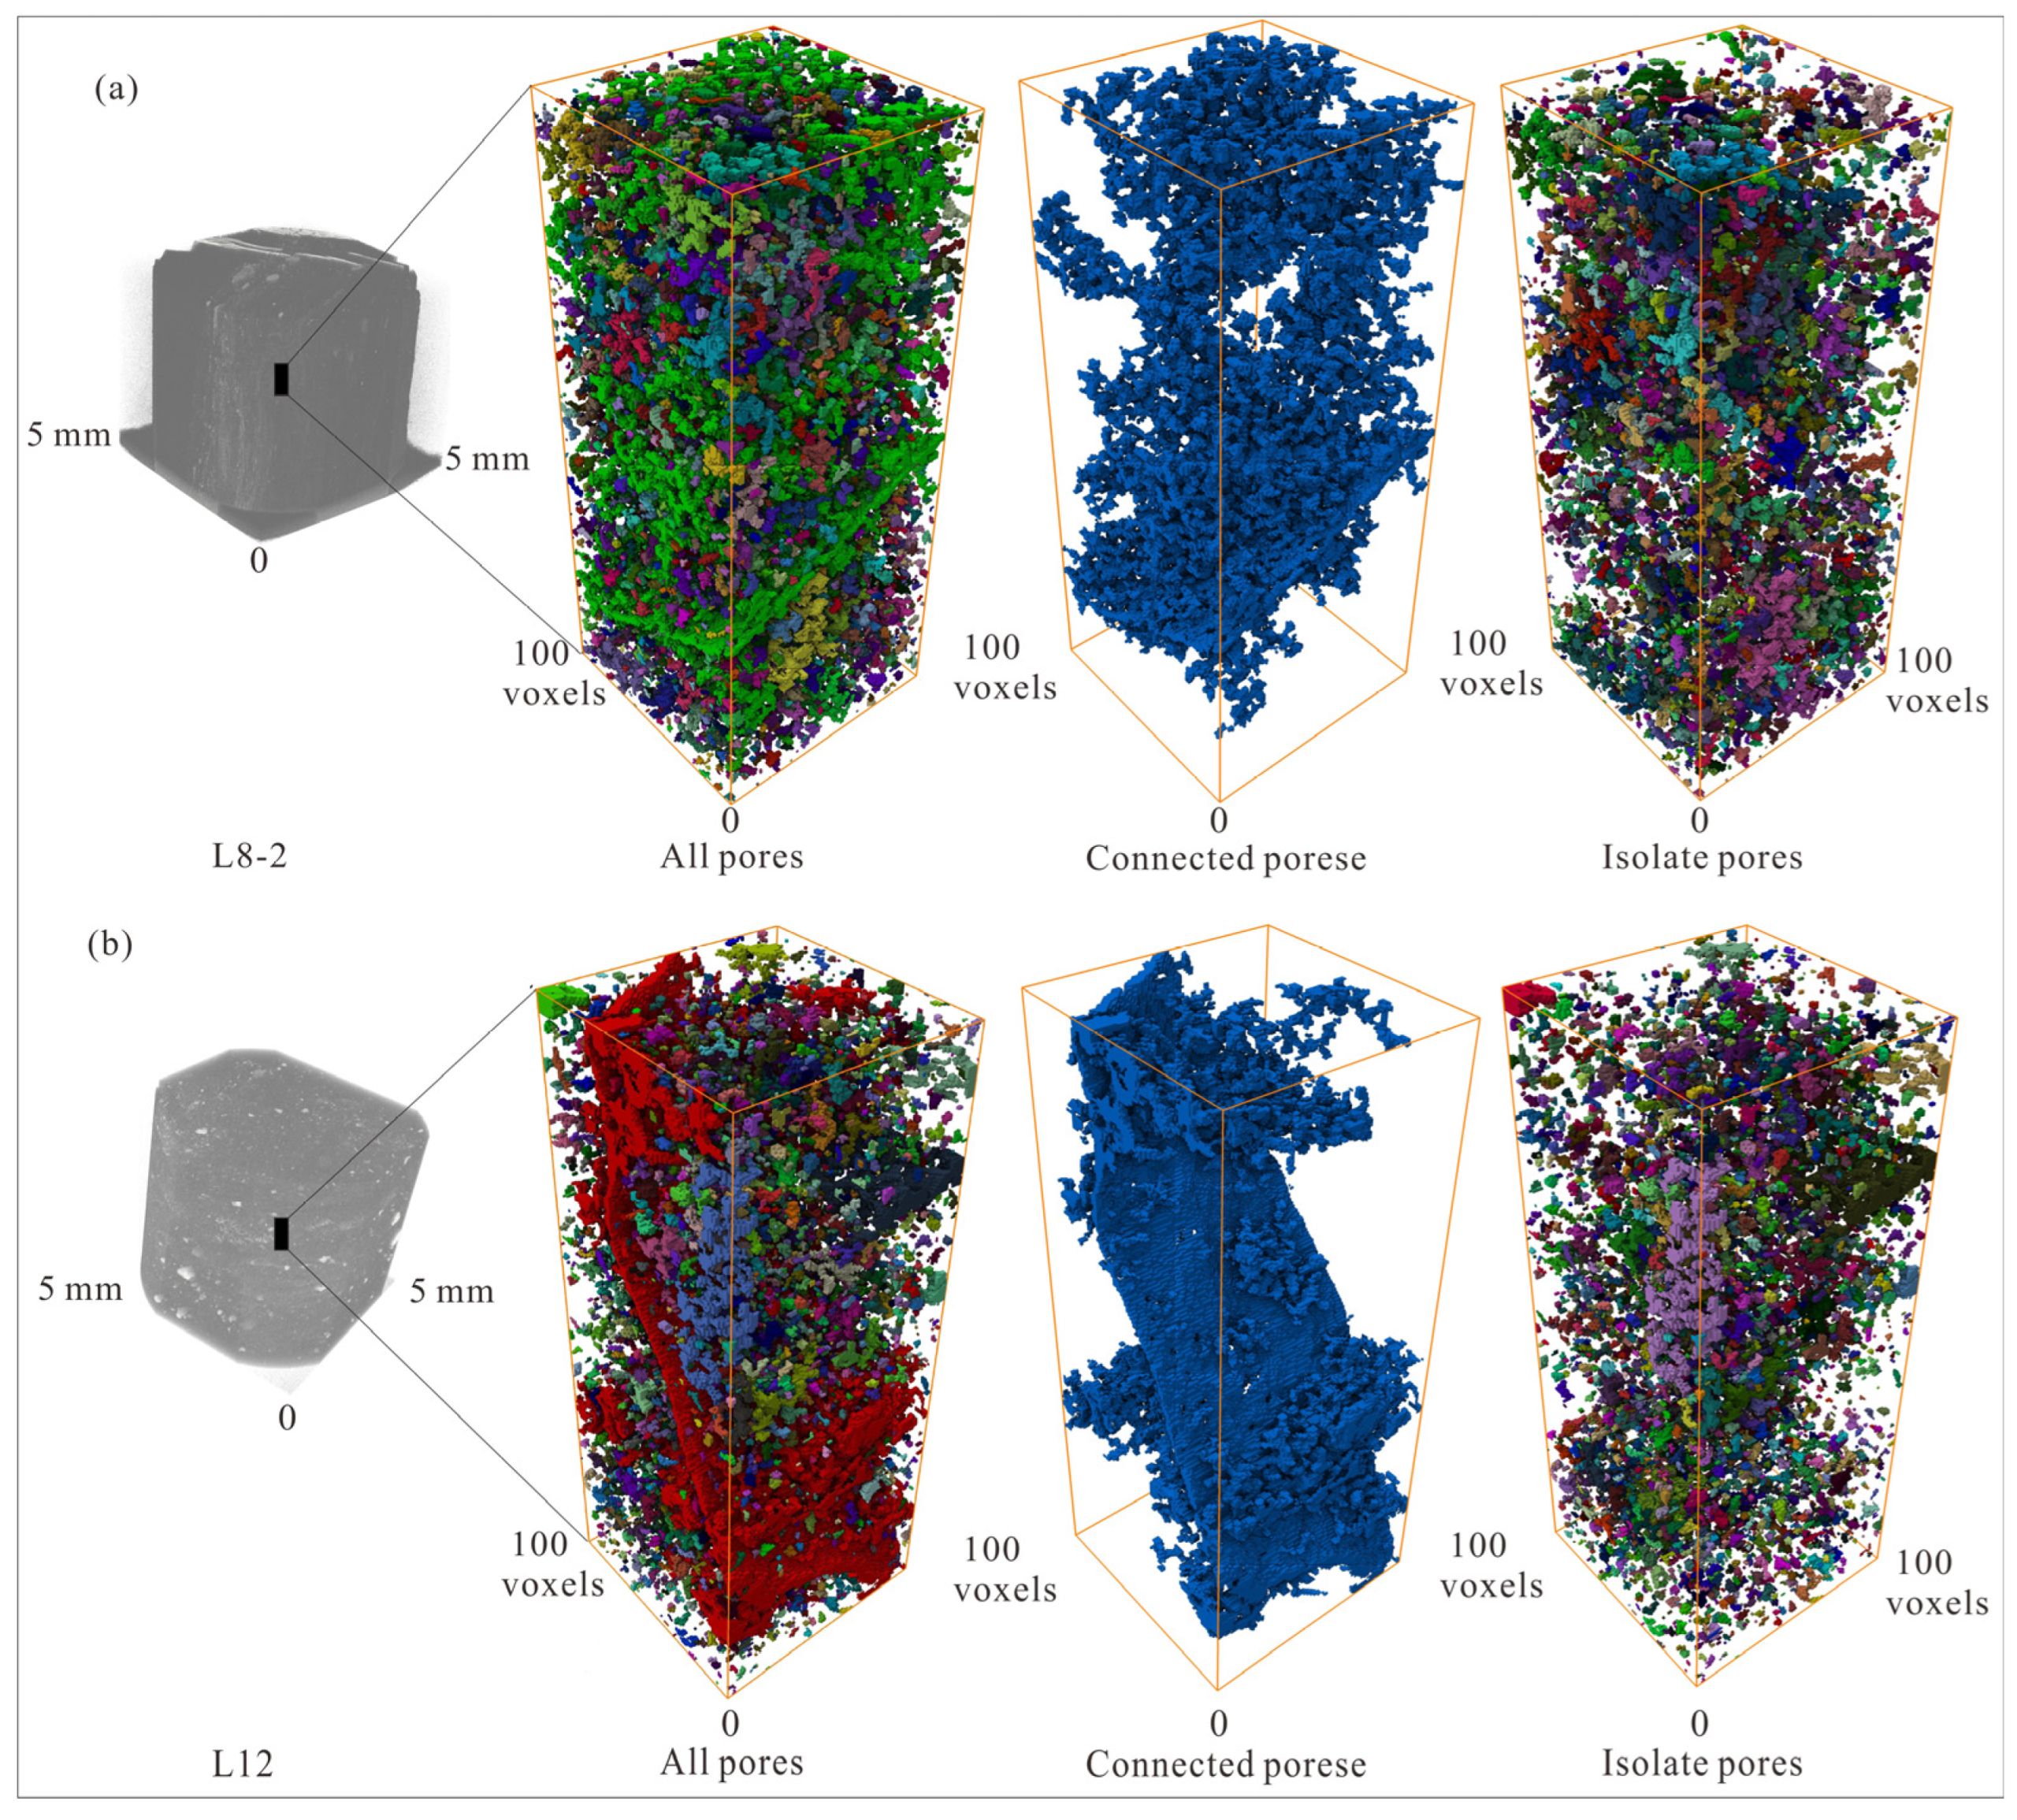
3.3. Characteristics of Pore and Fracture Structure Based on μ-CT Experiment

The μ-CT experimental results of L8-2 and L12 are shown in Figure 10. We selected approximately three to five cubes with 100 × 100 × 250 voxels in the center of coal samples from the reconstructed three-dimensional gray map. The watershed method is used to mark the pores in this range, and the pores with interconnected pores and throats are marked as connected pores, and the rest are isolated pores. Because of the different properties and sizes of samples during CT scanning, the actual size represented by each voxel in the three-dimensional reconstruction will be different. Therefore, the actual range of different samples will be different if the same voxel range is selected. Pore structure information such as the porosity and connectivity of all coal samples is shown in Table 7.
The porosity of L8-2 and L12 is 12.12% and 10.41%, the average pore size is 9.42 μm and 17.61 μm, and the connectivity is 51.22% and 61.59%, respectively. The average number of pores in L12 is more than that in L8, and the pores are more developed. Since the communicating pore is identified as a whole pore, only the pore size distribution of isolated pores is counted in Figure 11. As shown in Figure 11, in the range of 0~15 μm, the pore volume ratio of L8-2 is higher and the micropores are more developed. In the range of 0~50 μm, the pore volume ratio of the two samples is similar, while L12 develops more pores above 50 μm. At the same time, the Df of the two coal samples is 2.4 and 2.3, respectively, which also shows that the pore heterogeneity of L8-2 is higher, the micropores are more developed and the connectivity is worse.

3.4. Pore Adsorption Characteristics Based on Methane Isothermal Adsorption Experiment

The experimental results of the methane isothermal adsorption of coal samples L7, L8-1, L9 and L12 are shown in Table 8, and the isothermal curves of methane adsorption are shown in Figure 12.
When the VL value of coal sample is larger, it is shown that the coal has stronger ability to absorb gas. The adsorption capacity of each coal sample increases with the increase in pressure, and the increase in speed decreases gradually. The adsorption capacity of L12 is the largest, that of L8-1 is the smallest, and that of L9 is slightly larger than that of L7. Basically, with the increase in the buried depth of the coal seam, the gas adsorption capacity of coal seam gradually increases. Except for L7, the VL of L8-1, L9 and L12 increases in turn, and the VP decreases in turn, indicating that the buried depth of the coal seam is directly proportional to VL and inversely proportional to VP. The gas adsorption capacity of L7 is higher than that of L8-1, mainly because the pores of L7 are more developed than those of L8-1. At the same time, the coal sample of the No.12 coal seam has the strongest ability to absorb gas.

3.5. Influence of Pore-Fracture Structure of Coal Reservoir on Gas Adsorption, Diffusion and Seep age

The traditional view is that about 90% of the gas in a coal seam is attached to pore surfaces in an adsorption state, especially in micropores. Generally, the adsorption of gas molecules on the surface of coal is mainly carried out by the attraction of gas molecules by the adsorption potential on the pore wall. There are differences in methane adsorption forms in pores with different sizes, and gas molecules in micropores are mainly enriched in the form of filling, which is caused by the superposition potential energy of adsorption force fields in micropores. Additionally, the gas molecules in transition pores, mesopores and macropores are mainly covered on the pore surface [38].
Coal mass is a “dual medium system” combustible organic rock with a complex pore and fracture network. The migration and output of gas in coal generally goes through three stages: desorption, diffusion and seepage [39]. The fluid molecules in the micropore adsorption state directly affect the migration law of gas in the first and middle stages, and indirectly control the dynamic characteristics of gas desorption in the later stage. Gas molecules with different pore structures have different migration forms. Scholars generally regard pores larger than 1.5 nm as gas diffusion channels, and gas diffusion channels are the connecting parts between adsorption filling spaces and seepage channels. The seepage of gas in cracks is mainly driven by a pressure gradient. After many scholars’ research, a pore size of 100 nm can basically be regarded as the dividing point between diffusion pores and seepage pores. Figure 13 shows the main occurrence and migration modes of gas in different pores of coal. Most gas molecules are attached to the multi-stage structure of filling pores, diffusion pores and seepage pores in an adsorption state, and a small number of gas molecules exist in free state, while micropore filling is the main mode of gas occurrence in coal, and micropore filling with a size of less than 1.5 nm accounts for a high proportion. Micropores and transition pores larger than 1.5 nm act as diffusion channels, and both adsorbed gas and free gas exist in this space. The mesopores and macropores are the gas seepage channels, which provide most of the free gas. In this paper, the pore structure and methane adsorption characteristics of the four main coal seams in Lvjiatuo Mine were quantitatively characterized. The results show that the mesopores and macropores in the No.9 coal seam are the most developed, and the gas seepage capacity is the strongest. The micropores and transition pores in the No.7, No.8 and No.12 coal seams are highly developed and close to each other, and the methane adsorption characteristics are ranked as follows: No.12 coal seam > No.9 coal seam > No.7 coal seam > No.8 coal seam. Meanwhile, combined with the buried depth of each coal seam and the lithology difference of the roof and floor, it is predicted that the gas content in the pores of the No.12 coal seam is the highest, and abnormal gas emissions and gas outbursts are most likely to occur. The roof of No.8 coal seam is mudstone, which has good sealing effect on gas, so gas outbursts in No.8 coal seam should also be prevented. Therefore, during the gas drainage and control, it is suggested that the pumping quantity should be controlled in the order of No.12 coal seam > No.8 coal seam > No.7 coal seam > No.9 coal seam.

4. Conclusions

In this paper, LT-N2GA, MIP and μ-CT coal pore testing experiments are used to study the pore structure characteristics of the main coal seams in Lvjiatuo Mine, and methane isothermal adsorption experiments are used to study the gas adsorption capacity of main coal seams. The influence of coal seam pore structure on coal seam gas adsorption and diffusion in the study area is also discussed, and the conclusions are as follows:
(1)
The adsorption–desorption curves of all coal samples are of type Ⅲ, and the pore development types of all coal seams are similar. Micropores and transition pores contribute most of the pore volume and pore specific surface area. By comparing the pore structure characteristics of all coal seams, the macropores of the No. 9 coal seam are the most developed, and the connectivity is also the best, providing channel sfor gas diffusion and seepage. The micropores of the No. 7, 8, 11 and 12 coal seams are more developed, providing the main gas adsorption place.
(2)
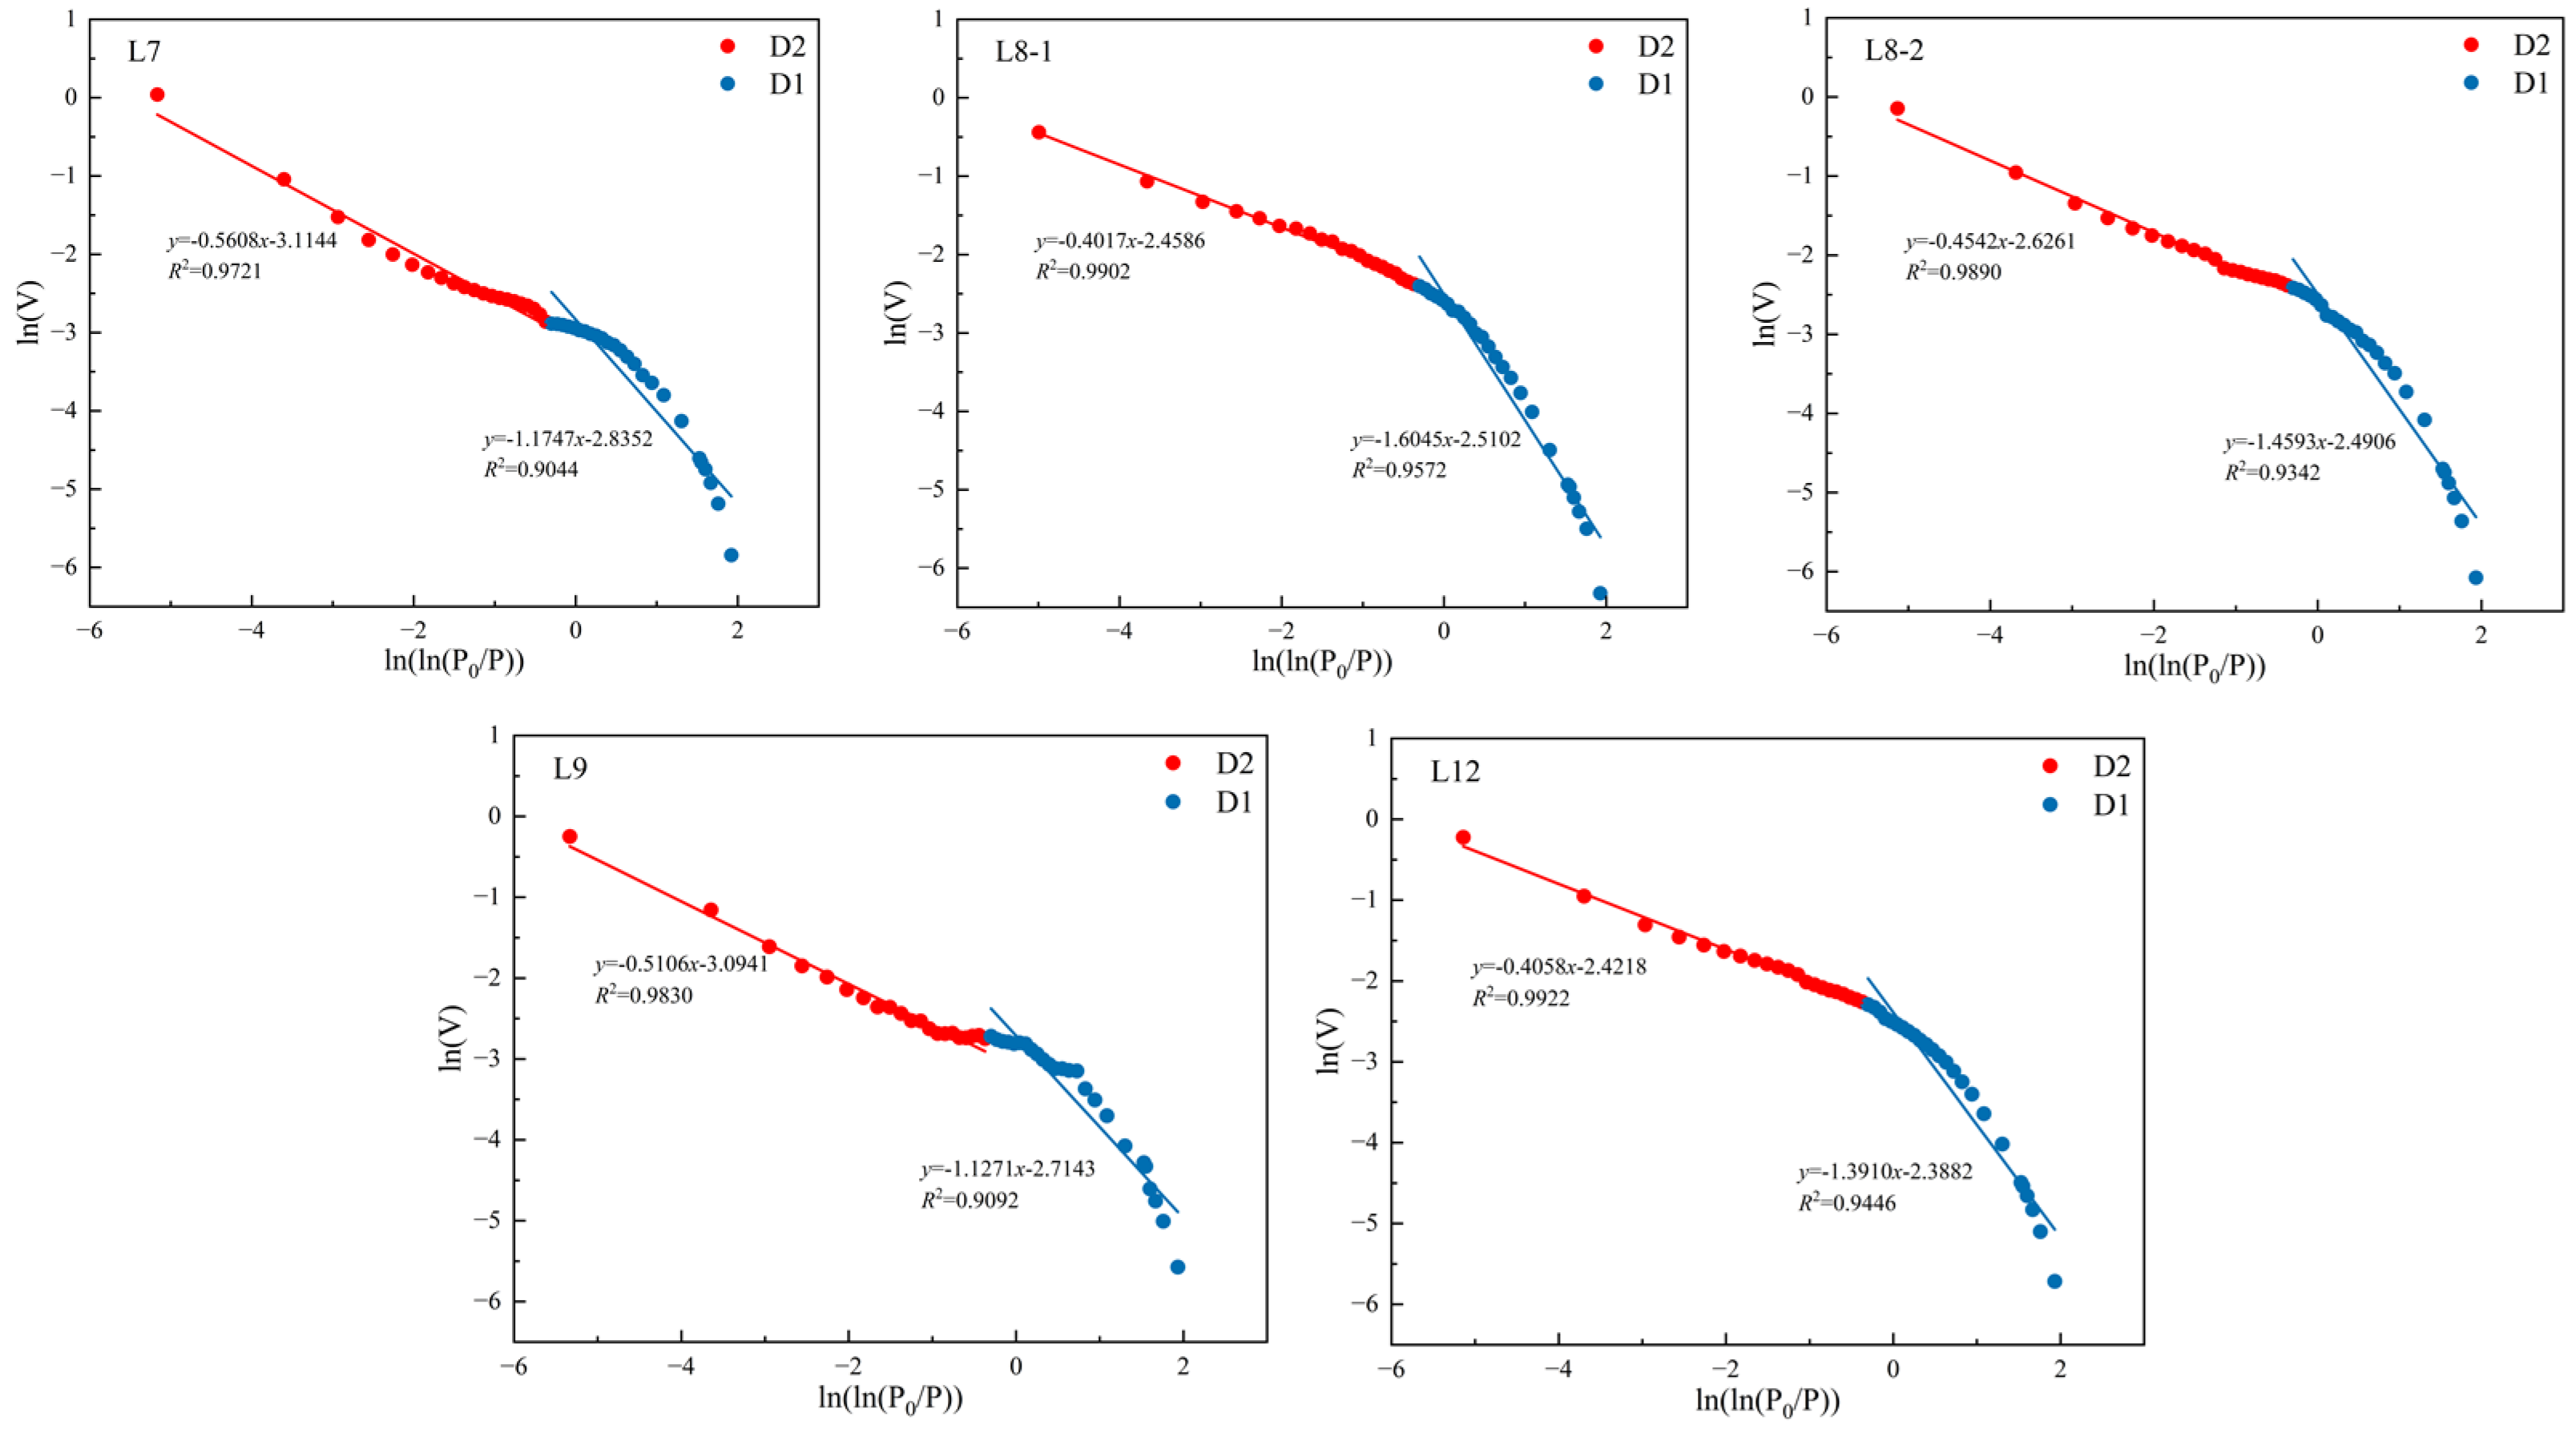
The three-dimensional pore network structure of coal is intuitively displayed through μ-CT experiments, and the connected pores and isolated pores are distinguished. The connectivity provides a basis for the comparison of gas adsorption, diffusion and seepage capacity in coal. The heterogeneity of coal pores is quantitatively characterized by fractal theory. The more micropores that are developed, the higher the fractal dimension and the higher the porosity heterogeneity are. The gas adsorption capacity of all coal seams is compared through the methane isothermal adsorption experiment.
(3)
Based on previous research and the pore structure characteristics of all coal seams in this paper, the influence of the pore-fracture structure of coal reservoirs on gas adsorption, diffusion and seepage is discussed, and finally the gas outburst risk of each coal seam is predicted. The prediction conclusion shows that abnormal gas emissions and gas outbursts are most likely to occur in the No.12 coal seam. The experimental results have important guiding significance for gas prevention and control in deep mining.

Author Contributions

Conceptualization, C.H.; methodology, C.H. and J.L.; software, C.H. and J.L.; validation, C.H., J.L. and Q.X.; formal analysis, J.L.; investigation, W.L.; writing—original draft preparation, C.H. and J.L.; writing—review and editing, J.L. and W.L.; visualization, W.L.; supervision, W.L.; project administration, W.L.; funding acquisition, W.L. All authors have read and agreed to the published version of the manuscript.

Funding

This research was funded by the National Natural Science Foundation of China (Grant No. 41972169).

Data Availability Statement

Where data is unavailable due to privacy or ethical restrictions, a statement is still required.

Conflicts of Interest

The authors declare no conflict of interest.

References

  1. Liu, P.; Liu, A.; Zhong, F.; Jiang, Y.; Li, J. Pore/fracture structure and gas permeability alterations induced by ultrasound treatment in coal and its application to enhanced coalbed methane recovery. J. Pet. Sci. Eng. 2021, 205, 108862. [Google Scholar] [CrossRef]
  2. Qin, Y.; Zhao, Z.; Xu, H.; Liu, W.; Wu, F.; Zhou, Y.; Duan, W. Numerical solution of three mathematical models of gas adsorption in coal particle based on finite difference method. Fuel 2022, 308, 122036. [Google Scholar] [CrossRef]
  3. Yang, N.; Hu, G.; Zhu, J.; Duan, H.; Wang, T.; Li, Y. Evolution of pore-fracture structure and permeability of coal by microwave irradiation under uniaxial compression. J. Nat. Gas Sci. Eng. 2022, 107, 104759. [Google Scholar] [CrossRef]
  4. Yin, T.T.; Liu, D.M.; Cai, Y.D.; Zhou, Y.F. Methane adsorption constrained by pore structure in high-rank coals using FESEM, CO2 adsorption, and NMRC techniques. Energy Sci. Eng. 2019, 7, 255–271. [Google Scholar] [CrossRef] [Green Version]
  5. Liu, D.; Qiu, F.; Liu, N.; Cai, Y.; Guo, Y.; Zhao, B.; Qiu, Y. Pore structure characterization and its significance for gas adsorption in coals: A comprehensive review. Unconv. Resour. 2022, 2, 139–157. [Google Scholar] [CrossRef]
  6. Liu, D.; Yao, Y.; Yuan, X.; Yang, Y. Experimental evaluation of the dynamic water-blocking effect in coalbed methane reservoir. J. Pet. Sci. Eng. 2022, 217, 110887. [Google Scholar] [CrossRef]
  7. Pan, J.; Zhu, H.; Hou, Q.; Wang, H.; Wang, S. Macromolecular and pore structures of Chinese tectonically deformed coal studied by atomic force microscopy. Fuel 2015, 139, 94–101. [Google Scholar] [CrossRef]
  8. Shi, X.; Pan, J.; Pang, L.; Wang, R.; Li, G.; Tian, J.; Wang, H. 3D microfracture network and seepage characteristics of low-volatility bituminous coal based on nano-CT. J. Nat. Gas Sci. Eng. 2020, 83, 103556. [Google Scholar] [CrossRef]
  9. Wu, M.; Li, H.; Wang, L.; Yang, X.; Dai, C.; Yang, N.; Li, J.; Wang, Y.; Yu, M. μCT quantitative assessment of the pore–fracture structures and permeability behaviors of long-flame coal treated by infrared rapid heating. Energy 2023, 274, 127308. [Google Scholar] [CrossRef]
  10. Hu, L.; Zhu, Y.; Zhang, J. Analysis of Gas Geological Control Factors for Lvjiatuo Mine. Saf. Coal Mines 2016, 47, 182–185. [Google Scholar]
  11. Hu, C. Study on Deep Gas Geological Law and Gas Prediction in Lvjiatuo Mine; China University of Mining and Technology: Xuzhou, China, 2021. [Google Scholar]
  12. Wei, Q.; Li, X.; Zhang, J.; Hu, B.; Zhu, W.; Liang, W.; Sun, K. Full-size pore structure characterization of deep-buried coals and its impact on methane adsorption capacity: A case study of the Shihezi Formation coals from the Panji Deep Area in Huainan Coalfield, Southern North China. J. Pet. Sci. Eng. 2019, 173, 975–989. [Google Scholar] [CrossRef]
  13. Pan, R.; Li, C.; Yu, M.; Xiao, Z.; Fu, D. Evolution patterns of coal micro-structure in environments with different temperatures and oxygen conditions. Fuel 2020, 261, 116425. [Google Scholar] [CrossRef]
  14. Zhang, Y.; Niu, K.; Du, W.; Zhang, J.; Wang, H.; Zhang, J. A method to identify coal spontaneous combustion-prone regions based on goaf flow field under dynamic porosity. Fuel 2021, 288, 119690. [Google Scholar] [CrossRef]
  15. Chattaraj, S.; Upadhyay, R.; Mohanty, D.; Halder, G.; Kumar, T. Evaluating production behaviour of CBM wells from Raniganj Coalfield through reservoir characterization under constrained field data conditions. J. Nat. Gas Sci. Eng. 2021, 92, 103969. [Google Scholar] [CrossRef]
  16. Vasilenko, T.; Kirillov, A.; Islamov, A.; Doroshkevich, A. Study of hierarchical structure of fossil coals by small-angle scattering of thermal neutrons. Fuel 2021, 292, 120304. [Google Scholar] [CrossRef]
  17. Sun, Z.; Huang, B.; Liu, Y.; Jiang, Y.; Zhang, Z.; Hou, M.; Li, Y. Gas-phase production equation for CBM reservoirs: Interaction between hydraulic fracturing and coal orthotropic feature. J. Pet. Sci. Eng. 2022, 213, 110428. [Google Scholar] [CrossRef]
  18. Cai, Y.; Li, Q.; Liu, D.; Zhou, Y.; Lv, D. Insights into matrix compressibility of coals by mercury intrusion porosimetry and N2 adsorption. Int. J. Coal Geol. 2018, 200, 199–212. [Google Scholar] [CrossRef] [Green Version]
  19. Li, Y.; Yang, J.; Pan, Z.; Tong, W. Nanoscale pore structure and mechanical property analysis of coal: An insight combining AFM and SEM images. Fuel 2020, 260, 116352. [Google Scholar] [CrossRef]
  20. Liu, N.; Sun, L.; Qin, B.; Zhang, S.; Du, W. Evolution of pore and fracture of coal under heating–freezing effects: An experimental study. Fuel 2021, 306, 121618. [Google Scholar] [CrossRef]
  21. Zheng, S.; Yao, Y.; Sang, S.; Liu, D.; Wang, M.; Liu, S. Dynamic characterization of multiphase methane during CO2-ECBM: An NMR relaxation method. Fuel 2022, 324, 124526. [Google Scholar] [CrossRef]
  22. Liu, P.; Nie, B.; Zhao, Z.; Li, J.; Yang, H.; Qin, C. Permeability of micro-scale structure in coal: Insights from μ-CT image and pore network modelling. Gas Sci. Eng. 2023, 111, 204931. [Google Scholar] [CrossRef]
  23. Wang, L.; Cheng, J.; Jin, Z.; Sun, Q.; Zou, R.; Meng, Q.; Liu, K.; Su, Y.; Zhang, Q. High-pressure hydrogen adsorption in clay minerals: Insights on natural hydrogen exploration. Fuel 2023, 344, 127919. [Google Scholar] [CrossRef]
  24. Fang, H.; Sang, S.; Liu, S.; Du, Y. Methodology of three-dimensional visualization and quantitative characterization of nanopores in coal by using FIB-SEM and its application with anthracite in Qinshui basin. J. Pet. Sci. Eng. 2019, 182, 106285. [Google Scholar] [CrossRef]
  25. Chen, S.B.; Gong, Z.; Li, X.Y.; Wang, H.J.; Wang, Y.; Zhang, Y.K. Pore structure and heterogeneity of shale gas reservoirs and its effect on gas storage capacity in the Qiongzhusi Formation. Geosci. Front. 2021, 12, 101244. [Google Scholar] [CrossRef]
  26. Li, J.; Zhang, J.; Huang, K.; Li, W. Dynamic Variation on Water Micro-occurrence in Low-Rank Coals by a Low-Field Nuclear Magnetic Resonance Experiment: A Case Study of the No. 7 Coal Seam in Kongzhuang Coal Mine. Energy Fuels 2022, 36, 9066–9079. [Google Scholar] [CrossRef]
  27. Li, Y.; Song, D.; Liu, S.; Ji, X.; Hao, H. Evaluation of pore properties in coal through compressibility correction based on mercury intrusion porosimetry: A practical approach. Fuel 2021, 291, 120130. [Google Scholar] [CrossRef]
  28. Mahamud, M.M.; Menéndez, J.M.; Álvarez, A. Fractal analysis of CO2 and N2 adsorption data to assess textural changes during char gasification. Fuel Process. Technol. 2019, 189, 15–27. [Google Scholar] [CrossRef]
  29. Washburn; Edward, W. The Dynamics of Capillary Flow. Phys. Rev. 1921, 17, 273–283. [Google Scholar] [CrossRef] [Green Version]
  30. Chengyang, W.; Shixiong, H.; Wenjing, S.; Wei, C. Fractal dimension of coal particles and their CH4 adsorption. Int. J. Min. Sci. Technol. 2012, 22, 855–858. [Google Scholar] [CrossRef]
  31. Liu, X.; Nie, B. Fractal characteristics of coal samples utilizing image analysis and gas adsorption. Fuel 2016, 182, 314–322. [Google Scholar] [CrossRef]
  32. Li, Z.; Ren, T.; Li, X.; Qiao, M.; Yang, X.; Tan, L.; Nie, B. Multi-scale pore fractal characteristics of differently ranked coal and its impact on gas adsorption. Int. J. Min. Sci. Technol. 2023, 33, 389–401. [Google Scholar] [CrossRef]
  33. Yao, Y.; Liu, D.; Tang, D.; Tang, S.; Huang, W. Fractal characterization of adsorption-pores of coals from North China: An investigation on CH4 adsorption capacity of coals. Int. J. Coal Geol. 2008, 73, 27–42. [Google Scholar] [CrossRef]
  34. Wang, M.; Xue, H.; Tian, S.; Wilkins, R.W.T.; Wang, Z. Fractal characteristics of Upper Cretaceous lacustrine shale from the Songliao Basin, NE China. Mar. Pet. Geol. 2015, 67, 144–153. [Google Scholar] [CrossRef]
  35. Sun, L.; Zhang, C.; Wang, G.; Huang, Q.; Shi, Q. Research on the evolution of pore and fracture structures during spontaneous combustion of coal based on CT 3D reconstruction. Energy 2022, 260, 125033. [Google Scholar] [CrossRef]
  36. Sing, K.S.W. Reporting physisorption data for gas/solid systems with special reference to the determination of surface area and porosity (Recommendations 1984). Pure Appl. Chem. 1985, 57, 603–619. [Google Scholar] [CrossRef]
  37. Hodot, B. Outburst of Coal and Coalbed Gas; China Industry Press: Beijing, China, 1966; pp. 23–25. [Google Scholar]
  38. Ortiz, L.; Kuchta, B.; Firlej, L.; Roth, M.W.; Wexler, C. Methane adsorption in nanoporous carbon: The numerical estimation of optimal storage conditions. Mater. Res. Express 2016, 3, 055011. [Google Scholar] [CrossRef]
  39. Moore, T.A. Coalbed methane: A review. Int. J. Coal Geol. 2012, 101, 36–81. [Google Scholar] [CrossRef]
Figure 1. Basic information of the sampling area.
Processes 11 01700 g001
Figure 2. Macro-petrographic photos of coal samples.
Processes 11 01700 g002
Figure 3. Adsorption–desorption curves of samples from each main coal seam.
Processes 11 01700 g003
Figure 4. Distribution of pore diameter and pore volume of each coal seam sample ((a): pore volume distribution of DFT micropores; (b): pore volume distribution of BJH micropores and mesopores).
Processes 11 01700 g004
Figure 5. Specific surface area distribution of each coal seam sample ((a): pore SSA distribution of DFT micropores; (b): pore specific surface area of BJH micropores and mesopores).
Processes 11 01700 g005
Figure 6. Relationship between the lnV and ln(ln(P0/P)) of the coal samples.
Processes 11 01700 g006
Figure 7. Relationship between cumulative mercury intrusion and pressure.
Processes 11 01700 g007
Figure 8. Stage pore volume area and pore diameter relationship curve.
Processes 11 01700 g008
Figure 9. Stage SSA and pore diameter relationship curve.
Processes 11 01700 g009
Figure 10. μ-CT 3D reconstruction and pore distribution. (a)-data and pore system of sample L8-2; (b)-data and pore system of sample L12.
Processes 11 01700 g010
Figure 11. Relationship between isolated pore volume and diameter based on μ-CT. a-data of L8-2 sample; b-data of sample L12.
Processes 11 01700 g011
Figure 12. Isothermal adsorption curve of coal samples.
Processes 11 01700 g012
Figure 13. Occurrence and migration of gas in coal pores.
Processes 11 01700 g013
Table 1. Basic information of coal samples.
Sample IDRo,max (%)Vitrinite (%)Inertinite (%)Exinite (%)Mineral (%)
L71.4952.8230.1415.022.02
L8-11.4854.8826.0517.032.04
L8-21.5558.0421.3816.314.27
L91.5371.1215.2110.513.16
L121.4275.1313.854.836.19
Table 2. μ-CT experimental parameters.
ParametersTiming/msAverageSkipBinningSensitivityVsensorImages
nm100021100011500
μm1000211 × 1100011500
Table 3. Basic parameters of LT-N2GA.
Sample IDAverage Pore Diameter (nm)Total SSA (m2/g)Total Pore Volume (mL/g)
L74.010.160.0016
L8-11.850.220.0010
L8-22.620.210.0013
L92.740.180.0012
L122.080.240.0012
Table 4. Fractal dimension of all coal samples.
SampleP/P0 < 0.5P/P0 > 0.5
Fitting EquationR2D1Fitting EquationR2D2
L7y = −1.17x − 2.840.901.82y = −0.56x − 3.10.972.44
L8-1y = −1.60x − 2.510.961.39y = −0.40x − 2.460.992.59
L8-2y = −1.46x − 2.490.931.54y = −0.45x − 2.630.992.55
L9y = −1.13x − 2.710.911.87y = −0.51x − 3.090.982.49
L12y = −1.39x − 2.390.941.61y = −0.41x − 2.420.992.59
Table 5. Basic parameters of MIP.
SampleTotal Pore Volume (mL/g)Total Pore SSA (m2/g)Average Pore Diameter (nm)Porosity (%)Pore Volume Ratio (%)
MicroporesTransitional PoresMesoporesMacropores
L70.0274.2325.313.7927.0336.425.4531.10
L8-10.0455.1834.795.8922.1530.545.4641.85
L8-20.0274.1126.813.9126.4336.065.0932.42
L90.0423.3550.526.9413.0023.4915.9347.57
L120.0424.7335.895.7820.8028.785.5044.91
Table 6. SSA ratio of each pore type.
Sample IDTotal Pore SSA (m2/g)SSA Ratio (%)
MicroporesTransitional PoresMesoporesMacropores
L74.2365.4734.100.390.04
L8-15.1865.0834.400.450.07
L8-24.1165.3734.190.420.02
L93.3561.3036.591.790.31
L124.7365.1734.270.470.09
Table 7. Pore information of μ-CT experiment.
SampleAverage Pore NumberVoxel Size (um)Porosity (%)Average Pore Diameter (μm)Connectivity (%)Df
L8-244963.3212.12%9.4251.22%2.40
L1251166.9110.41%17.6161.59%2.30
Table 8. Experimental results of isothermal adsorption.
SampleVL (m3/t)PL (MPa)R2
L713.010.810.99
L8-110.761.280.99
L914.190.760.99
L1215.610.560.99
Disclaimer/Publisher’s Note: The statements, opinions and data contained in all publications are solely those of the individual author(s) and contributor(s) and not of MDPI and/or the editor(s). MDPI and/or the editor(s) disclaim responsibility for any injury to people or property resulting from any ideas, methods, instructions or products referred to in the content.

