Article

Effect of Crude Oil Quality on Properties of Hydrocracked Vacuum Residue and Its Blends with Cutter Stocks to Produce Fuel Oil

1
LUKOIL Neftohim Burgas, 8104 Burgas, Bulgaria
2
Institute of Biophysics and Biomedical Engineering, Bulgarian Academy of Sciences, Academic Georgi Bonchev Street 105, 1113 Sofia, Bulgaria
3
Intelligent Systems Laboratory, University Prof. Dr. Assen Zlatarov, Professor Yakimov 1, 8010 Burgas, Bulgaria
*
Author to whom correspondence should be addressed.
Processes 2023, 11(6), 1733; https://doi.org/10.3390/pr11061733
Submission received: 17 May 2023 / Revised: 1 June 2023 / Accepted: 3 June 2023 / Published: 6 June 2023

Abstract

:
The production of heavy fuel oil from hydrocracked vacuum residue requires dilution of the residue with cutter stocks to reduce viscosity. The hydrocracked residue obtained from different vacuum residue blends originating from diverse crude oils may have divergent properties and interact with the variant cutter stocks in a dissimilar way leading to changeable values of density, sediment content, and viscosity of the obtained fuel oil. H-Oil hydrocracked vacuum residues (VTBs) obtained from different crude blends (Urals, Siberian Light (LSCO), and Basrah Heavy) were diluted with the high aromatic fluid catalytic cracking (FCC) light cycle, heavy cycle, and slurry oil, and the low aromatic fluid catalytic cracking feed hydrotreater diesel cutter stocks and their densities, sediment content, and viscosity of the mixtures were investigated. Intercriteria analysis evaluation of the data generated in this study was performed. It was found that the densities of the blends H-Oil VTB/cutter stocks deviate from the regular solution behavior because of the presence of attractive and repulsive forces between the molecules of the H-Oil VTB and the cutter stocks. Urals and Basrah Heavy crude oils were found to enhance the attractive forces, while the LSCO increases the repulsive forces between the molecules of H-Oil VTBs and those of the FCC gas oils. The viscosity of the H-Oil VTB obtained during hydrocracking of straight run vacuum residue blend was established to linearly depend on the viscosity of the H-Oil vacuum residue feed blend. The applied equations to predict viscosity of blends containing straight run and hydrocracked vacuum residues and cutter stocks proved their good prediction ability with an average relative absolute deviation (%AAD) of 8.8%. While the viscosity was found possible to predict, the sediment content of the blends H-Oil VTBs/cutter stocks was recalcitrant to forecast.

1. Introduction

The vacuum residue is the lowest value product from petroleum refining, that if not converted is mostly used for production of road pavement bitumen and heavy fuel oil [1]. Among the vacuum residue conversion processes, slurry hydrocracking is reported to achieve the highest conversion level—95% [2], then followed by the ebullated bed vacuum residue hydrocracking (EBVRHC)—93% [3,4]. Despite the high conversion level achieved by the hydrocracking technologies, they still generate unconverted hydrocracked vacuum residues, which need to be utilized [5]. As with the straight run vacuum residues, the hydrocracked ones can be employed as components for production of road pavement bitumen, heavy fuel oil, and feeds for delayed coking units [6,7]. The lower oxidative ageing resistance of the hydrocracked vacuum residues limits their application as a component for production of road pavement bitumen [8]. Therefore, the hydrocracked vacuum residues can be used either as a feedstock for coking units, or as a component for production of heavy fuel oil. Unfortunately, the hydrocracked residual oils are featured by a low colloidal stability and thus by a high sediment formation affinity [9,10,11,12,13,14,15,16,17]. This makes the users of the heavy oil hydrocracking technology add high aromatic oil fractions such as fluid catalytic cracking (FCC) gas oils to keep the hydrocracked asphaltenes solvated and suppress the sediment formation process [9,18,19,20,21]. Marques et al. [9] reported that the polycondensed tri-, tetra-, and penta-aromatics contained in the FCC slurry oil (SLO) suppressed sediment formation during hydrocracking of vacuum residue derived from Urals crude oil. Tirado and Ancheyta [19] reported that the di-aromatics from the FCC light cycle oil (LCO) suppressed to a higher extent the sediment formation during hydrocracking of heavy crude oil in comparison with the FCC heavy cycle oil (HCO) and SLO. Their experimental results showed that the FCC SLO made even more sediments than those obtained during the heavy crude oil hydrocracking without diluent [19]. Marafi et al. [18] studying the hydrocracking of Kuwait vacuum residue observed about 50% reduction of sediment content in the reactor liquid product when 10% FCC LCO and HCO were added to the vacuum residue feed. They reported that the FCC LCO was slightly less effective in sediment reduction compared with the HCO. Ortega-García et al. [20] reported that during hydrocracking of vacuum residue from a petroleum refinery with the addition of FCC SLO to the hydrocracked vacuum tower product (VTB) in the amount of 10%, the reduction of sediment content was 63%, 55%, and 47% at liquid hourly space velocity (LHSV) of 0.5, 0.4, and 0.3 h−1, respectively. Stratiev et al. [21] in their study established that during processing of vacuum residual oil blends derived from the crude oils Urals, El Bouri, Kazakh, Arab medium, Arab heavy, Basrah light, and Val d’Agri in H-Oil hydrocracker, the addition of FCC LCO, HCO, and SLO in the concentration range 5–50% to the H-Oil vacuum residue feed led to continually decreasing the level of sediments in the hydrocracked residual oils with the cutter stock concentration enhancement. They determined that the three high aromatic FCC gas oils exhibited the same efficiency in sediment formation reduction. The published results suggest that the efficiency of the diverse FCC gas oils in the suppression of sediment formation in the hydrocracked residual oils can be different depending on the origin of the heavy oil, and the operating conditions in the hydrocracking unit. The immense diversity in the petroleum properties that can impact the whole performance of a petroleum refinery has been well documented in the references [22,23,24,25,26,27]. Moreover, crude oil blends instead of single crude oil are typically processed in the petroleum refineries which makes the evaluation of the effect of the crude origin on the specific interactions occurring in the heavy oil hydrocracking even more difficult [28]. Therefore, when blends of crude oils are processed in a refinery possessing an EBVRHC unit, the efficiency of the distinct FCC gas oils to suppress the sediment formation in the hydrocracked residual oils can be divergent. The FCC HCO, and SLO, however, have very high density, and the market of the heavy fuel oil shows that the fuel oil whose density is lower, for example, 991 kg/m3, has significantly higher value than that of the fuel oil with density of 1025 kg/m3. Therefore, cutter stocks with lower density which do not deteriorate the colloidal stability of the fuel oil based on the hydrocracked vacuum residue are desirable. Although the main hydroprocessing technology to treat vacuum residue was reported to be the EBVRHC [29], the information about the effect of the crude oils on the properties of the unconverted hydrocracked vacuum residue and its blends with different cutter stocks is insufficient. Additionally, there is no published report showing the relation of vacuum residue feed blend viscosity to the unconverted hydrocracked vacuum residue viscosity. That was the reason for us to perform this study investigating the performance of the EBVRHC H-Oil in the LUKOIL Neftohim Burgas refinery during processing three different crude oils: Urals, Siberian Light, and Basrah Heavy.
The aim of this research is to determine the effect of crude oil properties on the properties of the unconverted hydrocracked vacuum residue and its blends with the high aromatic FCC gas oils, and lower aromatic FCCPT diesel.

2. Materials and Methods

2.1. Materials

Three crude oils, Urals, Siberian Light, and Basrah Heavy, with properties summarized in Table 1, were used in this study. An additional case with processing of Kirkuk crude oil discussed in Section 3.4. requires inclusion of properties of Kirkuk crude oil in the data of Table 1. Properties of the vacuum residues extracted from the three investigated crude oils are presented in Table 2. The data in Table 2 also include characteristics of the vacuum residue derived from Kirkuk crude oil which are discussed in Section 3.4.
The three crude oils were processed in the LUKOIL Neftohim Burgas (LNB) refinery in the following ratios: (1) 60% Urals/40% LSCO; (2) 72.5% Urals/14.1% LSCO/13.4% BH; (3) 63% Urals/31% LSCO/6% BH. The processing scheme of the LNB refinery is detailed in [2]. The vacuum residues obtained from the three crude oil blends were hydrocracked in the LNB H-Oil ebullated bed vacuum residue hydrocracking. The processing scheme of the LNB H-Oil unit is also presented in [6]. The operating conditions and product yields of the H-Oil hydrocracker during processing the three vacuum residue blends are shown in Table 3. Table 3 also includes data for the case where Kirkuk crude oil was processed together with Urals and Siberian light crude oil to be discussed in Section 3.4.
Properties of the FCC gas oils and FCCPT diesel used as cutter stocks in this study are summarized in Table 4.
Properties of the H-Oil hydrocracked vacuum residues (VTB) obtained at the H-Oil unit during processing the three different crude oil blends are presented in Table 5.

2.2. Methods

2.2.1. Physical and Chemical Characterization of Studied Oils

Densities of the crude oils, FCC gas oils, and FCCPT diesel were measured in accordance with ASTM D4052 method using Anton Paar DMA 4100 digital analyzer consisting of a U-shaped, oscillating sample tube, electronic excitation system, and frequency counting. The density of the H-Oil VTBs was measured indirectly from the series of solutions of residue and toluene at different concentrations. Detailed information about the applied procedure for density measurement by dilution is given in [6]. Density measurement has repeatability 0.01 kg/m3 and reproducibility 0.05 kg/m3 according to technical specification of Anton Paar DMA 4100 digital analyzer.
Engler specific viscosity was measured in accordance with ASTM D1665 over a temperature range of 120 to 145 °C. Sulfur content of the investigated samples was determined by energy dispersive X-ray fluorescence spectrometry in accordance with ASTM D 4294 method. Softening point (ring and ball) of the H-Oil VTBs under study was measured as is described in ASTM D6493 standard method. High-temperature simulation distillation was applied to characterize the boiling properties of studied oil samples as follows: ASTM D2887 for gas oils and vacuum gas oil; ASTM D7169 for H-Oil VTBs. Concarbon content of the studied oils was measured as carbon residue, left after evaporation and pyrolysis of petroleum products under specified conditions as detailed in standard method ISO 10370. Asphaltene (C7, and C5) content was measured as heptane and pentane insolubles following the procedure described in standard method ASTM D 6560. Total sediment existent content (TSE) of the investigated samples was measured by hot filtration in accordance with method ISO 10307-1. Total sediment potential content was determined using standard thermal procedures for ageing of residual fuel oil as detailed in standard method ISO 10307-2. SARA composition of vacuum residue fractions was measured by patented method SAR-AD and LNB in house method. More details about both SARA procedures are presented in [31,32].
The molecular weights of the studied H-Oil VTBs and the cutter stocks were estimated by the new empirical correlation reported in our recent research [33].
More detailed information about the methods employed to characterize the crude oils whose properties are given in Table 1 is given in our recent research [34]. The methods availed to characterize the vacuum residues whose properties are given in Table 2 and Table 5 are detailed in the studies [35,36].
The specification of heavy fuel produced in the LNB refinery is close to that of RMK 700 heavy fuel oil reported in the standard ISO 8217:2017.
The net 540 °C+ vacuum residue conversion in the H-Oil hydrocracker was calculated using Equation (1)
C o n v e r s i o n   ( w t . % ) = H O i l F e e d 540   ° C + H O I l P r o d u c t 540   ° C + H O i l F e e d 540   ° C +
where
HOilFeed540 °C+ = mass flow rate of the H-Oil feed fraction boiling above 540 °C determined by high-temperature simulated distillation method ASTM D 7169 of the feed and multiplied by the mass flow rate of the feed in t/h;
HOilProduct540 °C+ = mass flow rate of the H-Oil product fraction boiling above 540 °C determined by high-temperature simulated distillation method ASTM D 7169 of the liquid product multiplied by the flow rate of the liquid product in t/h.
The excess molar volume of investigated blends was estimated by the use of Equation (2) as reported in [37].
V E = x 1 M 1 + x 2 M 2 ρ x 1 M 1 ρ 1 x 2 M 2 ρ 2
where
M1 and M2 are the molar masses, ∗1 and ∗2 are the densities of components (1:H-Oil VTB) and (2:cutter stock), respectively, and ρ denotes the density of the mixture.
In addition to the excess molar volume, the relative changes in volume ∆V were also calculated by the use of Equation (3) as reported in [38].
Δ V = V E ( x 1 V 1 o + x 2 V 2 o ) = m 1 + m 2 ρ m m 1 ρ 1 m 2 ρ 2 m 1 ρ 1 + m 2 ρ 2
where
xj, Mi, and V°i are mole fraction, molar mass, and molar volume of the individual component i, respectively.

2.2.2. Application of Intercriteria Analysis to the Data Generated in This Study

The intercriteria analysis (ICrA) was created in the Institute for Biophysics and Biomedical Engineering, Bulgarian Academy of Sciences (BAS), as a tool to support decision-making in multiobject multicriteria problems [39,40,41]. It found successful applications in medicine, biology, economics, physics, etc., and it can be considered as a component of the artificial intelligence toolkit [42]. It was also successfully applied in several studies in the field of chemistry and technology of petroleum [43,44,45]. As input data, the ICrA method requires an m × n table with the measurements or evaluations of m objects against n criteria. As a result, it returns an n × n table with intuitionistic fuzzy pairs, defining the degrees of relation between each pair of criteria, hence the name “intercriteria”, and allows making informed decisions which render account of the inherent uncertainty that complex real-life problems exhibit. For the sake of terminological precision, in ICrA, the term “correlation” between the criteria is avoided but the terms “positive consonance”, “negative consonance”, and “dissonance” are being used instead. For industrial objects which are characterized by a relatively strong “noise” caused by different disturbances of the process, the meaning of μ = 0.70 ÷ 1.00; υ = 0 ÷ 0.30 denotes a statistically meaningful significant positive relation, where the strong positive consonance exhibits values of μ = 0.90 ÷ 1.00; υ = 0 ÷ 0.1, and the weak positive consonance exhibits values of μ = 0.70 ÷ 0.80; υ = 0.20 ÷ 0.30. Respectively, the values of negative consonance with μ = 0 ÷ 0.30; υ = 0.70 ÷ 1.00 mean a statistically meaningful negative relation, where the strong negative consonance exhibits values of μ = 0 ÷ 0.1; υ = 0.90 ÷ 1.00, and the weak negative consonance exhibits values of μ = 0.20 ÷ 0.30; υ = 0.70 ÷ 0.80. All other cases are considered as dissonance. For more detailed explanation of the essence of ICrA, the reader can refer to our previous study [46].

3. Results

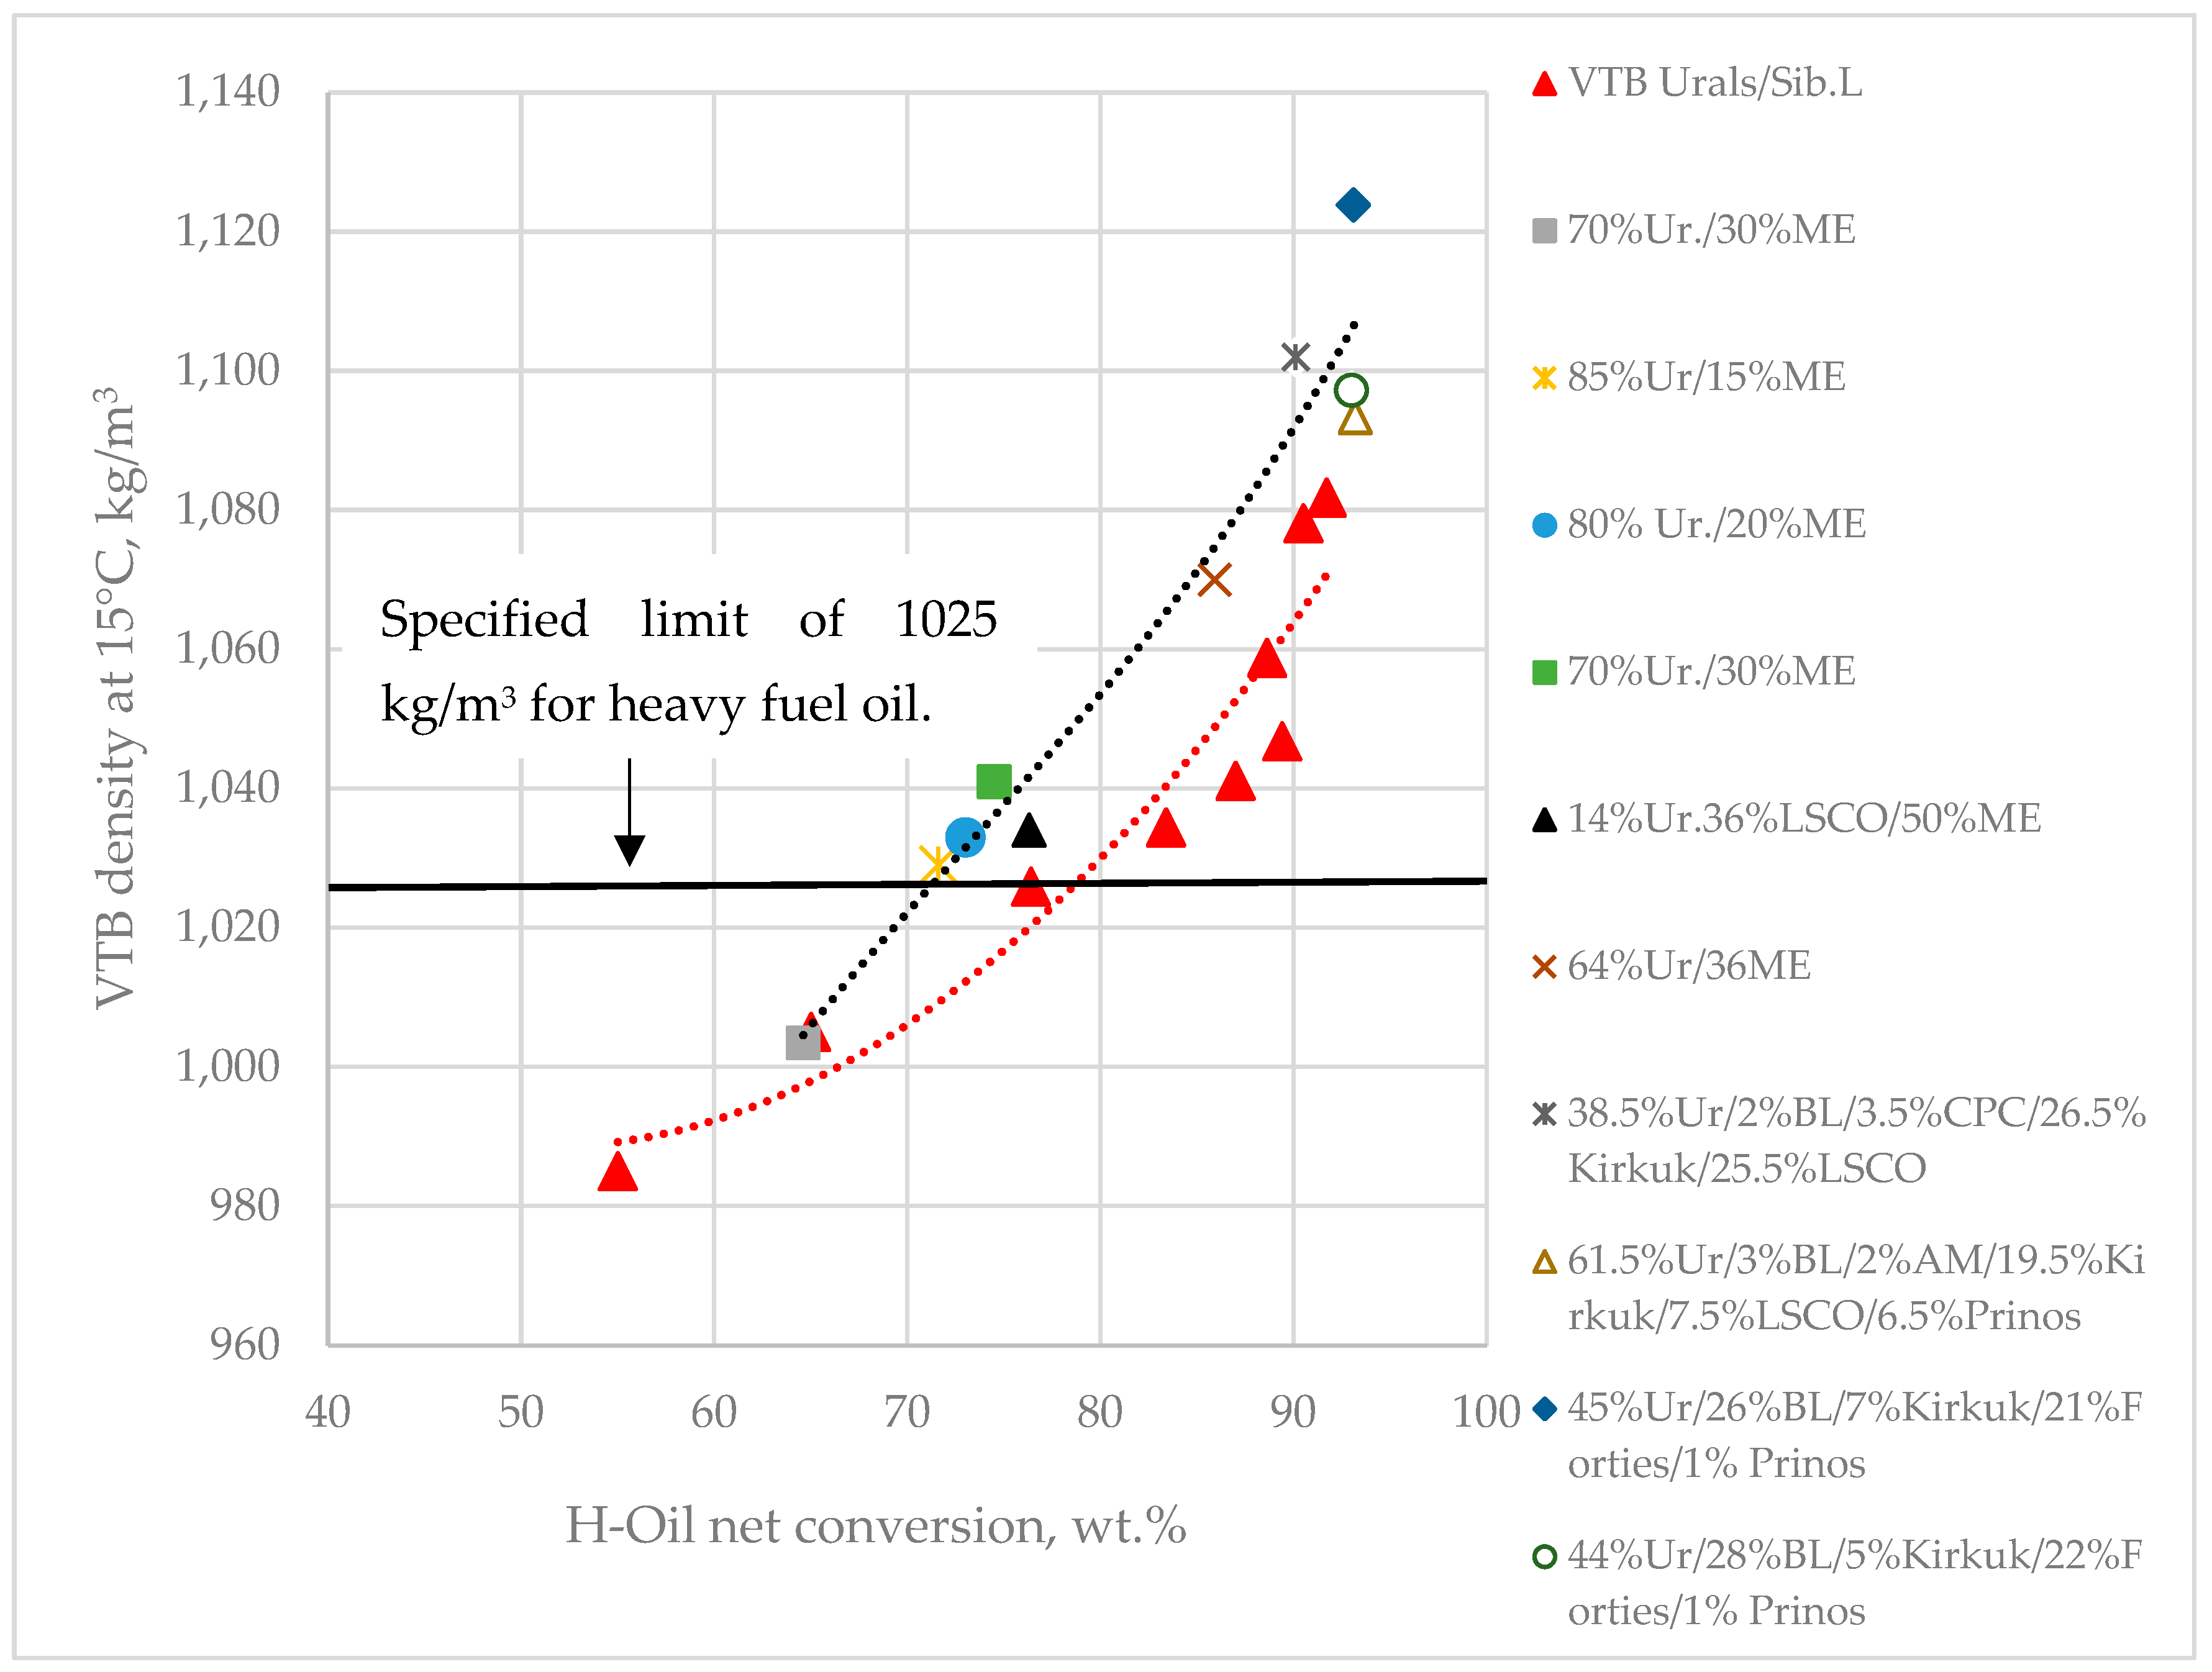
3.1. Variation of Density of H-Oil VTB and Total Sediment Potential of Its Blends with FCC HCO as Partially Blended Fuel Oil (PBFO)

The LNB H-Oil VTB is used for both heavy fuel oil and road pavement bitumen production. The maximum specified limit for density at 15 °C of the heavy fuel oil is 1025 kg/m3. Figure 1 shows how the density of the H-Oil VTB varies with conversion level alteration. It is evident from the data in Figure 1 that the H-Oil density increases with conversion enhancement. It is also apparent from the data in Figure 1 that when blends of Urals and Siberian Light crude oil are processed in the LNB refinery, the density of the obtained H-Oil VTB is lower than that of the H-Oil VTBs produced during processing of crude oil blends containing Middle East crudes. The most challenging characteristic of the fuel oil produced from blends of H-Oil VTB and cutter stocks is the sediment content after thermal ageing (total sediment potential = TSP) [6]. Figure 2 indicates the values of the TSP of the partially blending fuel oil (PBFO) of the cases discussed in the data of Figure 1. The data in Figure 2 indeed exhibit that the attainment of TSP lower than the maximum specified limit for the fuel oil limit of 0.1 wt.% is very difficult to achieve. The very high level of 0.9 wt.% TSP in the PBFO was registered during processing 100% Urals at LHSV of 0.25 h−1 and reaction temperature of 418 °C [21]. The reduction of LHSV below 0.19 h−1 with reaction temperature augmentation up to 430 °C and the replacement of the cascade to parallel mode of fresh catalyst addition allowed achievement of conversion level between 76.0 (at LHSV of 0.18 h−1) and 91.7 wt.% (at LHSV of 0.12 h−1), while the sediment content after thermal ageing of the partially blended fuel was ≤0.1 wt.% during processing Urals and its blends with Siberian Light crude oil [47]. All these data point out that the meeting of maximum density and the sediment content specifications for the fuel oils produced from H-Oil VTB and cutter stocks is a challenging task.

3.2. Density of the Blends of H-Oil VTB Produced from the Three Studied Crude Mixtures with the Cutter Stocks FCC LCO, HCO, SLO, and FCCPT Diesel

Table 6 presents data of densities (ρ) of the mixtures from the three studied H-Oil VTBs with the cutter stocks FCC LCO, HCO, SLO, and FCCPT diesel.
The data of ∆ρ, which is a difference between measured blend density and estimated blend density assuming no excess volume of mixing [48], showed both negative and positive deviations much bigger than the repeatability of the used apparatus: Anton Paar DMA 4100 ± 0. 01 kg/m3. This finding implies that the assumption of no excess volume of mixing is not valid for the study in this work on heavy oil blends.
The data in Table 6 show that the specified maximum limit of density of 1025 kg/m3 can be met if the cutter stocks are FCC LCO and FCCPT diesel. The use of FCC HCO and SLO as cutter stocks leads to production of fuel oil with higher than 1025 kg/m3 density.

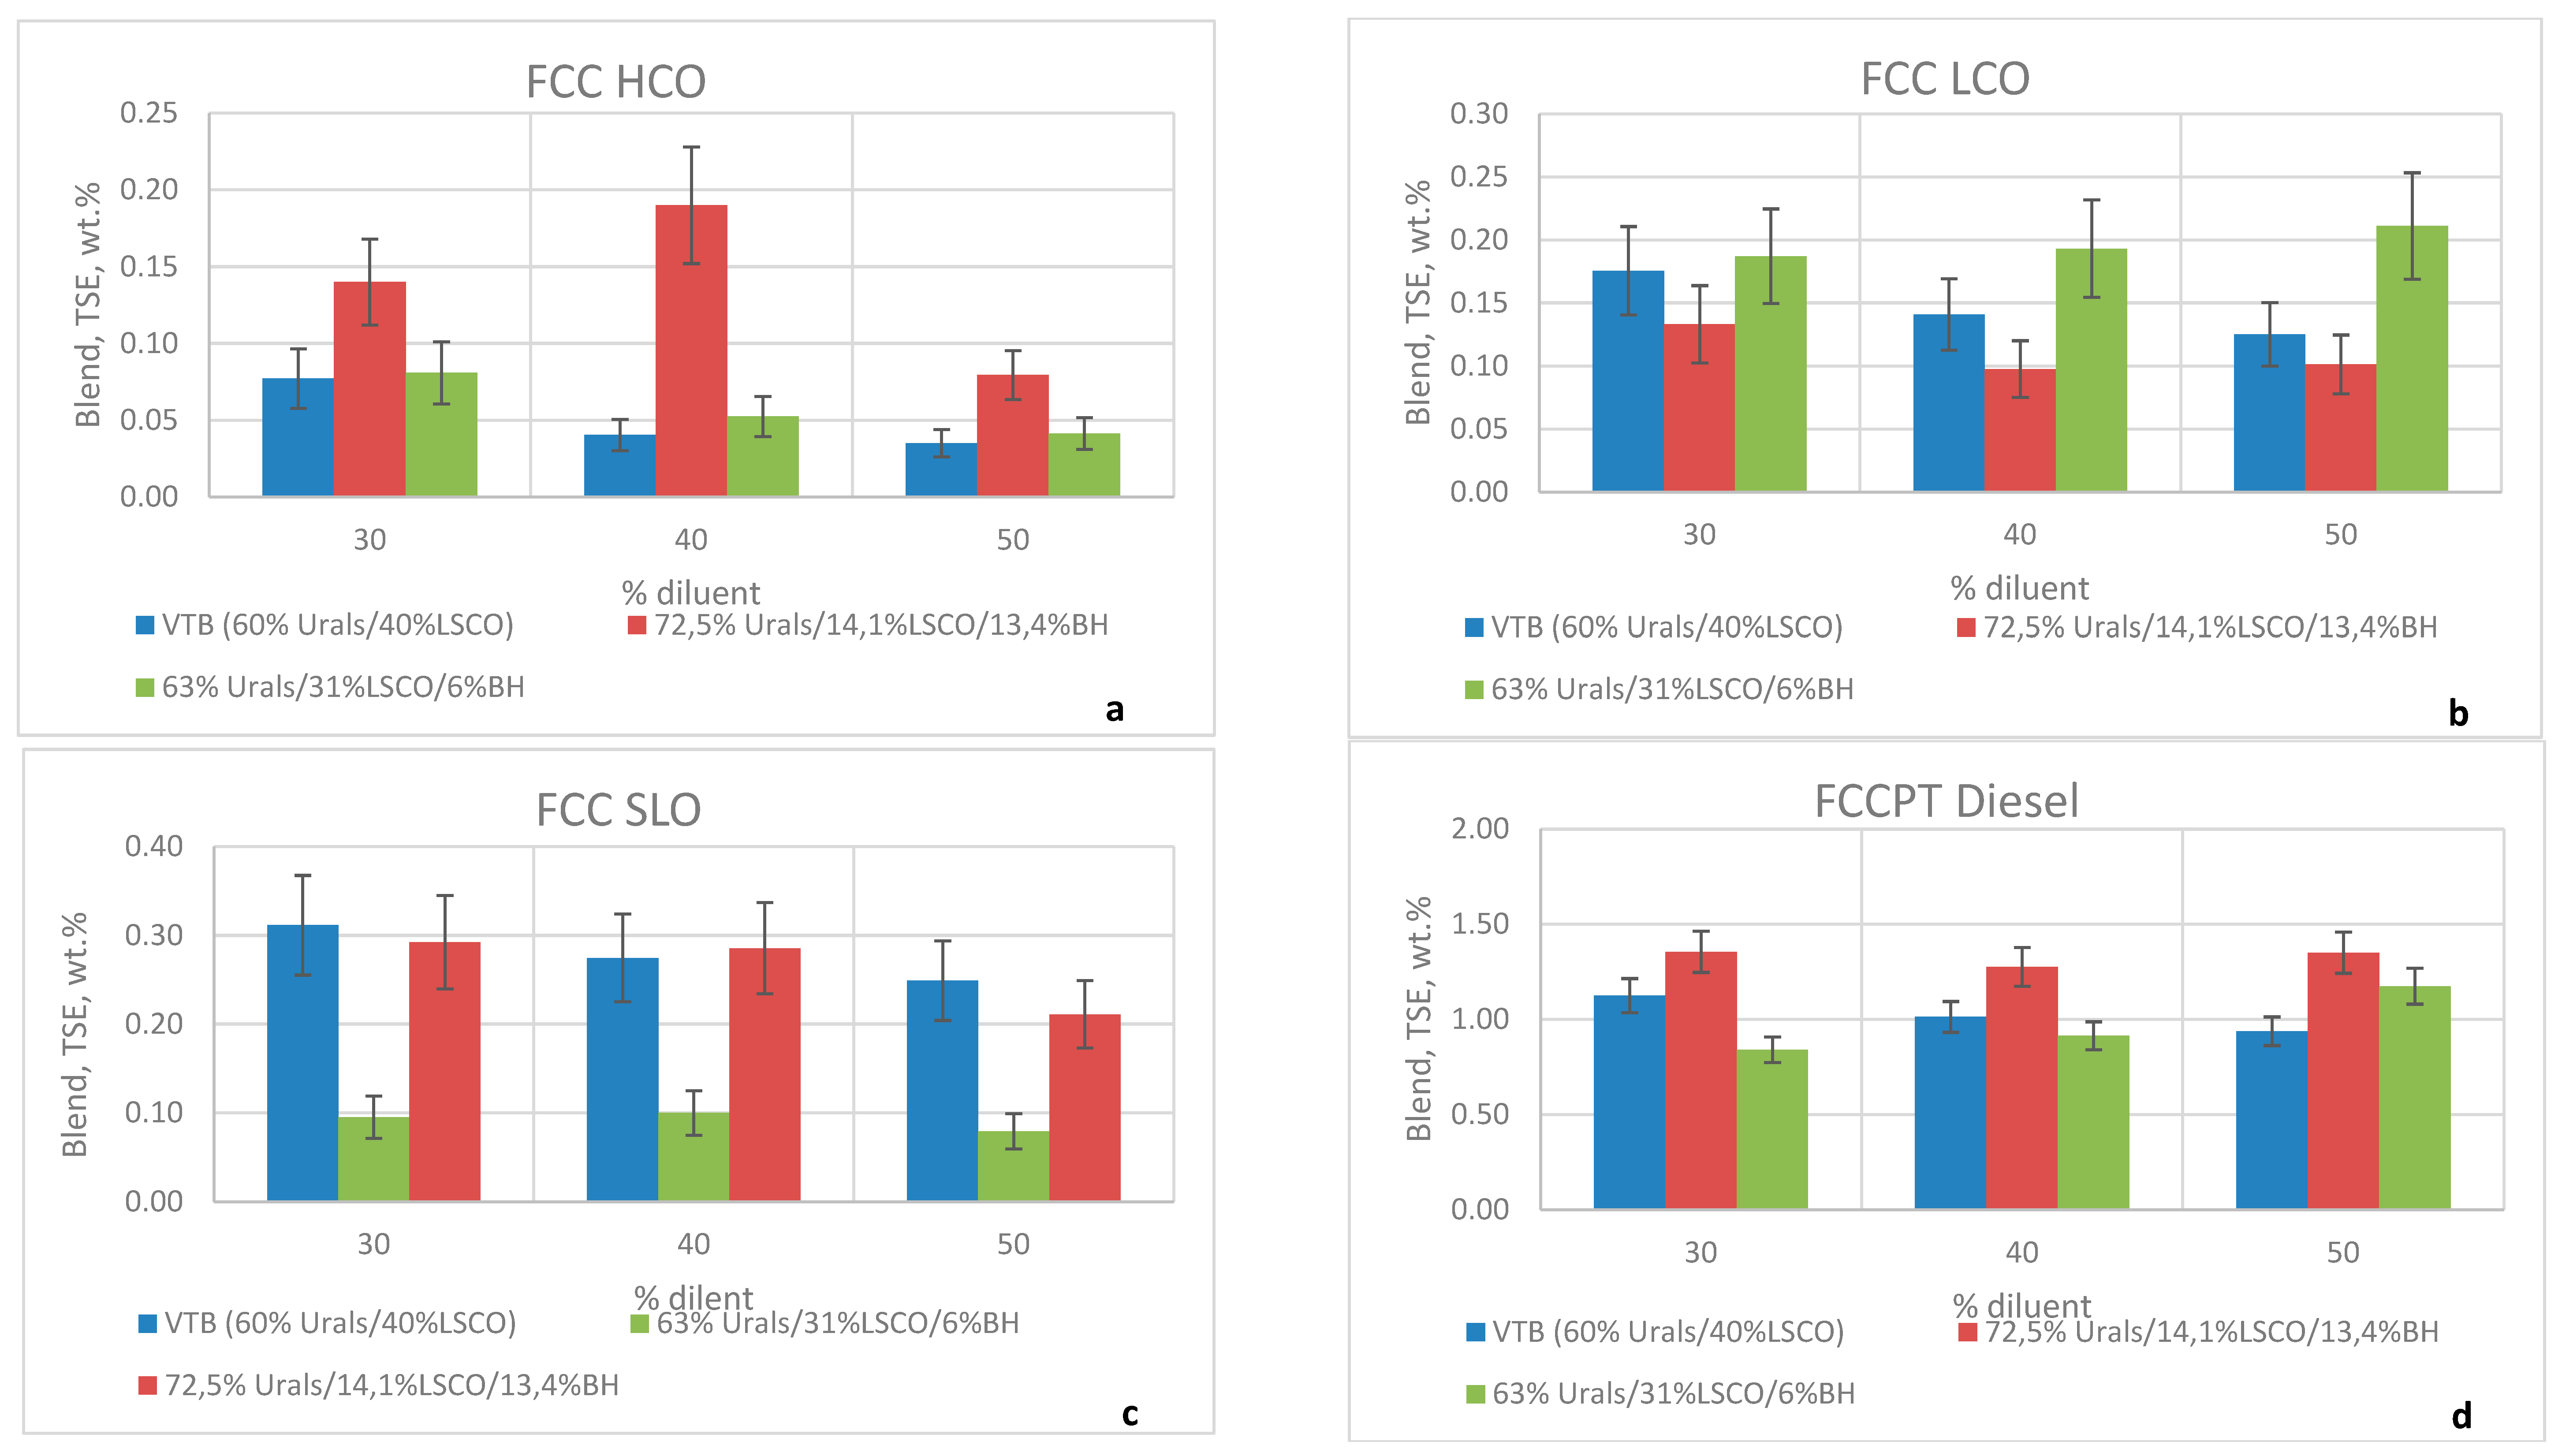
3.3. Sediment Content in the Blends of H-Oil VTB Produced from the Three Studied Crude Mixtures with the Cutter Stocks FCC LCO, HCO, SLO, and FCCPT Diesel

Figure 3 shows diagrams of the effect of addition of the cutter stocks FCC HCO, LCO, SLO, and FCCPT diesel to the three studied H-Oil VTB samples on their sediment content. These data indicate that the three studied H-Oil VTBs exhibit different behavior concerning sediment formation in their blends with the investigated cutter stocks. The H-Oil VTB obtained from the crude blend 60% Urals/40% LSCO demonstrates a very low sediment formation when it is blended with the FCC HCO. However, the FCC LCO and SLO added to this H-Oil VTB sample do not allow attainment of the specification maximum limit of 0.1 wt.% TSE. In contrast, the H-Oil VTB obtained from the crude blend 72.5% Urals/14.1% LSCO/13.4% BH exhibits the highest sediment formation with the FCC HCO among the other H-Oil VTBs. The FCC LCO seems to be the best diluent for this particular H-Oil VTB. The H-Oil VTB obtained from the crude blend 63% Urals/31% LSCO/6% BH displays the lowest sediment formation with the FCC HCO, followed by the FCC SLO. The most depressing effect of LCO on sediment formation in the H-Oil VTB obtained from the crude blend 72.5% Urals/14.1% LSCO/13.4% BH is in line with the report of Tirado and Ancheyta [19], whereas the most depressing effect of HCO on sediment formation in the H-Oil VTBs obtained from the crude blends 60% Urals/40% LSCO and 63% Urals/31% LSCO/6% BH is in line with the report of Marafi et al. [18]. These results indicate that the sediment formation is a very delicate matter and even the ratio of the same crudes is changed which may have a substantial effect on the rate of sediment formation. For example, the processing of Basrah Heavy crude oil in the amount of 6% in the crude oil blend that contains Urals and Siberian Light crude oils appears to have an improvement effect on the H-Oil VTB sediment solvation in the FCC SLO that is not observed with the other two studied H-Oil VTB samples. The FCCPT diesel as observed from Figure 3d seems to play the role of anti-solvent that increases sedimentation in all studied H-Oil VTBs.
It is worth noting that the sediment content in the blends H-Oil VTB/cutter stock does not exhibit the typical trend of reduction with aromatic cutter stock content enhancement observed in our earlier study [21]. This implies that the increased high aromatic FCC gas oil content does not contribute to sediment dissolution in the studied H-Oil VTBs and is an illustration of how complicated the matter of sediment formation in the hydrocracked residual oils is. The increase of the low aromatic FCCPT diesel content also shows no augmenting effect on the sediment content in the studied H-Oil VTB-FCCPT diesel blends.

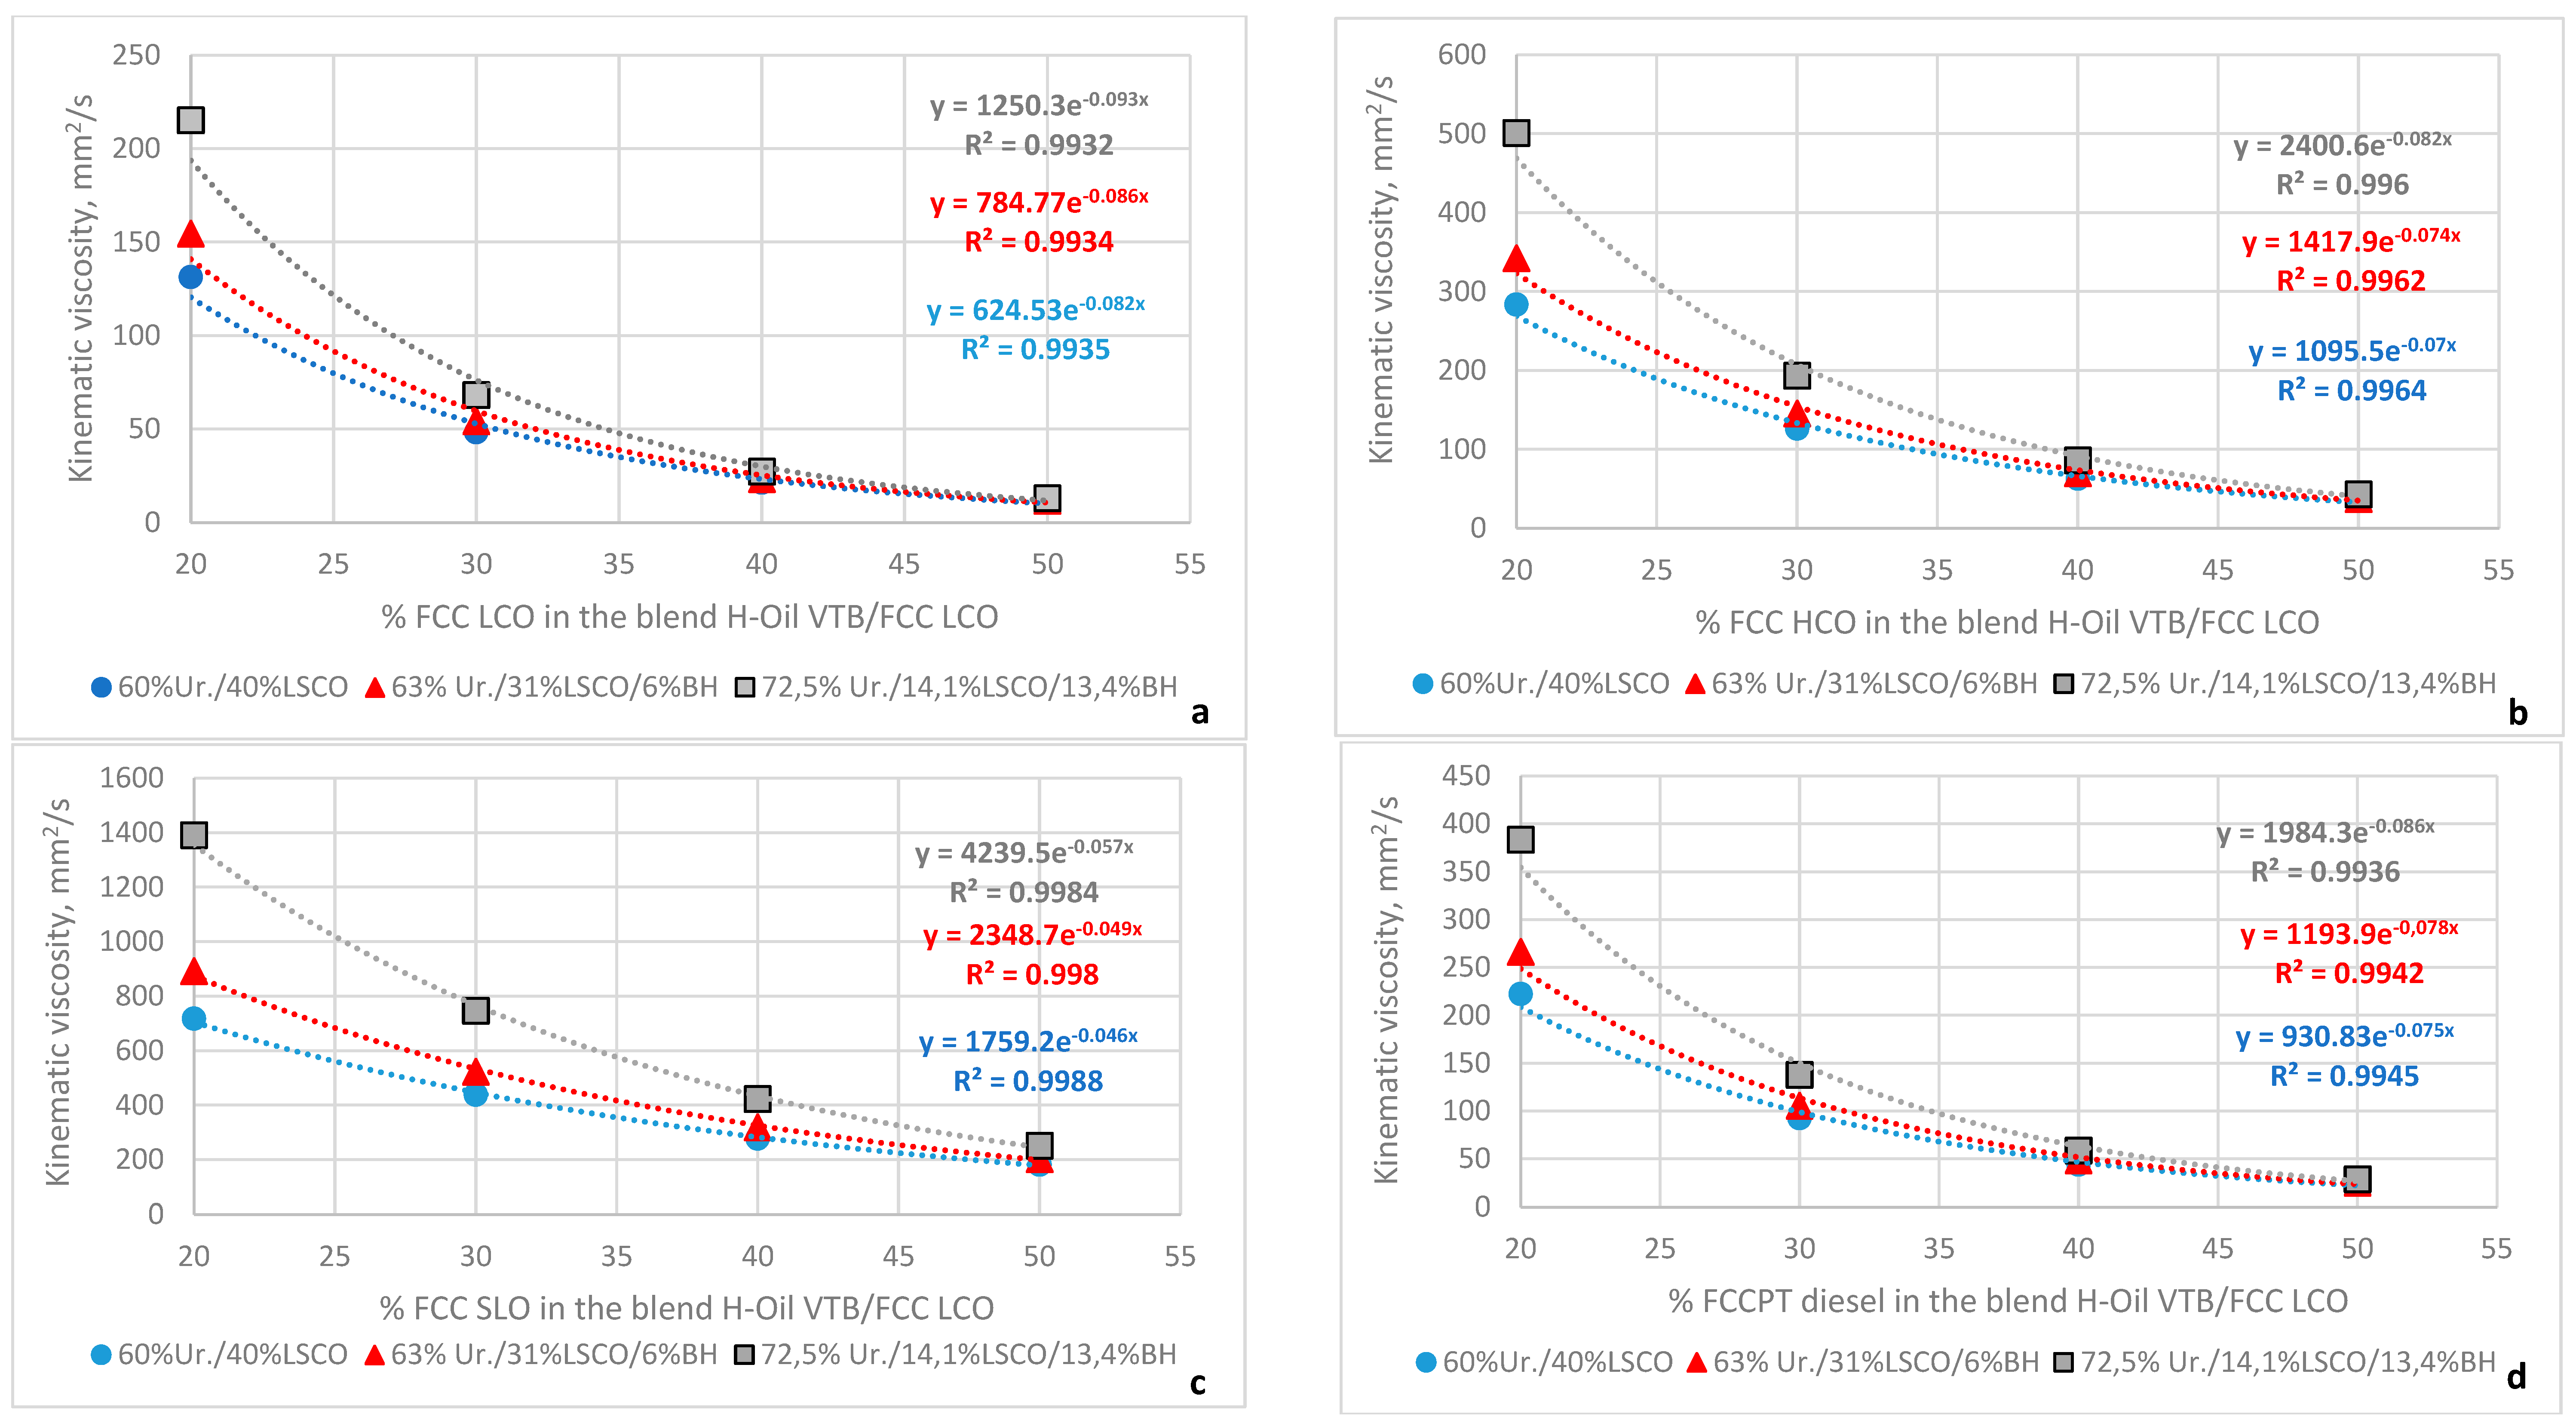
3.4. Viscosity Variation in the Blends of H-Oil VTB Produced from the Three Studied Crude Mixtures with Alteration of the Content of the Cutter Stocks FCC LCO, HCO, SLO, and FCCPT Diesel in the Mixtures

Figure 4 shows graphs of dependence of viscosity of the blends H-Oil VTB/cutter stocks for the three studied H-Oil VTBs, and four investigated cutter stocks. These data show that the blend viscosity dependence can be described as an exponential function of cutter stock content. Expectedly, the highest viscosity H-Oil VTB sample (72.5% Urals/14.1% LSCO/13.4% BH) demonstrated the highest viscosity of the blends H-Oil VTB/cutter stocks. The amount of different cutter stocks needed to add to the three studied H-Oil VTBs to achieve the maximum viscosity limit specified for heavy fuel oil of 110 mm2/s is summarized in Table 7. The data in Table 7 logically indicate that the highest viscosity H-Oil VTB sample (72.5% Urals/14.1% LSCO/13.4% BH) needs the highest amount of cutter stock to meet the required for heavy fuel oil specification of 110 mm2/s. These data also show that the highest viscosity cutter stock FCC SLO demands the highest amount of addition to the H-Oil VTBs to attain the heavy fuel oil specification of 110 mm2/s.
Another case of H-Oil VTB obtained in the H-Oil hydrocracker during processing vacuum residue blend derived from the crude oil blend 78% Urals/2.5% LSCO/19.5% Kirkuk blend was also investigated in this research. The dependence of viscosity of this particular H-Oil VTB on temperature and on the content of FCC HCO, whose viscosity at 40, 60, and 80 °C was 8.82, 4.83, and 2.71 respectively, is presented in Figure 5. It is evident from the data in Figure 5 that the H-Oil VTB viscosity depends exponentially on both temperature and the content of diluent.
Properties of the Kirkuk crude oil and the obtained thereof vacuum residue were additionally included in the data of Table 1 and Table 2. The data in Table 1 and Table 2 were used to estimate the amount of the vacuum residues coming from each individual crude in the vacuum residue blend processed in the H-Oil hydrocracker, and also to calculate the viscosity of the vacuum residue blend using Equations (4)–(6) discussed in our earlier research [34].
V R   B l e n d   V i s c o s i t y = 10 10 41.10743 V B I   b l e n d 49.08258 0.8
V B I   b l e n d = i n x i V B I i
where
VR Blend Viscosity–kinematic viscosity of the VR blend at 80 °C, mm2/s;
VBI blend viscosity blending index of the VR blend;
x i -volume part of individual VR in the blend;
n-number of individual VRs in the blend (in our case n = 4)
V B I i -viscosity blending index of individual VR. It is calculated by the expression:
V B I i = 41.10743 49.08258 × log log C S T i + 0.8
where
C S T i = kinematic viscosity of individual oil at 800 °C, mm2/s.
Figure 6 depicts a graph of dependence of the H-Oil VTB specific viscosity on the viscosity of the vacuum residue blend estimated by the use of Equations (4)–(6) that feeds the H-Oil VR hydrocracker. It is clear from these data that the H-Oil VTB viscosity is linearly dependent on the viscosity of the vacuum residue processed in the H-Oil hydrocracker.

4. Discussion

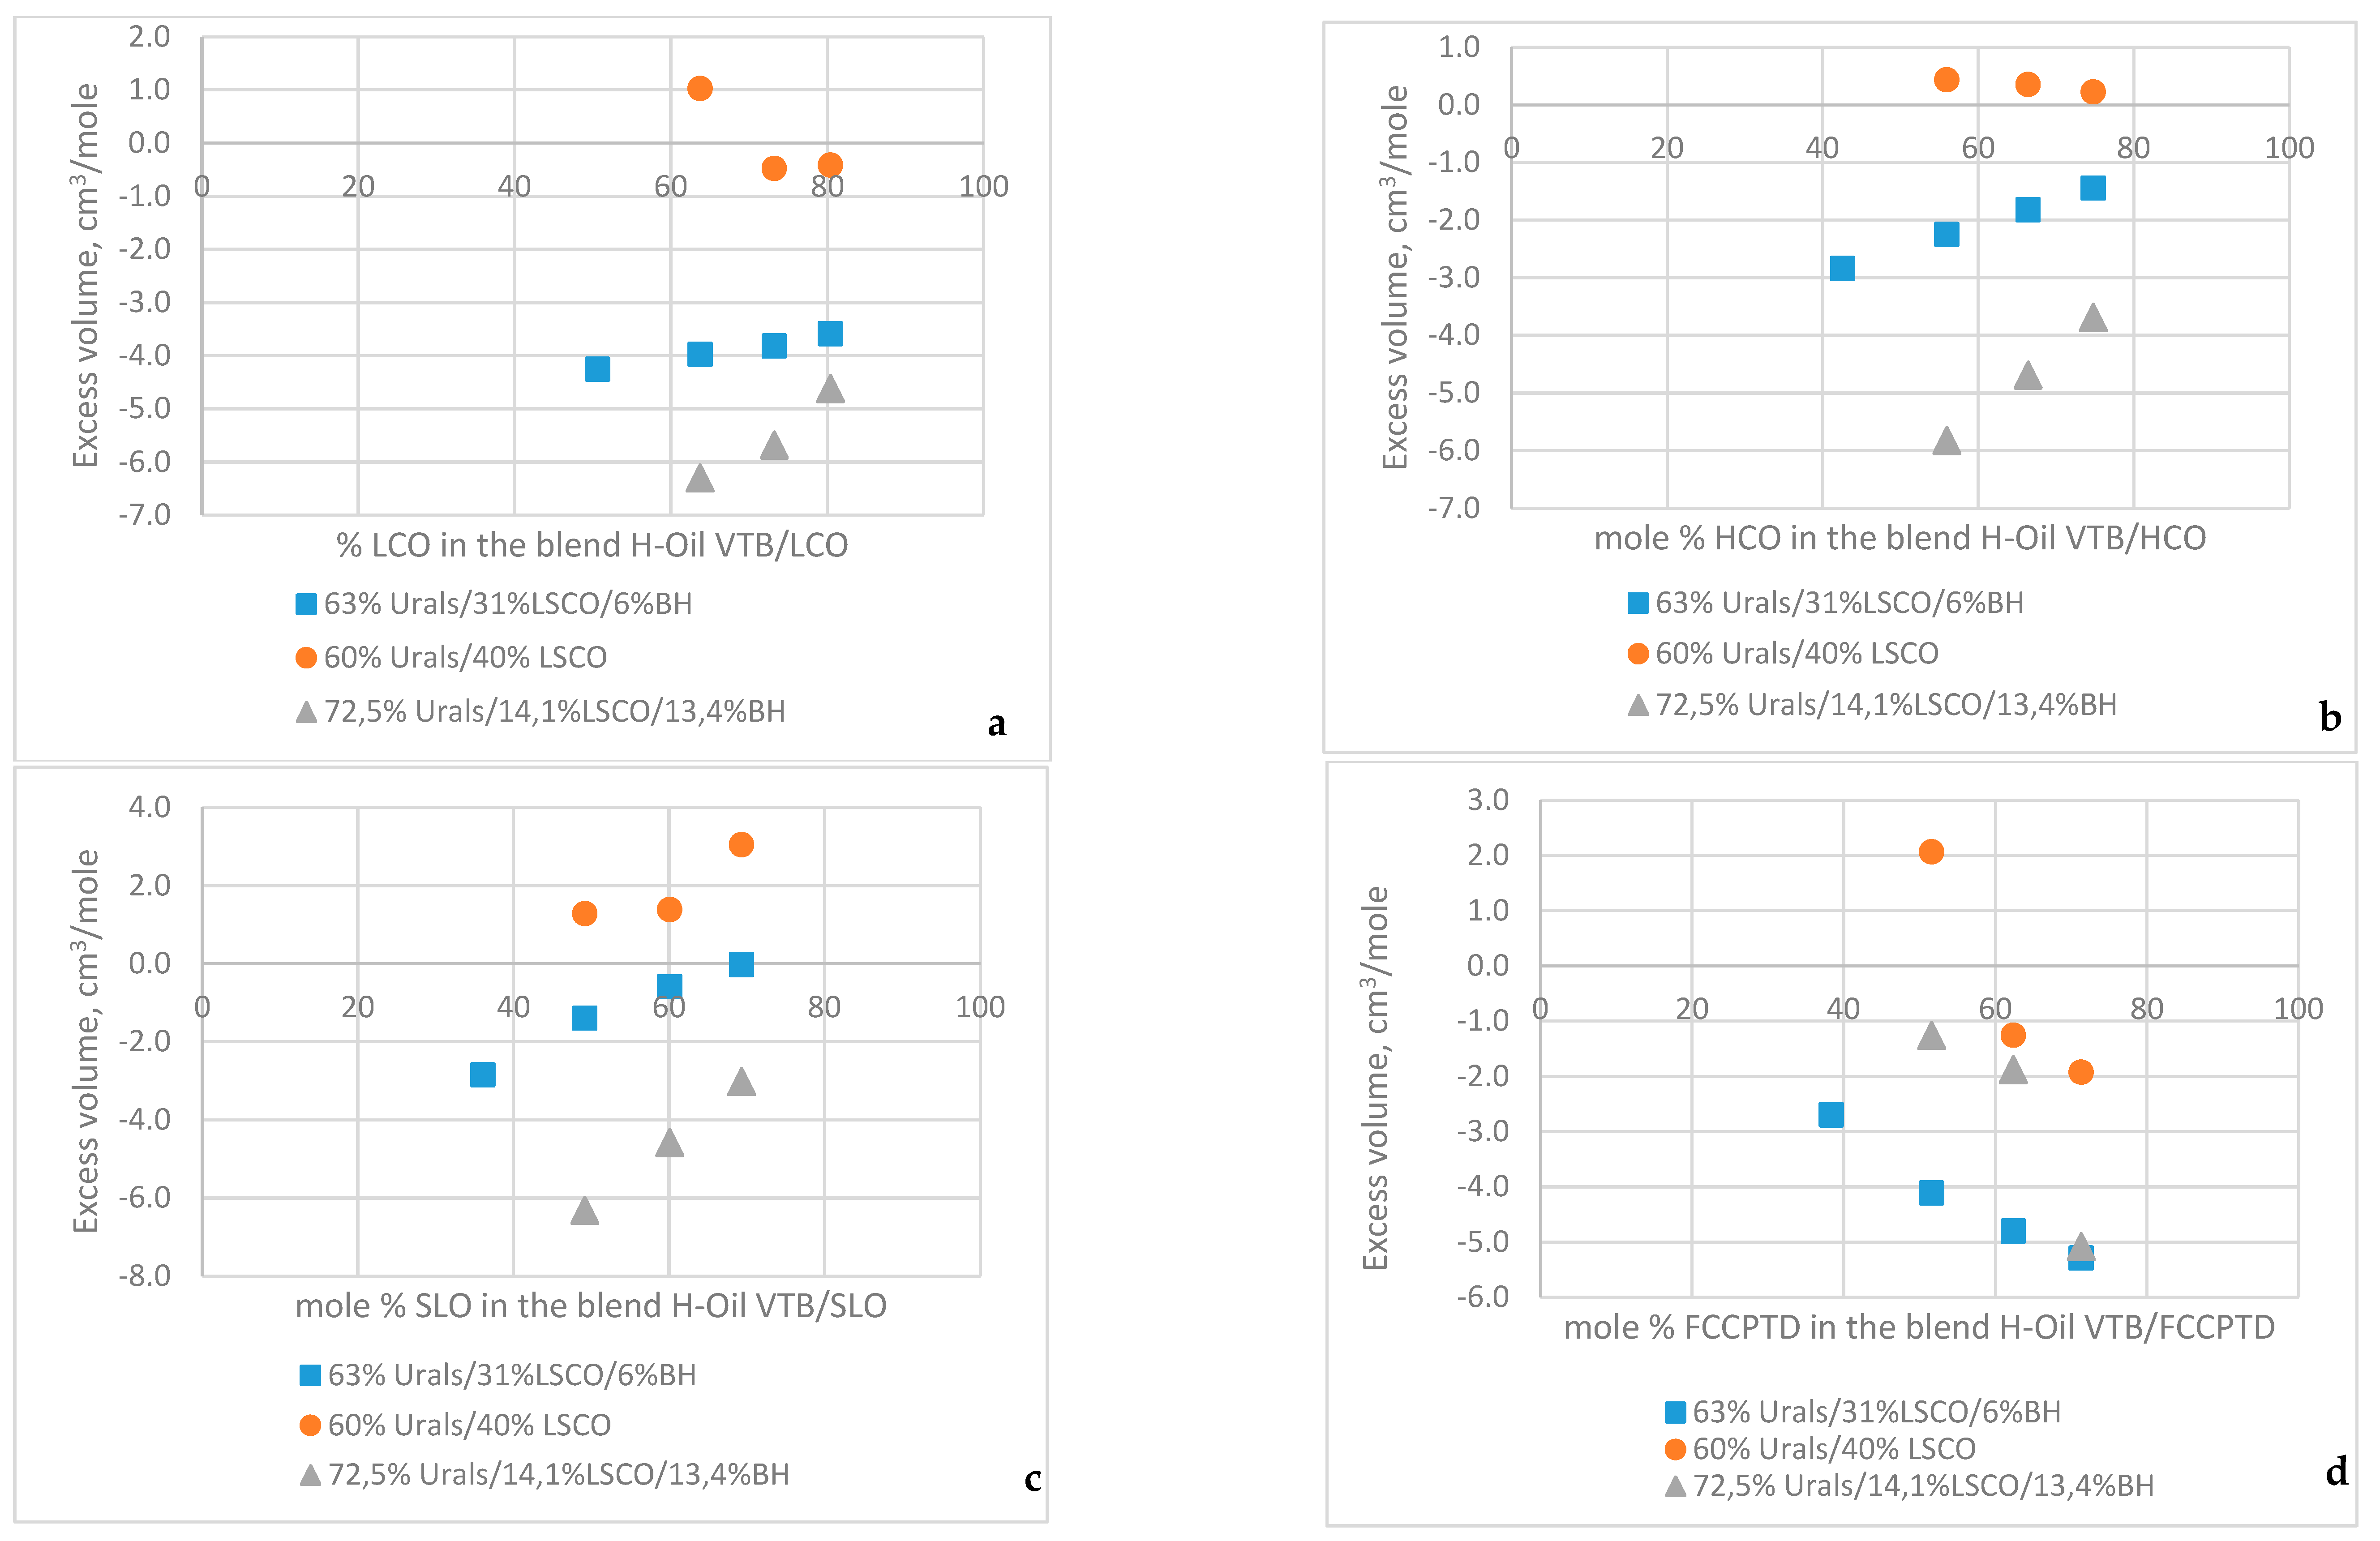
4.1. Variation of the Molar Excess Volume of the Blends of H-Oil VTBs with the Cutter Stocks

The data in Table 6 indicate that the mixing of the three H-Oil VTBs with the cutter stocks is associated with deviation from regular solution behavior. The excess molar volume of the blends of H-Oil VTB with the cutter stocks indicates specific interactions between the mixing oils. These interactions can be stronger or weaker than those existing between the molecules of the pure individual H-Oil VTB and cutter stocks thus leading to deviations in the regular solution behavior. The sign on the value of the excess molar volume, therefore, shows the magnitude of deviation from ideality and the strength of the interaction between the H-Oil VTB and cutter stocks relative to the interactions of the molecules of the individual oils before mixing. The positive excess molar volume indicates volume expansion on mixing and thus repulsive interaction of mixing H-Oil VTB and cutter stocks, or weaker interactions than the interactions of the pure individual oils. On the other hand, negative excess molar volume shows stronger interactions of mixed molecules than individual molecules before mixing. Figure 7 shows how the molar excess volume varies with the mole % alteration of the cutter stocks in the blends. It is evident from these data that the H-Oil VTB (60% Urals/40% LSCO) with the cutter stocks FCC LCO and HCO exhibits molar excess volume very close to zero suggesting that the molecules of this particular H-Oil VTB and those of the cutter stocks FCC LCO and HCO have interactions very close to each other. On the other hand, the H-Oil VTBs (63% Urals/31% LSCO/6% BH) and (72.5% Urals/14.1% LSCO/13.4% BH) demonstrate a higher magnitude of negative molar excess volume. This suggests that the interactions between the H-Oil VTB molecules with the molecules of the FCC LCO and HCO are featured by stronger attractive forces than between the H-Oil VTB molecules themselves. This can explain the reduction of the molar excess volume for the blends of the H-Oil VTBs from the crude blends containing the crude oil Basrah Heavy with the high aromatic FCC gas oils. The increase of the content of the Basrah Heavy in the crude blend obviously leads to enhancement of the intermolecular forces of attraction between the molecules of H-Oil VTB with those of the FCC gas oils. With the FCC SLO, the H-Oil VTB (60% Urals/40% LSCO) demonstrates positive values of the molar excess volume suggesting the presence of repulsive interaction between the molecules of this particular H-Oil VTB with the molecules of the FCC SLO. It is interesting to note here that with the blends of H-Oil VTBs with the lower aromatic FCCPT diesel, the attractive forces become stronger with the increase of mole% content of the FCCPT diesel in the blend, a phenomenon not observed with the H-Oil VTB blends with the high aromatic FCC gas oils. From repulsive forces between the molecules of the H-Oil VTB (60% Urals/40% LSCO) with the molecules of FCCPT diesel at 50 mole% of FCCPT diesel in the blend, they become attractive at 60 mole% and higher, which indicates how complicated the molecular interactions between the H-Oil VTBs and the cutter stocks are.

4.2. Sediment Content in the Blends of H-Oil VTBs with the Cutter Stocks

The sediment content measured by the hot filtration test is considered to represent the amount of precipitate formed mainly by the asphaltenes contained in the H-Oil VTB [13,17,20,49,50]. The size of the openings of the filter in the hot filtration test is 1.6 μm (1600 nm) which means that only the particles bigger than 1600 nm will remain on the filter. The smaller particles will go through the filter. Gray et al. [51] and Vargas et al. [52,53] report that asphaltene precipitation begins with instantaneous formation of particles of dimensions from 200 nm to 2 μm. Keeping in mind that the content of inorganic material in the H-Oil VTB/cutter stock blends measured by the ash content was lower than 0.03 wt.%, we could safely assume that the sediment content in the studied H-Oil VTB/cutter stock blends should be ascribed to the asphaltene precipitation phenomenon. The processing of blends of vacuum residual oils derived from different crude oils in the H-Oil hydrocracker has shown in our recent research that it has an impact on both the extent of hydrodemetallization and hydrodeasphaltization [47]. In this study, we have seen that the VTBs obtained from different VR blends demonstrate a different response to sediment formation when blending with the different cutter stocks (Figure 3). In order to search for any relation between the composition of the crude oil blend processed, the excess molar volume and the sediment content in the H-Oil VTB/cutter stock blends intercriteria analysis (ICrA) evaluation was performed. Table 8 and Table 9 indicate μ, and υ values of ICrA evaluation of relations between the crude oil blend composition, sediment content, and the excess molar volume of the H-Oil VTB/cutter stock blends. Concerning the sediment content only, the LSCO has a strong negative statistically meaningful relation μ = 0.00 only with the low aromatic FCCPT diesel cutter stock. This implies that the processing of VR from LSCO in the H-Oil hydrocracker makes the obtained H-Oil VTB form less sediments when blending with low aromatic cutter stocks. However, as observed from the data in Figure 3, the FCCPT diesel has made the highest sediment content in the blends H-Oil VTB/cutter stocks among all studied cutter stocks. This puts a great doubt on the possibility to attain sediment content of less than 0.1 wt.% even when VR from 100% LSCO is processed, and the obtained H-Oil VTB is mixed with the low aromatic FCCPT diesel. It is interesting to note here that the H-Oil VTB/FCC LCO blend sediment content has strong negative statistically meaningful relations μ = 0.00 with the sediment content of the blends H-Oil VTB/FCC HCO, SLO, and FCCPT diesel. This finding may suggest that the components forming the sediments which are soluble in LCO seem to be not or less soluble in FCC HCO, SLO, and FCCPT diesel. From the available data, it is difficult to deduce which crude oil may contribute to the appearance of this phenomenon.
Regarding the effect of the crude oil blend composition on the molar excess volume, as a measure of the molecular interactions, one can see from the data in Table 8 and Table 9 that Urals and Basrah Heavy crude oil have strong negative statistically meaningful relations μ = 0.00 with the molar excess volume of the mixtures H-Oil VTB/FCC, LCO, HCO, and SLO, while the LSCO has strong positive statistically meaningful relations μ = 1.00 with the same cutter stocks. It could be concluded from here that both Urals and Basrah Heavy increase the negative value of the molar excess volume of the H-Oil VTB mixtures with FCC LCO, HCO, and SLO, which is enhancing the attractive forces between the molecules of H-Oil VTBs and those of the FCC gas oils.
Whereas the LSCO augments the positive value of the molar excess volume of the H-Oil VTB mixtures with FCC LCO, HCO, and SLO, this suggests an increase of the repulsive forces between the molecules of H-Oil VTBs and those of the FCC gas oils. The three studied crude oils exhibit lack of meaningful relations with the molar excess volume of the blends H-Oil VTBs/FCCPT diesel. Therefore, it is difficult to determine which crude oil contributes to attractive or repulsive forces between the molecules of the H-Oil VTBs and the molecules of FCCPT diesel.
The data in Table 8 and Table 9 show the presence of strong negative statistically meaningful relations μ = 0.00 between the molar excess volume of the blends H-Oil VTB/FCC gas oils and the sediment content of the mixtures H-Oil VTBs/FCCPT diesel. This finding suggests that the stronger the molecular attractive interactions between H-Oil VTBs and the aromatic FCC gas oils, the higher the tendency these H-Oil VTBs to make more sediments when mixing with FCCPT diesel.

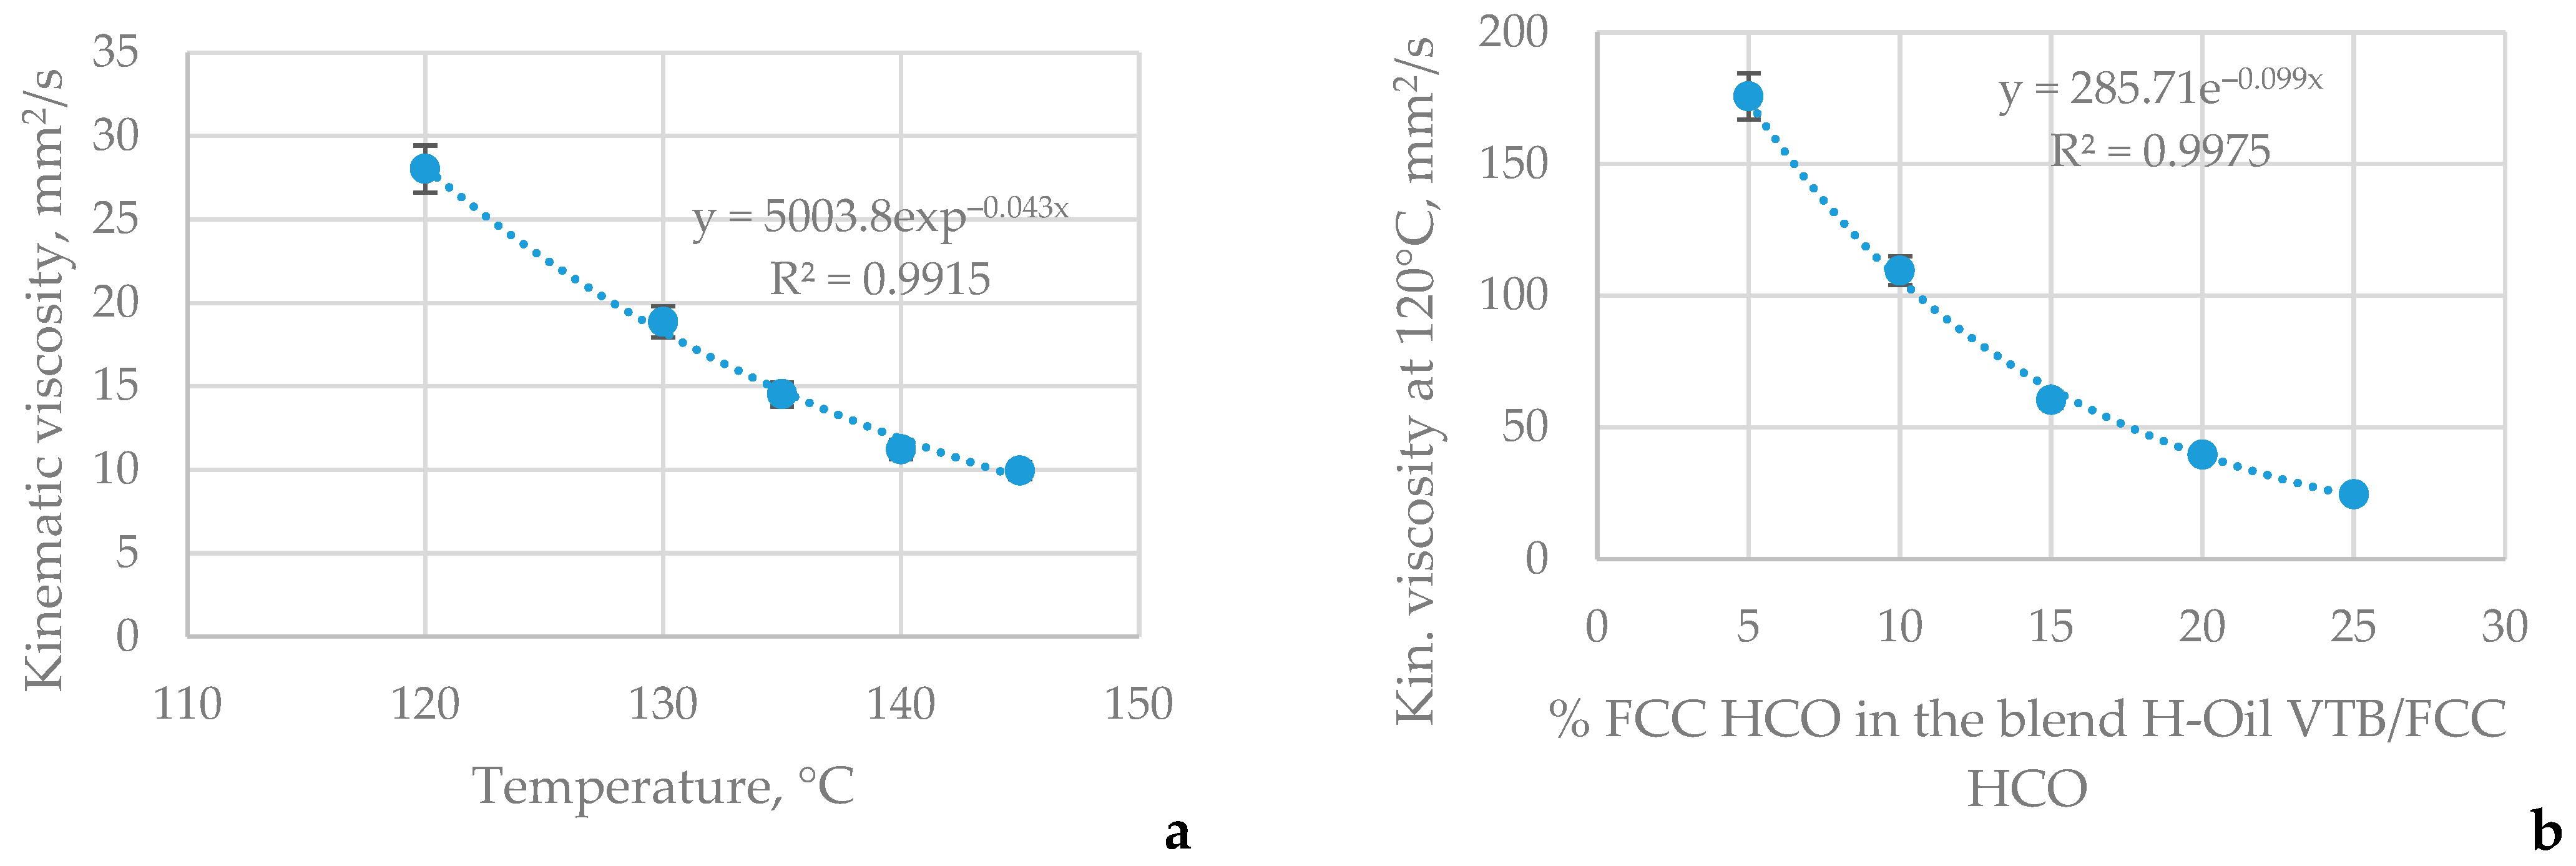
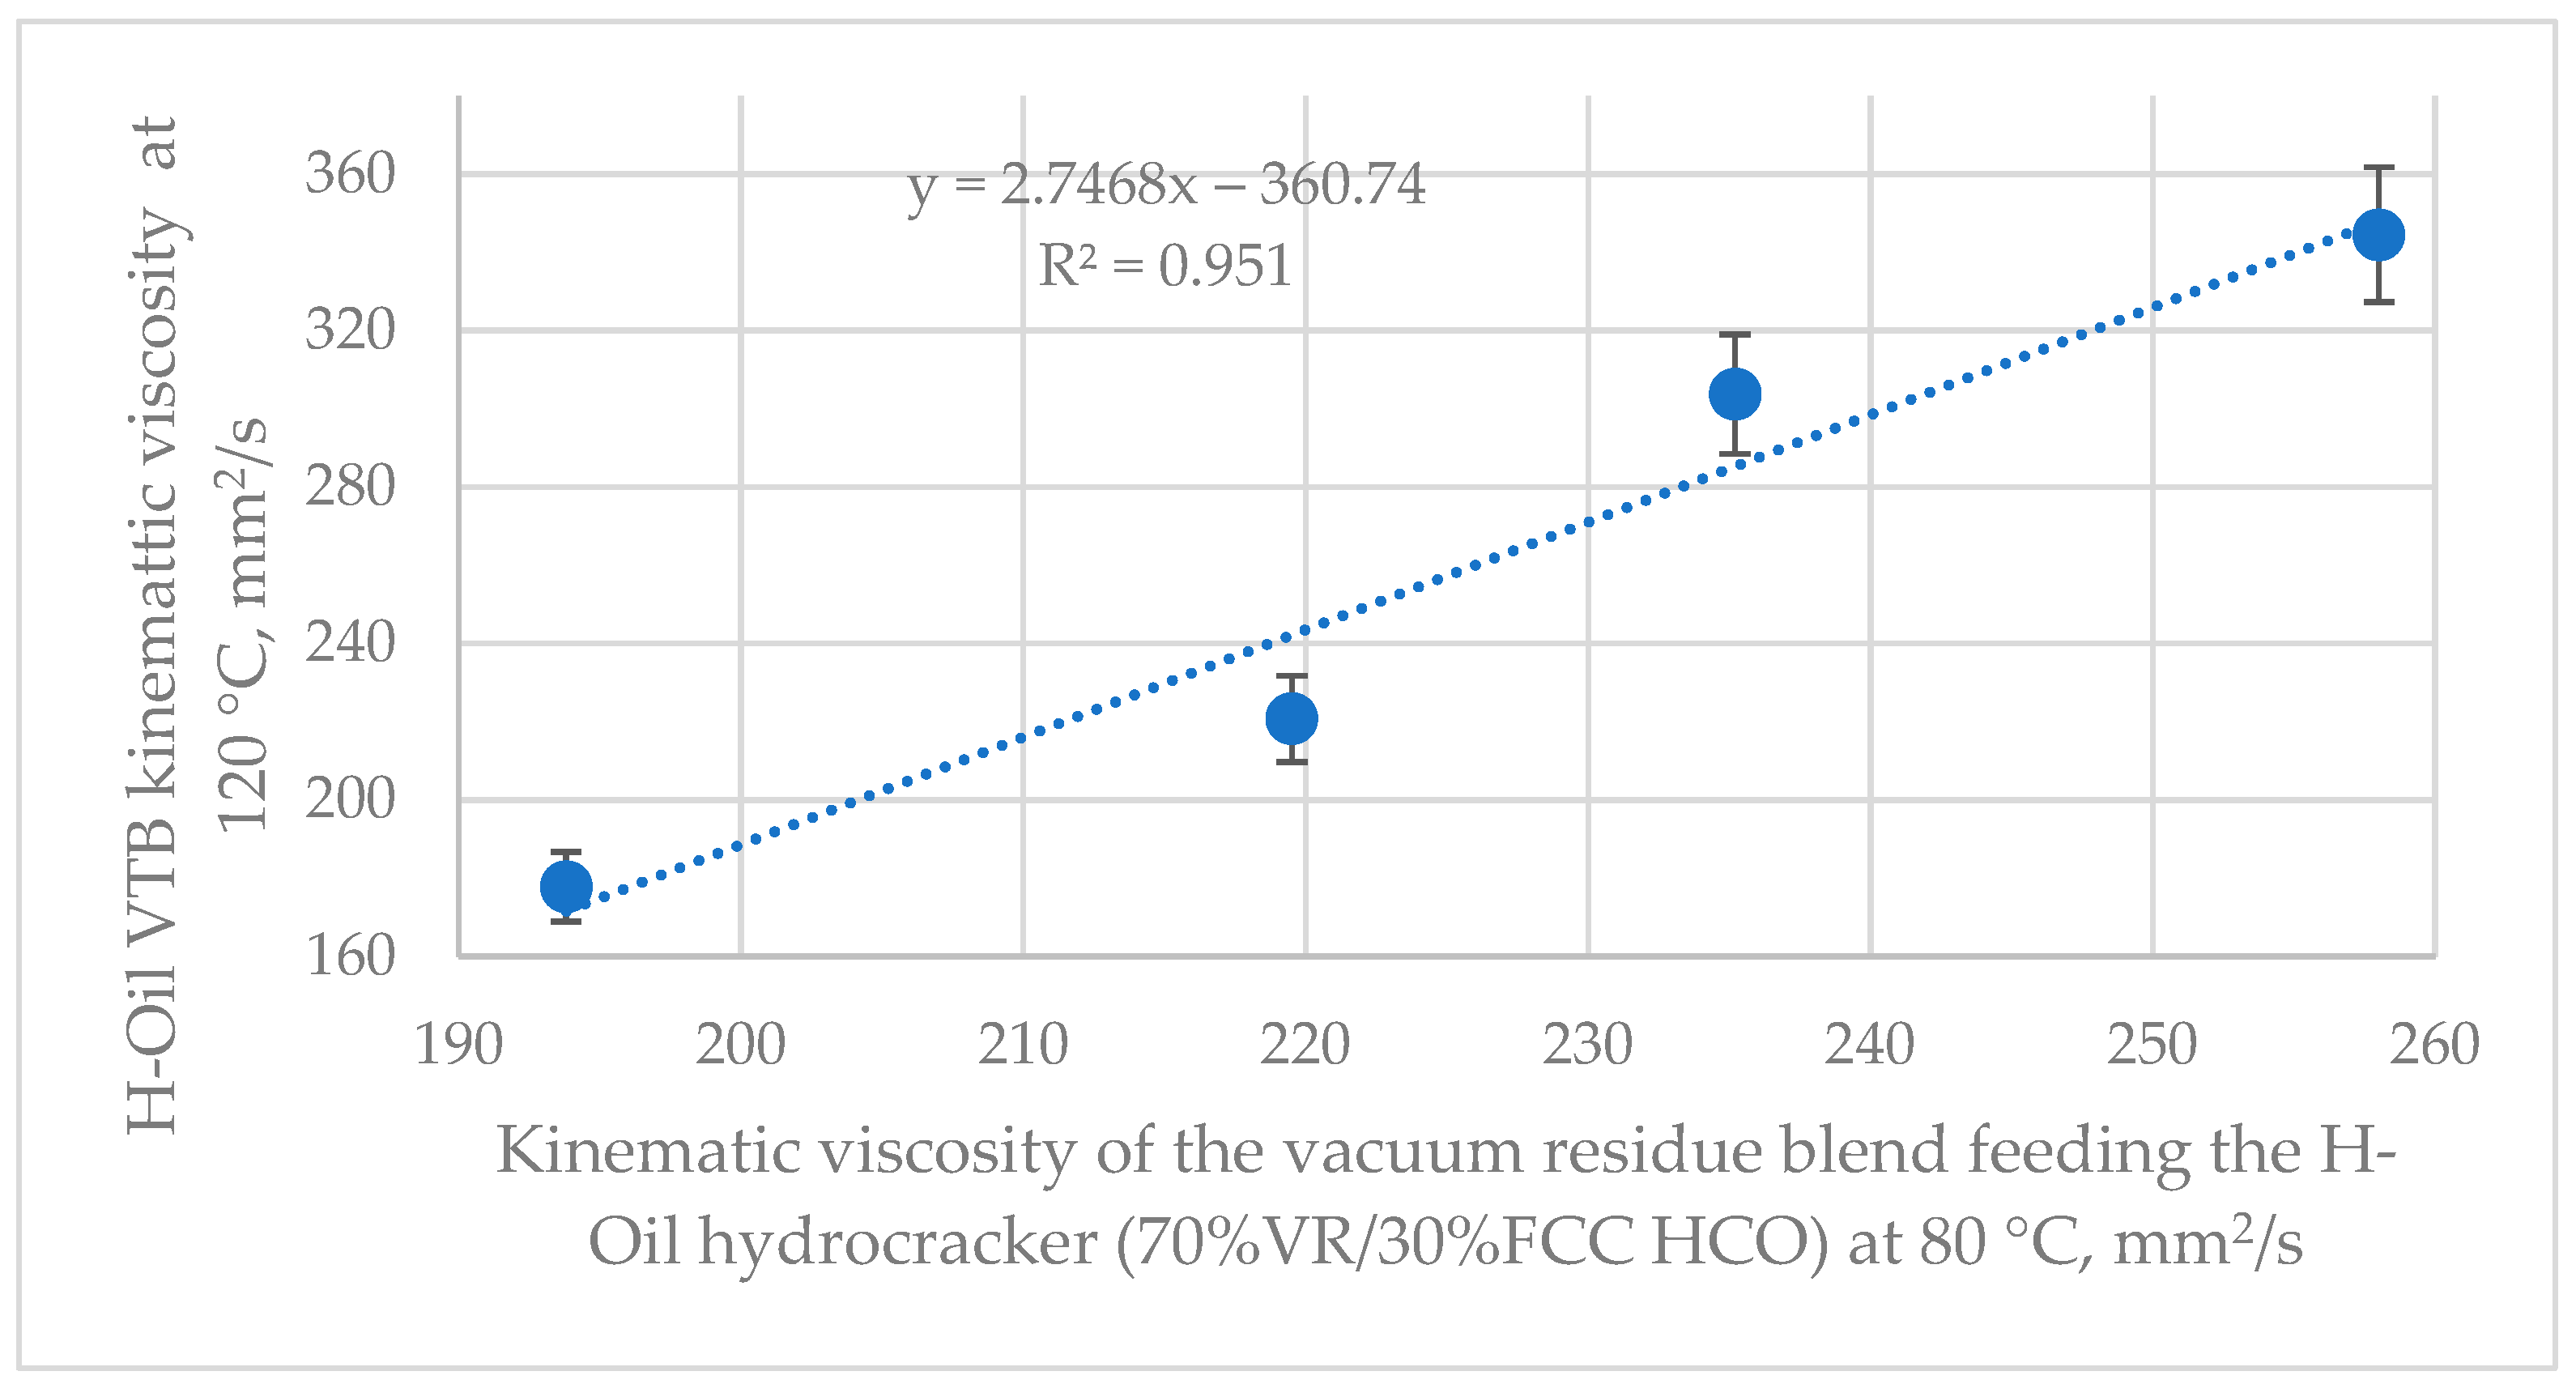
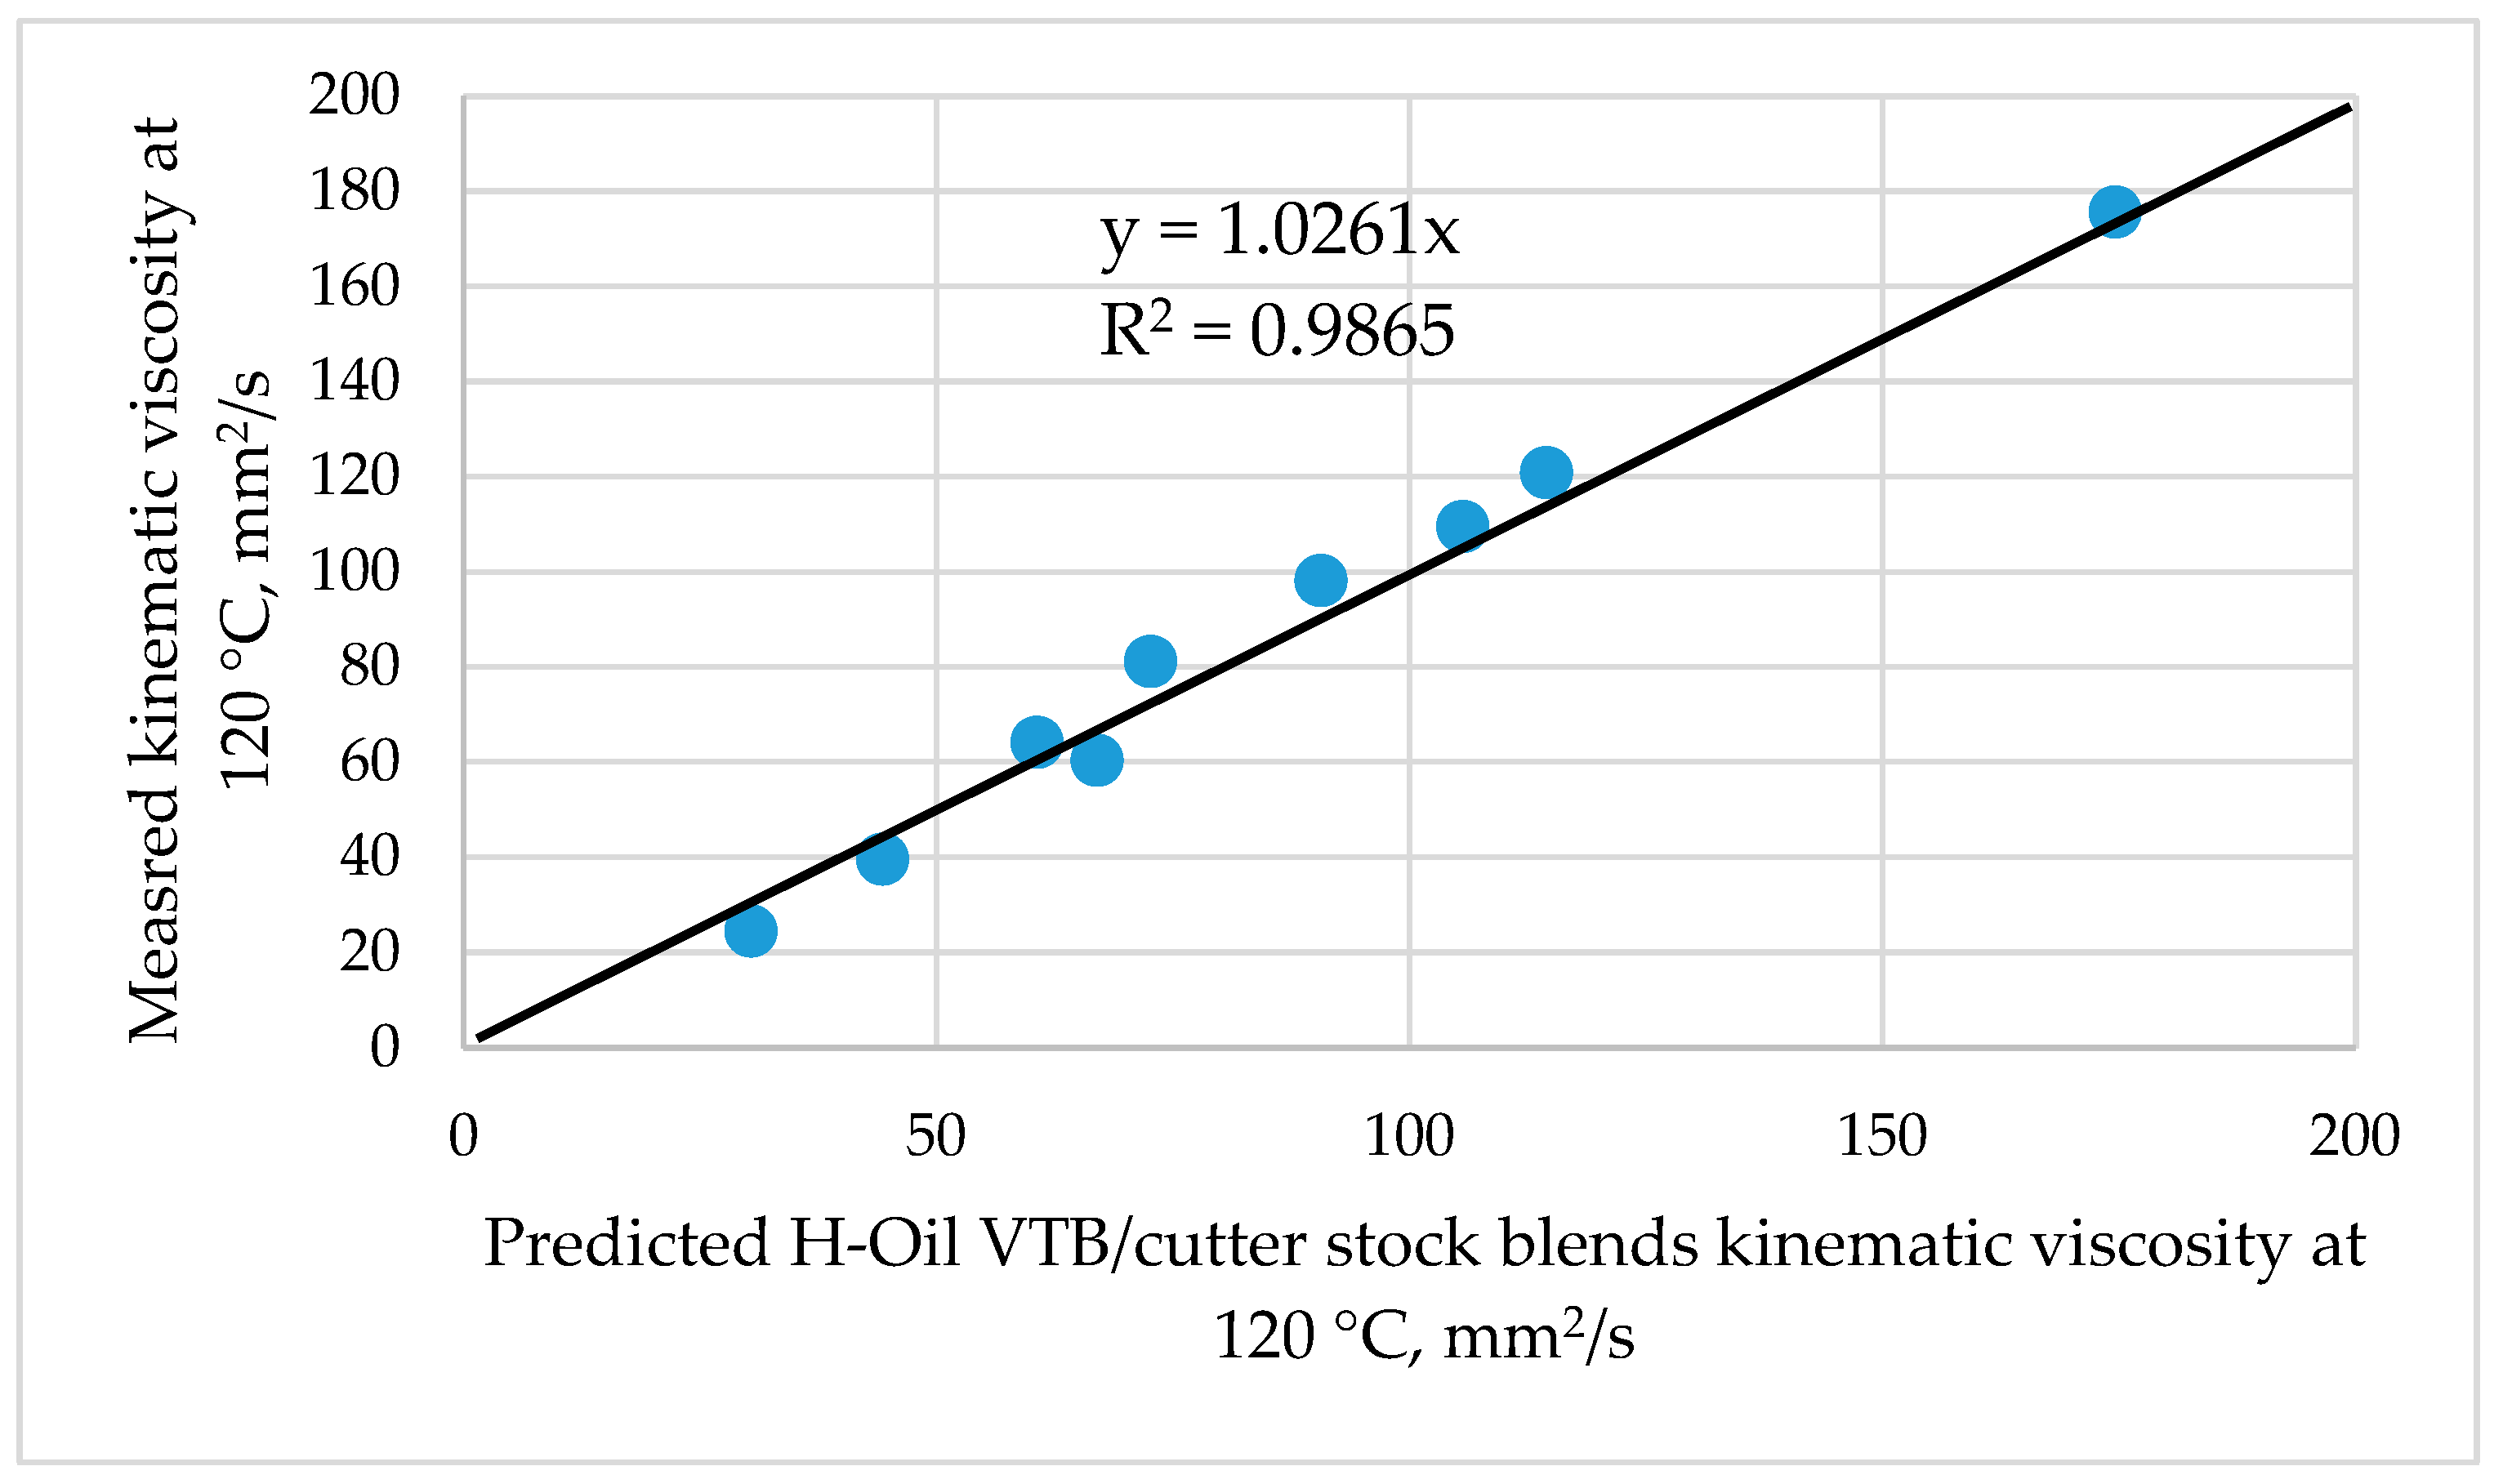
4.3. Viscosity Dependence of H-Oil VTB on the Viscosity of the Processed Vacuum Residue Blend in the H-Oil Hydrocracker and Prediction of Viscosity of the Blends H-Oil VTB/Cutter Stocks

Similar to the vacuum residue visbreaking where the visbreaker residue was found to linearly depend on the viscosity of the vacuum residue blend reported in our earlier research [34], the vacuum residue ebullated bed H-Oil hydrocracking demonstrated the same linear relationship (Figure 6). The data in Figure 6 suggest that the higher the viscosity of the VR hydrocracker feed, the higher the viscosity of the hydrocracked unconverted vacuum residue. It is worth noting here that the four points in Figure 6 lie on the same line, although the difference in conversion level between the four cases shown in Table 3 is 12 wt.%. This implies that a difference in conversion level of 12 wt.% has no impact on viscosity of the H-Oil VTB. Equations (4)–(6) used to estimate the viscosity of the mixed H-Oil VR feed were also employed to predict the viscosity of blends of the additionally studied H-Oil VTB obtained from the crude oil blend (78% Urals/2.5% LSCO/19.5% Kirkuk) with the FCC HCO. Figure 8 shows a graph of agreement between estimated by Equations (4)–(6) and measured viscosity of the blends H-Oil VTB (78% Urals/2.5% LSCO/19.5% Kirkuk)/FCC HCO. These data indubitably show the good prediction ability of Equations (4)–(6) with an average absolute % deviation (%AAD) of 8.8%.
This research confirmed our earlier results reported in [43,54] showing the good prediction ability of Equations (4)–(6) to estimate viscosity of oil blends which have different properties. By the use of these equations, one can predict viscosity of the VR ebullated bed hydrocracking feed, and consequently the H-Oil VTB viscosity by the equation embedded in Figure 6, and the required amount of cutter stocks to meet the heavy fuel oil specification for viscosity.

5. Conclusions

Crude oil blends of Urals, Siberian Light (LSCO), and Basrah Heavy (BH) were processed in LNB refinery and derived thereof vacuum residue mixtures were hydrocracked in the H-Oil ebullated bed hydrocracker. The obtained H-Oil hydrocracked unconverted vacuum residues (VTBs) were blended with the high aromatic FCC gas oils LCO, HCO, and SLO, and with the low aromatic FCCPT diesel. The densities of the blends H-Oil VTB/cutter stocks were found to deviate from the regular solution behavior demonstrating both attractive and repulsive intermolecular forces between the molecules of the H-Oil VTBs and the ones from the cutter stocks. The application of intercriteria analysis revealed that both Urals and Basrah Heavy crude oils enhance the attractive forces between the molecules of H-Oil VTBs and those of the FCC gas oils, while the LSCO increases the repulsive forces between the molecules of H-Oil VTBs and those of the FCC gas oils. The three studied crude oils were difficult to define which one contributes to attractive or repulsive forces between the molecules of the H-Oil VTBs and the molecules of FCCPT diesel. The sediment content in the blends H-Oil VTB/cutter stock did not exhibit the typical trend of reduction with aromatic cutter stock content enhancement observed in the other studies illustrating how complicated the matter of sediment formation in the hydrocracked residual oils is. The increase of the low aromatic FCCPT diesel content also showed no augmenting effect on the sediment content in the studied H-Oil VTB-FCCPT diesel blends. The application of ICrA evaluation did not disclose any statistically meaningful relation between the crude blend composition and the sediments in the blends H-Oil VTB/FCC gas oils. Solely the LSCO showed depressing effect on sediment content of the blends H-Oil VTBs/FCCPT diesel. However, the FCCPT diesel has made the highest sediment content in the blends H-Oil VTB/cutter stocks among all studied cutter stocks suggesting that even at processing VR from 100% LSCO, the blends of H-Oil VTB with the FCCPT diesel would report much higher than the required specification of maximum 0.1 wt.% sediments.
It was found that the viscosity of the H-Oil VTB obtained during hydrocracking of straight run vacuum residue blend linearly depended on the viscosity of the H-Oil VR feed blend. The applied equations to predict viscosity of blends containing straight run and hydrocracked vacuum residues and cutter stocks proved their good prediction ability.
The performed study has indicated that viscosity of the H-Oil VTB obtained from hydrocracking of vacuum residues derived from different crudes and their mixtures with cutter stocks can be predicted from information about viscosity of the straight run vacuum residues and those of the cutter stocks. However, the sediment formation rate in the blends H-Oil VTB cutter stocks did not show any possibility for prediction. Indeed, the high aromatic FCC gas oils demonstrated much lower sediments than the low aromatic FCCPT diesel. Nevertheless, the question regarding why the different FCC gas oils exhibited different sediment depressing effect for the H-Oil VTBs obtained from the different crude oil blends remains unclear. Given that residual oils are extremely complex mixtures of components, a significant number of additional experimental tests are needed to shed more light on this issue.

Author Contributions

Conceptualization, D.S.; methodology, S.S. and S.R.; software, S.R. and D.D.S.; formal analysis, E.S. and I.K.; investigation, I.K. and D.D.S.; resources, S.S.; data curation, D.S. and I.S.; writing—original draft preparation, D.S. and I.S.; writing—review and editing, D.S. and I.K.; supervision, K.A.; project administration, S.S.; funding acquisition, E.S. and S.S. All authors have read and agreed to the published version of the manuscript.

Funding

This research was funded by University Prof. Dr. Assen Zlatarov-Burgas, Project: Center of Excellence UNITE BG05M2OP001-1.001-0004/28.02.2018 (2018–2023).

Data Availability Statement

Not applicable.

Conflicts of Interest

The authors declare no conflict of interest.

Nomenclature

AroContent of aromatic compounds, wt.%
AspContent of asphaltenes, wt.%
ATBAtmospheric tower bottom product
BHBasrah heavy crude oil
C5-aspContent of n-pentane asphaltenes, wt.%
C7-aspContent of n-heptane asphaltenes, wt.%
EBVRHCEbullated vacuum residue hydrocracking
FBPFinal boiling point, °C
FCCFluid catalytic cracking
FCCPTFluid catalytic cracking pretreater
HAGOHeavy atmospheric gas oil
HCOHeavy cycle oil
HTSDHigh-temperature simulated distillation
HVGOHeavy vacuum gas oil
IBPInitial boiling point, °C
KwWatson characterization factor
LCOLight cycle oil
LSCOLight Siberian crude oil
LHSVLiquid hourly space velocity, h−1
LNBLUKOIL Neftohim Burgas
LVGOLight vacuum gas oil
MWMolar weight, g/mol
PBFOPartially blended fuel oil
ResContent of resins, wt.%
SAR-ADPatented method for separation of SAR (saturates, aromatics, and resins) combined with Asphaltene Determinator (AD)
SARASaturates, aromatics, and resins
SLOSlurry oil
TBPTrue boiling point, °C
TSETotal sediment existent content, wt.%
TSPTotal sediment potential content, wt.%
VEExcess molar volume, m3
VGOVacuum gas oil
VTBVacuum tower bottom product
VRVacuum residue
WABTWeight average bed temperature, °C
∆VRelative changes in volume
χiMole fraction of the individual component i, mol/mol
MiMolar mass of the individual component i, g/mol
VoiMolar volume of the individual component i, m3/mol
ρiDensity of the individual component i, g/m3
miMass fraction of the individual component i
ϕ1Volume fraction of the cutter stock.

References

  1. Treese, S.; Jones, D.; Pujado, P. Handbook of Petroleum Processing; Springer: Cham, Switzerland, 2020. [Google Scholar]
  2. Panariti, N.; Rispoli, G. The first EST Commercial Unit: Achieving the goal of residue conversion. In Proceedings of the 13th International Bottom of the Barrel Conference, Istanbul, Turkey, 14–15 May 2015. [Google Scholar]
  3. Dreillard, M.; Marques, J.; Barbier, J.; Feugnet, F. Deep conversion of vacuum residue while limiting sediment formation. In Proceedings of the Petrophase Conference, The Chateaux at Deer Valley, Uta, Park City, UT, USA, 11 July 2018. [Google Scholar]
  4. Stratiev, D.; Nenov, S.; Shishkova, I.; Georgiev, B.; Argirov, G.; Dinkov, R.; Yordanov, D.; Atanassova, V.; Vassilev, P.; Atanassov, K. Commercial investigation of the ebullated-bed vacuum residue hydrocracking in the conversion range of 55–93%. ACS Omega 2020, 51, 33290–33304. [Google Scholar] [CrossRef] [PubMed]
  5. Bellussi, G.; Rispoli, G.; Landoni, A.; Millini, R.; Molinari, D.; Montanari, E.; Moscotti, D.; Pollesel, P. Hydroconversion of heavy residues in slurry reactors: Developments and perspective. J. Catal. 2013, 308, 189–200. [Google Scholar] [CrossRef]
  6. Stratiev, D.; Shishkova, I.; Dinkov, R.; Dobrev, D.; Argirov, G.; Yordanov, D. The Synergy between Ebullated Bed Vacuum Residue Hydrocracking and Fluid Catalytic Cracking Processes in Modern Refining—Commercial Experience; Professor Marin Drinov Publishing House of Bulgarian Academy of Sciences: Sofia, Bulgaria, 2022; ISBN 978-619-245-234-6. [Google Scholar]
  7. Yang, C.; Du, F.; Zheng, H.; Chung, K.H. Hydroconversion characteristics and kinetics of residue narrow fractions. Fuel 2005, 84, 675–684. [Google Scholar] [CrossRef]
  8. Dinkov, R.; Kirilov, K.; Stratiev, D.; Sharafutdinov, I.; Dobrev, D.; Nguyen-Hong, D.; Chapot, S.; Le-coz, J.F.; Burilkova, A.; Bakalova, D.; et al. Feasibility of bitumen production from unconverted vacuum tower bottom from H-Oil ebullated bed residue hydrocracking. Ind. Eng. Chem. Res. 2018, 57, 2003–2013. [Google Scholar] [CrossRef]
  9. Marques, J.; Maget, S.; Verstraete, M.J.J. Improvement of ebullated-bed effluent stability at high conversion operation. Energy Fuels 2011, 25, 3867–3874. [Google Scholar] [CrossRef]
  10. Robert, E.C.; Merdrignac, I.; Rebours, B.; Harlé, V.; Kressmann, S.; Colyar, J. Contribution of analytical tools for the understanding of sediment formation: Application to H-Oil® Proces. Pet. Sci. Technol. 2003, 21, 615–627. [Google Scholar] [CrossRef]
  11. Nakashima, N. Update on H-Oil Unit Fouling Mitigation Study; Criterion EB Workshop: Vancouver, BC, Canada, 2018. [Google Scholar]
  12. Bannayan, M.A.; Lemke, H.K.; Stephenson, W.K. Fouling mechanisms and effect of process conditions on deposit formation in H-Oil. Stud. Surf. Sci. Catal. 1996, 100, 273–281. [Google Scholar]
  13. Manek, E.; Haydary, J. Hydrocracking of vacuum residue with solid and dispersed phase catalyst: Modeling of sediment formation and hydrodesulfurization. Fuel Process. Technol. 2017, 159, 320–327. [Google Scholar] [CrossRef]
  14. Respini, M.; Ekres, S.; Wright, B.; Žajdlík, R. Strategies to control sediment and coke in a hydrocracker. Pet. Technol. Q. 2013, 18, 23–35. [Google Scholar]
  15. Kunnas, J.; Ovaskainen, O.; Respini, M. Mitigate fouling in ebullated-bed hydrocrackers. Hydrocarb. Process. 2010, 10, 59–64. [Google Scholar]
  16. Matsushita, K.; Marafi, A.; Hauser, A.; Stanislaus, A. Relation between relative solubility of asphaltenes in the product oil and coke deposition in residue hydroprocessing. Fuel 2004, 83, 1669–1674. [Google Scholar] [CrossRef]
  17. Stanislaus, A.; Hauser, A.; Marafi, M. Investigation of the mechanism of sediment formation in residual oil hydrocracking process through characterization of sediment deposits. Catal. Today 2005, 109, 167–177. [Google Scholar] [CrossRef]
  18. Marafi, M.; Al-Barood, A.; Stanislaus, A. Effect of Diluents in Controlling Sediment Formation during Catalytic Hydrocracking of Kuwait Vacuum Residue. A Pet. Sci. Technol. 2005, 23, 899–908. [Google Scholar] [CrossRef]
  19. Tirado, A.; Ancheyta, J. A batch reactor study of the effect of aromatic diluents to reduce sediment formation during hydrotreating of heavy oil. Energy Fuels 2018, 32, 60–66. [Google Scholar] [CrossRef]
  20. García, F.O.; Mar-Juárez, E.; Hernández, P.S. Controlling Sediments in the Ebullated Bed Hydrocracking Process. Energy Fuels 2012, 26, 2948–2952. [Google Scholar] [CrossRef]
  21. Stratiev, D.; Dinkov, R.; Shishkova, I.; Sharafutdinov, I.; Ivanova, N.; Mitkova, M.; Yordanov, D.; Rudnev, N.; Stanulov, K.; Artemiev, A.; et al. What is behind the high values of hot filtration test of the ebullated bed residue H-Oil hydrocracker residual oils? Energy Fuels 2016, 30, 7037–7054. [Google Scholar] [CrossRef]
  22. Almukhtar, R.; Hammoodi, S.I.; Majdi, H.S.; Sukkar, K.A. Managing Transport Processes in Thermal Cracking to Produce High-Quality Fuel from Extra-HeavyWaste Crude Oil Using a Semi-Batch Reactor. Processes 2022, 10, 2077. [Google Scholar] [CrossRef]
  23. Alvarez, A.E.; Ovalles, E.; Rodríguez, M.C.; Rodríguez, A.F.; Castillo, P.J.; Rivas, J.C.; Reyes-Ortíz, O.J.; Rincón-Morantes, J.F. Adhesion quality and rheological properties of unmodified and nano-modified asphalt residues derived from paving-heavy crude oils. DYNA 2019, 86, 357–366. [Google Scholar]
  24. Ahmad, I.; Sohail, S.M.; Khan, H.; Ahmad, W.; Gul, K.; Khan, R.; Yasin, A. Study on Atmospheric Distillation of Some Plain and Chemically Dispersed Crude Oils: Comparison of Yields and Fuel Quality of Distillate Fractions. Energy Fuels 2018, 32, 181–190. [Google Scholar] [CrossRef]
  25. Waziri, M.; Audu, A.; Alex, B. A comparison of the quality of low pour fuel oils (LPFO) blended from Nigerian and foreign crude oils. Petrol. Sci. Technol. 2014, 32, 1473–1479. [Google Scholar] [CrossRef]
  26. Jarullah, A.T.; Mujtaba, I.M.; Wood, A.S. Improving fuel quality by whole crude oil hydrotreating: A kinetic model for hydrodeasphaltenization in a trickle bed reactor. Appl. Energy 2012, 94, 182–191. [Google Scholar] [CrossRef]
  27. Rathore, V.; Brahma, R.; Thorat, T.S.; Rao, P.V.C.; Choudary, N.V. Assessment of crude oil blends. Pet. Technol. Q. 2011, 16, 111–117. [Google Scholar]
  28. Kumar, R.; Voolapalli, R.K.; Upadhyayula, S. Prediction of crude oil blends compatibility and blend optimization for increasing heavy oil processing. Fuel Process. Technol. 2018, 177, 309–327. [Google Scholar] [CrossRef]
  29. Frecon, J.; Le-Bars, D.; Rault, J. Flexible upgrading of heavy feedstocks. Pet. Technol. Q. 2019, Q1, 1–11. [Google Scholar]
  30. Stratiev, D.; Shishkova, I.; Dinkov, R.; Nenov, S.; Sotirov, S.; Sotirova, E.; Kolev, I.; Ivanov, V.; Ribagin, S.; Atanassov, K.; et al. Prediction of Petroleum Viscosity from Molecular Weight and Density. Fuel 2023, 331, 125679. [Google Scholar] [CrossRef]
  31. Adams, J.J.; Rovani, J.F.; Planche, J.-P.; Loveridge, J.; Literati, A.; Shishkova, I.; Palichev, G.; Kolev, I.; Atanassov, K.; Nenov, S.; et al. SAR-AD Method to Characterize Eight SARA Fractions in Various Vacuum Residues and Follow Their Transformations Occurring during Hydrocracking and Pyrolysis. Processes 2023, 11, 1220. [Google Scholar] [CrossRef]
  32. Stratiev, D.; Shishkova, I.; Nikolova, R.; Tsaneva, T.; Mitkova, M.; Yordanov, D. Investigation on precision of determination of SARA analysis of vacuum residual oils from different origin. Pet. Coal 2016, 58, 109–119. [Google Scholar]
  33. Stratiev, D.; Sotirov, S.; Sotirova, E.; Nenov, S.; Dinkov, R.; Shishkova, I.; Kolev, I.V.; Yordanov, D.; Vasilev, S.; Atanassov, K.; et al. Prediction of Molecular Weight of Petroleum Fluids by Empirical Correlations and Artificial Neuron Networks. Processes 2023, 11, 426. [Google Scholar] [CrossRef]
  34. Stratiev, D.; Dinkov, R.; Tavlieva, M.; Shishkova, I.; Palichev, G.N.; Ribagin, S.; Atanassov, K.; Stratiev, D.D.; Nenov, S.; Pilev, D.; et al. Correlations of HTSD to TBP and Bulk Properties to Saturate Content of a Wide Variety of Crude Oils. Processes 2023, 11, 420. [Google Scholar] [CrossRef]
  35. Stratiev, D.; Nenov, S.; Nedanovski, D.; Shishkova, I.; Dinkov, R.; Stratiev, D.D.; Stratiev, D.D.; Sotirov, S.; Sotirova, E.; Atanassova, V.; et al. Empirical Modeling of Viscosities and Softening Points of Straight-Run Vacuum Residues from Different Origins and of Hydrocracked Unconverted Vacuum Residues Obtained in Different Conversions. Energies 2022, 15, 1755. [Google Scholar] [CrossRef]
  36. Stratiev, D.; Shishkova, I.; Palichev, G.N.; Atanassov, K.; Ribagin, S.; Nenov, S.; Nedanovski, D.; Ivanov, V. Study of Bulk Properties Relations to SARA Composition Data of Various Vacuum Residues Employing Intercriteria Analysis. Energies 2022, 15, 9042. [Google Scholar] [CrossRef]
  37. Coquelet, C.; Auger, E.; Valtz, A. Density and Excess Volume for Four Systems Involving Eugenol and Furan. J. Solution Chem. 2019, 48, 455–488. [Google Scholar] [CrossRef]
  38. Qin, A.; Hoffman, D.E.; Munk, P. Excess Volumes of Mixtures of Alkanes with Carbonyl Compounds. J. Chem. Eng. Data 1992, 37, 55–61. [Google Scholar] [CrossRef]
  39. Atanassov, K.; Mavrov, D.; Atanassova, V. Intercriteria decision making: A new approach for multicriteria decision making, based on index matrices and intuitionistic fuzzy sets. Issues Intuit. Fuzzy Sets Gen. Nets 2014, 11, 1–8. [Google Scholar]
  40. Atanassov, K.; Atanassova, V.; Gluhchev, G. Intercriteria analysis: Ideas and problems. Notes Intuit. Fuzzy Sets 2015, 21, 81–88. [Google Scholar]
  41. Atanassov, K. Index Matrices: Towards an Augmented Matrix Calculus; Springer: Cham, Switzerland, 2014. [Google Scholar]
  42. Doukovska, L.; Atanassova, V.; Sotirova, E.; Vardeva, I.; Radeva, I. Defining Consonance Thresholds in InterCriteria Analysis: An Overview. In Intuitionistic Fuzziness and Other Intelligent Theories and Their Applications; Hadjiski, M., Atanassov, K., Eds.; Studies in Computational Intelligence; Springer: Berlin/Heidelberg, Germany, 2019; Volume 757, pp. 161–179. [Google Scholar]
  43. Stratiev, D.; Nedelchev, A.; Shishkova, I.; Ivanov, A.; Sharafutdinov, I.; Nikolova, R.; Mitkova, M.; Yordanov, D.; Rudnev, N.; Belchev, Z.; et al. Dependence of visbroken residue viscosity and vacuum residue conversion in a commercial visbreaker unit on feedstock quality. Fuel Process. Technol. 2015, 138, 595–604. [Google Scholar] [CrossRef]
  44. Stratiev, D.; Shishkova, I.; Nedelchev, A.; Kirilov, K.; Nikolaychuk, E.; Ivanov, A.; Sharafutdinov, I.; Veli, A.; Mitkova, M.; Tsaneva, T.; et al. Investigation of relationships between petroleum properties and their impact on crude oil compatibility. Energy Fuels 2015, 29, 7836–7854. [Google Scholar] [CrossRef]
  45. Stratiev, D.S.; Sotirov, S.; Shishkova, I.; Nedelchev, A.; Sharafutdinov, I.; Vely, A.; Mitkova, M.; Yordanov, D.; Sotirova, E.; Atanassova, V.; et al. Investigation of relationships between bulk properties and fraction properties of crude oils by application of the Intercriteria analysis. Petrol. Sci. Technol. 2016, 34, 1113–1120. [Google Scholar] [CrossRef]
  46. Stratiev, D.; Shishkova, I.; Dinkov, R.; Kolev, I.; Argirov, G.; Ivanov, V.; Ribagin, S.; Atanassova, V.; Atanassov, K.; Stratiev, D.; et al. Intercriteria analysis to diagnose the reasons for increased fouling in a commercial ebullated bed vacuum residue hydrocracker. ACS Omega 2022, 7, 30462–30476. [Google Scholar] [CrossRef]
  47. Georgiev, B.E.; Stratiev, D.S.; Argirov, G.S.; Nedelchev, A.; Dinkov, R.; Shishkova, I.K.; Ivanov, M.; Atanassov, K.; Ribagin, S.; Nikolov Palichev, G.; et al. Commercial Ebullated Bed Vacuum Residue Hydrocracking Performance Improvement during Processing Difficult Feeds. Appl. Sci. 2023, 13, 3755. [Google Scholar] [CrossRef]
  48. Yarranton, H. Prediction of crude oil saturate content from a simdist assay. Energy Fuels 2022, 36, 8809–8817. [Google Scholar] [CrossRef]
  49. Lim, S.H.; Go, K.S.; Nho, N.S.; Kim, Y.K.; Kwon, E.H.; Kwang, H.K.; Lee, J.G. Reaction characteristics and sediment formation of slurry phase hydrocracking with vacuum residue in a bench-scale bubble column reactor. J. Pet. Sci. Eng. 2021, 196, 107713. [Google Scholar] [CrossRef]
  50. Sundaram, K.M.; Mukherjee, U.; Baldassari, M. Thermodynamic Model of Sediment Deposition in the LC-FINING Process. Energy Fuels 2008, 22, 3226–3236. [Google Scholar] [CrossRef]
  51. Gray, M.R.; Yarranton, H.W.; Chacón-Patiño, M.L.; Rodgers, R.P.; Bouyssiere, B.; Giusti, P. Distributed properties of asphaltene nanoaggregates in crude oils: A review. Energy Fuels 2021, 35, 18078–18103. [Google Scholar] [CrossRef]
  52. Vargas, F.M.; Tavakkoli, M.; Boggara, M.; Garcia-Bermudes, M.; Evangelista, R.; Melendez, A.; Wang, F.; Sisco, C.; Mathew, N.T.; Prasad, S.; et al. Advances in Understanding Asphaltene Precipitation and Deposition. In Proceedings of the 15th International Conference on Petroleum Phase Behavior and Fouling, Galveston, TX, USA, 8–12 June 2014. [Google Scholar]
  53. Khaleel, A.T.; Sisco, C.J.; Tavakkoli, M.; Vargas, F. An Investigation of the effect of asphaltene polydispersity on asphaltene precipitation and deposition tendencies. Energy Fuels 2022, 36, 8799–8808. [Google Scholar] [CrossRef]
  54. Stratiev, D.S. Novelties in Thermal and Catalytic Processes at Production of Modern Fuels. Ph.D. Thesis, Burgas University “Assen Zlatarov”, Burgas, Bulgaria, 2010. [Google Scholar]
Figure 1. Dependence of H-Oil VTB density on conversion level. (The black dashed line is a regression line related to processing vacuum residue blends of Urals crude oils with Middle East (ME), Prinos (Greece), and Forties (UK) crude oils in the H-Oil hydrocracker. The meaning of abbreviations is as follows: Ur. = Urals crude oil; BL = Basrah Light crude oil; AM = Arab Medium crude oil. The red dashed line is a regression line related to processing only vacuum residue obtained from Urals and Siberian Light crude oils).
Processes 11 01733 g001
Figure 2. Total sediment potential of the partially blended fuel oil produced from H-Oil VTB and FCC HCO (typical blend 70% VTB/30% HCO) for the cases shown in Figure 1.
Processes 11 01733 g002
Figure 3. Effect of adding of FCC HCO (a); FCC LCO (b); FCC SLO (c); and FCCPT Diesel (d) to the three studied H-Oil VTBs on their total sediment existent (TSE) content.
Processes 11 01733 g003
Figure 4. Effect of adding of FCC LCO (a); FCC HCO (b); FCC SLO (c); and FCCPT Diesel (d) to the three studied H-Oil VTBs on their viscosities.
Processes 11 01733 g004
Figure 5. Dependence of H-Oil VTB (78% Urals/2.5% LSCO/19.5% Kirkuk) on temperature (a), and on the content of FCC HCO in the blend H-Oil VTB/FCC HCO (b).
Processes 11 01733 g005
Figure 6. Relationship between kinematic viscosity of the LNB H-Oil VR feedstock (70% VR blended with 30% FCC HCO) and the H-Oil VTB specific viscosity.
Processes 11 01733 g006
Figure 7. Molar excess volume for the mixtures H-Oil VTB/LCO (a), H-Oil VTB/HCO (b), H-Oil VTB/SLO (c), and H-Oil VTB/FCCPTD (d).
Processes 11 01733 g007
Figure 8. Agreement between estimated by Equations (3)–(5) and measured viscosity of the blends H-Oil VTB (78% Urals/2.5% LSCO/19.5% Kirkuk)/FCC HCO.
Processes 11 01733 g008
Table 1. Properties of crude oils under study.
Crude Origin UralsBasrah HLSCOKirkuk
Crude density at 15 °Ckg/m3877.0905.0854.0879.9
Crude sulphurwt.%1.533.860.572.88
Crude kin. viscosity at 40 °Cmm2/s12.637.210.811.8
Crude Sat.wt.%58.446.562.357.7
Crude Aro.wt.%35.238.731.434.2
Crude Res.wt.%2.65.13.12.2
Crude Asp(C7)wt.%3.89.73.26.0
Crude Asp(C5)wt.%6.314.86.38.1
IBP–180 °CTBP, wt.%15.015.720.020.9
180–240 °CTBP, wt.%8.77.89.19.0
240–360 °CTBP, wt.%21.017.723.119.5
360–550 °CTBP, wt.%30.325.929.624.5
>550 °CTBP, wt.%23.931.917.325.1
Table 2. Properties of vacuum residue (VR) fractions extracted from the crude oils under study.
UralsBasrah HeavySiberian LightRecycleKirkuk
VR density at 15 °Ckg/m3997.01071993.01035.910,540
VR Concarbon wt.%17.528.91423.525.2
VR sulphurwt.%3.07.11.581.155.9
Sat (LNB)wt.%25.612.325.0 15.2
Aro (LNB)wt.%52.554.161.1 55.4
Res (LNB)wt.%7.85.86.1 5.0
C7-asp (LNB)wt.%14.127.77.818.024.3
C5-asp (LNB)wt.%17.63715.525.733.1
Kin. vis. *mm2/s220.9731.9149.1 308
Soft. point, °Cwt.%40.168.628.938.958.1
Sat (SAR-AD)wt.%18.27.421.221.59.5
Aro 1 (SAR-AD)wt.%7.06.59.48.46.6
Aro 2 (SAR-AD)wt.%20.723.919.420.323.3
Aro 3 (SAR-AD)wt.%33.038.932.239.739.2
Resins (SAR-AD)wt.%14.013.413.44.210.2
CyC6 (SAR-AD)wt.%2.43.01.30.142.3
Toluene (SAR-AD)wt.%4.46.62.95.288.4
CH2Cl2 (SAR-AD)wt.%0.10.30.10.530.5
Total Asp (SAR-AD)wt.%6.99.94.45.9511.2
Note: * The kinematic viscosity is that of the blends 70%VR/30% FCC HCO at 80 °C.
Table 3. Operating conditions and product yields of the H-Oil hydrocracker during processing the three vacuum residue blends.
Date18 July 202229 August 20223 October 20225 May 2023
60% Urals/
40% LSCO
72.5% Urals/
14.1% LSCO/
13.4% BH
63% Urals/
31% LSCO/
6% BH
78% Urals/
2.5% LSCO/19.5% Kirkuk
WABT of 1st reactor, °C428430429430
WABT of 2nd reactor, °C428432431430
∆T 1st reactor77908095
∆T 2nd reactor40433451
Residence time, h5.475.35.127.96
VR in the H-Oil feed, wt.%72.981.867.176.5
VGO in the feed, wt.%13.144.614.91.7
Recycle, % of fresh feed00012.1
Gas yield, wt.%6.377.055.648.86
Naphtha yield, wt.%5.865.745.927.58
Diesel yield, wt.%35.4734.5337.0344.92
VGO yield, wt.%36.5134.0040.6030.07
VTB yield, wt.%15.8218.0210.618.70
H2S yield, wt.%1.932.882.153.10
Net conversion, wt.%76.077.876.5088.7
ATB, TSE, wt.%0.190.220.100.07
PBFO, TSP, wt.%0.090.070.090.03
Table 4. Properties of the FCC gas oils, FCCPT diesel, and H-Oil diesel used as cutter stocks in this study.
FCCPT DieselLCOHCOSLO
Density at 15 °C, kg/m3884.6935.010361112.1
Sulphur, wt.%0.05820.1740.7150.773
Simulated distillation, % mass ASTM D-2887
IBP180138202227
5237169257311
10267188275336
20302206295361
30323220306380
40338230319395
50349234328410
60359250342426
70369255354443
80378267368462
90391279391488
95402290410507
FBP430333452540
Kw11.710.359.889.65
Kinematic viscosity at 80 °C, mm2/s2.971.424.4233.35
MW, g/mole267162224294
Table 5. Properties of the H-Oil hydrocracked vacuum residues (VTB) obtained at the H-Oil unit during processing the three different crude oil blends.
H-Oil VTB Properties60% Urals/
40% LSCO
72.5% Urals/
14.1% LSCO/
13.4% BH
63% Urals/
31% LSCO/
6% BH
Density at 15 °C, kg/m31025.91046.91035.9
Sulfur, wt.%0.8971.5221.153
Concarbon content, wt.%20.726.923.5
Specific viscosity at 120 °C, °E24.046.529.8
Kinematic viscosity at 120 °C, mm2/s178345221
Kinematic viscosity at 80 °C, °mm2/s *217257722989
Softening point, °C34.945.738.9
C7 asphaltenes, wt.%16.127.618
C5 asphaltenes, wt.%22.632.225.7
MW, g/mole668663664
HTSD, wt.% (ASTM D-7169)
IBP 0.5473407349
10527514513
30570565566
50603598600
70643638638
90706697696
95761719715
FBP 99.5959774773
Recovery, %94.991.297.3
* Note: The kinematic viscosity at 80 °C was estimated by the use of modified Walther equation as reported in our recent research [30] with reference kinematic viscosity at 120 °C and slope of −3.664 determined for H-Oil VTB.
Table 6. Densities ρ, Molar Excess Volumes VE, Relative Changes in Volume ∆V, for the studied blends of H-Oil VTBs and the cutter stocks FCC LCO, HCO, SLO, and FCCPT diesel.
Mass
%
χ1ϕ1ρ
kg/m3
∆ρ
kg/m3
VE
cm3/mol
ΔVχ1ϕ1ρ
kg/m3
∆ρ
kg/m3
VE
cm3/mol
ΔV
LCO (1) + VTB (60% Urals/40% LSCO) (2)HCO (1) + VTB (60% Urals/40% LSCO) (2)
300.6370.320994.0−2.91.0270.00290.5600.3001.0278−1.10.4350.0079
400.7320.4220.98921.7−0.478−0.00170.6640.4001.028.9−1.10.3530.0069
500.8040.5230.98001.6−0.414−0.00160.7480.5001.030.2−0.80.2250.0056
SLO (1) + VTB (60% Urals/40% LSCO) (2)FCCPT Diesel (1) + VTB (60% Urals/40% LSCO) (2)
300.4920.2831.047.3−3.01.2840.00220.5160.332974.9−4.02.0650.0033
400.6010.3811.055.1−4.01.3900.00240.6240.436967.33.0−1.255−0.0023
500.6930.4801.058.7−9.03.0510.00540.7130.537954.85.0−1.922−0.0034
LCO (1) + VTB (63% Urals/31% LSCO/6% BH) (2)HCO (1) + VTB (63% Urals/31% LSCO/6% BH) (2)
200.5060.2171.0173.0−4.256−0.00290.4260.2001.034.2−2.0−2.8410.0017
300.6370.3221.008.55.0−3.971−0.00500.5600.3001.034.6−1.0−2.2480.0013
400.7320.4251.000.37.0−3.816−0.00720.6640.4001.035.1−1.0−1.8200.0009
500.8040.526991.89.0−3.586−0.00900.7480.5001.035.50.0−1.4450.0005
SLO (1) + VTB (63% Urals/31% LSCO/6% BH) (2)FCCPT Diesel (1) + VTB (63% Urals/31% LSCO/6% BH) (2)
200.3610.1891.047.8−2.0−2.8440.00200.3830.226999.5−2.0−2.6970.0018
300.4920.2851.053.4−4.0−1.3920.00310.5160.334987.82.0−4.112−0.0020
400.6010.3831.060.1−5.0−0.5910.00340.6240.438975.36.0−4.799−0.0043
500.6930.4821.067.2−5.0−0.0240.00340.7130.539962.99.0−5.287−0.0062
LCO (1) + VTB (72.5% Urals/14.1% LSCO/13.4% BH) (2)HCO (1) + VTB (72.5% Urals/14.1% LSCO/13.4% BH) (2)
300.6370.3241.015.45.0−6.300−0.00470.5600.3021.043.80.0−5.822−0.0002
400.7320.4271.006.67.0−5.678−0.00740.6640.4021.043.41.0−4.688−0.0008
500.8040.528995.78.0−4.618−0.00790.7480.5031.042.71.0−3.685−0.0012
SLO (1) + VTB (72.5% Urals/14.1% LSCO/13.4% BH) (2)FCCPT Diesel (1) + VTB (72.5% Urals/14.1% LSCO/13.4% BH) (2)
300.4920.2871.064.8−1.0−6.3120.00060.5160.337981.8−10.0−1.2590.0084
400.6010.3861.070.3−2.0−4.5760.00120.6240.441968.7−7.0−1.8800.0050
500.6930.4851.075.6−3.0−3.0150.00180.7130.542962.43.0−5.081−0.0025
Note: χ1 = molar fraction of the cutter stock; ϕ1 = volume fraction of the cutter stock; ρ = measured density of the mixture H-Oil VTB/cutter stock; ∆ρ = ρmeasured − ρregular; ρ r e g u l a r = 100 w t . % V T B ρ V T B + w t . % d i l ρ d i l .
Table 7. Required content of cutter stocks to reach the specified maximum viscosity of 110 mm2/s according to the fuel oil specification in the blends of the three studied H-Oil VTBs with the cutter stocks FCC LCO, HCO, SLO, and FCCPT diesel.
Amount of Cutter Stocks in Percent of the Blend H-Oil VTB/Cutter Stock Needed to Achieve Blend Viscosity of 110 mm2s
Cutter StockH-Oil VTB 60% Urals/40% LSCOH-Oil VTB 63% Urals/31% LSCO/6% BHH-Oil VTB 72.5% Urals/14.1% LSCO/13.4% BH
LCO21.222.826.1
HCO32.834.537.6
FCCPT28.530.633.6
SLO60.362.564.1
Table 8. μ values of ICrA evaluation of relations between the crude oil blend composition, sediment content, and the excess molar volume of the H-Oil VTB/cutter stock blends.
NuUrals, %LSCO, %BH, %LCO (TSE)HCO (TSE)SLO (TSE)FCCPTD (TSE)LCO (VE)HCO (VE)SLO (VE)FCCPTD (VE)
Urals, %1.000.001.000.330.670.330.670.000.000.000.33
LSCO, %0.001.000.000.670.330.330.001.001.001.000.67
BH, %1.000.001.000.330.670.330.670.000.000.000.33
LCO (TSE)0.330.670.331.000.000.000.000.670.670.670.33
HCO (TSE)0.670.330.670.001.000.670.670.330.330.330.67
SLO (TSE)0.330.330.330.000.671.000.330.330.330.330.67
FCCPTD (TSE)0.670.000.670.000.670.331.000.000.000.000.33
LCO (VE)0.001.000.000.670.330.330.001.001.001.000.67
HCO (VE)0.001.000.000.670.330.330.001.001.001.000.67
SLO (VE)0.001.000.000.670.330.330.001.001.001.000.67
FCCPTD (VE)0.330.670.330.330.670.670.330.670.670.671.00
Note: green color means statistically meaningful positive relation; red color implies statistically meaningful negative relation. The intensity of the color designates the strength of the relation. The higher the color intensity, the higher the strength of the relation. Yellow color denotes dissonance.
Table 9. υ values of ICrA evaluation of relations between the crude oil blend composition, sediment content, and the excess molar volume of the H-Oil VTB/cutter stock blends.
NuUrals, %LSCO, %BH, %LCO (TSE)HCO (TSE)SLO (TSE)FCCPTD (TSE)LCO (VE)HCO (VE)SLO (VE)FCCPTD (VE)
Urals, %0.001.000.000.670.330.330.001.001.001.000.67
LSCO, %1.000.001.000.330.670.330.670.000.000.000.33
BH, %0.001.000.000.670.330.330.001.001.001.000.67
LCO (TSE)0.670.330.670.001.000.670.670.330.330.330.67
HCO (TSE)0.330.670.331.000.000.000.000.670.670.670.33
SLO (TSE)0.330.330.330.670.000.000.000.330.330.330.00
FCCPTD (TSE)0.000.670.000.670.000.000.000.670.670.670.33
LCO (VE)1.000.001.000.330.670.330.670.000.000.000.33
HCO (VE)1.000.001.000.330.670.330.670.000.000.000.33
SLO (VE)1.000.001.000.330.670.330.670.000.000.000.33
FCCPTD (VE)0.670.330.670.670.330.000.330.330.330.330.00
Note: green color means statistically meaningful positive relation; red color implies statistically meaningful negative relation. The intensity of the color designates the strength of the relation. The higher the color intensity, the higher the strength of the relation. Yellow color denotes dissonance.
Disclaimer/Publisher’s Note: The statements, opinions and data contained in all publications are solely those of the individual author(s) and contributor(s) and not of MDPI and/or the editor(s). MDPI and/or the editor(s) disclaim responsibility for any injury to people or property resulting from any ideas, methods, instructions or products referred to in the content.

