Abstract
In order to improve the combined exploitation efficiency of horizontal and vertical wells, and given the fact that the complex and varied spatial structure of sand bodies in the Fuyu oil layer in the Qian’an area of Songliao Basin leads to significant differences in production characteristics of horizontal wells, the sand body types and internal spatial structure are finely dissected according to the theory of configuration analysis, and the internal spatial structure is divided into three configuration styles: spatial clipping type, overlapping type, and separation type. Then, by comparing the productivity characteristics of horizontal wells with different configurations of sand bodies, combined with the analysis of fluid flow law under horizontal well volume fracturing, a main fracture–fracture network–matrix coupled fluid flow model in a tight reservoir based on composite sand body configuration is established. Combined with the actual volume fracturing the horizontal well area, the productivity curves of each cluster in the horizontal section after numerical simulation of volume fracturing of typical horizontal well groups are extracted, which are divided into four types: high-yield stable type, high-yield two-stage type, high-yield rapid-decline type, and low-yield rapid-decline type, and the coupling relationship between the productivity characteristics of each cluster in the horizontal well volume fracturing and sand body configuration style is established, which provides a theoretical basis for the adjustment of different sand body development methods in subsequent oilfields.
1. Introduction
Tight oil is an important unconventional oil and gas resource and is a new hot spot for unconventional oil and gas exploration after shale oil and gas [1]. As an important part of tight oil and gas, tight sandstone oil and gas are developed in the deeper parts of the Ordos, Junggar, and Songliao Basins in China. Since tight oil has the characteristics of a large distribution area, poor reservoir physical properties, strong subhomogeneity, low resource abundance [2,3,4], and low straight-well capacity throughput, large and thick sand bodies are usually used as the development target layer [5,6,7,8,9], and horizontal well fracturing technology is used for tight oil and gas storage and upstream production [10,11,12]. In the past, quantitative and semiquantitative analysis and prediction methods were carried out from both static and dynamic directions for the evaluation of the horizontal well capacity [13,14]. The static capacity prediction method chooses a petrophysical parameter of the reservoir, such as effective porosity, effective thickness, and oil-bearing saturation, to establish the capacity evaluation plate. The prediction results are mostly qualitative to semiquantitative capacity classifications, such as dry formations, low-producing oil formations, and industrial oil formations [15]. The dynamic capacity prediction method includes the hydrodynamic equation of state based on the fluid flow mechanism (such as Darcy’s law) and uses the gray correlation algorithm, neural network algorithm, machine learning algorithm, and other algorithms to develop a horizontal well capacity dynamic evolution model; therefore, it can elucidate the horizontal well dynamic change trends [16,17,18] and increase the accuracy of the capacity prediction. There are also scholars who propose new methods through coupling the characteristic points and lines from a log–log plot of pressure and pressure-derivative data with the exact, analytical solution, resulting in simple equations to solve for the desired reservoir parameters [19]. However, these methods require a large number of parameters. Although scholars have previously performed geological influence factor analysis, the quantification processes are severely simplified, even assuming that the interior of a reservoir is homogeneous and has the same fluid flow characteristics, and they mainly discuss the influence of the matrix and fractures in the reservoir on the horizontal well capacity [20], and many studies on horizontal productivity characteristics mainly focus on petroleum engineering such as fluid flow [21,22,23,24]. In actual scenarios, tight oil, as a typical rocky oil and gas reservoir, is greatly influenced by the type of sand genesis and spatial combination style [25,26,27]. Moreover, the complex sand structure style inside the reservoir greatly affects the fracturing effect of the horizontal wells and the dynamic change process of the production [28]; thus, it is difficult to match the actual production conditions with the reservoir pore structure, physical properties, and oil content parameters alone. It can be seen that in the current research, many scholars focus on the influence of different reservoir parameters on the oil production capacity of horizontal wells, while ignoring the important role played by the complex structural characteristics of sand bodies in the process of reservoir exploitation.
In this study, taking the Qian’an area in the southern part of Songliao Basin as an example, we used core, seismic, and logging data to identify the subsurface reservoir sand body types, scales, distribution characteristics, and evolution patterns. Subsequently, Miall’s conformational grading theory was applied to analyze the conformational grades and characteristics of the sand bodies by the subgrade-by-grade fine dissection and establish the subsurface reservoir sand body conformational styles. Based on the results of the conformational dissection combined with the analysis of the fluid flow law of horizontal well volume fracturing, the horizontal well capacity characteristics of the sand bodies with different conformational styles were analyzed, and their capacity characteristics and dynamic attenuation changes were summarized. Moreover, the capacity curve characteristics of each cluster in different sections were combined with the numerical simulation of the horizontal well volume fracturing. The fracturing effect was analyzed, and a coupling model of the horizontal well volume fracturing and sand body conformational style was constructed, which is useful for subsequent works. This study provides a theoretical basis for the subsequent adjustment of oilfield development methods for different sand bodies.
2. Geological Characteristics of the Study Area
The southern part of the Songliao Basin straddles Jilin, Inner Mongolia, and Liaoning provinces and covers approximately half of the Songliao Basin (26 × 104 km2), including four tectonic units, namely, the Central Depressional Zone, Southeast Uplift Zone, Western Slope Zone, and Southwest Uplift Zone (Figure 1a,b). Among them, the Qian’an area is located in the southwest slope zone of the Songliao Basin. In terms of its tectonic composition, it belongs to the Qian’an back-slope structure of the Changling Depression in the Central Depressional Zone, and its interior is characterized by a nose-depression–nose-depression structure. Songliao Basin is a multi-cycle superimposed fault-depression basin developed in the late mesozoic, which has obvious dual structure characteristics. The basin is based on Carboniferous and Permian metamorphic rocks and granite, and the sedimentary cover is successively Jurassic, Cretaceous, Paleogene, Neogene, and Quaternary. The Jurassic system is distributed in nearly 20 fault depressions, mainly composed of continental coal-bearing pyroclastic rocks with a maximum thickness of more than 8000 m. The Cretaceous system covers the whole area and consists of continental clastic rocks with oil shale deposits, with a maximum thickness of about 6500 m. The Paleogene system and Neogene system are mainly distributed in the western part of the basin and consist of continental clastic rocks. The Quaternary system is distributed throughout the whole area (Figure 1c).
The Cretaceous is the main sedimentary strata in the depression period of Songliao Basin (Figure 1c and Figure 2), which can be divided into upper and lower series [29,30]. The Lower Cretaceous can be divided into Shahezi Formation (K1sh), Yingcheng Formation (K1y) into four stages (K1y1-4), Denglouku Formation (K1d) into four stages (K1d1-4), Quantou Formation (K1q) into four stages (K1q1-4). The Upper Cretaceous consists of Qingshankou Formation (K2qn) divided into three members (K2qn1-3), Yaojia Formation (K2y) divided into three members (K2y1-3), Nenjiang Formation (K2n) divided into five members (K2n1-5), Sifangtai Formation (K2s) and Mingshui Formation (K2m) divided into two members (K2m1-2). That is, the Cretaceous system is divided into 9 groups and 27 lithologic segments from bottom to top [31,32]. The Fuyu oil layer in the target interval of this study belongs to the Lower Cretaceous Quantou Formation 4 (hereinafter referred to as Quantou Formation 4) sedimentary strata, which was formed in the middle and late of a significant filling period in the early stage of the overall depression of Songliao Basin, that is, from the end of the deposition of Quantou Formation to the early stage of the water progradation cycle of Qingshankou Formation. The basin is dominated by river and delta sedimentary systems, lithology is gray green, gray powder, fine sandstone and purple red, brown red mudstone interlayer, the top is often gray green mudstone [33].
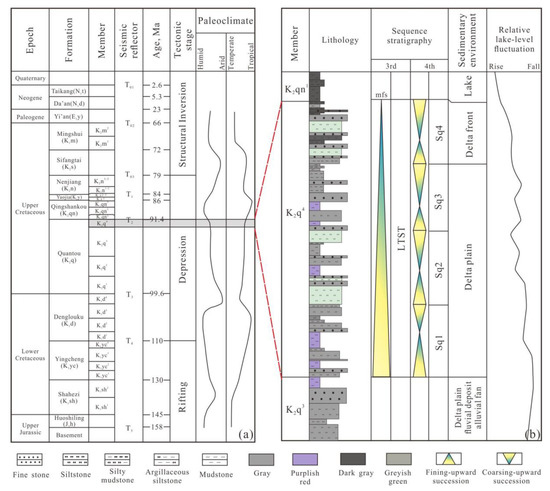
Figure 2.
(a) Stratigraphic units and paleoclimate changes in the Songliao Basin. (b) Detailed K2q4 stratigraphy in the Sanzhao depression showing the lithological succession, sequence stratigraphy, and sedimentary environments. Sq-4th order sequence.

Figure 1.
Tectonic position and comprehensive stratigraphic column map of the Qian’an target area in the southern part of the Songliao Basin [33,34]. (a) Location map of the Sanzhao depression and tectonic units of the Songliao Basin. The black line (AA′) shows the location of the stratigraphic profile (c) of the Songliao Basin. (b) Study area distribution location. (c) Stratigraphic section across the central part of the Songliao Basin showing the basin structure and distribution of K2q4.

Based on the vertical changes of lithological sequence and lake level, K2q4 is considered to be a lake intrusion system domain (LTST) within a tertiary sequence (Figure 2a). The sequence structure of the study area is similar to this result, which shows the rising semi-rotation characteristics of the datum gradually deepening of the lake. The bottom interface is the transition point where the datum descends to the ascent, which is manifested as the erosion erosion surface formed by the complex downcut of the diversion channel, but the bottom interface features have certain plane differences, and the characteristics of the erosion surface of the river channel are alternating with overflow sediments such as red mudstone and siltstone. On the top surface, due to the rise of lake level, flood mudstones are widely developed, the most typical of which are three sets of black oil shale developed at the top of K2q4, which are the products of the maximum flood period in the Songliao Basin. Its interior can be further subdivided into four four-level sequences (Sq1–Sq4) according to the sedimentary evolution characteristics (Figure 2b).
3. Materials and Methods
3.1. Materials
Based on data from 253 vertical wells and 28 horizontal wells, all the wells have a basic suite of well logs (gamma-ray, deep/shallow lateral resistivity logging (RLLD/RLLS), and acoustic logging (AC)). Some of them also have microresistivity (MSFL) and density (DEN), which were used as auxiliary data, and complete production characteristics were also included, as well as horizontal well volumetric fracturing parameters, such as total fluid volume, fracture width, fracture half-length, fracture height, and fracture main strike, obtained through microseismic monitoring. These data provide strong support for the study of composite sand bodies and the characterization of horizontal well fractures.
3.2. Methods
In this study, the genetic types and structural styles of sand bodies were divided through the detailed description and analysis of cores from three core wells, to obtain the combination mode of composite sand bodies. At the same time, combined with the characteristics of logging curves, the plane extension was carried out to obtain the macroscopic law of the spatial structure of sand bodies in the whole area.
In the analysis of productivity characteristics, this study mainly used petrel modeling software to establish sedimentary facies models, porosity models, permeability models, and saturation models based on the analysis results of composite sand bodies by sequential Gaussian simulation algorithms. In the subsequent work, three-dimensional geological models were embedded through CMG numerical simulation software. The fracture parameters (such as fracture width, fracture height, and fracture length) of horizontal wells were input in the numerical simulation software to realize the characterization of fracture parameters. The reservoir numerical simulation was carried out based on this model, and the productivity difference characteristics of horizontal wells in tight reservoirs under the control of composite sand body structure characteristics were evaluated by combining the actual production data and numerical simulation results.
4. Spatial Structure Analysis of a Composite Sand Body
Based on the sedimentary interface delineation criteria for the sand body configuration units proposed by A.D. Maill in 1996 [35], the main drilling encounter target layer in the horizontal wells of the study area is a composite sand body of five levels and a single sand body of four levels. Composite sand bodies are complexes formed by the superposition of different contemporaneous and orogenic single sand bodies in a certain spatial range [36,37,38,39,40,41,42]. The single sand bodies formed under different depositional conditions in the Fuyu oil formation have different geneses, lithologies, and structural and tectonic characteristics, resulting in large variabilities in the internal structure of composite sand bodies. Clarifying the genesis type of a single sand body and determining its characteristics and distribution pattern are prerequisites for dissecting its internal spatial structure [43,44,45].
4.1. Spatial Structure Analysis of a Composite Sand Body
The core data from 24 core wells in the study area were analyzed to determine the typical sedimentary characteristics of the study area based on various indicators, such as mudstone color, rock type, and characteristic minerals, and to study the sedimentary microphase by combining the logging response patterns. The composite sand genesis of the Fuyu oil formation mainly includes divergent channels in the deltaic plain phase, overflowing bank thin sand and divergent submarine channels in the deltaic foreland subphase, and mat-like sand. In addition, different internal lithology and sedimentary rhythm features are noted.
In addition to the small number of thin layers of the distributary channel, overflow bank sand, and natural dike sand bodies, significant terrestrial sedimentary features, such as purple-red mudstone and unidirectional water flow lamination, are identified during the deposition period of the delta plain and mainly developed divergent river channel sand bodies. Among them, the diversion channel is the largest, with the strongest water power, and most abundant source supply for the delta plain sedimentation. The sediments in the main part of the channel are coarse-grained, dominated by gray and purple-gray fine sandstones with homogeneous rhyolite and abrupt contact at the top and bottom, and exhibit a high amplitude box type on the logs (Figure 3a). Because of the weakened water flow energy, the sides are fine-grained, mainly gray fine sandstone and siltstone, transitioning upward to purple-gray muddy siltstone and siltstone mudstone. The vertical direction shows a positive rhythm, the bottom stagnant sedimentary development is in abrupt contact with the lower part, the upper part is mostly gradual, and the logging curve is characterized by a medium-high amplitude dentate bell shape (Figure 3b). The laminae are mainly trough and plate interlaced laminae, with the presence of local block and parallel laminae. The vertical sand body is continuous, and a muddy interlayer is rarely observed, indicating a strong hydrodynamic depositional environment near the material source. In this period, the river channel deposition is dominant, and only thin sand bodies formed by the river water overflowing out of the riverbed during the flooding period are scattered outside the river channel, mainly including the overflowing bank sand and natural dike sand bodies scattered on both sides of the river channel. The lithology is mostly purple-gray siltstone and muddy siltstone with blocky and undulating laminations, and the overflowing bank sand has a mostly obscure positive rhythm, whereas the natural dike can be observed with obvious anti-rhythm. The logging response exhibits a medium–low-amplitude funnel or finger-like feature (Figure 3c).
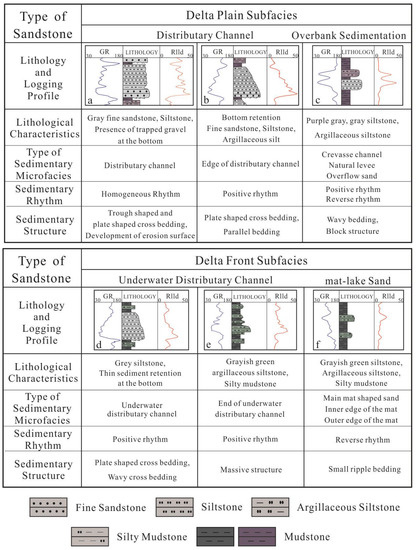
Figure 3.
Typical logging phase pattern in the study area. (a–c) Typical sedimentary phase characteristics and logging patterns in the deltaic plain, where (a,b) are the most common phase types in the deltaic plain. The natural gamma curve is a typical box- or bell-shaped, medium thick layer, with high amplitude abrupt changes at the bottom and gradual abrupt changes at the top, with micro tooth characteristics and lower amplitude values, with a minimum of about 70API and mostly around 90API; they exhibit different intensities of the water flow and magnitude of sand transport between them. (d–f) Typical sedimentary phase characteristics and logging patterns in the deltaic plain, where (d) is a common submerged divergent channel microphase, which most of the sediments are. The natural gamma curve has a high amplitude mutation at the bottom and a gradual mutation at the top, and (e) is only developed at the forefront of the delta and is dominated by muddy deposits. (f) Most typical anti-rhyolitic feature in the deltaic foreland subphase with a mat-like sand deposit, low amplitude difference, and single finger or finger-like interlayer in natural gamma curve. (GR: natural gamma ray; Rlld: deep lateral resistivity).
The delta front sedimentary sand body has unique submerged sedimentary characteristics and is influenced by the lake modification effect, which is different from the water plain sedimentary sand body, and the main sand body types are the submerged diversion channel and mat sand. Underwater diversion channels can be further divided into underwater diversion channels and end-of-channel sand bodies according to the development location. The submarine divergent channel sand body is widely deposited in the front edge of the delta, mainly by fluvial action, and has small-scale, fine lithology, is mainly siltstone, and the vertical direction shows positive rhythm, the bottom stagnant deposition is thin, showing the characteristics of abrupt change at the bottom and gradual change at the top, and the logs show a medium-high amplitude bell shape. The main body can be seen as a plate-like interlayer and wave-like interlayer, and upward can be seen as blocky laminations and parallel laminations, and the top mostly transitions to matted sand or interfluvial mudstone, indicating the process of gradual hydrodynamic weakening (Figure 3d). In the end part of the river extending toward the center of the lake basin, due to the insufficient supply of material sources, the river sand body decreases in size and is mostly gray-green muddy siltstone and siltstone with a positive rhythm in the vertical direction, and small wave-like interlayers and blocky laminations are common in the interior, and the development of muddy bands indicates the transient sedimentation interruption caused by the fluctuation of the lake level. The logging curves show severe dentition and a low amplitude bell shape (Figure 3e). Unlike the delta plain sedimentary environment, the sand genesis type is significantly increased in the delta front sedimentary environment, and the mat lake sand is abnormally developed, which is due to the river-carried sediment being top-supported by the lake water, and face diffusion unloading occurs with weakened energy to form the river-controlled mat-lake sand body, and this mat-lake sand is often accompanied with the river sand body, and distributed in a continuous wide band on both sides of the river sand body. Most of the mat-lake sands are dominated by siltstone and muddy siltstone, with small, corrugated laminae and anti-rhythmic features, and the logging response shows a low amplitude finger shape with an abrupt change at the top and bottom. The mat-lake sand can be further divided into mat-lake sand main body, mat inner margin, mat outer margin, etc., according to the grain size, and is often distinguished from the plain overflow sand by the characteristic sedimentary markers or sedimentary phase zone combination (Figure 3f).
4.2. Structural Style of the Composite Sand Body
Combined with the modern sedimentary evolution model [46,47], we used the data from a dense well network and horizontal wells in the development area for the establishment of a “vertical well–horizontal well sand body deposition characteristic response relationship”. Moreover, we developed a joint straight well–horizontal well information profile and used various methods, such as the elevation difference of neighboring wells, the thickness of the sand body, internal lithology, and variations of rock-electric characteristics, to circle the planar and longitudinal development range of the river sand body. According to the characteristics of the horizontal wells crossing the sand body, the single sand body, and especially the single-phase river sand body boundary, was determined. In the sparse-well network area, the composite sand body identification method of sand thickness–sand ratio linkage was used; that is, at the single well, the river deposition pattern combined with the sand thickness contour was used to determine the location of the composite sand body where the river sand body development was determined. The spatial distribution characteristics of single sand bodies in different subphases of the study area were restored (Figure 4), and the contact relationships of single sand bodies in the study area were mainly determined to include the three vertical stacking styles and three planar combination styles.
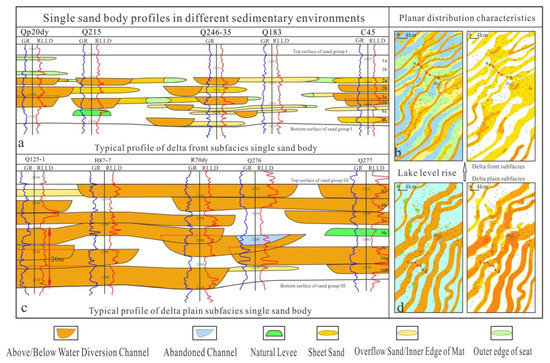
Figure 4.
Characteristics of the single sand body vertical and planar distribution in the Qian’an area of the study area. (a) Typical single sand body vertical distribution characteristics of the upper delta front environment in the Qian’an area of the Fuyu oil formation: more sand body genesis types and muddy interlayer development. (b) Sedimentary phase plane distribution map and sandstone thickness plane map of the delta front environment: sand body with thin facies characteristics, small thickness, large planar distribution area. (c) Typical single sand body vertical distribution characteristics of the lower delta plain environment in the Fuyu oil formation. (d) Plan view of the sedimentary phase distribution and sandstone thickness in the deltaic plain environment: strip-like distribution characteristics with large thickness in a single phase. (GR: natural gamma ray; Rlld: deep lateral resistivity).
4.2.1. Composite Sand Body Vertical Stacking Style
The vertical contact relationship of the composite sand body is mainly due to the ability of the bottom of the channel sand body to cut downward at two different periods vertically. The compound sand body vertical stacking relationship in the Fuyu oil layer is divided into three types, namely, cut-and-stack, superimposed, and separated types (Figure 5).
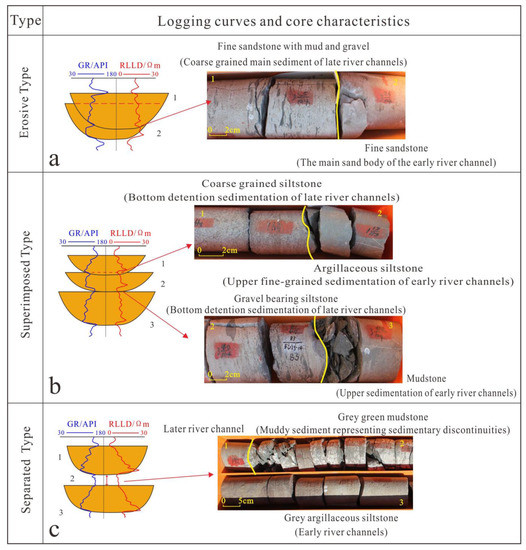
Figure 5.
Vertical stacking style of the composite sand bodies in the study area. (a) Cut-and-stack type: the later stage has a strong ability to cut down the river channel, erode the upper layer of the river channel in the early stage, and connect it with the main body. (b) Superimposed type: the later stage of the river has the weak ability to cut-and-stack, and sedimentary discontinuity, which is vertically connected to the upper layer of the early river sedimentation, was not noted. (c) Separated type: the river channel has weak or even no downward cutting ability, there are sedimentary discontinuities between different stages of the river channel, and fine-grained muddy sediment is preserved to form a barrier layer. (GR: natural gamma ray; Rlld: deep lateral resistivity).
- Cut-and-stack type: The superposition of multiple-phase channels occurs due to undercutting. The late-phase channel shears the top layer of the early channel, and the upper and lower heterogeneous channel bodies are connected to form a thick sand body, resulting in the internal development of a mud- and gravel-rich scour surface. The logging response shows an obvious return with composite box- or bell-shaped characteristics with few internal muddy inclusions and good physical properties of the sand body, which was mostly observed in the deltaic plain deposition period in the study area.
- Superimposed type: The river undercutting is insufficient, and the top layer of the early river deposition did not cause obvious scouring erosion. The fine-grained deposition noted between different time periods of the river can be identified in the logging curve as a large return, which constitutes a step box or bell-type combination. The lithology of the composite sand body connection is variable from siltstone mudstone to mudstone, which forms vertical high-resistance connections or even disconnections that are mainly distributed in the deltaic foreland deposits.
- Separated type: The single-phase river sand body exhibits a complete vertical deposition sequence with a thicker mud interlayer between the upper and lower layers from different time periods of a certain distribution range, indicating the interrupted complete deposition. The logging curves are independent and complete in box or bell shapes, and the upper and lower sand bodies are not connected vertically, which is mostly seen in the transition area of the delta plain to the front edge of the study area.
4.2.2. Composite Sand Body Planar Combination Style
In the process of “formation → development → lateral erosion → abandonment”, the river sand body will form a complex lateral shear superposition relationship with other orogenic sand bodies in the plane. Using the changes in formation thickness, sedimentary phase change law, and logging curve response lateral combination relationship, the composite sand body planar combination in the study area is divided into the following three types (Figure 6).
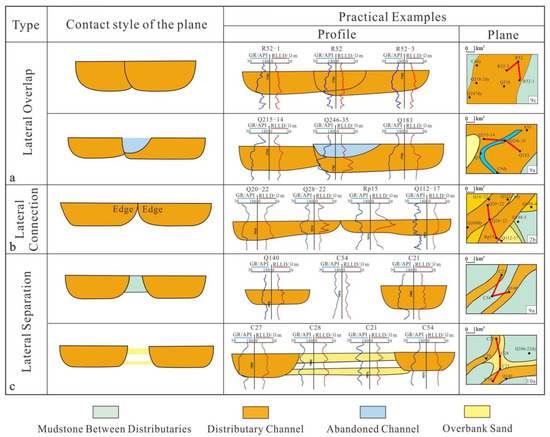
Figure 6.
Composite sand body plan combination style in the study area. (a) Lateral cut type: lateral erosion of the river cuts into the adjacent river, including the direct and abandoned-river contact. (b) Lateral connection type: the river is connected to the side of the river, and there is no erosion cutting. (c) Separation type: overflow bank deposition is noted between the rivers, and the overflow bank deposition type includes thin sand, natural dike, and interdiversion mudstone. (GR: natural gamma ray; Rlld: deep lateral resistivity).
- Lateral cut type: The river sand bodies at different locations on the plane are connected with the surrounding sand bodies due to cutting erosion by lateral oscillation migration, forming a planar continuous composite sand body. The difference in elevation of the adjacent wells, changes in lithology, structure, and tectonic characteristics of the sand body, combined with the internal single well sand body of the composite sand body vertical tangential stack characteristics which can be used to distinguish it. The lateral connectivity of this type of sand body log is good, and it is mostly developed in the deltaic plain deposits of the study area.
- Lateral connection type: The planar distributions concurrently diverging river sand bodies are laterally diverted to meet during the course of travel, without erosion, showing a side lap and weakly connected contact characteristics. Among them, the thickness of the single sand body of two phases gradually thins in the middle direction, and the obvious river channel side features can be identified in the response of the central well logging curve, which are developed in different depositional periods in the study area and do not show obvious features of sedimentary environmental differentiation.
- Separation type: The sand bodies of the river channels are separated from each other in planes and are not in direct contact laterally. Due to the diversity of sedimentary sand types between rivers, there are many different ways of separation between abandoned rivers, thin sand of overflowing banks, mat-like sand, and even mud between diversions. Its connectivity is mainly determined by the nature of the sand body that communicates between the two, such as mud deposits that are mostly disconnected show, and the rest are mostly weakly connected contacts. The deltaic foreland sedimentary mat-like sand is exceptionally developed, and so this type mostly appears in the deltaic foreland sedimentary period of the I sand group in the study area.
5. Structural Control Factors and Evolutionary Characteristics of Composite Sand Bodies
Combined with the characteristics of composite sand bodies and combination styles in the study area, the proportion and development scale of the diversion channel sand body gradually decreases from the delta plain to the front edge of the delta, and the channel plane morphology transforms from a wide sand belt to a reticulated narrow belt. As the development scale of the channel sand body gradually decreases, the proportion of the sand body deposited and preserved outside the channel gradually increases. In addition, the abundance of mat-like sand increases to the front edge of the deposition period, and the composite sand body transforms from single-formation superposition to multiformation combination transformation. The spatial combination style from bottom to top and the planar contact relationship changes as follows: lateral cutting → lateral connection → separation. As the process progresses upward, the channel cutting and stacking ability decreases, the thickness of the sand body gradually decreases, the grain size becomes finer, and the transition from cut-and-stack type to stacking and separation types continues. This evolution process is attributed to the internal structure of the composite sand body, which is mainly influenced by the sedimentation hydrodynamics, material supply, and other river energy elements, i.e., capacitated space growth rate A and sediment supply flux S (Figure 7).
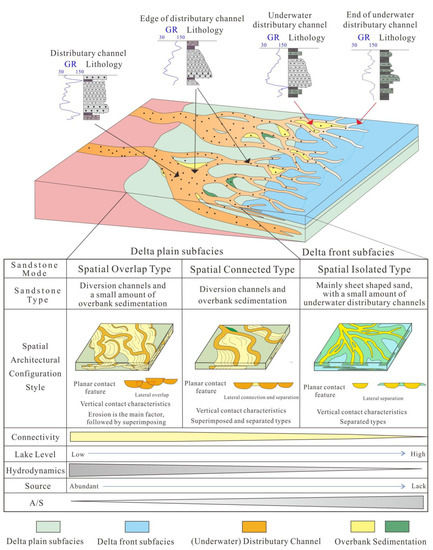
Figure 7.
Illustration of the structural evolution pattern of the composite sand body of the Fuyu oil formation under the control of multiple factors. From the bottom to the top of the study area, the base level gradually rises, A/S gradually increases, the type of sand body genesis increases, and the scale of the single-phase river layer decreases. Moreover, the spatial configuration pattern changes from spatial cut-and-stack to spatial lap and, finally, to spatial isolation. This gradually deteriorates the connectivity. The spatial configuration pattern changes from spatially cut-and-stacked to spatially lapped and, finally, to spatially isolated, which gradually deteriorates the connectivity and strengthens the inhomogeneity. (GR: natural gamma ray).
The reason for this evolutionary process is that the internal structural characteristics of the composite sand body are mainly influenced by the sedimentary hydrodynamics, material supply, and other fluvial energy elements, i.e., the capacitated spatial growth rate A and the sediment supply flux S (hereinafter referred to as A/S ratio). The Fuyu oil layer follows a continuous process of water advancement from the bottom to the top, an increase in the base level, a weakening of the river energy, a gradual increase in A/S, and gradual transition of the depositional environment from the delta plain to the front edge of the delta. In the early stage of deposition, the typical high-energy deltaic plain depositional environment is developed, and A/S is extremely low. The thickness of the stratigraphic deposits exceeds the accommodating space with slope limitations on both sides. Moreover, extremely strong river channel undercutting ability is noted in the limited space owing to the frequent mutual cutting. The scouring and superposition of layers from different periods in the final formation of multiple river bodies are superimposed on each other, resulting in a composite sand body with the spatial overlap type. Subsequently, the datum surface continues to rise, A/S gradually increases, the channel undercutting and lateral migration ability are weakened, and the dual structure of the channel is preserved. More obvious depositional interruptions in the layers from different time periods are noted in the channel for spatially surrounding the channels to form a plane for lateral cutting, lateral connection, and vertical superposition of the contact relationship, resulting in a spatial lap type composite sand body. In the later stage, A/S is higher, and the submerged diversion channel is less curved, smaller, and often isolated in the thin mat-lake sand deposition, thereby forming a large distribution area, multiple genetic types of the sand, and thin-mud interlayer characteristics.
6. Production Capacity Differences under the Structural Characteristics of Composite Sand Bodies
During production and development, the structural characteristics of the sand body directly affect the production capacity, whereas the dense sandstone reservoir is characterized by poor reservoir properties, diverse structural characteristics of the composite sand body, and strong inhomogeneity. Based on the combination model of the composite sand body investigated in the previous paper, this paper considered an actual horizontal well volume fracturing block as an example. The capacity of the horizontal well sections and clusters under the control of the composite sand body based on the fluid flow law of horizontal well volume fracturing were analyzed.
6.1. Analysis of the Fluid Flow Law of Horizontal Well Volume Fracturing
Due to the poor physical properties of the reservoir and the diverse and heterogeneous structural characteristics of the sand body, horizontal wells need to be fractured in sections to obtain a higher production capacity and well-controlled reserves after completion [48,49]. After the horizontal wells are fractured in sections, in addition to the complex structural characteristics of the sand body, a composite reservoir consisting of a high-permeability fracture transformation zone in the near-well area and a dense unmodified zone in the far-well area is formed [50]. The several typical flow states experienced by the fractured horizontal wells from production start-up to the gradual stabilization at the later stages can be seen in Figure 8. In the early stage of production, the formation fluid in contact with the fracture face starts to supply oil to the fracture and flows into the wellbore along the fracture with an overall bilinear flow. As the flow in the fracture reaches the proposed steady state, the pressure decreases in all parts of the fracture with the same magnitude, and the fluid in the formation steadily supplies oil to the fracture, showing a formation linear flow. As the range of pressure continues to increase, the single fracture enters the proposed radial flow stage without any interference between the fractures (Fn is the number of fractures). When the interference between the fractures increases, the overall production characteristics of the fracture spacing achieve the proposed steady state and enter the second linear flow stage. As the pressure incidence range continues to increase, the overall flow pattern of the horizontal well is similar to the single wide fracture, i.e., the second radial flow stage, and the fractured horizontal well reaches a relatively steady state. During the middle and late stages of production, the drainage range reaches the well control flow boundary and enters the final proposed steady state stage, where the corresponding production decline rate of the well gradually slows down [51]. However, due to the different types of composite sand structures in horizontal wells, the degree of connectivity of composite sand within the control area of each cluster fracture network is different after the horizontal wells are volumetrically fractured, which leads to the difference in production curves in the production process of horizontal wells with different types of composite sand bodies.
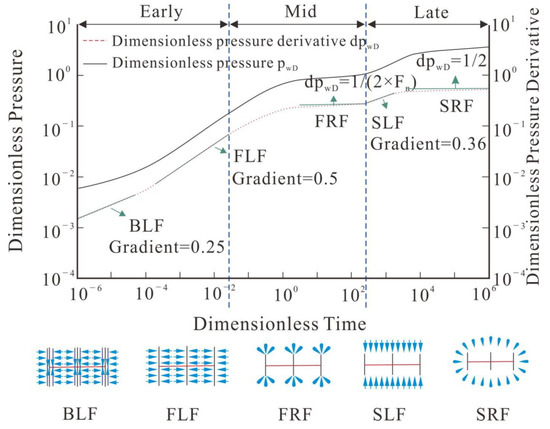
Figure 8.
Multistage fractured horizontal well dimensionless pressure and pressure-derivative curve.
6.2. Analysis of the Production Dynamics of the Horizontal Well Section Controlled by the Composite Sand Body
To further investigate the production characteristics of the horizontal wells after volume fracturing controlled by the composite sand bodies with different spatial structure styles, a typical horizontal well group area within the study area was selected for the study (Figure 9). Five horizontal wells were mainly supplemented within the area, and the typical well area was established through horizontal well sand body fine delineation, horizontal well formation correction, river boundary fine delineation, three-dimensional (3D) geological modeling technology, and horizontal well volume fracturing grid representation technology based on microseismic detection results. In the 3D numerical simulation model of a typical well area, the main fracture network vertical control layers are 7–10 small layers, the fracture half-length ranges from 150 to 230 m, and the fracture width ranges from 0.002 to 0.100 m. The numerical simulation results match well with the actual production characteristics.
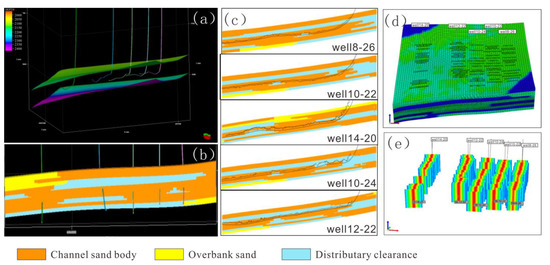
Figure 9.
Numerical simulation model for fracturing horizontal wells and the actual horizontal well volume. (a) Three-dimensional spatial distribution location map of the typical horizontal well group. (b) Sedimentary phase model section in the vertical direction of the typical horizontal well group. (c) Sedimentary phase model section along the trajectory direction of each horizontal well of the typical horizontal well group. (d) The number of the grid of numerical simulation model of the typical horizontal well group is 950,000. (e) A spatial distribution map of seam network of typical horizontal well group.
The production characteristic curves and numerical simulation results of the five horizontal wells in a typical horizontal well area were comprehensively analyzed. For a single well, a logistic function is obtained with a similar shape to the water content curve, which is a growth curve. The logistic function can be used in the study of the water content rise law to determine the details of the water content change as follows (Equation (1)):
where fw is the water content, a is the empirical constant, b and c are fitting coefficients, and t is the time.
During oilfield water injection, the trend of the oilfield water content and its corresponding related parameters are similar to this mathematical model. According to the experience during oilfield development, the water content eventually converges to an empirical constant (limiting water content), i.e., when t→∞, fw→1, a = 1. After the equation changes, we can obtain (Equation (2)):
Using the production data to plot the semilogarithmic relationship between the water content and time, the values of parameters b and c were determined. Moreover, the number of straight-line segments of the curve and the form of the fitted curve were obtained based on the linear fit. The first-order derivative of the water content formula (Equation (3)) is:
The equation for the second-order derivative of the water content (Equation (4)):
When the second derivative curve of the water content appears as a half group or a group of curve fluctuations, the overall capacity of the horizontal section slightly varies, and the water content rapidly increases as the oil saturation around the well decreases. From the dynamic characteristic curve, the horizontal section water content curve has two stable characteristics and one periodic characteristic. The two stable characteristics refer to the two relatively stable sections in the water content curve of the horizontal wells, namely, the water-free oil recovery stage and the high water content stage. The one periodic characteristic indicates a set of obvious curve fluctuation characteristics in the second derivative curve of the water content, which corresponds to the stage of water production of horizontal wells (Figure 10). These horizontal wells are located in reservoirs with good reservoir properties and continuity and small lateral variation amplitude and are mostly spatially cut-and-stack type composite sands, such as well 8–26 and well 10–22.
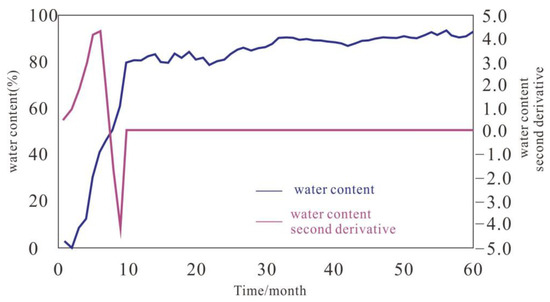
Figure 10.
Water content second derivative curve with two stable characteristics and one periodic characteristic.
When the second derivative curve of water content appears, two groups of curve fluctuation characteristics are observed. The pattern of water production starting from a horizontal well is as follows: when water is initially seen in the well, the space-cut stack section of the composite sand body first starts producing water, whereas the spatially connected type or space separation section is not producing water. As the well water content increases, the water content ratio in the space-cut stack section of the composite sand body gradually increases until the water content of the well is high, and the reservoir of this section is the main water-producing layer. The dynamic characteristics of the horizontal wells have three stable and two periodic characteristics. The three stable characteristics refer to the three relatively stable sections in the water content curve of the horizontal wells, namely, the water-free oil recovery, medium-water-content and high-water-content stages. The two periodic characteristics are the two sets of obvious curve fluctuations in the second derivative curve of the water content, which correspond to the water production stage of the horizontal wells (Figure 11). This type of horizontal well is located in areas where lateral variations of the reservoir exists. From the horizontal section permeability distribution characteristics, more obvious differences in the composite sand spatial combination types are noted, such as that of well 14–20, well 10–22, and well 12–22.
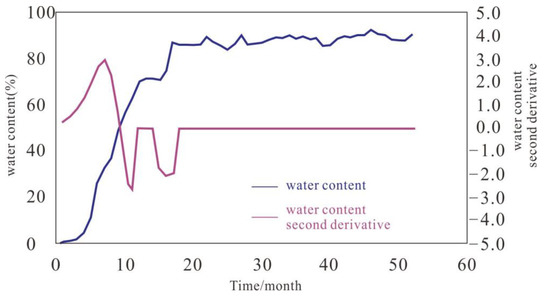
Figure 11.
Second derivative curve of the water content with three stable and two periodic characteristics.
6.3. Analysis of the Production Dynamics of Each Cluster in the Horizontal Well Section Controlled by the Composite Sand Body
Based on the overall production capacity of the horizontal section of horizontal wells, the difference in the production capacity of each cluster after the volume fracturing of horizontal wells was further investigated because the horizontal wells exhibit hydraulic fracturing in the vertical direction with the horizontal section injection position as the reference point. This leads to the vertical stacking of the composite sand body as the main factor affecting the different production capacities of each cluster in the horizontal section because of the formation fluid flows. As the formation fluid flows from the matrix zone into the fracture reformation zone under the action of the formation pressure energy, into the main fracture zone, and finally converges into the wellbore, where the degree of communication of the sand body under the matrix zone is weak, the sand body connectivity is higher within the weak reformation zone, and the flow capacity of the dense sandstone in the strong reformation zone is extremely strong (Figure 12a). Moreover, the integrated establishment of the main fracture–fracture network based on the dense reservoir is controlled by the structure type of the composite sand body. When horizontal wells are drilled and different types of composite sand bodies are encountered, each single sand body is located in different parts owing to their different vertical contact characteristics. For example, the cut-and-stack composite sand body and a small part of the stacked composite sand body are mainly located in the main fracture of the strongly reformed zone, and the remaining part is located in the fracture network of the weakly reformed zone. The separated composite sand bodies, mostly located in the matrix area, have very weak connectivity (Figure 12b).
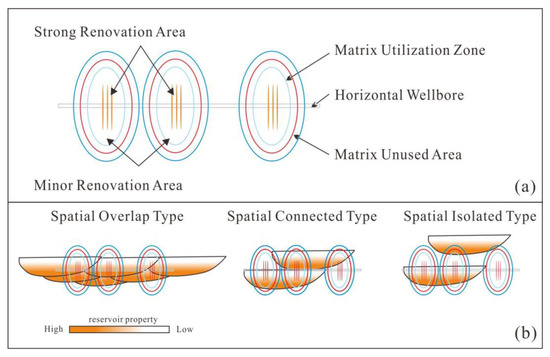
Figure 12.
Multizone coupled fluid flow model for volume fracturing of horizontal wells in composite sand bodies. (a) Schematic diagram of fluid flow capacity analysis at various parts of horizontal Wells during volumetric fracturing. (b) The combination relationship between fracture parts and composite sand body patterns in horizontal well volumetric fracturing.
The sand body analysis results and numerical simulation results of the typical volume fractured horizontal well areas in the study area were combined for further analysis (Figure 13). Different composite sand body types are encountered by the drilling of the horizontal well sections drilled. Moreover, a total of 75 fractures were made in various parts of the horizontal well sections during the production development, and the composite sand body controlled by each cluster has different types. In the production characteristic curve, the change in the oil production of each cluster in the horizontal well section can effectively reflect the communication ability of the vertical composite sand body. The oil production curve (Figure 14) can be divided into four main types: high-oil-production smooth type, high-oil-production two-stage type, high-oil-production rapid-decline type, and low-oil-production rapid-decline type.
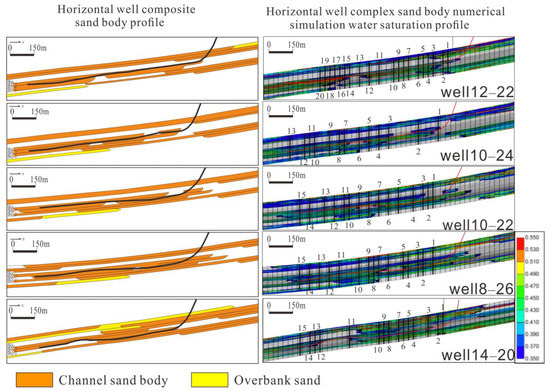
Figure 13.
Typical volume fracturing of the horizontal well zone sand profile and numerical simulation results. (The numbers in the water saturation profile represent the fracture sequence number of the horizontal section of the well.).
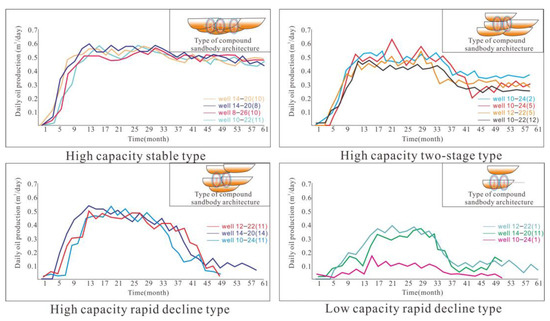
Figure 14.
Characteristic curve analysis of the single cluster capacity in the horizontal well section of volumetric fracturing.
Among them, the high-oil-production smooth type represents the stable oil production capacity of the horizontal section of the horizontal well. The horizontal section of the daily oil production curve with this characteristic is mostly located in the middle part of the stacked composite sand body with multiple sets of single-phase sand bodies cut and stacked in the vertical direction. Multiple sets of sand bodies are located within the control range of the main fracture, and the production capacity rises rapidly after fracturing. Because of the effective communication of multiple vertical sets of sand bodies, the oil production curve is relatively stable and does not easily decline, such as that of wells 14–20 (8), 14–20 (10), 8–26 (10), and 10–20 (11), which have a high initial production capacity due to the presence of one or more sets of sands located in the main fracture zone. However, the capacity gradually decreases during the subsequent recovery process when the sands controlled by the seam network area provide energy, thereby maintaining the daily oil production capacity at a relatively moderate phase, such as for wells 10–24 (2), 10–24 (5), 12–22 (5), and 10–22 (12). The high production rapidly declined in the horizontal section. This cluster has high initial production capacity characteristics because of the horizontal well drilling encountering a thicker set of composite sand bodies. When the oil saturation in this set of cut-and-stack composite sand body is low, the subsequent oil supply is insufficient because the upper and lower sand body is far from the main fracture and seam network area, which rapidly decreases the daily oil production, such as the case for wells 12–22 (11), 14–20 (14), and 10–24 (11). When the oil saturation of the single-phase isolated sand body is low, the daily oil production rapidly decreases because there is no subsequent energy supply in the seam network and matrix areas, such is the case for wells 12–22 (1), 14–20 (1), and 10–24 (1).
By establishing the structural characteristics of the composite sand body and main fracture–seam network–matrix coupled fluid flow model and the characteristics of the production curve, the production trend of horizontal wells can be predicted for targeted production adjustment measures to promote production development.
7. Conclusions
- (1)
- The composite sand body is a complex formed by the superposition of different contemporaneous and orogenic single sand bodies in a certain spatial range. The study area mainly includes six genetic types of single sand bodies, including the main channel of the delta plain, secondary channel, overflowing bank thin sand and submerged diversion channel, end of the submerged diversion channel, and mat-like sand at the front edge of the delta. The composite sand bodies of different genetic types show the characteristics of a large plain with a single genesis and thin thickness of the leading edge with rich genetic types.
- (2)
- Based on the distribution rules of the different geneses of the single sand bodies inside the composite sand body in the study area, the internal structure of the composite sand body is divided into three types of vertical stacking styles (cut-and-stacked, superimposed, and separated) and three types of planar combination styles (side-cut, side-joined, and separated).
- (3)
- The genesis and internal structure of the composite sand body significantly differ based on the depositional periods due to the combined effects of sedimentation hydrodynamics, material supply, river energy, and A/S. Three kinds of composite sand body spatial structure styles are noted: (1) in the high-energy delta plain depositional environment (A/S << 1) with strong river hydrodynamics and large sand carrying capacity, the sand body, referred to as large composite sand body, is formed by a single type of genesis, large vertical thickness, wide planar range, and spatial cutting and stacking due to the river undercutting and lateral erosion; (2) in the medium- to low-energy delta plain depositional environment (A/S ≤ 1) where the base level continues to rise and the sediment supply rate decreases, the spatial lap composite sand body is formed by the weakened undercutting ability of the river sand body; and (3) in the depositional environment (A/S > 1), that is, the front edge of the delta where the horizontal surface rises to submerge the main river, the sand bodies of different genetic types are spatially combined to form spatially separated composite sand bodies under the influence of the top-supporting effect of lake water.
- (4)
- By comparing the capacity characteristics of the horizontal wells that encountered different configurations of the sand bodies and combined with the analysis of the fluid flow law under horizontal well volume fracturing, a three-zone coupled fluid flow model based on the main fracture–fracture network–matrix of dense reservoirs under the control of the composite sand body structure type was established comprehensively. Based on this model, the actual volume fracturing horizontal flat well area was used as the example to extract. The capacity curve of each cluster in the horizontal section after the numerical simulation of a typical horizontal well group with volume fracturing was extracted and classified into four types: high-production stable type, high-production two-stage type, high-production rapidly declining type, and low-production rapidly declining type. The coupling relationship between the capacity characteristics of each cluster of horizontal well volume fracturing and sand body configuration style was established to provide a theoretical basis for subsequent oil field adjustments for different sand body development methods.
Author Contributions
Conceptualization, Y.S. and B.Y.; methodology, R.L.; data curation, L.Y.; writing—original draft preparation, R.L. and X.W.; writing—review and editing, Z.L. All authors have read and agreed to the published version of the manuscript.
Funding
This paper was funded by the Hainan Provincial Joint Project of Sanya Yazhou Bay Science and Technology City (No. 2021ZRLH0138); Postdoctoral Scientific Research Developmental Fund of Heilongjiang Province: (No. LBH-Q21081); National Natural Science Foundation of China (No. 41872158).
Data Availability Statement
Raw data is reserved.
Conflicts of Interest
The authors declare no conflict of interest.
References
- Zhou, Q.; Yang, G. Definition and application of tight oil and shale oil terms. Oil Gas Geol. 2012, 33, 541–544+570. [Google Scholar]
- Jia, C.; Zheng, M.; Zhang, Y. Unconventional oil and gas resources and prospect of exploration and development in china. Pet. Explor. Dev. 2012, 39, 129–136. [Google Scholar] [CrossRef]
- Hu, S.; Tao, S.; Wang, M.; Pang, Z.; Bai, B.; Chen, Y.; Lu, S.; Chen, Y.; Yang, Y.; Jin, X.; et al. Mechanism of Filling, Transport and Accumulation of Tight Oil in Terrestrial Lake Basins and Main Control Factors of Enrichment. Pet. Explor. Dev. 2023, 50, 481–490+529. [Google Scholar]
- Wang, W.; Lan, Y.; Shi, H.; Tian, Q.; Zhang, Z.; Xue, W. Spatial analysis of the sedimentary stages for composite channels based on sand-stratum ratio: A case study of the 2rd submember of the lower 8th member of shihezi formation in the infilled pattern test area of block st, sulige gas field, ordos basin. Oil Gas Geol. 2019, 40, 1135–1140. [Google Scholar]
- Sun, Y.; Yu, H.; Ma, S.; Deng, M.; Xiang, Y.; Zhang, Y. Physical characteristics of dense sandstone reservoirs and their controlling factors—Example of four sections of the cretaceous quantui formation in the da’an area of the songliao basin. J. China Univ. Min. Technol. 2017, 46, 809–819. [Google Scholar]
- Ozkan, E.; Brown, M.; Raghavan, R. Comparison of Fractured-Horizontal-Well Performance in Tight Sand and Shale Reservoirs. Spe Reserv. Eval. Eng. 2011, 14, 248–259. [Google Scholar] [CrossRef]
- Wiemers, T.O.; Hill, W.B.; Grieser, W.V. Horizontal Well Fracture Stimulation Methods. U.S. Patent Application No. 5,894,888, 20 April 1999. [Google Scholar]
- Zongtian, L.I. Prospect of horizontal well fracturing technology. Oil Drill. Prod. Technol. 2009, 31, 13–18. [Google Scholar]
- Wenbin, C.; Zhaomin, L.; Xialin, Z. Horizontal well fracturing technology for reservoirs with low permeability. Pet. Explor. Dev. 2009, 36, 80–85. [Google Scholar] [CrossRef]
- Giger, F.M. Low-Permeability Reservoirs Development Using Horizontal Wells. In Proceedings of the SPE/DOE Joint Symposium on Low Permeability Reservoirs, Denver, CO, USA, 18–19 May 1987. [Google Scholar] [CrossRef]
- Karcher, B.J.; Giger, F.M.; Combe, J. Some Practical Formulas to Predict Horizontal Well Behavior. In Proceedings of the SPE Annual Technical Conference and Exhibition, New Orleans, LA, USA, 5–8 October 1986. [Google Scholar] [CrossRef]
- Liu, Y.T.; Zhang, J.C. Stable permeating flow and productivity analysis for anisotropic reservoirs in horizontal well networks. Shiyou Kantan Yu Kaifa/Pet. Explor. Dev. 2004, 31, 94–96. [Google Scholar]
- Liu, H.; Zhao, Y.; Meng, J.; Li, Y.; Su, A. A Review of Research on Capacity Prediction Methods for Fractured Horizontal Wells. Geol. Sci. Technol. Inf. 2015, 34, 131–139. [Google Scholar]
- Giger, F.M. Horizontal Wells Production Techniques in Heterogeneous Reservoirs. In Proceedings of the Middle East Oil Technical Conference and Exhibition, Manama, Bahrain, 11–14 March 1985. [Google Scholar] [CrossRef]
- Sun, E.; Hou, Y.; Zhang, D.; Wang, W.; Peng, Q. Capacity Prediction of Horizontal Wells under Oil and Gas Two-Phase in Low-Permeability Reservoirs and Analysis of the Influencing Factors—Take Bohai Oilfield a Reservoir as an Example. Pet. Geol. Eng. 2020, 34, 74–78. [Google Scholar]
- Ma, X.; Zhou, D.; Cai, W.; Li, X.; He, M. An Interpretable Machine Learning-Based Method for Horizontal Well Capacity Prediction. J. Southwest Pet. Univ. (Nat. Sci. Ed.) 2022, 44, 81–90. [Google Scholar]
- Ma, L. Capacity Prediction Model for Fractured Horizontal Wells in Non-Homogeneous Tight Reservoirs. Daqing Pet. Geol. Dev. 2022, 41, 168–174. [Google Scholar]
- Li, B.; Jia, A.; He, D.; Li, X. A New Method for Capacity Prediction of Fractured Horizontal Wells in Low Permeability Tight Gas Reservoirs. Nat. Gas Geosci. 2015, 26, 1793–1802. [Google Scholar]
- Engler, T.; Tiab, D. Analysis of pressure and pressure derivative without type-curve matching, 5. Horizontal well tests in naturally fractured reservoirs. J. Pet. Sci. Eng. 1996, 15, 139–151. [Google Scholar] [CrossRef]
- Zhang, D.; Zhang, L.; Tang, H.; Zhao, Y. Numerical Simulation of Flow-Solid Full Coupling Capacity of Tight Oil Multi-Stage Fractured Horizontal Wells. Pet. Explor. Dev. 2022, 49, 338–347. [Google Scholar] [CrossRef]
- Retnanto, A.; Economides, M.J. Performance of Multiple Horizontal Well Laterals in Low to Medium Permeability Reservoirs. SPE Reserv. Eng. 1996, 11, 73–78. [Google Scholar] [CrossRef]
- Tian, L.; Xiao, C.; Liu, M. Well testing model for multi-fractured horizontal well for shale gas reservoirs with consideration of dual diffusion in matrix. J. Nat. Gas Sci. Eng. 2014, 21, 283–295. [Google Scholar] [CrossRef]
- Fokker, P.A.; Verga, F.; Egberts, P.J.P. New Semianalytic Technique to Determine Horizontal Well Productivity Index in Fractured Reservoirs. SPE Reserv. Eval. Eng. 2005, 8, 123–131. [Google Scholar] [CrossRef]
- Went, D.J.; Fisher, W.C. Integration of horizontal well geological data into reservoir descriptions: Rotliegende Sandstone, Lancelot area, southern North Sea. AAPG Bull. 1997, 81, 135–154. [Google Scholar] [CrossRef]
- Fan, T.; Wang, H.; Hu, G.; Song, L.; Zhang, J.; Zhang, X. Anatomy Method of Composite Sand Body Architecture in Offshore Oilfield and Its Application. China Offshore Oil Gas 2018, 30, 102–112. [Google Scholar]
- Hu, G.; Chen, F.; Fan, T.; Sun, L.; Zhao, C.; Gao, Y.; Wang, H.; Song, L. Analysis of Fluvial Facies Compound Sandbody Architecture of the Neogene Minghua-Zhen Formation of S Oilfield in the Bohai Bay. Acta Sedimentol. Sin. 2014, 32, 586–592. [Google Scholar]
- Hu, G.; Fan, T.; Chen, F.; Jing, Y.; Song, L.; Liang, X.; Xiao, D. Theory of Composite Sand Body Configuration and Its Production Application. Pet. Nat. Gas Geol. 2018, 39, 122–130. [Google Scholar]
- Cheng, M.; Meng, D.; Wang, L.; Jiang, Q.; Wang, G.; Zhao, M. Evaluation of Differential Development Effect of Horizontal Wells in Tight Sandstone Gas Reservoirs—Example of Surig Gas Field in Ordos Basin. J. China Univ. Min. Technol. 2023, 52, 354–363. [Google Scholar]
- Wei, H.H.; Liu, J.L.; Meng, Q.R. Structural and sedimentary evolution of the southern Songliao Basin, northeast China, and implications for hydrocarbon perspectivity. AAPG (Am. Assoc. Pet. Geol.) Bull. 2010, 94, 533–566. [Google Scholar]
- Sorokin, A.P.; Malyshev, Y.F.; Kaplun, V.B. Evolution and deep structure of the ZeyaeBureya and Songliao sedimentary basins (East Asia). Russ. J. Pac. Geol. 2013, 7, 77–91. [Google Scholar] [CrossRef]
- Li, S.Q.; Chen, F.; Siebel, W. Late Mesozoic tectonic evolution of the Songliao basin, NE China: Evidence from detrital zircon ages and Sr–Nd isotopes. Gondwana Res. 2012, 22, 943–955. [Google Scholar] [CrossRef]
- Feng, Z.Q.; Jia, C.Z.; Xie, X.N. Tectonostratigraphic units and stratigraphic sequences of the nonmarine Songliao basin. Basin Res. 2010, 22, 79–95. [Google Scholar]
- Deng, Q.; Hu, M.; Hu, Z. Depositional characteristics and evolution of the shallow water deltaic channel sand bodies in Fuyu oil layer of central downwarp zone of Songliao Basin, NE China. Arab. J. Geosci. 2019, 12, 607. [Google Scholar] [CrossRef]
- Cai, Q.S.; Hu, M.Y.; Liu, Y.N.; Kane, O.I.; Deng, Q.J.; Hu, Z.G.; Li, H.; Ngia, N.R. Sedimentary characteristics and implications for hydrocarbon exploration in a retrograding shallow-water delta: An example from the fourth member of the Cretaceous Quantou Formation in the Sanzhao depression, Songliao Basin, NE China. Pet. Sci. 2022, 19, 20. [Google Scholar] [CrossRef]
- Miall, A.D. The Geology of Fluvial Deposits; Springer: Berlin/Heidelberg, Germany, 1996. [Google Scholar]
- Wu, S.; Ji, Y.; Yue, D.; Yin, L. Discussion on Hierarchical Scheme of Architectural Units in Clastic Deposits. Geol. J. China Univ. 2013, 19, 12–22. [Google Scholar]
- Yao, G.; Ma, Z.; Zhao, Y. Measures on Reservoir Description Corresponding with the Graduation of Geological Reservoir Models. Exp. Pet. Geol. 1994, 16, 403–408. [Google Scholar]
- Zeng, X. Application of Reservoir Structure Research in The Fine Exploitation of Oilfields. Pet. Explor. Dev. 2010, 37, 483–489. [Google Scholar]
- Zhang, C. Hierarchy Analysis in Reservoir Researches. Oil Gas Geol. 1992, 13, 344–350. [Google Scholar]
- Vail, P.R. Seismic Stratigraphy Interpretation Using Sequence Stratigraphy. Part 1: Seismic Stratigraphy Interpretation Procedure. Atlas Seism. Stratigraphy. AAPG Stud. Geol. 1987, 27, 1–10. [Google Scholar]
- Wagoner, J.C.V.; Mitchum, R.M.; Campion, K.M.; Rahmanian, V.D. Siliciclastic Sequence Stratigraphy in Well Logs, Cores, and Outcrops. AAPG Methods Explor. Ser. 1990, 10–45. [Google Scholar] [CrossRef]
- Cui, M.; Li, P.; Wang, Z.; Fan, A.; Gao, W.; Li, Y.; Wang, Y. Characteristics of Tight Sand Reservoir and Controlling Factors of High-Quality Reservoir at Braided Delta Front: A Case Study from Member 8 of Shihezi Formation in Southwestern Sulige Gas Field. Acta Pet. Sin. 2019, 40, 279–294. [Google Scholar]
- Zhang, L.; Bao, Z.; Lin, Y.; Chen, Y.; Lin, X.; Dou, L.; Kong, B. Genetic Types and Sedimentary Model of Sandbodies in a Shallow-Water Delta: A Case Study of The First Member of Cretaceous Yaojia Formation in Qian’An Area, South of Songliao Basin, Ne China. Pet. Explor. Dev. 2017, 44, 727–736. [Google Scholar] [CrossRef]
- Cao, J.; Yang, Y.; Chen, C.; Bu, G.; Wang, Q.; Yang, Y. Analysis of Configuration Characteristics for Skeleton Sand Body with Tight Sandstone Reservoir: A Case Study of Triassic Chang 6 Members in Heshui Area, Ordos Basin, Nw Chin. Acta Sedimentol. Sin. 2019, 37, 1105–1116+1103. [Google Scholar]
- Sun, Y.; Ma, S.; Cong, L.; Zhao, H.; Yu, L.; Fu, X. Study on Depositional Characteristics and Model of Fuyu Oil Layer in the Southern Fuxin Uplift of Songliao Basin. Acta Sedimentol. Sin. 2012, 30, 706–715. [Google Scholar]
- Cai, Q.; Hu, M.; Hu, Z.; Yang, J.; Yue, X.; Qiu, X. Sedimentary Evolution and Distribution of Sand Bodies of Retrogradational Shallow-Water Delta: A Case Study From 4thmember of the Cretaceous Quantou Formation in the Lingjiang Area, Songliao Basin. Oil Gas Geol. 2016, 37, 903–914. [Google Scholar]
- Zheng, R.; Yin, S.; Peng, J. Sedimentary Dynamic Analysis of Sequence Structure and Stacking Pattern of Base -Level Cycle. Acta Sedimentol. Sin. 2000, 18, 369–375. [Google Scholar]
- Lai, H.; Qin, Z.; Wang, H.; Zheng, X.; Lin, Y.; Bao, Z.; Li, M.; Zhang, Y.; Zhang, L.; Wu, Y.; et al. Development Pattern of Shallow-Water Delta and Sandbodies under Control of High-Frequency Base-Level Cycles: A Case Study of The Cretaceous Quantou Formation in Fuyu Oilfield, Songliao Basin. J. Palaeogeogr. (Chin. Ed.) 2017, 19, 609–622. [Google Scholar]
- Qunming, L.; Haifa, T.; Guang, J.; Dewei, M.; Jian, W. Geological Targe Top Timization for Horizontal Well Developmen to Ftight Sandgas, Sulige Gas Field, Ordos Basin, China. Nat. Gas Geosci. 2016, 27, 1360–1366. [Google Scholar]
- Clarksonc, R. Production Data Analysis of Unconventional Gas Wells:Review of the Oryand Best Practice. Int. J. Coal Geol. 2013, 109, 101–146. [Google Scholar] [CrossRef]
- Wang, J.; Jia, A.; Wei, Y.; Jia, C.; Qi, Y.; Yuan, H.; Jin, Y. Optimization workflow for stimulation-well spacing design in a multiwell pad. Pet. Explor. Dev. 2019, 46, 1039–1050. [Google Scholar] [CrossRef]


Disclaimer/Publisher’s Note: The statements, opinions and data contained in all publications are solely those of the individual author(s) and contributor(s) and not of MDPI and/or the editor(s). MDPI and/or the editor(s) disclaim responsibility for any injury to people or property resulting from any ideas, methods, instructions or products referred to in the content. |
© 2023 by the authors. Licensee MDPI, Basel, Switzerland. This article is an open access article distributed under the terms and conditions of the Creative Commons Attribution (CC BY) license (https://creativecommons.org/licenses/by/4.0/).