Article

Effect of Organic Powders on Surface Quality in Abrasive Blasting Process

1
Department of Mechanical Engineering, Engineering Faculty, Zonguldak Bulent Ecevit University, 67000 Zonguldak, Türkiye
2
Department of Civil Engineering, Engineering Faculty, Zonguldak Bulent Ecevit University, 67000 Zonguldak, Türkiye
*
Author to whom correspondence should be addressed.
Processes 2023, 11(7), 1925; https://doi.org/10.3390/pr11071925
Submission received: 9 June 2023 / Revised: 24 June 2023 / Accepted: 25 June 2023 / Published: 26 June 2023
(This article belongs to the Special Issue 10th Anniversary of Processes: Women's Special Issue Series)

Abstract

:
Abrasive blasting, sometimes known as sandblasting, is a method used to change the surface condition of materials, clean surfaces, and prepare surfaces for applications such as paint, bonding, coating, etc. The abrasive materials used in abrasive blasting are applied to the surface with compressed air or water and vary according to the purpose of application. The abrasive materials used have negative effects on the environment and human health. So far, organic materials have been used in limited applications in abrasive blasting. However, these materials have a high potential of usage since they are environmentally friendly, safe for human health, and have non-toxic and sustainable properties. In this study, the usability of three different organic wastes (walnut shell, olive pomace and mussel shell) recovered by recycling in abrasive blasting was investigated. In addition, the effect of blasting distance (5, 10 and 15 mm), blasting time (10, 20 and 30 s), powder type (mussel shell, olive pomace and walnut shell) and grain size (38, 45 and 63 µm) on surface roughness have been investigated using the Taguchi L9 experimental design. Regression models were built using ANOVA (Analysis of Variance). Moreover, the surface condition after abrasive blasting was examined using an Al2O3 abrasive and compared with other samples. As a result, 5 mm, 30 s, mussel shell and 45 µm test sets were recommended for “larger is better” and it was determined that the blasting time had the greatest effect on the surface roughness by 50.19%. On the other hand, 10 mm, 20 s, walnut shell and 63 µm test sets were recommended for “smaller is better”, and it was determined that blasting time had the greatest effect on the surface roughness by 39.02%. While there was an increase compared to the surface roughness values before abrasive blasting in the first set of experiments, it was determined that the organic material had a polishing rather than an abrasion effect in the second set of experiments.

1. Introduction

Sandblasting is a versatile process for roughening, cleaning or smoothing surfaces. The first sandblasting process was patented (as abrasive) [1] on 18 October 1870 by Benjamin Chew Tilghman. Since then, the sandblasting process has been used for surface preparation (as a method), resurfacing, surface preparation before painting, creating surface texture [2,3,4,5], fossil preparation (paleontological preparation technique) [6], removing surface coatings [2], etc. In addition, it can be easily applied to developing technological products. For example, it is used as a finishing process to increase the surface quality of the products produced in additive manufacturing [7], and to obtain a clean surface and micro-mechanical retention in the field of dentistry [8].
Another application area of sandblasting is adhesive bonding joints. It is one of the preferred surface pre-treatments to increase the area to be bonded and ensure wettability [1,9,10,11]. It is known that the surface formed after sandblasting increases the bond strength in adhesive bonding joints [4,10,11,12,13,14,15,16].
In abrasive blasting, there are different types of abrasive materials classified in the mineral, agricultural, synthetic and metallic categories [17]. Although sand is mostly preferred, glass, metal, dry ice, coconut shells or plant shells are also used as abrasive materials [18]. Although sandblasting has a wide usage area, it has some drawbacks. According to the nature of the work to be done, special balls made of materials such as silica, basalt, etc. are used in the sandblasting process. These balls create a time-dependent solid particle erosion by creating a repeated impact effect, especially in the nozzle [19,20]. The remaining iron-based abrasives on the material surface cause rust formation [21]. In addition, iron-based powders have an ignition risk during processing [22]. Another disadvantage is the health problems that sandblasting operators are exposed to. One of the main health problems is silicosis, which occurs as a result of exposure to respirable crystalline silica, and this has a fatal effect [23,24]. Due to the reasons stated above, it is of great importance to use a powder that can reduce the aforementioned drawbacks, as an alternative to the traditional powders used in sandblasting.
Rudawska et al. [25] investigated the effect of sandblasting on the surface properties of C45 carbon steel. In the experiments, different sandblasting pressures (1, 2 and 4 bar) and abrasive material groups (brown fused alumina, brown fused alumina, white fused alumina, glass beads), each of which had different granulation, were used. All experiments were performed at a 100 mm distance from the surface at a right angle for 1 min. Surface roughness (Ra) values were taken from three different positions on each sandblasted surface. The surfaces subjected to sandblasting with glass beads had the smallest roughness. It was found that the surface roughness obtained with brown fused alumina (2.5–3.5 µm) on the surface of the steel material with a sandblasting pressure of 2 bar was approximately two times higher than the others. The results showed that surface roughness was more affected by changes in sandblasting pressure, depending on the type of abrasive used. It has been understood that surfaces with different roughness parameters and surface properties were formed with the sandblasting application.
Bresson et al. [26] applied different surface pre-treatments to improve bonding properties. For the sandblasting process, they used F80 white corundum with a grain size of 150–212 µm and F60 corundum abrasive with a grain size of 212–300 µm. The sandblasting pressure was 4 bar, and the corundum grains were sprayed onto the sandblasting surface with a contact angle of 30°. The effect of the distance of the nozzle to the part in the sandblasting process was investigated, and 10 and 35 cm sandblasting distances were used. While Ra = 3.94 ± 0.18 µm was obtained for a 10 cm distance and F60 abrasive, Ra = 3.99 ± 0.40 µm was obtained for 35 cm. These roughness values were higher than the values obtained with F80 corundum abrasive.
Balza et al. [27] sandblasted titanium material at a 90° angle with Al2O3 particles from a distance of 0.1 m. Air pressure was chosen as 0.3 MPa, particle size was 420–600 µm and sandblasting times were 2, 3, 4, 6, 7, and 10 s. It was observed that the optimum roughness value was 3.4 μm at 7 s of sandblasting, and this value decreased to 3.1 μm when the time was increased to 10 s. It was stated that prolonged sandblasting times were associated with a tendency to decrease roughness.
Isa et al. [28] investigated the mechanical properties of the ASTM A516 Grade 70 steel material and its effect on the fatigue life of the material. ASTM A516 Grade 70 steel material was blasted with 0.3 mm SAE G-80 for 15, 25, 35 and 45 min. By changing the time, significant differences occurred in terms of hardness value and grain size. It was also proven that the sandblasting process significantly increased the fatigue life and tensile strength of the material.
Ourahmoune et al. [29] investigated the effect of sandblasting on the adhesion of PEEK (Poly Ether Ether Ketone) thermoplastic material and carbon fiber (CF)- and glass (GF)-reinforced PEEK material. In all experiments, sandblasting was carried out with a ceramic nozzle of 8 mm diameter, at 5 bar, at an angle of 90°, and with a constant distance value of 80 mm. Sandblasting time was changed from 5 s to 45 s. Furthermore, 98% of commercial alumina (Al2O3) powder was used as an abrasive in three different particle sizes (50 µm, 110 µm and 250 µm). It was observed that the roughness parameters tended to stabilize after 5 s of sandblasting, regardless of the particle size used. In addition, the presence of a fiber structure has important effects in the sandblasted material. It was also observed that CF-reinforced PEEK and GF-reinforced PEEK composites had a higher roughness level than the PEEK material.
Rudawska et al. [18] sandblasted three different aluminum alloys (EN AW-2024 TO, EN AW-2219 TO and EN AW-2014 T4) using calcined bauxite content (named EB F54 aloxite) at three different blasting pressures (0.41 MPa, 0.51 MPa and 0.56 MPa). The grain size of EB F54 aloxite was between 355 and 300 μm. The time was 60 s and the distance was 200 mm. The Ra surface roughness values measured before sandblasting were 0.42 µm for EN AW-2024 TO, 0.35 µm for EN AW-2219 TO, and 0.28 µm for EN AW-2014 T4, respectively.
Tshimanga et al. [30] blasted Grade 304L austenitic stainless steel with four different abrasives of varying granulation: garnet, aluminum oxide, steel grit, and platinum grit. The characterization of the surface morphology created by the process was investigated. The highest surface roughness (18.2 µm) was obtained in steel grit, while the lowest surface roughness (7.8 µm) was obtained in aluminum oxide.
In this study, the usability of organic waste materials in powder form in the sandblasting process was investigated. Organic materials are biodegradable, environmentally safe, non-toxic, renewable and sustainable. They eliminate the problem of silicosis disease, especially caused by breathing [31]. In addition, since organic abrasives do not reduce the life of the blasting nozzle [32,33], process differences due to nozzle wear will be prevented. Moreover, since organic abrasives do not react chemically with the surface, unwanted formations such as rust, etc., will not occur. The organic materials used are environmentally friendly as they will be obtained from recycling. When the literature is examined, it is seen that there are many studies on the effects of blasting pressure, blasting time, blasting distance, and abrasive material type, which are among the blasting process parameters. However, to the best knowledge of the researchers, there are no studies on abrasive blasting where waste materials are used as abrasives. Therefore, the aim of this study is to examine the use of waste materials as abrasive materials in the abrasive blasting process. For this reason, three different organic materials (walnut shell, olive pomace and mussel shell) and three different sizes (38, 45 and 63 µm) obtained by recycling were used. By using the Taguchi experimental design, the effects of powder type, powder size, blasting distance, and blasting time on the roughness of the blasted surface were investigated.

2. Method

2.1. Experimental Samples

DX51D + Z quality galvanized steel material (EN 10346:2015) with dimensions of 100 × 25 × 1.5 mm was used for experimental studies. The samples were cleaned by wiping with acetone and drying without any treatment.
The chemical composition of the experimental samples is given in Table 1, and their mechanical properties are given in Table 2. Values are taken from the manufacturer’s catalogs [34].

2.2. Abrasive Powders

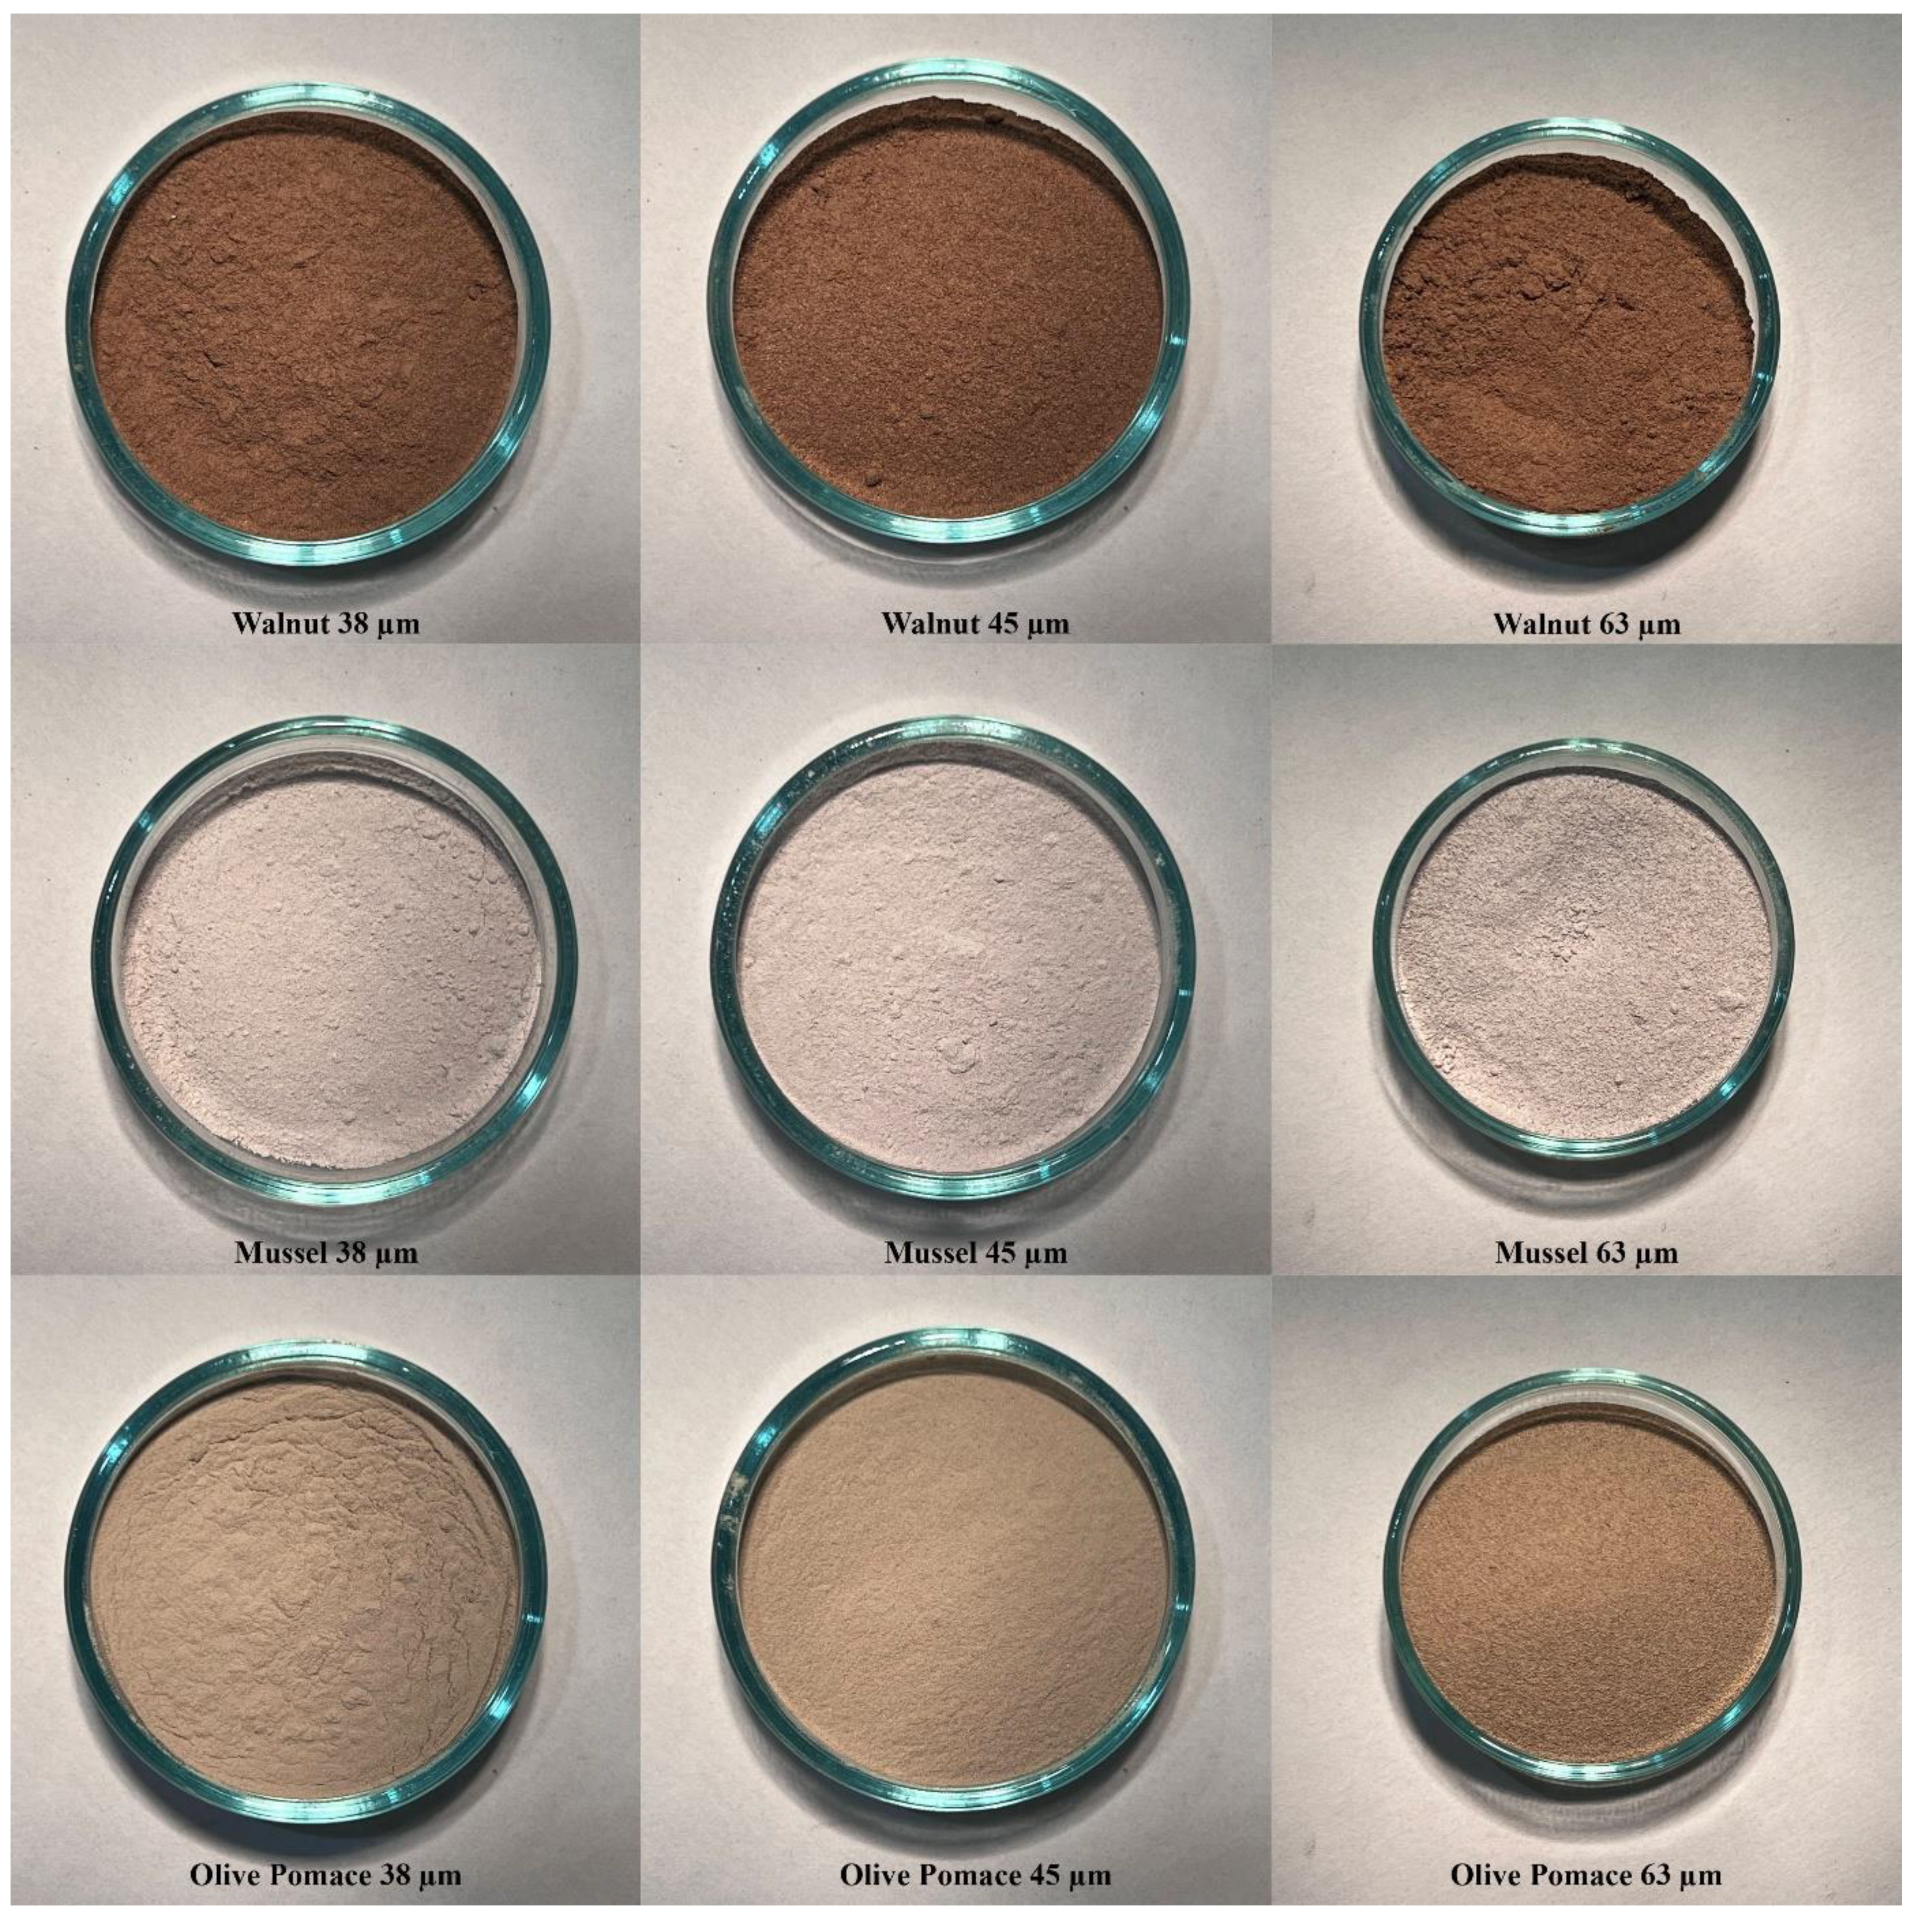
Mussel shell, olive pomace and walnut shell powders (three different kinds) in three different sizes as 38, 45 and 63 µm were used as abrasive. The grinded powders of 38, 45 and 63 µm are given in Figure 1 as olive pomace, walnut shell and mussel shell, respectively.
Organic abrasives have an irregular, jagged structure. These properties of the abrasives used are shown in Table 3.
For mussel powders, waste Mediterranean Mussel (mytilus galloprovincialis) shells were used. Calcium carbonate is a commonly used as filler in polymer material. While the chemical composition of mussel shell contains 95.7% CaO, this ratio is 99.1% in commercial CaCO3. Since mussel shells contain a similar amount of CaO to commercial CaCO3, it is appropriate to use them as an additive material [33].
Olive pomace is the residue remaining after olives are crushed. It was obtained from a company operating in the Aegean region (Turkey). Walnut shells were also obtained from people who consumed walnuts. They had a specific gravity of 1.2–1.4 [35].
After the waste materials were dried in the oven, they were ground in a ring mill and sieved in a sieve shaker.
Moreover, 25 µm alumina was used to make comparisons on the surfaces after abrasive blasting. Aluminum oxide is an abrasive material with a Mohs Hardness = 9 and high resistance to abrasion.

2.3. Process Parameters

The organic powders used in abrasive blasting were sprayed from a distance of 5, 10, and 15 cm. Blasting time was chosen as 10, 20 and 30 s. Three different types of powder sizes of 38, 45 and 63 µm were used. The sandblasting pen was held at an angle of 90° to the samples to be sandblasted. A sandblasting machine with two pen types was used. The nozzle material was carbide and the nozzle diameter was 1.2 mm. The blasting pressure was kept constant at 6 bar.
Two different experiments were performed using aluminum oxide powder to compare with Taguchi validation experiments. In the first one, a 5 cm distance and 30 s blasting time were used, while a 10 cm distance and 20 s blasting time were used in the second one. Then, the surface roughness values obtained from Taguchi, and “larger is better” and “smaller is better” validation experiments were compared.
The roughness values were measured in accordance with ISO (2021) 21920-2 [37] using the Mitutoyo SJ-301 profilometer device. The surface roughness of the samples was found by averaging the values measured from five different positions before and after abrasive blasting. The experiment was conducted with three replications.

2.4. Design of Experiments

Abrasive blasting is a method used in a wide variety of fields as a complementary process. The abrasive blasting process is affected by the particle size of the abrasive, the application pressure, the application time, and the blasting distance [38,39,40]. The inappropriateness of the parameters specified in the abrasive blasting process may cause excessive material loss [41,42]. In addition, there are problems in biocompatibility if abrasive residues remain in surface polishing or roughening processes after blasting. Therefore, the use of natural abrasives will provide advantages in terms of both cost and compatibility.
In the first stage of the abrasive blasting process, the samples prepared were fixed by placing them on the clamping apparatus. Then, the abrasives to be used were placed in the abrasive blasting chamber by adjusting the sandblasting distance. Finally, abrasive blasting was carried out on the surface of the samples within the specified time. In the study, an experimental design was made using the Taguchi method. In the experimental designs, two separate designs were made according to the “smaller is better” and “larger is better” characteristics, and signal-to-noise ratios (S/N) were calculated. The reason for this is that user expectations in the abrasive blasting process differ according to the application area. Control factors and levels are given in Table 4.
The experiment design was arranged with the four factors of distance, time, powder type and grain size, and each factor had three levels. The factors and the values of the levels of the factors are given in Table 5.
The first step of the Taguchi method is to select a proper orthogonal array based on the number of parameters and levels selected as control factors [43]. In the study, the total degrees of freedom (DOF) for four factors, each of which has three levels, was eight. Therefore, the L9 (33) array, which is a three-level Taguchi orthogonal array (TOA) with at least eight DOFs, was selected. The L9 orthogonal array is given in Table 5.
In the Taguchi method, the experimental results are converted to the signal-to-noise ratio (S/N) to determine the amount of deviation from the desired value. The S/N ratio for surface roughness is calculated by the following formula:
Larger is better characteristic:
S N = 10 l o g 1 n i = 0 n 1 y i 2
Smaller is better characteristic:
S N = 10 l o g 1 n i = 0 n y i 2
where “n” is the number of tests and “yi” is the value of the experimental result of the test.
In addition, an analysis of variance (ANOVA) test was also performed to determine the statistical effects of the processing parameters. With S/N and ANOVA analysis, the most appropriate variation of the process parameters can be determined according to the determined values. Finally, a validation experiment was conducted to verify the optimal process parameters obtained from the parameter design.

3. Results and Discussion

3.1. Analysis of the Factors

The analysis of the effect of each factor on the surface quality was performed using the noise/signal (S/N) ratio obtained using the Minitab 16.0 statistical software. The responses of the process parameters are shown in Table 6 and Table 7. The tables show the S/N ratios of each control factor and how they change from level 1 to level 3. The greater the difference between the levels of the control factor, the greater its effect on the product. In addition, these tables are used to calculate the Taguchi estimation value according to the optimum parameter [44].
The optimal values of the determined factors (for “larger is better” and “smaller is better”) were determined using the S/N graphs in Figure 2a and Figure 3a. Additionally, the interaction between the experimental parameters is shown in Figure 2b and Figure 3b.
The important thing in the Taguchi method is to determine the optimum levels of the parameters. Optimum levels are determined based on the minimum value (for smaller is better) and maximum value (for larger is better) of different levels of the parameters, according to the results of the combinations produced by the L9 orthogonal array.
The distributions of the average test results calculated according to the sandblasting parameters and levels are shown in Figure 2 and Figure 3. Since the “larger is better” characteristic was selected in the study, the lowest mean values for all levels of the experimental results were evaluated to determine the optimal combination of abrasive blasting parameters. Likewise, the largest values can be considered for the S/N ratios. Accordingly, the optimal combination for abrasive blasting was obtained as A1B3C1D2 (distance: 5, time: 30, mussel and grain size: 45). Since the “smaller is better” characteristic was selected in the study, the optimal combination for abrasive blasting was obtained as A2B2C3D3 (distance: 10, time: 20, walnut shell and grain size: 63).
The effects of distance, time, powder type and grain size on surface roughness were analyzed by the ANOVA method. The ANOVA values are given in Table 8 and Table 9.
As seen in Table 8 (larger is better), the effects of parameters on surface roughness were obtained as: distance (A) (p = 18.7), time (B) (p = 50.19), powder type (C) (p = 10.56%) and grain size (D) (p = 20.56%). The greatest factor affecting surface roughness was “time”, at 50.19%. The next factor was the “grain size”, at 20.56%. In the study, it was determined that the time factor was the most important factor affecting the surface roughness. As the time increased, the amount of wear on the surface increased. The second-most-important parameter was the grain size. When the experimental results were examined, it was seen that the abrasive powder sizes should be taken into account in order to obtain this surface roughness value.
As seen in Table 9 (smaller is better), the effects of parameters on surface roughness were found as: distance (A) (p = 33.8), time (B) (p = 25.02), powder type (C) (p = 2.16%) and grain size (D) (p = 39.02%). The greatest factor affecting surface roughness was “grain size”, at 39.02%. The next factor was “distance”, at 33.80%. Since the hardness values of different powder materials used in this study are close to each other, it has been determined that the surface abrasive properties vary depending on the grain size rather than the material type.

3.2. Regression Analysis

Multiple regression analysis was used to derive estimation equations of continuous dependent variables obtained through experimental designs with each combination of control factors. In the equation, Ra surface roughness symbols M, P and W represent the powder type. RaM/P/W is the estimation equation for surface roughness created using distance, time, grain size parameters. The R2 value of the equation obtained by regression analysis was calculated as 0.99 (99%) (Table 10). In Figure 4, the randomly selected experimental results from the L9 series and the estimation equation results are compared.

3.3. Confirmation Test

The final step in the Taguchi experimental design is validation experiments. The purpose of validation experiments is to verify the prediction obtained in the analysis phase by comparing the experimental results. Considering the individual effects of control factors, the surface roughness estimation value obtained for A1B3C1D2 (for larger is better) and A2B2C3D3 (for smaller is better) according to the Taguchi method and the values obtained as a result of the control experiment are given in Table 11. The error rates were determined as 8.41% and 2.37%. It is seen that the consistency of the results and the accuracy of the predictions are high. According to this result, the values to be obtained using the Taguchi estimation equation will be within the 90% confidence interval.

3.4. Surface Roughness Measurement for Comparison

Before abrasive blasting, the surface roughness of the samples was measured. The average surface roughness value was obtained as 0.35 µm. In Figure 5, the surface images of the test samples after abrasive blasting are given. The red box in Figure 5 shows the abrasive blasted area.
Table 12 shows that the surface roughness values obtained using the alumina (Al2O3) powder in the abrasive blasting process are higher than the surface roughness values obtained using mussels for “larger is better” and walnuts for “smaller is better”. The reason for this is that the hardness value of Al2O3 (Table 3) and abrasiveness are higher than the other abrasive materials used. It was determined that there was a significant difference between the surface roughness value taken before abrasive blasting and the surface roughness value obtained from the material that was blasted with Al2O3. The “larger is better” results with organic abrasives were found to increase surface roughness compared to before blasting. When the “smaller is better” value is compared with the value before abrasive blasting, it has been determined that it creates a polishing effect on the surface rather than abrading.

4. Conclusions and Recommendations

The innovative contribution of this study to the literature is the use of recycled walnut shell, olive pomace and mussel shell organic powders as abrasives in the abrasive blasting process and examining the abrasion effect they cause on the surface. This study aimed to eliminate the damages to the environment and human health that may occur in chemical or mechanical abrasion. In this way, it will be possible to reduce the cost of the sandblasting process. In the experimental studies, the parameters that most affected the surface roughness after abrasive blasting were selected as blasting distance (5, 10 and 15 mm), blasting time (10, 20 and 30 s), powder type (mussel, olive pomace and walnut) and grain size (38, 45 and 63). µm). The Taguchi experimental method (L9 orthogonal array) was used to examine the relationship between these parameters and surface roughness. In addition, the effects of the determined parameters on the surface roughness were investigated by performing ANOVA analysis. To estimate the surface roughness value, a mathematical model was created, and validation tests were performed. As a result of the measurements and analyses carried out, the following conclusions were obtained:
  • Statistically designed experiments based on Taguchi methods were carried out using L9 orthogonal arrays according to the “larger is better” and “smaller is better” criteria, respectively.
  • An A1B3C1D2 (5 mm, 30 s, mussel and 45 µm) test set is recommended for the “larger is better” and an A2B2C3D3 (10 mm, 20 s, walnut and 63 µm) test set is recommended for the “smaller is better”.
  • For the “larger is better”, blasting time was found to be the most important factor affecting surface roughness. As the blasting increased, the amount of wear on the surface increased. For the “smaller is better”, it was determined that the grain size had the greatest effect on the surface roughness.
  • Since the hardness values of the different powder materials used were close to each other, it has been determined that the surface abrasive properties vary depending on the grain size rather than the material type.
  • The economy of organic powders, the ease of supply, and the fact that they do not harm people and nature are advantages of using them for abrasive blasting. It is a usable method, and considering the depleted resources, it is predicted that the importance and necessity of working with natural materials will become more evident as time goes on.

Author Contributions

Conceptualization and methodology was introduced by N.A.; data curation, N.A. and Z.D.; writing—original draft preparation, N.A.; writing—review and editing, N.A.; visualization, Z.D.; supervision, N.A.; project administration, N.A. and Z.D. All authors have read and agreed to the published version of the manuscript.

Funding

This research received no external funding.

Informed Consent Statement

Not applicable.

Data Availability Statement

Not applicable.

Conflicts of Interest

The authors declare no conflict of interest.

References

  1. Nonnenmann, T.; Beygi, R.; Carbas, R.J.C.; da Silva, L.F.; Öchsner, A. Synergetic effect of adhesive bonding and welding on fracture load in hybrid joints. J. Adv. Join. Process. 2022, 6, 100122. [Google Scholar] [CrossRef]
  2. Guerrero-Vaca, G.; Carrizo-Tejero, D.; Rodríguez-Alabanda, O.; Romero, P.E.; Molero, E. Experimental Study for the Stripping of PTFE Coatings on Al-Mg Substrates Using Dry Abrasive Materials. Materials 2020, 13, 799. [Google Scholar] [CrossRef] [PubMed] [Green Version]
  3. Draganovská, D.; Ižaríková, G.; Guzanová, A.; Brezinová, J. General Regression Model for Predicting Surface Topography after Abrasive Blasting. Metals 2018, 8, 938. [Google Scholar] [CrossRef] [Green Version]
  4. Pocius, A.V. Adhesion and Adhesives Technology: An Introduction, 3rd ed.; Carl Hanser Verlag GmbH Co KG: Munich Germany, 2012. [Google Scholar]
  5. Qi, C.; Weinell, C.E.; Dam-Johansen, K.; Wu, H. A review of blasting waste generation and management in the ship repair industry. J. Environ. Manag. 2021, 300, 113714. [Google Scholar] [CrossRef] [PubMed]
  6. Weber, K.; Winkler, D.E.; Schulz-Kornas, E.; Kaiser, T.M.; Tütken, T. Post-mortem enamel surface texture alteration during taphonomic processes—do experimental approaches reflect natural phenomena? PeerJ 2022, 10, e12635. [Google Scholar] [CrossRef] [PubMed]
  7. Calignano, F.; Mercurio, V.; Rizza, G.; Galati, M. Investigation of surface shot blasting of AlSi10Mg and Ti6Al4V components produced by powder bed fusion technologies. Precis. Eng. 2022, 78, 79–89. [Google Scholar] [CrossRef]
  8. Sevmez, H.; Güngör, M.B.; Yılmaz, H. Surface Treatments of All Ceramic Restoration. J. Ege Univ. Sch. Dent. 2018, 39, 148–159. [Google Scholar] [CrossRef]
  9. Tan, B.; Hu, Y.; Yuan, B.; Hu, X.; Huang, Z. Optimizing adhesive bonding between CFRP and Al alloy substrate through resin pre-coating by filling micro-cavities from sandblasting. Int. J. Adhes. Adhes. 2021, 110, 102952. [Google Scholar] [CrossRef]
  10. Wang, B.; Hu, X.; Lu, P. Improvement of adhesive bonding of grit-blasted steel substrates by using diluted resin as a primer. Int. J. Adhes. Adhes. 2017, 73, 92–99. [Google Scholar] [CrossRef]
  11. Wang, B.; Hu, X.; Hui, J.; Lu, P.; Jiang, B. CNT-reinforced adhesive joint between grit-blasted steel substrates fabricated by simple resin pre-coating method. J. Adhes. 2018, 94, 529–540. [Google Scholar] [CrossRef]
  12. Baldan, A. Adhesion phenomena in bonded joints. Int. J. Adhes. Adhes. 2012, 38, 95–116. [Google Scholar] [CrossRef]
  13. Li, J.; Li, Y.; Huang, M.; Xiang, Y.; Liao, Y. Improvement of aluminum lithium alloy adhesion performance based on sandblasting techniques. Int. J. Adhes. Adhes. 2018, 84, 307–316. [Google Scholar] [CrossRef]
  14. Minosi, S.; Cocchi, D.; Maccaferri, E.; Pirondi, A.; Zucchelli, A.; Mazzocchetti, L.; Ambrosini, D.; Campanini, F. Exploitation of rubbery electrospun nanofibrous mat for fracture toughness improvement of structural epoxy adhesive bonded joints. J. Adv. Join. Process. 2021, 3, 100050. [Google Scholar] [CrossRef]
  15. Shahid, M.; Hashim, S. Effect of surface roughness on the strength of cleavage joints. Int. J. Adhes. Adhes. 2002, 22, 235–244. [Google Scholar] [CrossRef]
  16. Schrader, G.F.; Elshennawy, A.K.; Doyle, L.E. Manufacturing Processes & Materials; Society of Manufacturing Engineers: Southfield, MI, USA, 2000; 842p. [Google Scholar]
  17. Zulkarnain, I.; Kassim, N.A.M.; Syakir, M.I.; Rahman, A.A.; Yusuff, M.S.M.; Yusop, R.M.; Keat, N.O. Sustainability-Based Characteristics of Abrasives in Blasting Industry. Sustainability 2021, 13, 8130. [Google Scholar] [CrossRef]
  18. Rudawska, A.; Wahab, M.A.; Müller, M. Strength of Epoxy-Bonded Aluminium Alloy Joints after Sandblasting. Adv. Sci. Technol. Res. J. 2022, 16, 262–279. [Google Scholar] [CrossRef]
  19. Abedini, M.; Ghasemi, H. Synergistic erosion–corrosion behavior of Al–brass alloy at various impingement angles. Wear 2014, 319, 49–55. [Google Scholar] [CrossRef]
  20. Sundararajan, G.; Roy, M. Solid particle erosion behaviour of metallic materials at room and elevated temperatures. Tribol. Int. 1997, 30, 339–359. [Google Scholar] [CrossRef]
  21. Geng, S.; Sun, J.; Guo, L. Effect of sandblasting and subsequent acid pickling and passivation on the microstructure and corrosion behavior of 316L stainless steel. Mater. Des. 2015, 88, 1–7. [Google Scholar] [CrossRef]
  22. Ergül, H.S. Dust Explosion Phenomena In Mechanical Industry And Atex Instructions. J. Eng. Archit. Fac. Eskişehir. Osman. Univ. 2012, 25, 1–18. [Google Scholar]
  23. Cimrin, A. Sandblasting jeans kills young people. Eur. Respir. J. 2006, 28, 885–886. [Google Scholar] [CrossRef] [PubMed]
  24. Fact Sheet Index. J. Am. Diet. Assoc. 1999, 99, 1620. [CrossRef]
  25. Rudawska, A.; Danczak, I.; Müller, M.; Valasek, P. The effect of sandblasting on surface properties for adhesion. Int. J. Adhes. Adhes. 2016, 70, 176–190. [Google Scholar] [CrossRef]
  26. Bresson, G.; Jumel, J.; Shanahan, M.E.; Serin, P. Strength of adhesively bonded joints under mixed axial and shear loading. Int. J. Adhes. Adhes. 2012, 35, 27–35. [Google Scholar] [CrossRef]
  27. Balza, J.C.; Zujur, D.; Gil, L.; Subero, R.; Dominguez, E.; Delvasto, P.; Alvarez, J. Sandblasting as a surface modification technique on titanium alloys for biomedical applications: Abrasive particle behavior. IOP Conf. Ser. Mater. Sci. Eng. 2013, 45, 012004. [Google Scholar] [CrossRef]
  28. Isa, M.R.; Zaroog, O.S.; Yunus, M.A.; Bavu, V.R.S.; Rosmi, N. Effect of Sandblasting Process on Mechanical Properties of ASTM A516 Grade 70 Steel. Key Eng. Mater. 2018, 765, 222–226. [Google Scholar] [CrossRef]
  29. Ourahmoune, R.; Salvia, M.; Mathia, T.G.; Berthel, B.; Fouvry, S.; Mesrati, N. Effect of sandblasting substrate treatment on single lap shear strength of adhesively bonded PEEK and its composites. In Proceedings of the ICCM International Conferences on Composite Materials, Jeju, Korea, 21–26 August 2011; pp. 2–7. [Google Scholar]
  30. Tshimanga, N.L.; Combrink, G.A.; Kalenga, M.W. Surface morphology characterization of grade 304L stainless steel after abrasive blasting. Mater. Today Proc. 2021, 38, 544–548. [Google Scholar] [CrossRef]
  31. Company, N.T.R. Walnut Shell Abrasive. 2022. Available online: https://www.ntruddock.com/walnut-shells/ (accessed on 8 March 2022).
  32. Salmah, H.; Marliza, M.; Teh, P.L. Treated coconut shell reinforced unsaturated polyester composites. Int. J. Eng. Technol. 2013, 13, 94–103. [Google Scholar]
  33. De Castro, A.L.P.; Serrano, R.O.P.; Pinto, M.A.; da Silva, G.H.T.; Ribeiro, L.D.A.; Viana, E.M.D.F.; Martinez, C.B. Case study: Abrasive capacity of Limnoperna fortunei (golden mussel) shells on the wear of 3 different steel types. Wear 2019, 438–439, 202999. [Google Scholar] [CrossRef]
  34. Tatmetal. Tatmetal. Galvanized Steel Sheet. In Met. Finish. 2000. 2000. Available online: https://www.tatmetal.com/uploads/file/de568a07be649d47ea70428eb0e5461b-1598255511297.pdf (accessed on 1 March 2022).
  35. A&B Deburring, Corn Cob & Walnut Shell Media. 2022. Available online: https://abdeburr.com/corn-cob-walnut-shell/ (accessed on 1 January 2022).
  36. EL-Soaly, I.S. Some physical and mechanical properties of olive fruits in (Ryayna-Khrian-Libyan Arab). Misr. J. Agric. Eng. 2008, 25, 899–909. [Google Scholar]
  37. BS EN ISO 21920-2; Geometrical Product Specifications (GPS). Surface Texture: Profile. Part 2, Terms, Definitions and Surface Texture Parameters. British Standard: London, England, 2021.
  38. Amaral, R.; Özcan, M.; Bottino, M.A.; Valandro, L.F. Microtensile bond strength of a resin cement to glass infiltrated zirconia-reinforced ceramic: The effect of surface conditioning. Dent. Mater. 2006, 22, 283–290. [Google Scholar] [CrossRef]
  39. Moravej-Salehi, E.; Valian, A. Surface topography and bond strengths of feldspathic porcelain prepared using various sandblasting pressures. J. Investig. Clin. Dent. 2016, 7, 347–354. [Google Scholar] [CrossRef]
  40. Tzanakakis, E.-G.C.; Tzoutzas, I.G.; Koidis, P.T. Is there a potential for durable adhesion to zirconia restorations? A systematic review. J. Prosthet. Dent. 2016, 115, 9–19. [Google Scholar] [CrossRef]
  41. Blatz, M.B.; Sadan, A.; Kern, M. Resin-ceramic bonding: A review of the literature. J. Prosthet. Dent. 2003, 89, 268–274. [Google Scholar] [CrossRef] [Green Version]
  42. Dds, C.J.S.; Dds, P.V.S.; Dds, J.C.P.; Dds, R.B.F. Surface Treatment Protocols in the Cementation Process of Ceramic and Laboratory-Processed Composite Restorations: A Literature Review. J. Esthet. Restor. Dent. 2005, 17, 224–235. [Google Scholar] [CrossRef]
  43. Bektaş, B.S.; Samtaş, G. Optimization of Cutting Tool Wear When Milling 6061-T651 Aluminum Alloy with Coated Inserts. Düzce Univ. J. Sci. Technol. 2022, 10, 641–651. [Google Scholar]
  44. Aydin, M.; Yapan, Y.F.; Türköz, M. Ultra Yüksek Basinçta Çalişan Kalin Cidarli Silindirlerin Tasarimina Etki Eden Parametrelerin Sayisal Ve Analitik Olarak Araştirilmasi. Konya J. Eng. Sci. 2022, 10, 412–424. [Google Scholar] [CrossRef]
Figure 1. Walnut shell, olive pomace and mussel shell powders.
Processes 11 01925 g001
Figure 2. Interaction effect plots for S/N rations (a) and main (b) for larger is better.
Processes 11 01925 g002
Figure 3. Interaction effect plots for S/N rations (a) and main (b) for smaller is better.
Processes 11 01925 g003
Figure 4. Comparison of experimental results with predicted values.
Processes 11 01925 g004
Figure 5. Surface images of samples after abrasive blasting.
Processes 11 01925 g005
Table 1. Chemical composition of steel (% by weight).
CMnPSSiTiBalance
0.181.20.120.0450.50.3Fe
Table 2. Mechanical properties of steel.
Hardness (HRB)Yield Strength (N/mm2)Tensile Strength (N/mm2)Elongation at Break %
56 31940925
Table 3. The abrasives used for abrasive blasting treatment [33,35].
Abrasive TypeShapeSize (μm)Specific Gravity (g/cm3)Hardness
Mussel shellirregular38–45–632.163.5–4 Mohs
Walnut shellirregular38–45–631.443–3.5 Mohs
Olive pomaceirregular38–45–631.44265.84 [36]
Al2O3Spherical253.999 Mohs
Table 4. Levels of the variables used in the experiment.
Control FactorLevel
IIIIIIUnits
A: Distance51015mm
B: Time102030second
C: Powder TypeMussel shellOlive PomaceWalnut shellnone
D: Grain Size384563micrometer
Table 5. L9 Orthogonal Array.
Exp. NumberDistance (mm)Time (s)Powder TypeGrain Size (µm)Surface Roughness (µm)
1510Mussel shell380.437 ± 0.029
2520O. Pomace450.430 ± 0.027
3530Walnut shell630.433 ± 0.033
41010O. Pomace630.376 ± 0.047
51020Walnut shell380.344 ± 0.058
61030Mussel shell450.468 ± 0.032
71510Walnut shell450.402 ± 0.032
81520Mussel shell630.364 ± 0.038
91530O. Pomace380.436 ± 0.049
Table 6. Response table for S/N ratios for larger is better.
LevelDistanceTimePowder TypeGrain Size
1−7.260−7.866−7.520−7.888
2−8.120−8.459−7.679−7.280
3−7.968−7.023−8.149−8.179
Delta0.8601.4360.6300.899
Rank3142
Table 7. Response table for S/N ratios (smaller is better).
LevelDistanceTimePowder TypeGrain Size
17.2607.8667.5207.888
28.1208.4597.6797.280
37.9687.0238.1498.179
Delta0.8601.4360.6300.899
Rank3142
Table 8. Result of the analysis of variance for larger is better.
SourceDFSeq SSContributionAdj SSAdj MS
Distance20.00250918.70%0.0025090.001254
Time20.00673450.19%0.0067340.003367
Powder Type20.00141610.56%0.0014160.000708
Grain Size20.00275820.56%0.0027580.001379
Error0----
Total80.013417100.00%
Table 9. Result of the analysis of variance for smaller is better.
SourceDFSeq SSContributionAdj SSAdj MS
Distance20.00815133.80%0.0081510.004075
Time20.00603225.02%0.0060320.003016
Powder Type20.0005212.16%0.0005210.000260
Grain Size20.00941039.02%0.0094100.004705
Error0----
Total80.024114100.00%
Table 10. Regression analysis formulation.
Powder TypeFor Larger is BetterR2
Mussel shellRaM: 0.4607 − 0.00329 Distance + 0.00204 Time − 0.00093 Grain Size99.9998
O.PomaceRaP: 0.4516 − 0.00329 Distance + 0.00204 Time − 0.00093 Grain Size99.9998
Walnut shellRaW: 0.4307 − 0.00329 Distance + 0.00204 Time − 0.00093 Grain Size99.9996
For Smaller is BetterR2
Mussel shellRaM2: 0.4607 − 0.00164 Distance + 0.00204 Time − 0.00093 Grain Size99.9999
O.PomaceRaP2: 0.4516 − 0.00164 Distance + 0.00204 Time − 0.00093 Grain Size99.9994
Walnut shellRaW2: 0.4307 − 0.00164 Distance + 0.00204 Time − 0.00093 Grain Size99.9998
Table 11. Prediction and experimental data.
Optimal Control Parameters
PredictionExperimentalError %
Level (larger is better)A1B3C1D2A1B3C1D28.41%
Roughness (Ra)0.5055190.463
Level (smaller is better)A2B2C3D3A2B2C3D32.37%
Roughness (Ra)0.32510.333
Table 12. Surface roughness values of mussel, walnut and Al2O3.
Distance (mm)Time (s)Powder TypeGrain Size (µm)Surface Roughness (µm)
530Al2O3251.576 ± 0.26
530Mussel450.463 ± 0.029
1020Al2O3251.556 ± 0.11
1020Walnut630.333 ± 0.045
Disclaimer/Publisher’s Note: The statements, opinions and data contained in all publications are solely those of the individual author(s) and contributor(s) and not of MDPI and/or the editor(s). MDPI and/or the editor(s) disclaim responsibility for any injury to people or property resulting from any ideas, methods, instructions or products referred to in the content.

