Article

3D Imaging of On-Chip Porous Medium Using X-ray Laminography: Application to Reactive Flow Dissolution at Small Scales

1
ICMCB, UMR5026, CNRS, University of Bordeaux, 33600 Pessac, France
2
School of Chemical and Biomolecular Engineering, Georgia Institute of Technology, 311 Ferst Dr NW, Atlanta, GA 30332, USA
3
BRGM, 3 Avenue Claude-Guillemin, BP 36009, CEDEX 2, 45060 Orléans, France
4
European Synchrotron Radiation Facility (ESRF), 38043 Grenoble, France
5
Institut Laue Langevin, 71 av des Martyrs, 38042 Grenoble, France
*
Authors to whom correspondence should be addressed.
Processes 2023, 11(7), 1981; https://doi.org/10.3390/pr11071981
Submission received: 24 May 2023 / Revised: 16 June 2023 / Accepted: 28 June 2023 / Published: 30 June 2023
(This article belongs to the Section Materials Processes)

Abstract

:
In this study, X-ray laminography is used to monitor the evolution of a model 3D packed bed porous medium on a chip (micromodels) undergoing reactive flows. The obtained 3D images are used to compute the fluid flow patterns and develop insights into dissolution mechanisms. This study is a first proof of concept study, with controlled micromodels, and could later be extended towards deeper understanding of the dissolution and precipitation processes occurring in porous media at the microscale, mechanisms which are relevant to many industrial areas including catalysis, geochemistry, energy, and waste storage in deep geological formations, etc.

1. Introduction

The study of multiphase reactive flow in porous media is highly relevant to several deep underground-related studies such as carbon geological storage, petroleum engineering, waste, and energy storage. In such topics, most of phenomena start from processes occurring at the pore scale (mass and heat transfer, precipitation/dissolution mechanisms, wettability, biofilm formation, reactive surface). Therefore, pore-scale experiments are critical for understanding the overall behavior of underground reservoirs subjected to anthropic activities. To investigate reactive flows in porous media, core-scale experiments are mostly considered [1,2,3,4,5]. Indeed, they are representative of the real geo-flow chemistry for a specific location. When coupled with characterization via X-rays tomography, it is possible to monitor the evolution of transient porous media characteristics in reactive flow conditions [6,7,8,9,10,11]. These experiments have been used for decades in particular by the petroleum industry to access important information on porosity, relative permeability, capillary pressure, chemistry, wettability and electrical properties of reservoirs.
However, while this is important in view of getting knowledge on a specific site, the complex mineralogy and geometry of real core samples sometimes prevent us from gaining a deep understanding of the general physico-chemical mechanisms involved in reactive fluid flows in porous media.
Therefore, complementary approaches have been considered with the use of a simpler artificial porous medium, whose geometries and chemistries can be controlled. To do so, researchers have considered micromodels, which have either a 2D or 3D configuration of a porous medium on a chip, which have been largely been employed for understanding the general physics involved in multiphase fluid flows in pores [12].
Recent advances in microfluidics have made it possible to manufacture microreactors capable of withstanding high pressure and high temperature conditions, with designs suitable for reproducing the physical conditions and behaviors of geological reservoirs (porosity, permeability, heterogeneity, etc.) [13,14], known as Geological labs on chips (GLoCs). In particular, GLoCs provide new opportunities to analyze the mechanisms involved in various underground fluid flows at the pore scale [15]. These micromodels have mostly been used to investigate and quantify drainage and imbibition processes through direct optical imaging [13], as well as reactive flow studies considering either chemistry [16,17,18,19,20], mineral precipitation/dissolution processes [21,22,23], or biofilm formation [24,25,26,27]. Such tools are also useful for the determination of the inherent thermodynamic properties of fluid systems [28], especially carbon dioxide solubility in water and brine at elevated pressures and temperatures through Raman spectroscopy [29].
However, most GLoCs do not integrate geochemical effects, as they are generally manufactured from polymers or glasses. Nevertheless, technological developments have been made to address these limitations by (i) depositing reactive minerals directly on the originally inert inner surfaces of the micromodels [30,31,32,33], (ii) manufacturing devices directly from the minerals (chip off the rocks) [23,34,35] or (iii) generating unconsolidated packed beds of realistic particulate minerals in microchannels [36,37,38], resulting in flat 3D reactive porous media (the depth being much smaller than the other dimensions) made of stacked particles. Such strategies are essential to account for geochemical phenomena (dissolution, precipitation) that can occur with reactive flow in porous media.
Despite undeniable advantages compared to non-reactive micromodels, such as the reactivity and integration of realistic mineralogy, the implementation of optical in situ characterization is not easy, depending on the considered geo-minerals—and their opacity—preventing light (UV to IR) penetration into the porous medium. Hence, conventional optical microscopes are typically used to observe reactive flows in porous medium mostly visualize the surface of the packed beds—and thus provide 2D information—or are used to study single particle precipitation/dissolution [39].
To address these limitations, X-ray imaging may be considered, similar to core-scale or packed bed column experiments [40,41,42,43,44,45]. In particular, X-ray laminography, which is derived from more classical X-ray tomography, but was specifically developed to image flat objects, appears to be a suitable strategy to address these difficulties [46]. It offers a high spatial resolution when synchrotron lights are used, which is driven by the energy flow and the geometric nature of the beam, scintillator efficiency, number of camera pixels, or the absorption coefficient of chemical elements of the reactor and the object to be imaged [47]. It allows acquisition with a pixel size as small as 100 nm (nano-laminography [48]) using synchrotron X-ray sources, while other recent studies have reported the use of conventional Computed Tomography (CT) scanning, with lower resolutions at the laboratory scale [49].
In this paper, we demonstrate the proof of concept for the implementation of X-ray laminography for 3D imaging of a reactive porous media on a chip. We study reactive flows in 3D unconsolidated porous media recreated in microchannels by monitoring the evolution of the porous medium structure after its exposure to several injections of a reactive solution (out of equilibrium). We first discuss the 3D micromodel fabrication, along with the strategy employed to form a 3D consolidated packed bed. CaCO3 microparticles were considered as a model system to evaluate the dissolution processes under the flow conditions. Then, we detail the protocol employed at the European Synchrotron Radiation Facility (ESRF) to image in 3D the evolution of the porous medium along with the experimental set-up. Finally, we present and discuss the 2D and 3D images obtained by X-ray laminography for qualitative study of dissolution mechanisms.

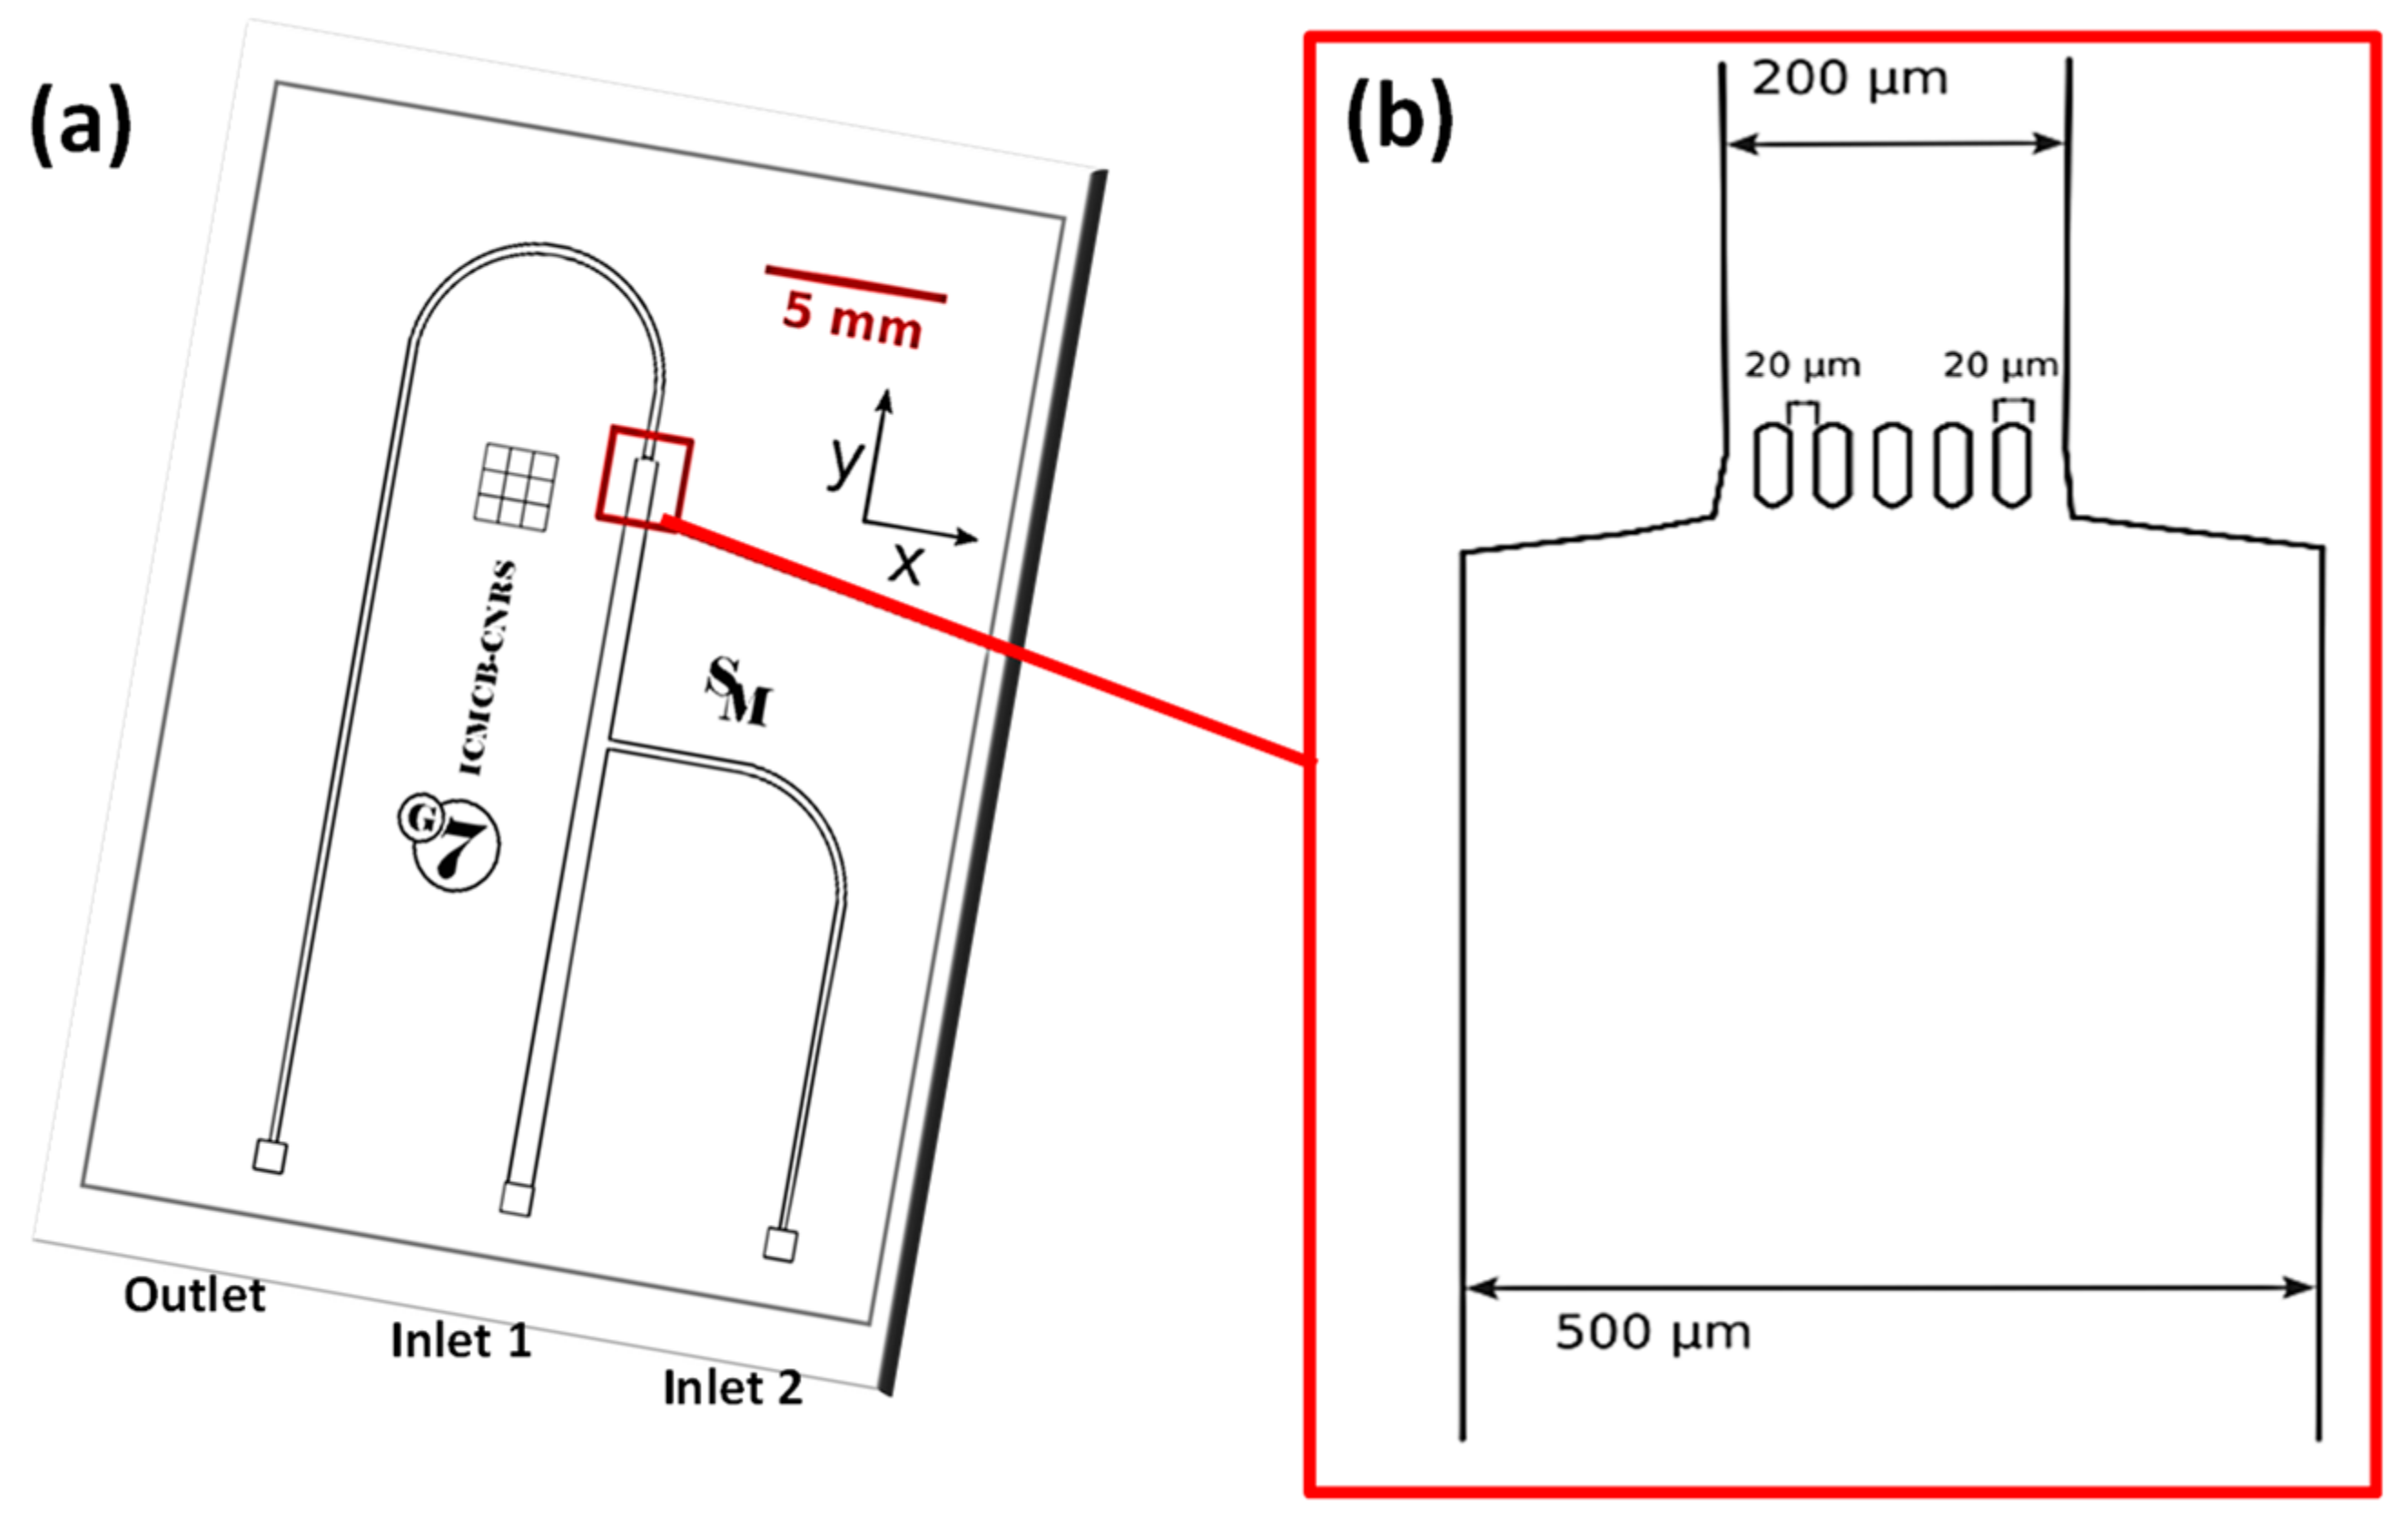
2. Materials and Methods

A specific design was developed to recreate an unconsolidated packed bed of reactive minerals inside a microfluidic channel. We chose the silicon/Pyrex microreactor, as it was previously demonstrated to be compatible with X-ray analyses, providing sufficient transparency [50]. Additionally, these microdevices are optically semi-transparent to control the particle loading procedure, exhibit good chemical compatibility with most solvents, and are capable of operating under harsh environmental conditions, such as high pressure and temperature [13,14]. The classical microfabrication procedure includes photolithography on a silicon wafer, etching to extrude the 2D design in the third dimension, and anodic bonding of the silicon wafer to a Pyrex cover to seal the microchannel (see ESI—Figure S1).
Design of the microreactor. The microreactor was designed to recreate a 3D packed bed of unconsolidated reactive minerals inside the microchannel and ensure good flow through the packed bed is maintained (Figure 1a,b). The designed micromodel consists of a main channel to contain the 3D packed bed of CaCO3 particles. The width of the main channel (500 µm) aids the packing process without causing an excessive pressure drop. The channel depth (30 µm) was chosen to obtain a controlled number of stacked CaCO3 particle layers (typically ≈ 5, depending on particle sizes and packing). The main channel is terminated with a restriction (200 µm wide) and a microfilter consisting of rectangular posts—20 μm wide-separated by ≈15–20 μm, to retain the CaCO3 particles in the main channel during fluid injection. A side channel was incorporated for the injection of the reactive solution. The microreactor is connected to the external fluidic system using a compression part previously described [14]. Fluids were injected with a PHD Ultra Syringe Pump from Harvard Apparatus. The set-up allows the injection of both particle suspensions and fluids up to 130 bar.
Packed bed construction. CaCO3 was chosen as a model system for this proof of concept, being representative of limestone rocks. CaCO3 particles with a mean size of 30 µm (Sigma Aldrich) were suspended in deionized (DI) water to reduce their size by dissolution and to saturate the aqueous phase following the equilibrium equation [51]:
CaCO 3   s     Ca aq 2 + + CO 3   aq 2   ( K S = 4.3 · 10 9 )
1 g of CaCO3 was mixed with 500 mL of DI water and stirred for 48 h with an orbital shaker (Edmund BuelherTM). The mean size of the recovered particles was ≈ 7 µm, with a rather wide particle size distribution (see Supplementary Material ESI—S4), and the saturated solution (supernatant) was collected for preparing a reactive solution (see Supplementary Material ESI—S2). An amount of 0.3 g of the recovered CaCO3 particles were suspended in 10 mL of the saturated solution (i.e., 1:100 v/v) and injected into the microsystem at a flowrate of 100 µL·min−1 through inlet 1, while inlet 2 was kept closed. The concentration of CaCO3 particles in the suspension was purposefully kept low to avoid any clogging in the injection system before the particles reached the gap filter at the end of the 500 µm-wide channel of the microreactor. The injection system was agitated with an orbital shaker to avoid any sedimentation of the particles in the syringe (see Supplementary Material ESI—S3).
As the solution flowed through the main channel, the CaCO3 particles were stopped by the rectangular plots and strongly packed due to the pressure drop generated by the increasing accumulation of the particles inside the microchannel (up to 100 bar @ 100 µL·min−1). The filling procedure was stopped when the length of the packed bed reached ≈ 1 mm (Figure 2). As seen, the observations in 2D from the top of the microreactor shows the non-transparency to visible light of the generated particle packed bed.
Then, the evolution of the packed bed in “reactive flow” was characterized using X-Ray Laminography at beam line ID19 at ESRF.
Experimental setup and procedure at ESRF. To prepare a model reactive solution, we used 5 mL of the saturated CaCO3 solution acidified by adding 32 µL of sulfuric acid (6.4 · 10−4 mol). The solution was injected through the 3D porous medium using a Valco 6 port valve coupled to a sample loop (Figure 3). In position A, a syringe pump was used to fill a tubing loop with the reactive solution, while the microreactor is flushed with the CaCO3-saturated solution in equilibrium at 20 µL·min−1. In position B, a known volume of reactive solution (200 µL) was injected into the microchannel, before switching back to the equilibrium solution to quench the dissolution process. The effect of the reactive solution passing through the packed bed was monitored by scanning the model porous medium between each injection of reactive fluid.
While flowing the reactive solution through the porous medium, the following CaCO3 dissolution process occurs [52]:
CaCO 3   s + 2   H 3 O   aq +   Ca aq 2 + + CO 2   aq + 3   H 2 O  
To perform the 3D imaging acquisition, the system assembly (microreactor + compression part + valve) was then transferred to the acquisition room for X-ray irradiation. A first acquisition was taken before any injection to characterize the initial structure of the packed bed. Then, X-ray laminography imaging was performed between each injection. To perform the acquisition, the microreactor was first tilted at an angle of 62.6°, while a monochromatic parallel X-ray beam irradiated the sample with an energy of 26 keV. The tilt angle θ of the rotation axis was performed by a simple wedge mounted on a goniometer by which the exact tilt angle can be adjusted [47].

3. Results and Discussions

From the acquired laminographic data, 3D images of the packed bed were first reconstructed (Figure 4a), from which 2D X-Y images can be extracted at different z positions (Figure 4b). The pixel size is equal to 0.65 µm and each X-Y slice (top view) contains 1920 × 1920 pixels. The 3D reconstruction also permitted access to a cross-sectional view of the packed bed in the z direction (Y-Z plane), as shown in Figure 4c (taken along the red line displayed in Figure 4b. As expected, an average of 4–5 layers of CaCO3 particles were packed inside the microchannel in a random manner (heterogeneous packed bed). It can be noticed that the porous medium is relatively heterogeneous due to the non-homogeneity of the size of the CaCO3 particles (see Supplementary Material ESI—S4).

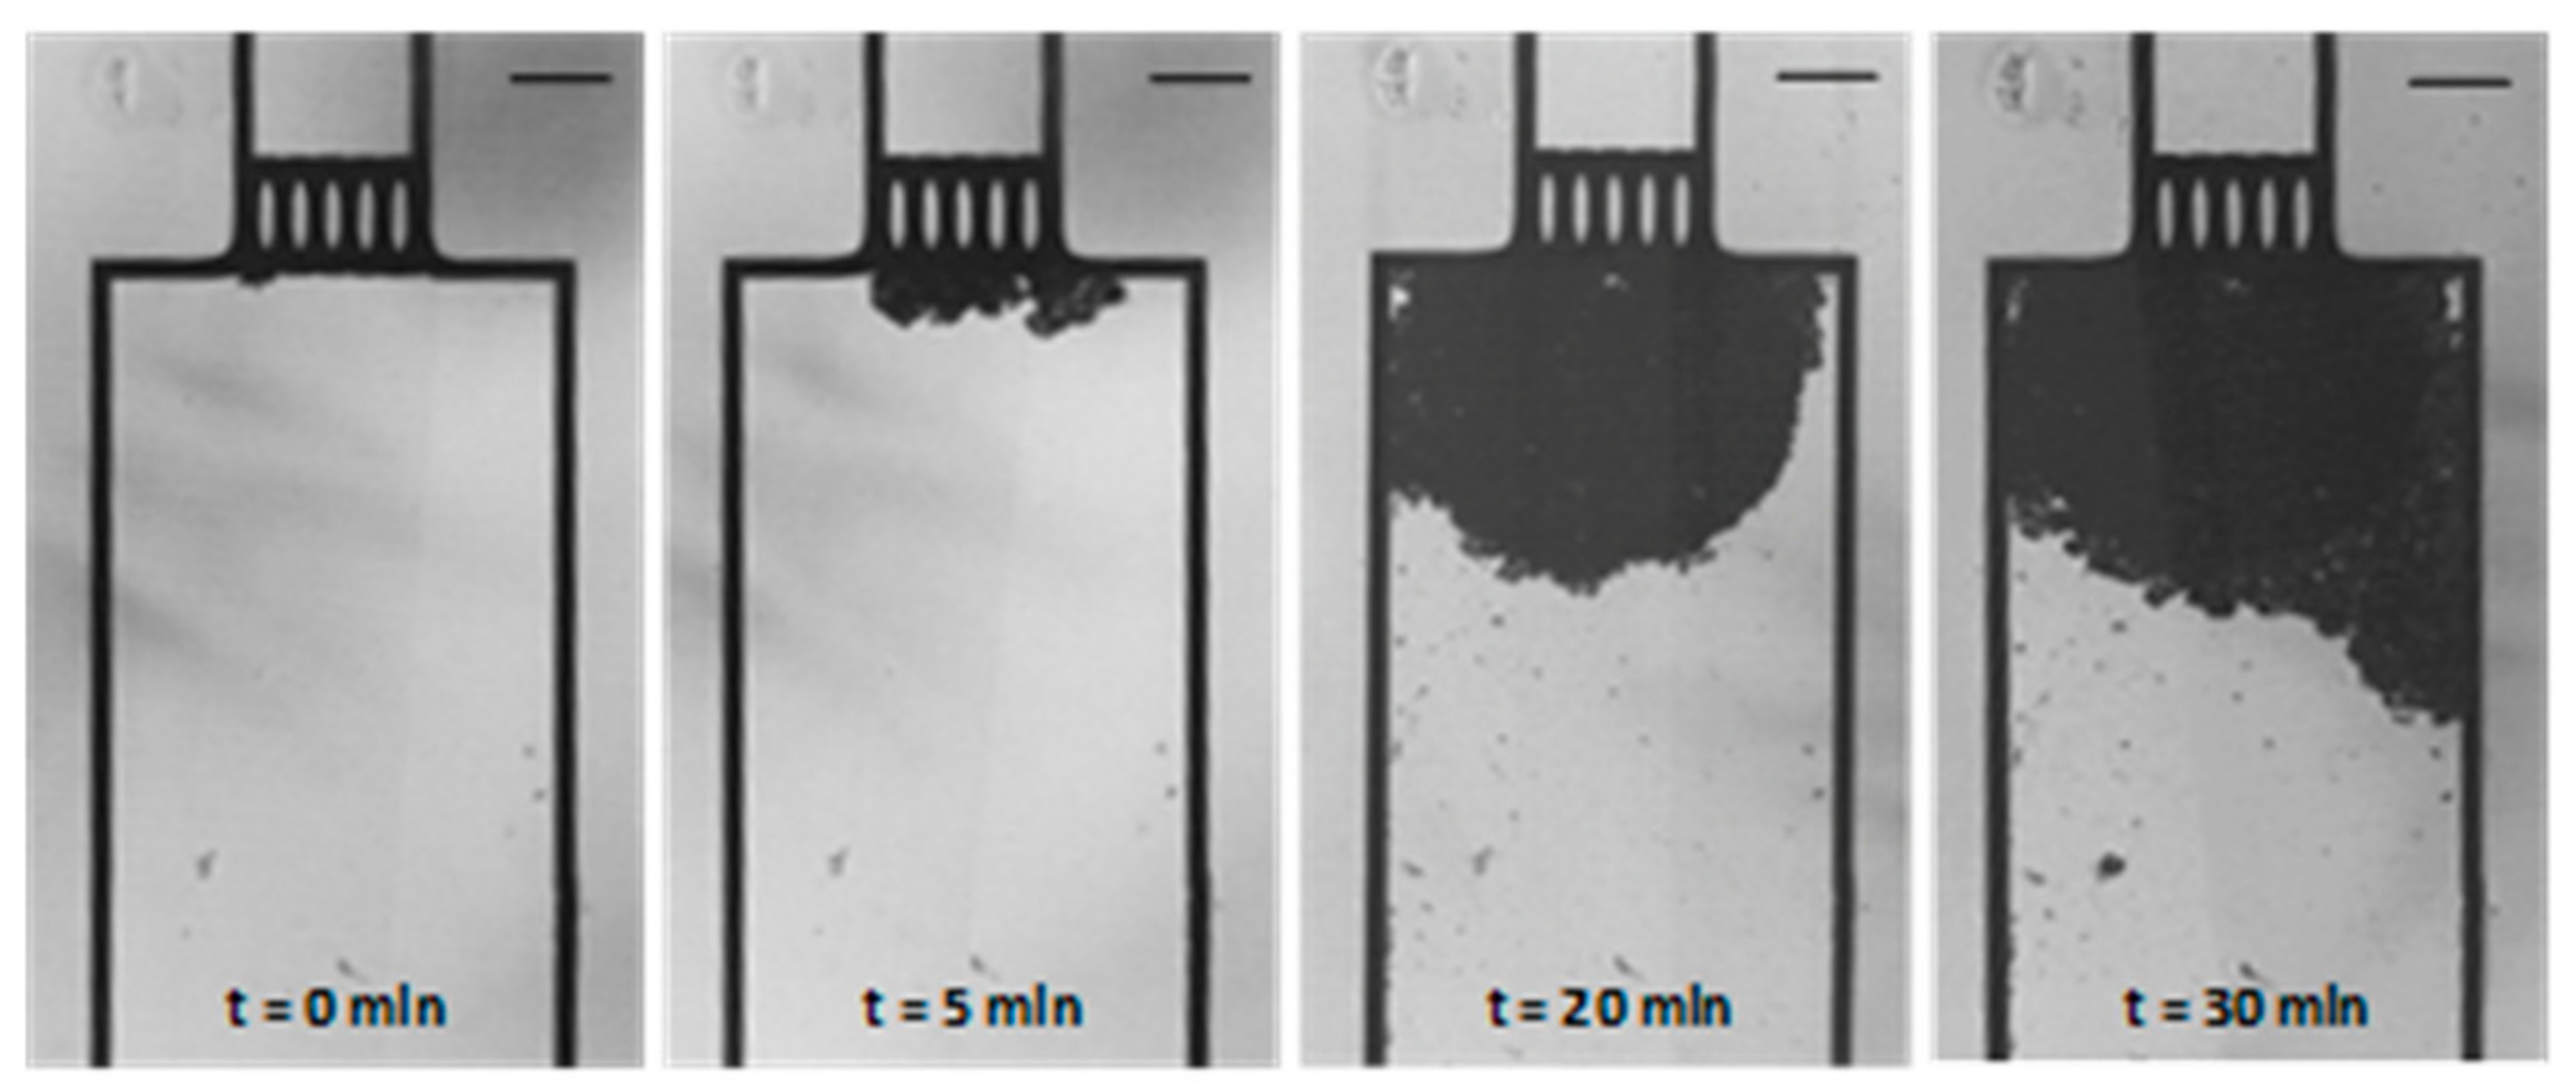
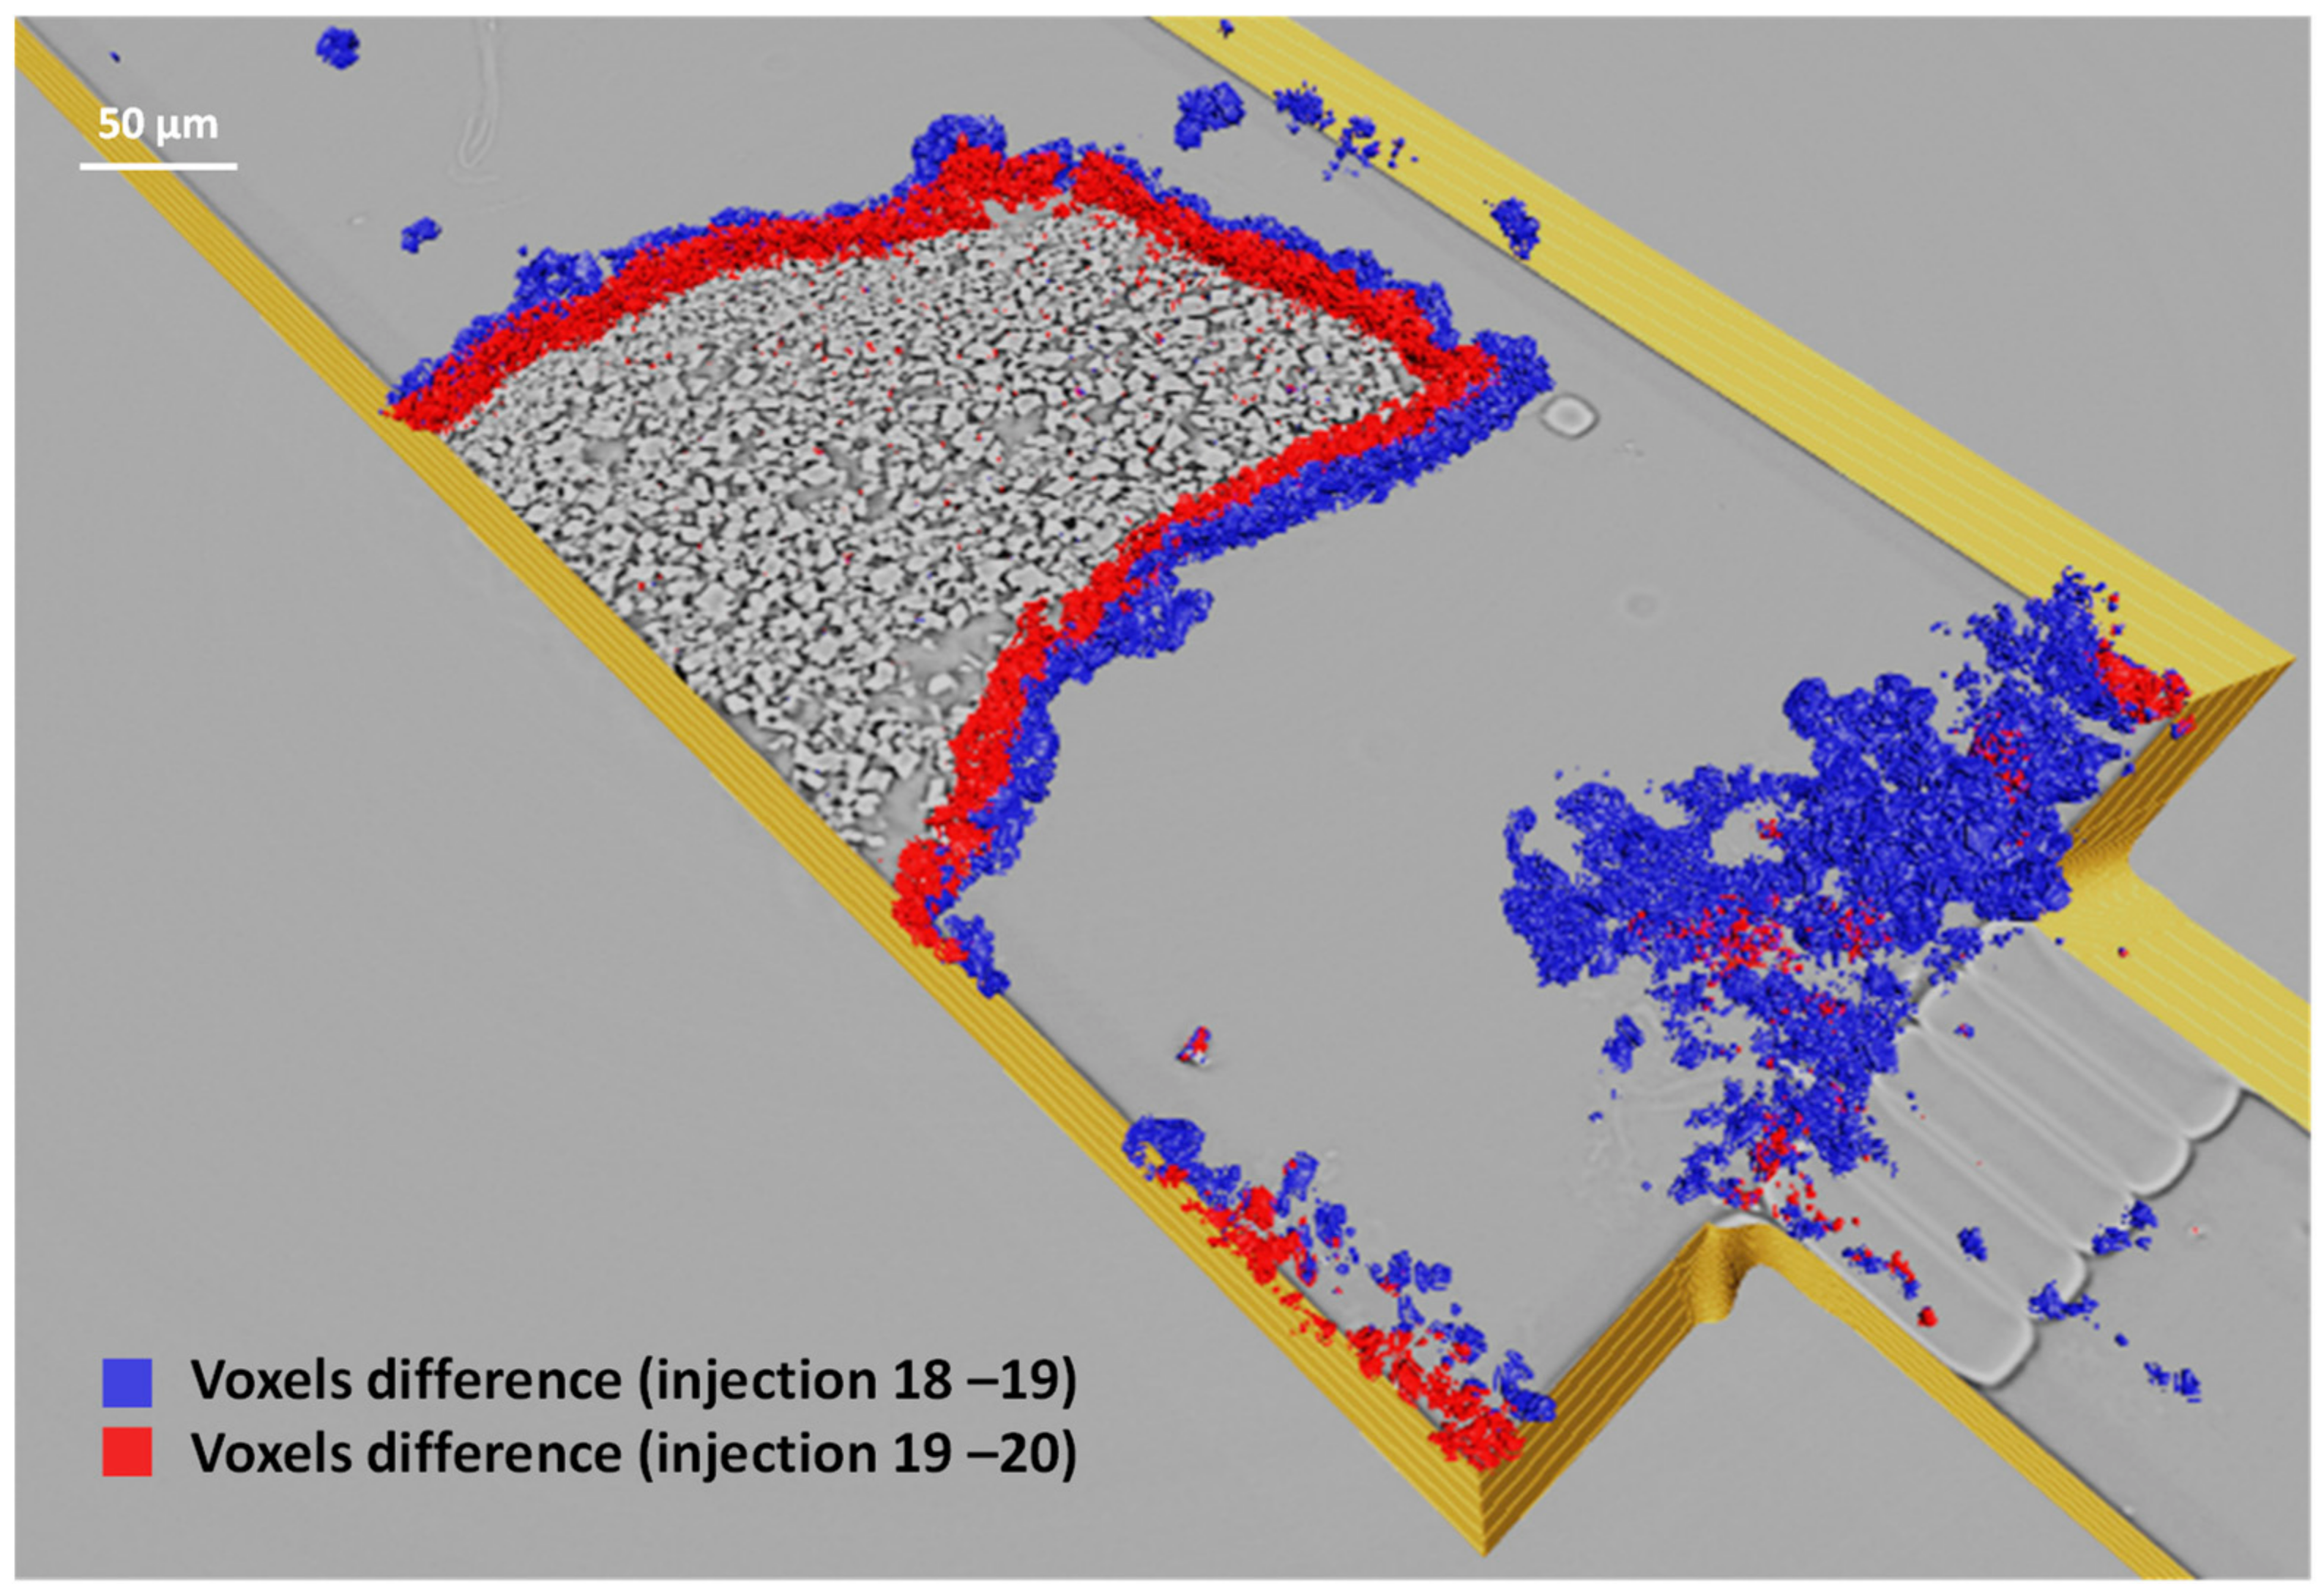
3.1. Evolution of the Porous Medium during the Dissolution Process

As described, X-ray laminography scans were taken in between each reactive fluid injection. As an example, Figure 5 presents two typical 2D images extracted from the reconstructed 3D image and acquired after Figure 5a 3 injections and Figure 5b 17 injections, respectively. The initial heterogeneity of the porous medium caused preferential fluid flow inside the porous medium, which resulted in two primary effects: (i) a heterogeneous dissolution of the porous medium leading to the disappearance of CaCO3 particles in specific areas of the packed bed (see Figure 5b, blue circles) and (ii) a local displacement of some non-dissolved particles with the flow (see Figure 5b, red circle), which is induced by the dissolution of other particles in this unconsolidated packed bed configuration.
To qualitatively determine the preferential dissolution behavior, we specifically focused on situations encountered when (i) a preferential flow happens and (ii) no particle displacement can be noticed, to simplify the data processing. Thus, we have further analyzed in detail the 3D images obtained between injection number 18 and number 20 (three injections). After the acquisition of the 3D images, by subtracting the volume occupied by the CaCO3 particles inside the porous medium (quantified in numbers of voxels) in between two successive stages, it is possible to access the volume of particles dissolved between each reactive fluid injection (Figure 6). Since the dissolution is quite homogeneous around the residual porous medium, we could therefore assume that this trend is caused by a diffusion-driven dissolution mechanism. It is therefore critical to be able to calculate the local fluid flow pattern and velocities to estimate the relative importance of the convective to diffusive dissolution processes.

3.2. Mass Balance Estimation

Based on the 3D figures, it is possible to back calculate the dissolved volume after the injection of the reactive solution. A rough calculation gives volumes differences of 171 µm3 and 192 µm3 between injections 18–19 and injections 19–20, respectively. These volumes correspond to the dissolved weights of CaCO3 of 0.466 ng and 0.52 ng, respectively, assuming a CaCO3 density of 2.71 g.cm−3.
The associated numbers of dissolved moles of CaCO3 are then: 4.66 pmol and 5.23 pmol, respectively (MCaCO3 = 100 g.mol−1).
Based on (Equation (2)), 2 moles of H3O+ are needed to dissolve 1 mol of CaCO3. This means that, ideally, 4.66 × 2 = 9.32 pmol and 5.23 × 2 = 10.46 pmol of H3O+ would be required.
Each injection of reactive fluid (20 µL) of a solution at a concentration of 0.119 M in H2SO4 represents 2.39 µmol of injected H2SO4 per injection, and thus 4.78 µmol of H3O+. This means that due to high flowrates and local velocities, most of the injected acidic solution does not react with the porous medium and just passes by. It is therefore interesting to determine the local flow pattern in the considered geometry.

3.3. Reactive Fluid Flow Pattern

Based on the 3D reconstructed images, a good estimation of the real porous medium geometry is accessible. These data can then be used to back calculate the fluid flow pattern inside the porous medium [53].
Computation was performed by using a code developed in-house that solves Stokes equations on an anisotropic regular Cartesian grid. Working with an anisotropic grid is particularly well adapted to flat geometries like the one considered here. Furthermore, it allows anisotropic sub-sampling when computation on the full resolution grid is too demanding and not strictly necessary. Indeed, here the initial grid of 2940 × 830 × 45 voxels was reduced to 1470 × 415 × 17 voxels.
A finite volume scheme with staggered grids combined with an artificial compressibility approach lead to an estimation of the velocity and pressure fields on each voxel of the fluid phase. Applied boundary conditions were the periodicity for the fluid velocity in the direction of the flow, no flow through the other limits, the imposed fluid flux at the inlet of the computation domain, and the imposed pressure at the outlet.
Figure 7a presents the calculated fluid flow pattern in 3D inside the packed bed porous medium after injection number 19, while Figure 7b is a 2D view of Figure 7a taken at a z equal to half the depth of the microchannel for an easier visualization. Note that Figure 7a was intentionally dilated in the z dimension (not to scale) to facilitate visualization of the porous medium, which is the reason why the packed particles seem elongated in the z dimension.
As seen in Figure 7, the non-homogenous repartition of the particles inside the microchannel after 17 injections leads—as expected—to a non-uniform fluid flow and preferential pathways, especially near one of the walls. The fluid local velocity varies drastically depending on the position inside the microchannel.
Such velocity variations should theoretically drive the local dissolution efficiency. Indeed, convection, diffusion, and dissolution mechanisms occur at the same time. At low velocities, such as inside the remaining porous medium (green circle area on Figure 7b), the solution is quickly at equilibrium with the solid and the dissolution is inhibited within the porous zone. Meanwhile, at high fluid velocities, such as around the remaining porous medium (red circle area on Figure 7b), the solution composition is almost unchanged, as a reaction with the solid is limited by the distance to the interfaces. To achieve deeper insights into the dissolution mechanism, we computed the modulus of the velocity vectors in the computation domain. Figure 8 shows isovalue lines in the mid-section along with the dissolved area between injection 19 and 20. Following the green arrow, the fluid velocity increases from 0.01 m·s−1 (grey isovalue line) to 0.20 m·s−1 (red isovalue lines). Conversely, the fluid velocity values inside the porous medium are rather constant and below 0.005 m·s−1.
To interpret the observed dissolution pattern, we first compare the magnitude of the reactive species transport by convection (VC) and by diffusion (D.∇C) at a distance L from the porous zone. At the fluid–solid interface, due to the fast dissolution reaction, the concentration is equal to zero, and, considering D = 9.0 · 10−9 m2·s−1 (typically the diffusion coefficient for H3O+ cations in water at 25 °C and 1 atm), we obtained the following expression for the diffusive flux:
D · C     D · C 0 L = 9.0 · 10 9   C L  
For a velocity of 0.01 m·s−1 (for instance those flowing around the porous zone in Figure 8), the distance for which diffusive and convective fluxes are equal is L = 0.9 µm, meaning that diffusion is very efficient at the pore (few pixel) scale.
Based on these considerations, we can hypothesize the following scenario for the dissolution process:
A fluid-controlled volume arriving at the bottom right corner of the porous medium (Figure 8a-1) will lose its reactive constituents by diffusion towards the solid porous medium, where the dissolution reaction occurs. It will then move along the edge of the porous medium and will regain reactive constituents by diffusion from the areas to the right, which are more rapidly supplied by convection, as shown by the high fluid velocity gradient in this area. When entering the “bay” (Figure 8a-2), there is no more reload and therefore no dissolution, as exemplified by the absence of red CaCO3 particles in this area. At the angle (Figure 8a-3) the velocity gradient is very large and so is the dissolved area. The dissolution is greater in the upper zone (Figure 8a-4) as well as at the top part of the left boundary. However, further down (Figure 8a-5), the reloading is limited (due to a decrease of the velocity gradient) and therefore the dissolution process is limited also. Overall, the reactions always take place at the edge of the porous medium in a homogeneous way, whatever the fluid flows experienced by the edge. Hence, we can conclude that the dissolution process is not driven by convection.
It is also important to mention that there is no dissolution in the porous medium as the fluid quickly returns to equilibrium (a fraction of a pixel) after having reacted with CaCO3 on the surface of the porous medium, therefore causing the absence of reactants for further dissolution.

4. Conclusions

The evolution of a 3D reconstructed porous medium in the presence of several reactive fluid injections was monitored using X-ray Laminography in a silicon-Pyrex micromodel. We have demonstrated that this imaging technique is well adapted to such investigations, providing high-resolution 3D images (down to 0.7 µm) for further reactive fluid flow modelling at the pore scale. These experimental data are helpful for validating reactive flow models in porous structures. By monitoring the 3D reactive porous medium on a chip, we have shown that the dissolution process is mostly diffusion-driven in highly reactive carbonate minerals. Some heterogeneities in the packed bed, which have generated non-homogeneous fluid flow patterns, allowed us to show that the reactive fluid quickly returns to equilibrium upon reaction with the reactive particles. Therefore, dissolution via a diffusive mechanism is favored rather than convection at the pore scale for sub-micrometer characteristic lengths.
Although the experiments were conducted at ambient pressure and temperature conditions, future work will consider high pressure conditions more representative of deep geological environments, thanks to the mechanical resistance of Si-Pyrex microreactors [15]. Besides, the recent development of sapphire microreactors [54] could extend even more the possible range of pressure/temperature for experimentation. Temporal monitoring of porous medium characteristics as a function of the local concentrations, pressure, and temperature conditions can provide important information concerning the coupling effect of dissolution and precipitation mechanisms at the pore scale. Specifically, such experimental approaches could be coupled to numerical modeling [55] to predict the effects of a local loss of injectivity or preferential pathways due to reactive dissolution and precipitation, which may be encountered in the CO2 geomineralization processes [56]. Similarly, we have demonstrated this proof of concept with size-calibrated calcium carbonate packed beds, which are reactive when exposed to non-equilibrium fluids. Other materials could also be considered, along with a controlled heterogeneity of permeation for developing “on demand” models of reactive 3D porous media (silicates, basalts, etc.) [36]. This could aid in the optimization of deep underground processes which result from reactive injections in geological reservoirs (CO2 geological storage, energy storage, etc.), depending on their mineralogy, which is a fingerprint exclusive to each geological formation.

Supplementary Materials

The following supporting information can be downloaded at: https://www.mdpi.com/article/10.3390/pr11071981/s1. Reference [57] are cited in the supplementary materials.

Author Contributions

Conceptualization, S.M. (Samuel Marre) and D.B.; methodology, S.M. (Samuel Marre), S.M. (Sandy Morais), D.B. and L.H.; software, D.B. and L.H.; validation, D.B. and S.M. (Samuel Marre); formal analysis, D.B. and L.H.; data acquisition, C.L., G.P., G.A., O.N., Y.G., S.M. (Sandy Morais), S.M. (Samuel Marre), D.B. and L.H.; writing—original draft preparation, S.M. (Sandy Morais) and S.M. (Samuel Marre); writing—review and editing, S.M. (Sandy Morais), S.M. (Samuel Marre), D.B., C.L., A.C., E.V., Z.S.C., G.P. and M.A.; supervision, S.M. (Samuel Marre), D.B. and A.C.; funding acquisition, Y.G., D.B., S.M. (Samuel Marre) and M.A. All authors have read and agreed to the published version of the manuscript.

Funding

This research was funded by the French National Research Agency (ANR) with the project CGSμLab (reference: ANR-12-SEED-0001). This work has also received funding from the European Research Council (ERC) under the European Union’s Horizon 2020 research and innovation program (Grant Agreement No. 725100, project BIG MAC).

Data Availability Statement

The datasets used and/or analyzed during the current study are available from the corresponding author on reasonable request.

Acknowledgments

The authors are grateful to Fabien Palencia and Abdou Diouf for help with images processing and helpful discussions during the interpretation of the results. The authors also acknowledge the European Synchrotron Radiation Facility (ESRF) for the provision of their synchrotron radiation facilities under the proposal number EV132 for laminography acquisitions on beamline ID19.

Conflicts of Interest

The authors declare no conflict of interest.

References

  1. Dawson, G.K.W.; Pearce, J.K.; Biddle, D.; Golding, S.D. Experimental Mineral Dissolution in Berea Sandstone Reacted with CO2 or SO2–CO2 in NaCl Brine under CO2 Sequestration Conditions. Chem. Geol. 2015, 399, 87–97. [Google Scholar] [CrossRef] [Green Version]
  2. Falcon-Suarez, I.; Papageorgiou, G.; Chadwick, A.; North, L.; Best, A.I.; Chapman, M. CO2-Brine Flow-through on an Utsira Sand Core Sample: Experimental and Modelling. Implications for the Sleipner Storage Field. Int. J. Greenh. Gas Control 2018, 68, 236–246. [Google Scholar] [CrossRef]
  3. Huq, F.; Haderlein, S.B.; Cirpka, O.A.; Nowak, M.; Blum, P.; Grathwohl, P. Flow-through Experiments on Water–Rock Interactions in a Sandstone Caused by CO2 Injection at Pressures and Temperatures Mimicking Reservoir Conditions. Appl. Geochem. 2015, 58, 136–146. [Google Scholar] [CrossRef]
  4. Peng, C.; Crawshaw, J.P.; Maitland, G.C.; Trusler, J.P.M. Kinetics of Calcite Dissolution in CO2-Saturated Water at Temperatures between (323 and 373) K and Pressures up to 13.8 MPa. Chem. Geol. 2015, 403, 74–85. [Google Scholar] [CrossRef] [Green Version]
  5. Rötting, T.S.; Luquot, L.; Carrera, J.; Casalinuovo, D.J. Changes in Porosity, Permeability, Water Retention Curve and Reactive Surface Area during Carbonate Rock Dissolution. Chem. Geol. 2015, 403, 86–98. [Google Scholar] [CrossRef]
  6. Al-Khulaifi, Y.; Lin, Q.; Blunt, M.J.; Bijeljic, B. Reservoir-Condition Pore-Scale Imaging of Dolomite Reaction with Supercritical CO2 Acidified Brine: Effect of Pore-Structure on Reaction Rate Using Velocity Distribution Analysis. Int. J. Greenh. Gas Control 2018, 68, 99–111. [Google Scholar] [CrossRef]
  7. Khather, M.; Saeedi, A.; Rezaee, R.; Noble, R.R.P. Experimental Evaluation of Carbonated Brine-Limestone Interactions under Reservoir Conditions-Emphasis on the Effect of Core Scale Heterogeneities. Int. J. Greenh. Gas Control 2018, 68, 128–145. [Google Scholar] [CrossRef]
  8. Menke, H.P.; Andrew, M.G.; Blunt, M.J.; Bijeljic, B. Reservoir Condition Imaging of Reactive Transport in Heterogeneous Carbonates Using Fast Synchrotron Tomography—Effect of Initial Pore Structure and Flow Conditions. Chem. Geol. 2016, 428, 15–26. [Google Scholar] [CrossRef] [Green Version]
  9. Menke, H.P.; Reynolds, C.A.; Andrew, M.G.; Pereira Nunes, J.P.; Bijeljic, B.; Blunt, M.J. 4D Multi-Scale Imaging of Reactive Flow in Carbonates: Assessing the Impact of Heterogeneity on Dissolution Regimes Using Streamlines at Multiple Length Scales. Chem. Geol. 2018, 481, 27–37. [Google Scholar] [CrossRef]
  10. Pearce, J.K.; Golab, A.; Dawson, G.K.W.; Knuefing, L.; Goodwin, C.; Golding, S.D. Mineralogical Controls on Porosity and Water Chemistry during O2-SO2-CO2 Reaction of CO2 Storage Reservoir and Cap-Rock Core. Appl. Geochem. 2016, 75, 152–168. [Google Scholar] [CrossRef] [Green Version]
  11. Tutolo, B.M.; Luhmann, A.J.; Kong, X.-Z.; Saar, M.O.; Seyfried, W.E. CO2 Sequestration in Feldspar-Rich Sandstone: Coupled Evolution of Fluid Chemistry, Mineral Reaction Rates, and Hydrogeochemical Properties. Geochim. Et Cosmochim. Acta 2015, 160, 132–154. [Google Scholar] [CrossRef] [Green Version]
  12. Lenormand, R.; Touboul, E.; Zarcone, C. Numerical Models and Experiments on Immiscible Displacements in Porous Media. J. Fluid Mech. 1988, 189, 165–187. [Google Scholar] [CrossRef]
  13. Morais, S.; Liu, N.; Diouf, A.; Bernard, D.; Lecoutre, C.; Garrabos, Y.; Marre, S. Monitoring CO2 Invasion Processes at the Pore Scale Using Geological Labs on Chip. Lab A Chip 2016, 16, 3493–3502. [Google Scholar] [CrossRef]
  14. Marre, S.; Adamo, A.; Basak, S.; Aymonier, C.; Jensen, K.F. Design and Packaging of Microreactors for High Pressure and High Temperature Applications. Ind. Eng. Chem. Res. 2010, 49, 11310–11320. [Google Scholar] [CrossRef]
  15. Morais, S.; Cario, A.; Liu, N.; Bernard, D.; Lecoutre, C.; Garrabos, Y.; Ranchou-Peyruse, A.; Dupraz, S.; Azaroual, M.; Hartman, R.L.; et al. Studying Key Processes Related to CO2 Underground Storage at the Pore Scale Using High Pressure Micromodels. React. Chem. Eng. 2020, 5, 1156–1185. [Google Scholar] [CrossRef]
  16. Boyd, V.; Yoon, H.; Zhang, C.; Oostrom, M.; Hess, N.; Fouke, B.; Valocchi, A.J.; Werth, C.J. Influence of Mg2+ on CaCO3 Precipitation during Subsurface Reactive Transport in a Homogeneous Silicon-Etched Pore Network. Geochim. Et Cosmochim. Acta 2014, 135, 321–335. [Google Scholar] [CrossRef]
  17. Harrison, A.L.; Dipple, G.M.; Song, W.; Power, I.M.; Mayer, K.U.; Beinlich, A.; Sinton, D. Changes in Mineral Reactivity Driven by Pore Fluid Mobility in Partially Wetted Porous Media. Chem. Geol. 2017, 463, 1–11. [Google Scholar] [CrossRef]
  18. Katz, G.E.; Berkowitz, B.; Guadagnini, A.; Saaltink, M.W. Experimental and Modeling Investigation of Multicomponent Reactive Transport in Porous Media. J. Contam. Hydrol. 2011, 120–121, 27–44. [Google Scholar] [CrossRef] [PubMed]
  19. Tartakovsky, A.M.; Redden, G.; Lichtner, P.C.; Scheibe, T.D.; Meakin, P. Mixing-Induced Precipitation: Experimental Study and Multiscale Numerical Analysis. Water Resour. Res. 2008, 44, W06S04. [Google Scholar] [CrossRef]
  20. Zhang, C.; Dehoff, K.; Hess, N.; Oostrom, M.; Wietsma, T.W.; Valocchi, A.J.; Fouke, B.W.; Werth, C.J. Pore-Scale Study of Transverse Mixing Induced CaCO3 Precipitation and Permeability Reduction in a Model Subsurface Sedimentary System. Environ. Sci. Technol. 2010, 44, 7833–7838. [Google Scholar] [CrossRef]
  21. Jaho, S.; Athanasakou, G.D.; Sygouni, V.; Lioliou, M.G.; Koutsoukos, P.G.; Paraskeva, C.A. Experimental Investigation of Calcium Carbonate Precipitation and Crystal Growth in One- and Two-Dimensional Porous Media. Cryst. Growth Des. 2016, 16, 359–370. [Google Scholar] [CrossRef]
  22. Kim, M.; Sell, A.; Sinton, D. Aquifer-on-a-Chip: Understanding Pore-Scale Salt Precipitation Dynamics during CO2 Sequestration. Lab A Chip 2013, 13, 2508–2518. [Google Scholar] [CrossRef] [PubMed]
  23. Song, W.; de Haas, T.W.; Fadaei, H.; Sinton, D. Chip-off-the-Old-Rock: The Study of Reservoir-Relevant Geological Processes with Real-Rock Micromodels. Lab A Chip 2014, 14, 4382–4390. [Google Scholar] [CrossRef]
  24. Karambeigi, M.S.; Schaffie, M.; Fazaelipoor, M.H. Improvement of Water Flooding Efficiency Using Mixed Culture of Microorganisms in Heterogeneous Micro-Models. Pet. Sci. Technol. 2013, 31, 923–931. [Google Scholar] [CrossRef]
  25. Liu, N.; Skauge, T.; Landa-Marbán, D.; Hovland, B.; Thorbjørnsen, B.; Radu, F.A.; Vik, B.F.; Baumann, T.; Bødtker, G. Microfluidic Study of Effects of Flow Velocity and Nutrient Concentration on Biofilm Accumulation and Adhesive Strength in the Flowing and No-Flowing Microchannels. J. Ind. Microbiol. Biotechnol. 2019, 46, 855–868. [Google Scholar] [CrossRef] [PubMed]
  26. Singh, R.; Yoon, H.; Sanford, R.A.; Katz, L.; Fouke, B.W.; Werth, C.J. Metabolism-Induced CaCO3 Biomineralization During Reactive Transport in a Micromodel: Implications for Porosity Alteration. Environ. Sci. Technol. 2015, 49, 12094–12104. [Google Scholar] [CrossRef] [PubMed]
  27. Sygouni, V.; Manariotis, I.D.; Chrysikopoulos, C.V. Experimental Investigation of the Effect of Carbon Dioxide on Pseudomonas Putida Biofilms in a Two-Dimensional Glass Network Micromodel. Int. J. Greenh. Gas Control 2016, 46, 240–247. [Google Scholar] [CrossRef]
  28. Gavoille, T.; Pannacci, N.; Bergeot, G.; Marliere, C.; Marre, S. Microfluidic Approaches for Accessing Thermophysical Properties of Fluid Systems. React. Chem. Eng. 2019, 4, 1721–1739. [Google Scholar] [CrossRef]
  29. Liu, N.; Aymonier, C.; Lecoutre, C.; Garrabos, Y.; Marre, S. Microfluidic Approach for Studying CO2 Solubility in Water and Brine Using Confocal Raman Spectroscopy. Chem. Phys. Lett. 2012, 551, 139–143. [Google Scholar] [CrossRef]
  30. Lee, S.G.; Lee, H.; Gupta, A.; Chang, S.; Doyle, P.S. Site-Selective In Situ Grown Calcium Carbonate Micromodels with Tunable Geometry, Porosity, and Wettability. Adv. Funct. Mater. 2016, 26, 4896–4905. [Google Scholar] [CrossRef]
  31. Song, W.; Kovscek, A.R. Direct Visualization of Pore-Scale Fines Migration and Formation Damage during Low-Salinity Waterflooding. J. Nat. Gas Sci. Eng. 2016, 34, 1276–1283. [Google Scholar] [CrossRef]
  32. Song, W.; Kovscek, A.R. Functionalization of Micromodels with Kaolinite for Investigation of Low Salinity Oil-Recovery Processes. Lab A Chip 2015, 15, 3314–3325. [Google Scholar] [CrossRef]
  33. Zhang, Y.Q.; Sanati-Nezhad, A.; Hejazi, S.H. Geo-Material Surface Modification of Microchips Using Layer-by-Layer (LbL) Assembly for Subsurface Energy and Environmental Applications. Lab A Chip 2018, 18, 285–295. [Google Scholar] [CrossRef] [PubMed]
  34. Porter, M.L.; Jiménez-martínez, J.; Martinez, R.; Mcculloch, Q.; William, J.; Viswanathan, H.S. Lab on a Chip Geo-material microfluidics at reservoir conditions for subsurface energy resource applications. Lab A Chip 2015, 15, 4044–4053. [Google Scholar] [CrossRef] [PubMed]
  35. Singh, R.; Sivaguru, M.; Fried, G.A.; Fouke, B.W.; Sanford, R.A.; Carrera, M.; Werth, C.J. Real Rock-Microfluidic Flow Cell: A Test Bed for Real-Time in Situ Analysis of Flow, Transport, and Reaction in a Subsurface Reactive Transport Environment. J. Contam. Hydrol. 2017, 204, 28–39. [Google Scholar] [CrossRef] [PubMed]
  36. Bowden, S.A.; Tanino, Y.; Akamairo, B.; Christensen, M. Recreating Mineralogical Petrographic Heterogeneity within Microfluidic Chips: Assembly, Examples, and Applications. Lab A Chip 2016, 16, 4677–4681. [Google Scholar] [CrossRef] [Green Version]
  37. Hu, C.; Morris, J.E.; Hartman, R.L. Microfluidic Investigation of the Deposition of Asphaltenes in Porous Media. Lab A Chip 2014, 14, 2014–2022. [Google Scholar] [CrossRef]
  38. Tanino, Y.; Zacarias-Hernandez, X.; Christensen, M. Oil/Water Displacement in Microfluidic Packed Beds under Weakly Water-Wetting Conditions: Competition between Precursor Film Flow and Piston-like Displacement. Exp. Fluids 2018, 59, 35. [Google Scholar] [CrossRef] [Green Version]
  39. Soulaine, C.; Roman, S.; Kovscek, A.; Tchelepi, H.A. Pore-Scale Modelling of Multiphase Reactive Flow: Application to Mineral Dissolution with Production of CO2. J. Fluid Mech. 2018, 855, 616–645. [Google Scholar] [CrossRef]
  40. Renard, F.; Bernard, D.; Desrues, J.; Ougier-Simonin, A. 3D Imaging of Fracture Propagation Using Synchrotron X-Ray Microtomography. Earth Planet. Sci. Lett. 2009, 286, 285–291. [Google Scholar] [CrossRef]
  41. Renard, F.; Bernard, D.; Thibault, X.; Boller, E. Synchrotron 3D Microtomography of Halite Aggregates during Experimental Pressure Solution Creep and Evolution of the Permeability. Geophys. Res. Lett. 2004, 31, L07607. [Google Scholar] [CrossRef] [Green Version]
  42. Bernard, D. 3D Quantification of Pore Scale Geometrical Changes Using Synchrotron Computed. Oil Gas Sci. Technol.-Rev. IFP 2005, 60, 747–762. [Google Scholar] [CrossRef]
  43. Noiriel, C.; Bernard, D.; Gouze, P.; Thibault, X. Hydraulic Properties and Microgeometry Evolution Accompanying Limestone Dissolution by Acidic Water. Oil Gas Sci. Technol.-Rev. IFP 2005, 60, 177–192. [Google Scholar] [CrossRef]
  44. Noiriel, C.; Steefel, C.I.; Yang, L.; Bernard, D. Effects of Pore-Scale Precipitation on Permeability and Flow. Adv. Water Resour. 2016, 95, 125–137. [Google Scholar] [CrossRef] [Green Version]
  45. Noiriel, C.; Gouze, P.; Bernard, D. Investigation of Porosity and Permeability Effects from Microstructure Changes during Limestone Dissolution. Geophys. Res. Lett. 2004, 31, L24603. [Google Scholar] [CrossRef]
  46. Helfen, L.; Baumbach, T.; Mikulík, P.; Kiel, D.; Pernot, P.; Cloetens, P.; Baruchel, J. High-Resolution Three-Dimensional Imaging of Flat Objects by Synchrotron-Radiation Computed Laminography. Appl. Phys. Lett. 2005, 86, 071915. [Google Scholar] [CrossRef]
  47. Zhou, J.; Maisl, M.; Reiter, H.; Arnold, W. Computed Laminography for Materials Testing. Appl. Phys. Lett. 1996, 68, 3500–3502. [Google Scholar] [CrossRef]
  48. Helfen, L.; Xu, F.; Suhonen, H.; Urbanelli, L.; Cloetens, P.; Baumbach, T. Nano-Laminography for Three-Dimensional High-Resolution Imaging of Flat Specimens. J. Instrum. 2013, 8, C05006. [Google Scholar] [CrossRef] [Green Version]
  49. Fisher, S.L.; Holmes, D.J.; Jørgensen, J.S.; Gajjar, P.; Behnsen, J.; Lionheart, W.R.B.; Withers, P.J. Laminography in the Lab: Imaging Planar Objects Using a Conventional x-Ray CT Scanner. Meas. Sci. Technol. 2019, 30, 035401. [Google Scholar] [CrossRef]
  50. Beuvier, T.; Panduro, E.A.C.; Kwaśniewski, P.; Marre, S.; Lecoutre, C.; Garrabos, Y.; Aymonier, C.; Calvignac, B.; Gibaud, A. Implementation of in Situ SAXS/WAXS Characterization into Silicon/Glass Microreactors. Lab A Chip 2015, 15, 2002–2008. [Google Scholar] [CrossRef]
  51. Sjöberg, E.L. A Fundamental Equation for Calcite Dissolution Kinetics. Geochim. Cosmochim. Acta 1976, 40, 441–447. [Google Scholar] [CrossRef]
  52. Tardy, Y.; Al-Droubi, A.; Fritz, B.; Grondin, J.-L. Calcul Des Équilibres Dans Le Système CaCO3-H2O-CO2. Rappel Des Conditions de Dissolution et de Précipitation de La Calcite. Sci. Géologiques Bull. Et Mémoires 1978, 31, 195–202. [Google Scholar]
  53. Flukiger, F.; Bernard, D. A New Numerical Model for Pore Scale Dissolution of Calcite Due to CO2 Saturated Water Flow in 3D Realistic Geometry: Principles and First Results. Chem. Geol. 2009, 265, 171–180. [Google Scholar] [CrossRef]
  54. Marre, S.; Lecoutre, C.; Garrabos, Y.; Fauveau, C.; Cario, A.; Nguyen, O. Sapphire Microreactors. International Patent No WO 2021/2051 15 A1, 2023. [Google Scholar]
  55. You, J.; Lee, K.J. A Pore–Scale Investigation of Surface Roughness on the Evolution of Natural Fractures during Acid Dissolution Using DBS Method. J. Pet. Sci. Eng. 2021, 204, 108728. [Google Scholar] [CrossRef]
  56. Matter, J.M.; Stute, M.; Snæbjörnsdottir, S.Ó.; Oelkers, E.H.; Gislason, S.R.; Aradottir, E.S.; Sigfusson, B.; Gunnarsson, I.; Sigurdardottir, H.; Gunnlaugsson, E.; et al. Rapid Carbon Mineralization for Permanent Disposal of Anthropogenic Carbon Dioxide Emissions. Science 2016, 352, 1312–1314. [Google Scholar] [CrossRef] [PubMed] [Green Version]
  57. Sedimentation velocity and potential in a dilute suspension of charged spherical colloidal particles. J. Chem. Soc. Faraday Trans. 2 Mol. Chem. Phys. 1984, 80, 1299–1317.
Figure 1. (a) Scheme of the microreactor design. (b) Enlarged view of the microfilter section.
Processes 11 01981 g001
Figure 2. Pictures of the microchannel during the filling procedure at different times. The scale bar is 100 µm.
Processes 11 01981 g002
Figure 3. (a) Image of the experimental set-up used at ESRF including a 6-valve port for the injection of a known volume of the reactive solution and the silicon-Pyrex microreactor with its associated compression part for injecting the fluids. (b) Typical experimental procedure allowing the loading of reactive solution into a loop (position A, left), while the saturated (equilibrium) solution flows through the microreactor, before its injection into the 3D porous medium (position B, right).
Processes 11 01981 g003
Figure 4. (a) 3D reconstruction of the model packed bed porous medium, (b) 2D Y-Z image of the microreactor filled with a CaCO3 particle packed bed, (c) cross section view of the filled microreactor displaying the packing of the CaCO3 particle in the z dimension along the red line in Figure 4a.
Processes 11 01981 g004
Figure 5. 2D X-rays images of the model 3D packed bed porous medium taken after (a) 3 injections and (b) 17 injections. Local preferential dissolution of the packed particles are highlighted in the blue circles, while displacement of non-dissolved particles can be seen in the red circle.
Processes 11 01981 g005
Figure 6. Superposition of 3D images of the packed bed porous medium taken between injections 18, 19, and 20, showing the dissolved materials. The blue and red colored CaCO3 particles correspond to the volume variation (in voxels) of the packed bed between injections 18 and 19, and 19 and 20, respectively.
Processes 11 01981 g006
Figure 7. (a) Calculated 3D fluid flow pattern inside the packed bed porous medium after injection number 19 and (b) 2D view at half depth with additional green and red circle highlighting the different fluidic behaviors in the porous medium and around the porous medium, respectively.
Processes 11 01981 g007
Figure 8. Section of the computational domain for geometry 19 with the solid phase in white, the part that will be dissolved during reactive percolation between 19 and 20 (approximate registration) in red and the velocity modulus isovalue lines (from the light grey line on the bottom to the red line on the top: 0.01, 0.015, 0.02, 0.03, 0.04, 0.05, 0.1, 0.15, 0.20 m·s−1).
Processes 11 01981 g008
Disclaimer/Publisher’s Note: The statements, opinions and data contained in all publications are solely those of the individual author(s) and contributor(s) and not of MDPI and/or the editor(s). MDPI and/or the editor(s) disclaim responsibility for any injury to people or property resulting from any ideas, methods, instructions or products referred to in the content.

