Article

Design of Nano-Catalyst for Removal of Phenolic Compounds from Wastewater by Oxidation Using Modified Digital Basket Baffle Batch Reactor: Experiments and Modeling

1
Petroleum and Gas Refinery Engineering Department, College of Petroleum Process Engineering, Tikrit University, Tikrit P.O. Box 42, Iraq
2
Chemical Engineering Department, College of Engineering, Tikrit University, Tikrit P.O. Box 42, Iraq
3
Ministry of Oil, North Refineries Company, Baiji Refinery, Tikrit P.O. Box 42, Iraq
4
Department of Chemical Engineering, Faculty of Engineering & Informatics, University of Bradford, Bradford BD7 1DP, UK
*
Author to whom correspondence should be addressed.
Processes 2023, 11(7), 1990; https://doi.org/10.3390/pr11071990
Submission received: 22 May 2023 / Revised: 26 June 2023 / Accepted: 27 June 2023 / Published: 1 July 2023

Abstract

:
Removal of phenol and phenolic compounds from wastewater using various techniques has received considerable attention in recent years. In this work, the removal of phenol from a model solution of phenol via catalytic oxidation is investigated with oxidant H2O2. For this purpose, we designed a new nano-catalyst (8% Fe2O3/AC) by loading iron oxide nanoparticles over nano-activated carbon via the impregnation process. We modified the recently developed digital basket baffle batch reactor (DBBBR) and used it for the catalytic oxidation process in order to examine the activity of the prepared nano-catalyst. The highest efficiency of phenol removal was found to be 95.35% under the following parameters: oxidation time of 120 min, oxidation temperature at 85 °C, and stirrer speed of 600 rpm. The minimization of the sum of the squared error between the experimental data and predicted results of phenol removal was considered as a base for the optimization technique to estimate the optimal parameters for the kinetic process. The predicted conversion of phenol excellently agreed with the experimental results (absolute average errors < 5%) for a wide range of process parameters.

1. Introduction

Phenol, an essential chemical, is utilized in the production of drugs, fungicides, and preservatives and is also an essential product of the petroleum industry. Nevertheless, phenolic compounds are major contaminants that are categorized as carcinogenic and teratogenic materials [1,2]. These compounds are fed into the environment by several industrial facilities such as the oil, polymer, petrochemical, pharmaceutical, paint, and dye industries [3,4,5]. Because water is a scarce commodity around the globe, it is essential to remove toxic contaminants such as phenol from wastewater to reclaim and reuse wastewater. Several techniques have been adopted in recent years to remove phenol or phenolic compounds from wastewater [6].
High acidity, salinity, low biodegradability, and chemical oxygen demand (COD) are the major properties for phenolic compounds [4]. Also, low volatilities and readily formed azeotropes and eutectics are important characterizations for these compounds [5]. Therefore, conventional treatment techniques, such as physical and biological methods, have difficulty treating phenol and its derivatives efficiently [1,6]. The catalytic oxidation processes utilizing oxygen, ozone, hydrogen peroxide (H2O2), or the combination of them proved to be a highly efficient process in the elimination of phenolic compounds [7]. Catalytic oxidation employing H2O2 is a more environmentally friendly and efficient process as compared with catalytic oxidation utilizing air, since H2O2 is a stronger oxidizing agent [8,9]. In this process, phenolic compounds are oxidized by H2O2 to water, carbon dioxide, or some short-chain acids in the presence of a catalyst under a moderate operating condition. H2O2 is a non-toxic oxidant, promotes the efficiency of the oxidation process, produces green byproducts, and reduces the severe operating conditions of the process. The catalytic wastewater treatment processes via oxidation are implemented employing catalysts, which leads to a reduction in the activation energy and, thus, the process takes place under mild conditions. In addition, H2O2 is used as an oxidant in the catalytic oxidation process in order to overcome the limitations of liquid–gas mass transfer and extremely promote the process’s performance [9]. Currently, nanomaterials are widely applied in various fields of environmental treatment owing to their unique physiochemical properties. Economically, nanotechnology is beneficial for the utilization of water resources and the conservation of energy. Nanostructured adsorbents are also employed for the treatment of wastewater, as they react at a faster rate and exhibit much higher efficiency [10]. Activated carbons (ACs) are appropriate materials for a wide field of catalytic industries, either as catalysts or catalyst support. The effectiveness of them is considerably affected by their porous structure, surface area, and the surface active sites, which have a significant role in pollutants’ removal activity. The resistance to heat and radiation, cost (relatively cheap), stability in acidic/basic solutions, and good mechanical strength are other significant specifications of these materials. The chemistry of ACs’ surface is examined by various oxygen functional groups, like lactones, carbonyls/quinones, carboxylic acids, anhydrides, and phenols. These groups of oxygen can be added or eliminated from the materials’ surface via applying the thermal treatments for liquid and gas phases [11]. The nanoparticles of iron oxide (Fe2O3) have been gaining the focus of researchers in addressing environmental issues. These materials have high efficiency in removing several categories of pollutants found in water via adsorption and photo-degradation processes. Also, the deterioration of water quality has resulted in the utilization of iron oxide nanoparticles as new adsorbents for wastewater treatment. The large surface-area-to-volume ratio and great biocompatibility allow surface modification and easy separation by employing an external magnetic field of iron oxide nanoparticles, presenting them as excellent adsorbents. It is comparatively low cost, is reusable, and has excellent magnetic properties [8].
In this study, a novel nano-catalyst was prepared using 8% Fe as the active metal and activated carbon (AC) (8% Fe/AC) by employing the Incipient Wetness Impregnation (IWI) method. A digital basket baffled batch reactor (DBBBR) was recently designed by Humadi et al. [11], which was used for oxidative desulfurization of fuel. The DBBBR was found to be more effective than a conventional batch reactor by Humadi et al. In this work, we used a different version of the DBBBR (in terms of the size of different components of the reactor) to facilitate the catalytic oxidation of phenol using hydrogen peroxide. A series of experiments were then carried out in the reactor under various operating conditions and the efficiency of the reactor and the catalyst was then evaluated. A mathematical modeling technique was applied to estimate the best values of kinetic parameters for the catalytic phenol oxidation process. Finally, the optimization process was implemented so as to calculate the optimal parameters for the catalytic phenol oxidation process, at which point the removal of phenol was maximized. The novelty of this work is in conducting the catalytic phenol oxidation process in the recently designed reactor in the presence of a new homemade nano-catalyst (8% Fe/AC). Note that this type of reactor has not been used so far for the oxidation of phenol. Also, the mathematical model was built for the catalytic phenol oxidation process to find the optimal operating condition to maximize the removal of phenolic compounds.

2. Materials Used and Experimental Design

2.1. Material Application

2.1.1. Feedstock

The feedstock was a model wastewater which was prepared by injecting phenol (provided by Alpha Chemika Company—Maharashtra, India, purity of 99%) into demineralized water with a total phenol content of 839 ppm, which refers to the initial phenol concentration in the wastewater.

2.1.2. Ferric Nitrate Nonahydrate

Ferric nitrate nonahydrate (Fe(NO3)3.9H2O) (obtained from Himedia, India) was utilized as the active metal in the designed nano-catalyst (8% Fe/AC) with purity 98%.

2.1.3. Activated Carbon (AC)

Commercial AC (Supplied from Alpha Chemika Company—Maharashtra, India) was utilized as catalyst support in the homemade prepared nano-catalyst.

2.1.4. Hydrogen Peroxide (30% H2O2)

H2O2 (Sigma-Aldrich (Burghausen, Germany), purity above 99.99%) was utilized to oxidize phenol to CO2 and H2O.

2.2. Incipient Wetness Impregnation (IWI) Process

Incipient Wetness Impregnation (IWI) [12,13,14,15,16] technology was employed in preparing the novel nano-catalyst. At first, AC was treated and dried so as to eliminate any impurities before being utilized in the IWI process. Physical activation of activated carbon and drying under inert operating conditions were carried out to remove any moisture from porosity before using it in the preparation of the nano-catalyst. Temperature of physical activation was 110 °C.
After that, the active metal solution was prepared by treating 2 g (of the metal salt) of active metal (Fe(NO3)3.9H2O) with 50 mL of deionized water in a magnetic stirrer with rotational speed of 450 RPM for 1.5 h in order to make sure there was complete dissolution of the active metal in the solvent. The produced materials were then filtered in absence of heating to eliminate any further impurities. The active metal solution was then slowly added to 9.2 g of support (AC) with continuous stirring for 1 h in order to make sure that the dispersion of active metal over the support was completed. Finally, calcination process of the product was performed by utilizing the furnace with a gradual increase in temperature to 150 °C for 1.5 h. Then, the temperature of calcination was raised to 350 °C for 2 h and finally to 560 °C for 1.5 h in order to obtain the nano-catalyst (8% Fe2O3/AC). Figure 1 illustrates the steps of the homemade nano-catalyst (8% Fe2O3/AC) preparation using IWI technology.

2.3. Experimental Procedure

2.3.1. Digital Basket Baffled Batch Reactor (DBBBR)

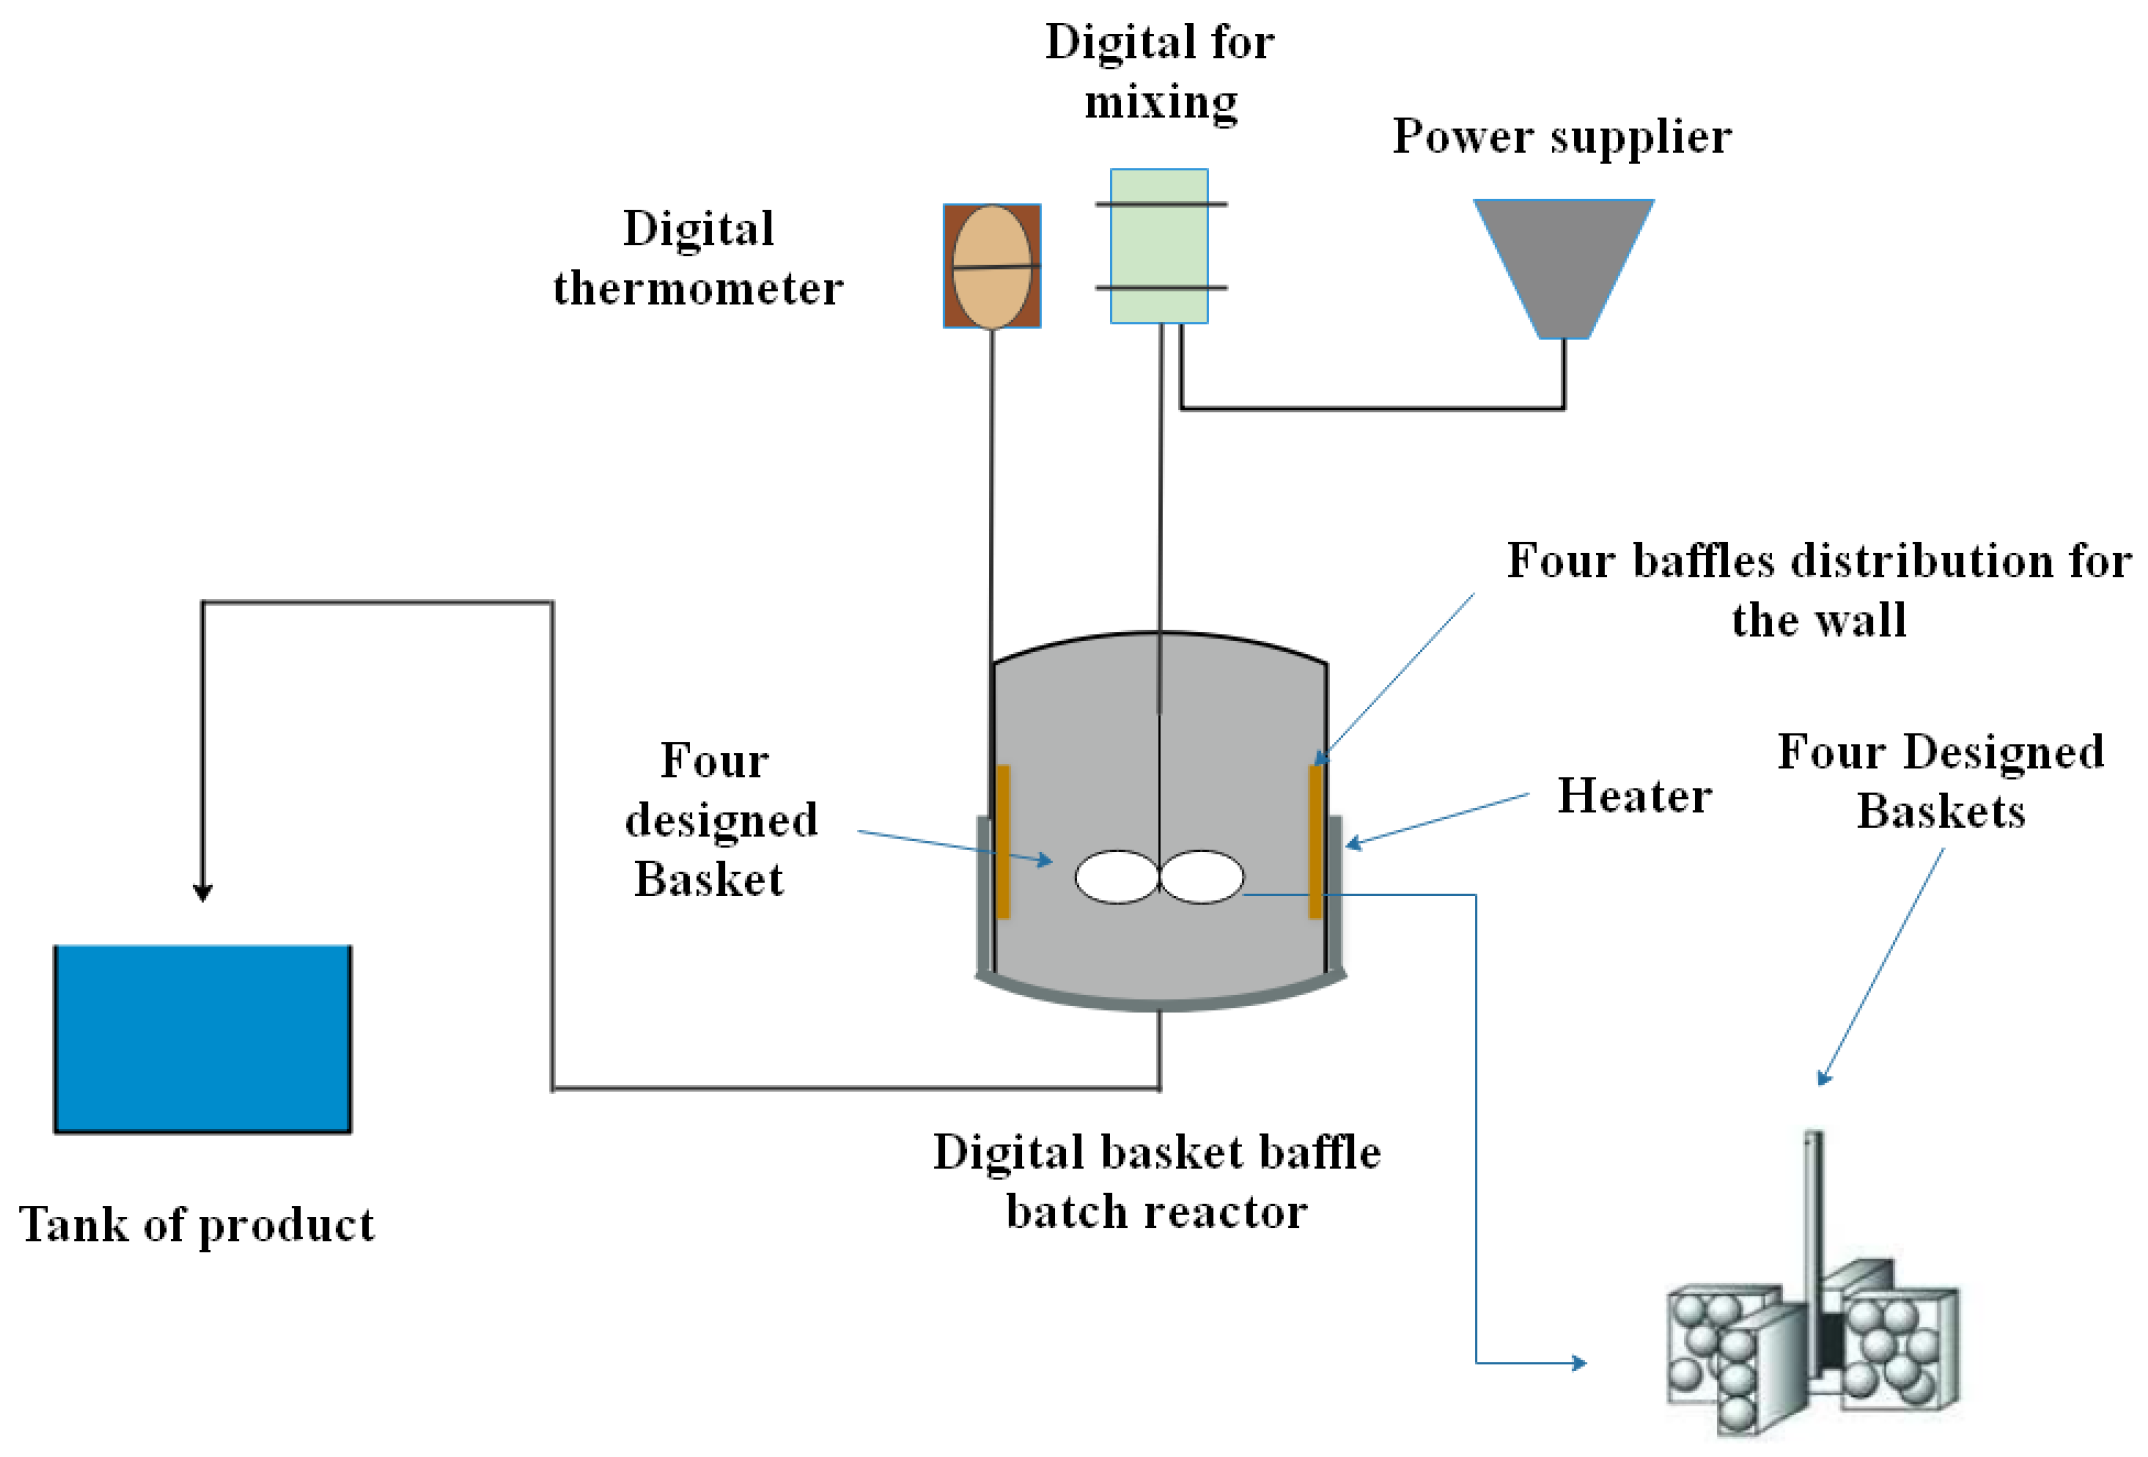
For the convenience of the readers, we briefly describe the configuration of DBBBR here. The DBBBR was designed in the Petroleum and Gas Refinery Engineering Department, College of Petroleum Process Engineering, Tikrit University/Iraq by Humadi et al. [11] to produce greener fuel by removing sulfur from the fuel via oxidation reaction. In this work, we have redesigned the reactor in terms of different components of the reactor. Evaluation of the effectiveness of the reactor in the context of wastewater treatment via catalytic oxidation process is one of the aims of this work in addition to testing the effectiveness of the new homemade catalyst for such purpose. The design of basket baffled batch reactor enhanced distribution of 8% Fe2O3/AC in feedstock and achieved excellent mass transfer rate in the catalytic oxidation process. The DBBBR design involved digital mixer (range of speed from (0 to 5000) RPM), which was linked to a rod, and the end of the rod was connected to the four baskets’ impeller. Also, the baskets involved good equal distribution for the circular holes along the baskets’ surfaces in a hexagonal form, resulting in mixing channels enhancing inside the catalyst and reactor, thus improving the efficiency of oxidation technology. Four baffles were installed on the reactor wall to minimize stagnant zones in it and promote string of reactants. Baffles were distributed inside the surface of the reactor in equal dimensions (38 cm between every two baffles) and a protrusion of 2.5 cm woolen material (for high temperature conditions above 1000 °C) was used for insulating the reactor. The reactor was made of stainless steel. The specifications of the DBBBR are listed in Table 1 and the schematic of the DBBBR system is illustrated in Figure 2.

2.3.2. Catalytic Oxidation of Phenol Process

In order to examine the performance of the designed nano-catalyst in the modified version of the DBBBR, the catalytic oxidation of phenol used for the model solution of phenol treatment was implemented by using H2O2 as oxidant (25 mL fuel/1 mL H2O2). Phenol as a model of phenolic compounds was injected in the model solution of phenol with an initial concentration of 839 ppm. The designed 8% Fe2O3/AC as charged into the basket with 1.25 g of catalyst in each basket. In the catalytic phenol oxidation process, 100 mL of the feedstock was charged into the DBBBR for each run. For all experiments, the ratio of the amount of feedstock to oxidizing agent (H2O2) was 25 and the catalyst weight was 5 g. The catalytic phenol oxidation was processed at mild parameters, where the oxidation time was 30, 60, 90, and 120 min; the reaction temperature was 25, 45, 65, and 85 °C; the magnetic speed was 200, 400, 600, and 800 RPM. Constant pressure of 1 atm was used for all cases. In the chemical reaction, gases were evaporated through the process, which were condensed after that. The treated product was analyzed using a UV spectrophotometer instrument to estimate the final concentration of phenol.

2.3.3. UV Spectrophotometer Analysis

Considering UV-visible spectroscopy was an important suitable technique for determination of phenolic and phenol compounds in model solution. Concentrating the amount of compounds, in fact, depended on two reasons. Firstly, UV light has the ability to absorb phenol and phenolic compounds. Secondly, estimation of the compounds depended on the colored nature that could lead to absorption features in the visible range. The wavelength of phenol was between 210–225 nm.

2.3.4. Characterization of the Prepared Nano-Catalyst (8% Fe2O3/AC)

Brunauer–Emmett–Teller (BET)

Surface area, pore volume, and pore size of the AC support and 8% Fe2O3/AC were measured by utilizing the Brunauer–Emmett–Teller (BET) test and the results are explained in Table 2. In the catalytic oxidation process, specific surface area and pore volume of the prepared nano-catalyst (8% Fe2O3/AC) were very substantial factors influencing the process, where increases in surface area caused enhanced phenol removal. The large surface area contributed to excellent contact area between phenol and H2O2, providing a high rate of elimination of phenol. In addition, the high specific surface area reinforced the diffusion of phenol molecules to the surface-active sites of the catalyst [17].

Scanning Electron Microscope with Energy Dispersive X-ray (SEM-EDX)

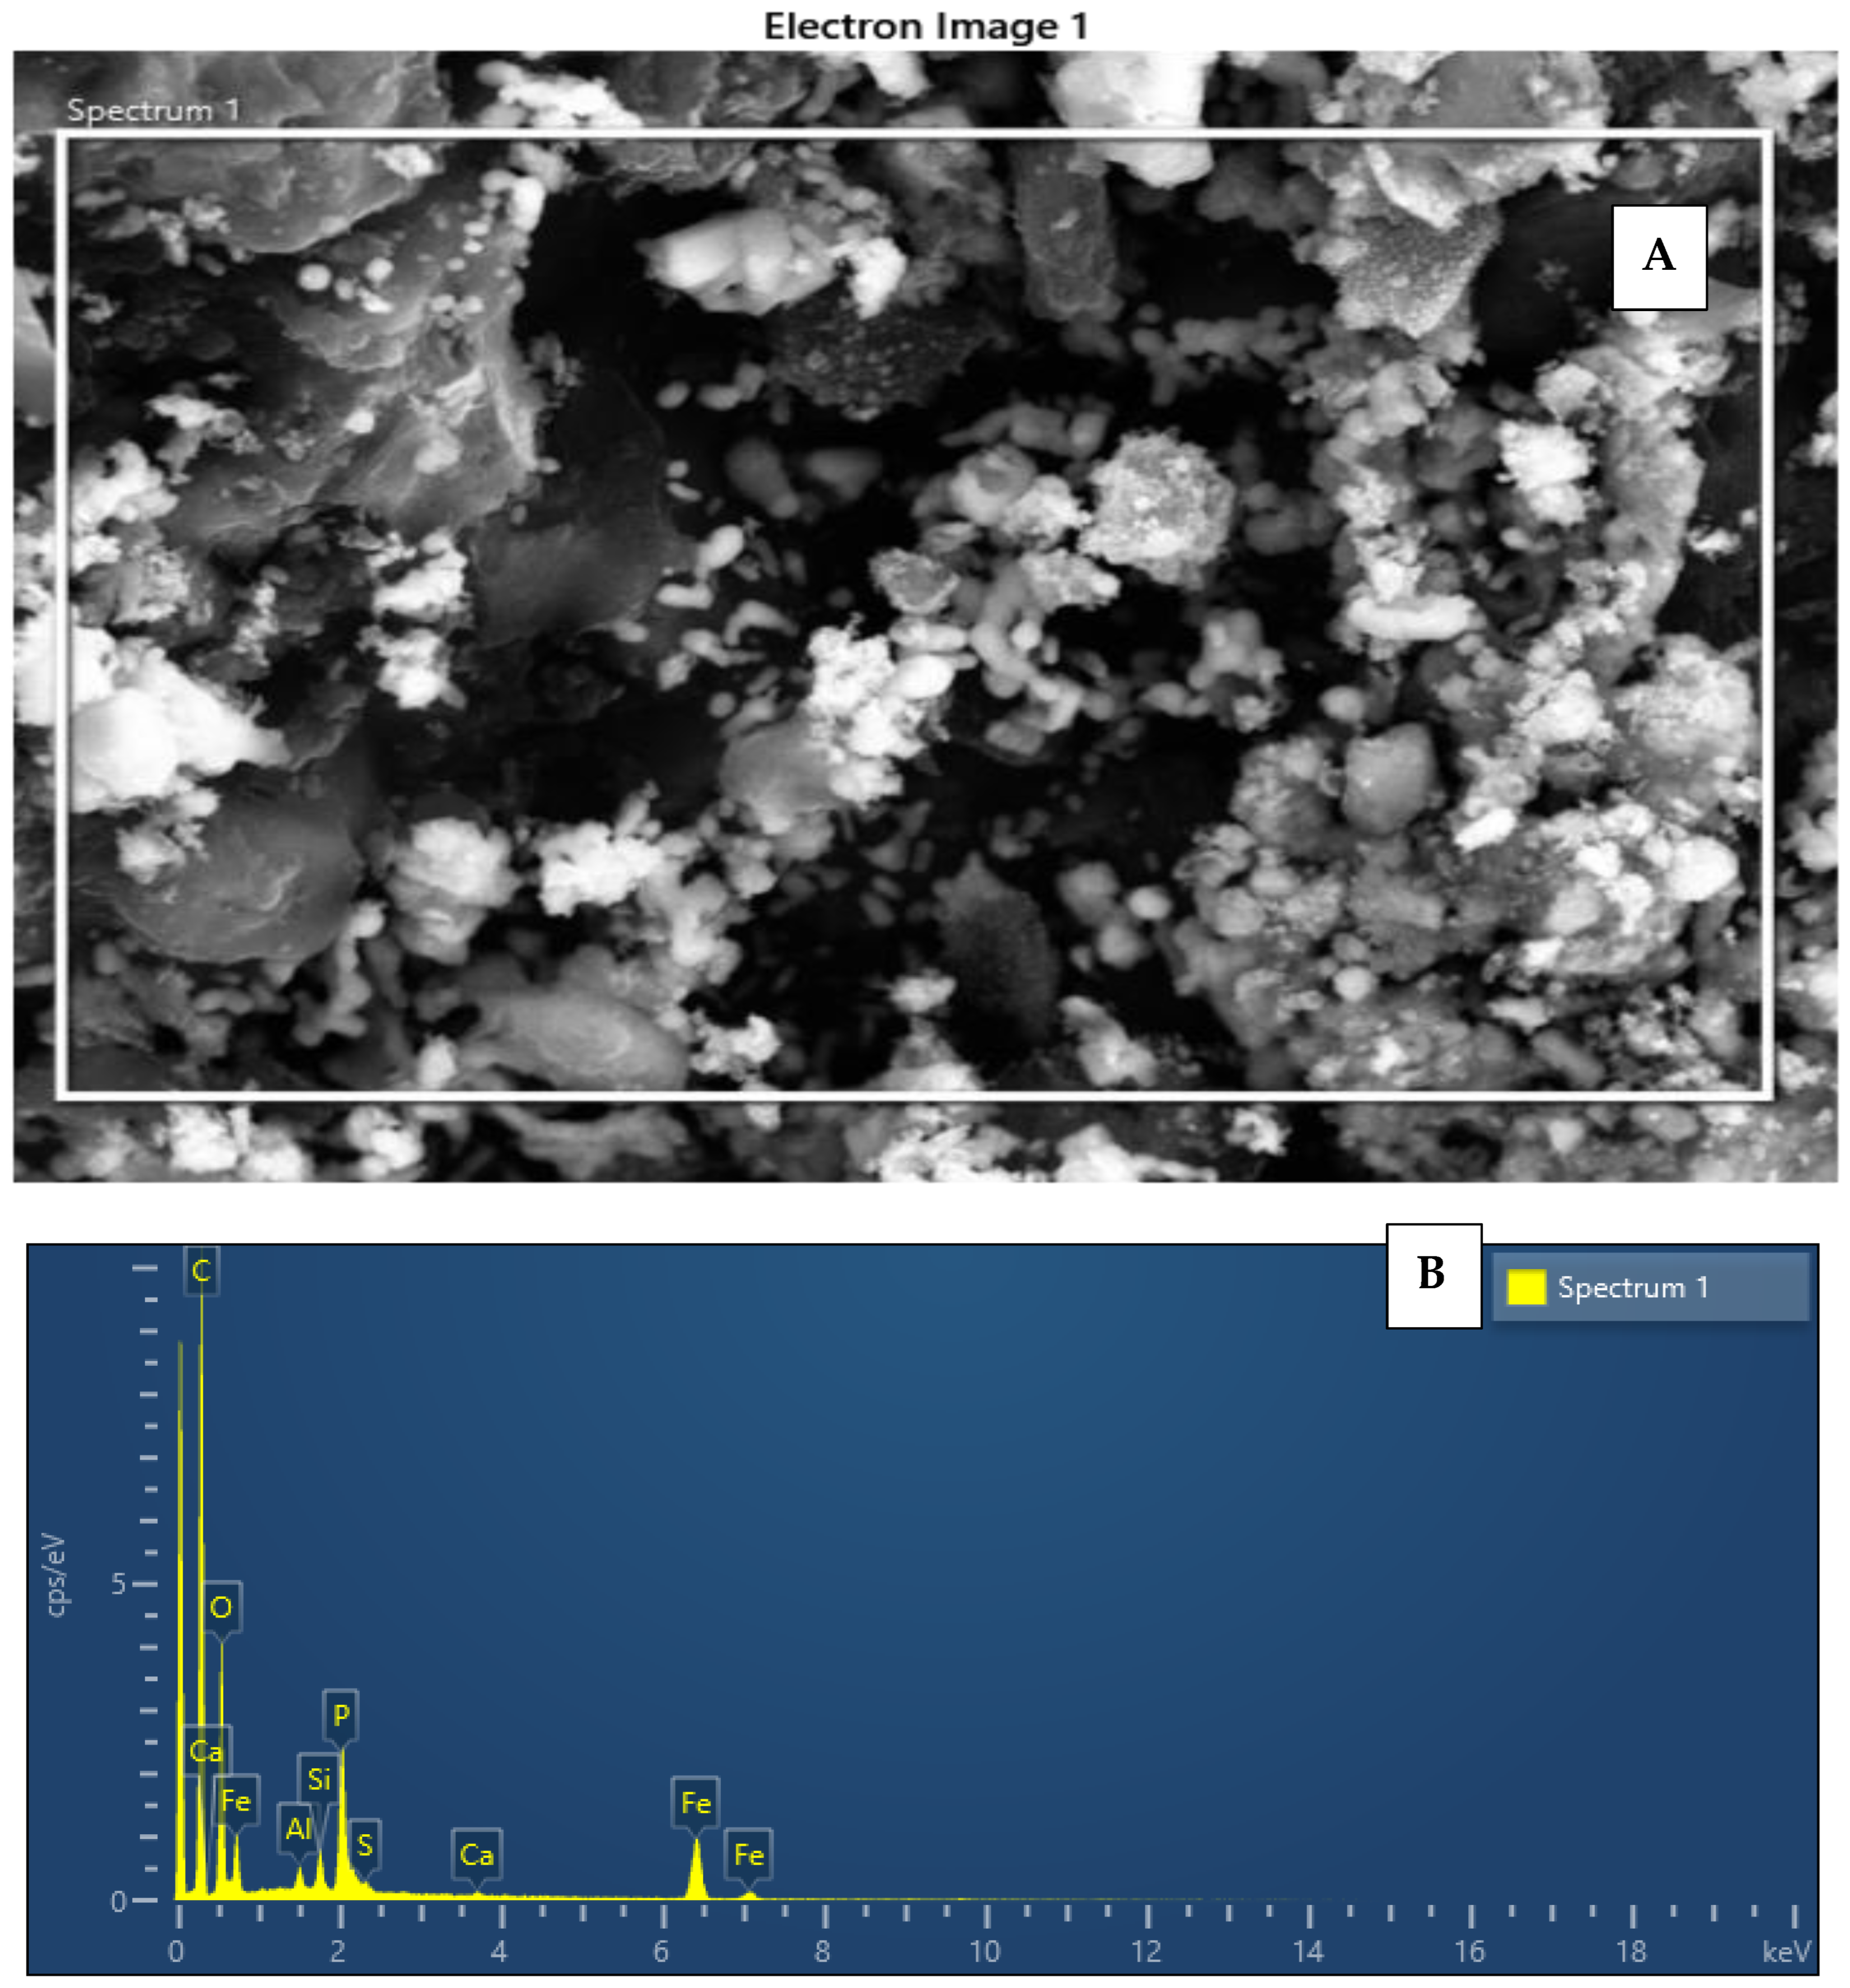
The SEM image of 8% Fe2O3/AC is displayed in Figure 3A and Table 3. As shown in the figure, a high and excellent distribution of Fe2O3 over the AC surface was noticed, where metal oxide is represented by the white regions while AC support is represented by the dark regions. The results of EDX obviously show the elemental composition of the designed nano-catalyst, as illustrated in Figure 3B. The percentage compositions were 10.46%, 26.80%, and 57.77% for iron (Fe), oxygen (O), and carbon (C), respectively. The EDX image displays a regular and good dispersion of active metal on the surface of the nano-catalyst. The results are in good agreement with the theoretical calculations of Fe amount in the designed nano-catalyst.

Fourier Transform Infrared (FTIR) Spectroscopic Analysis

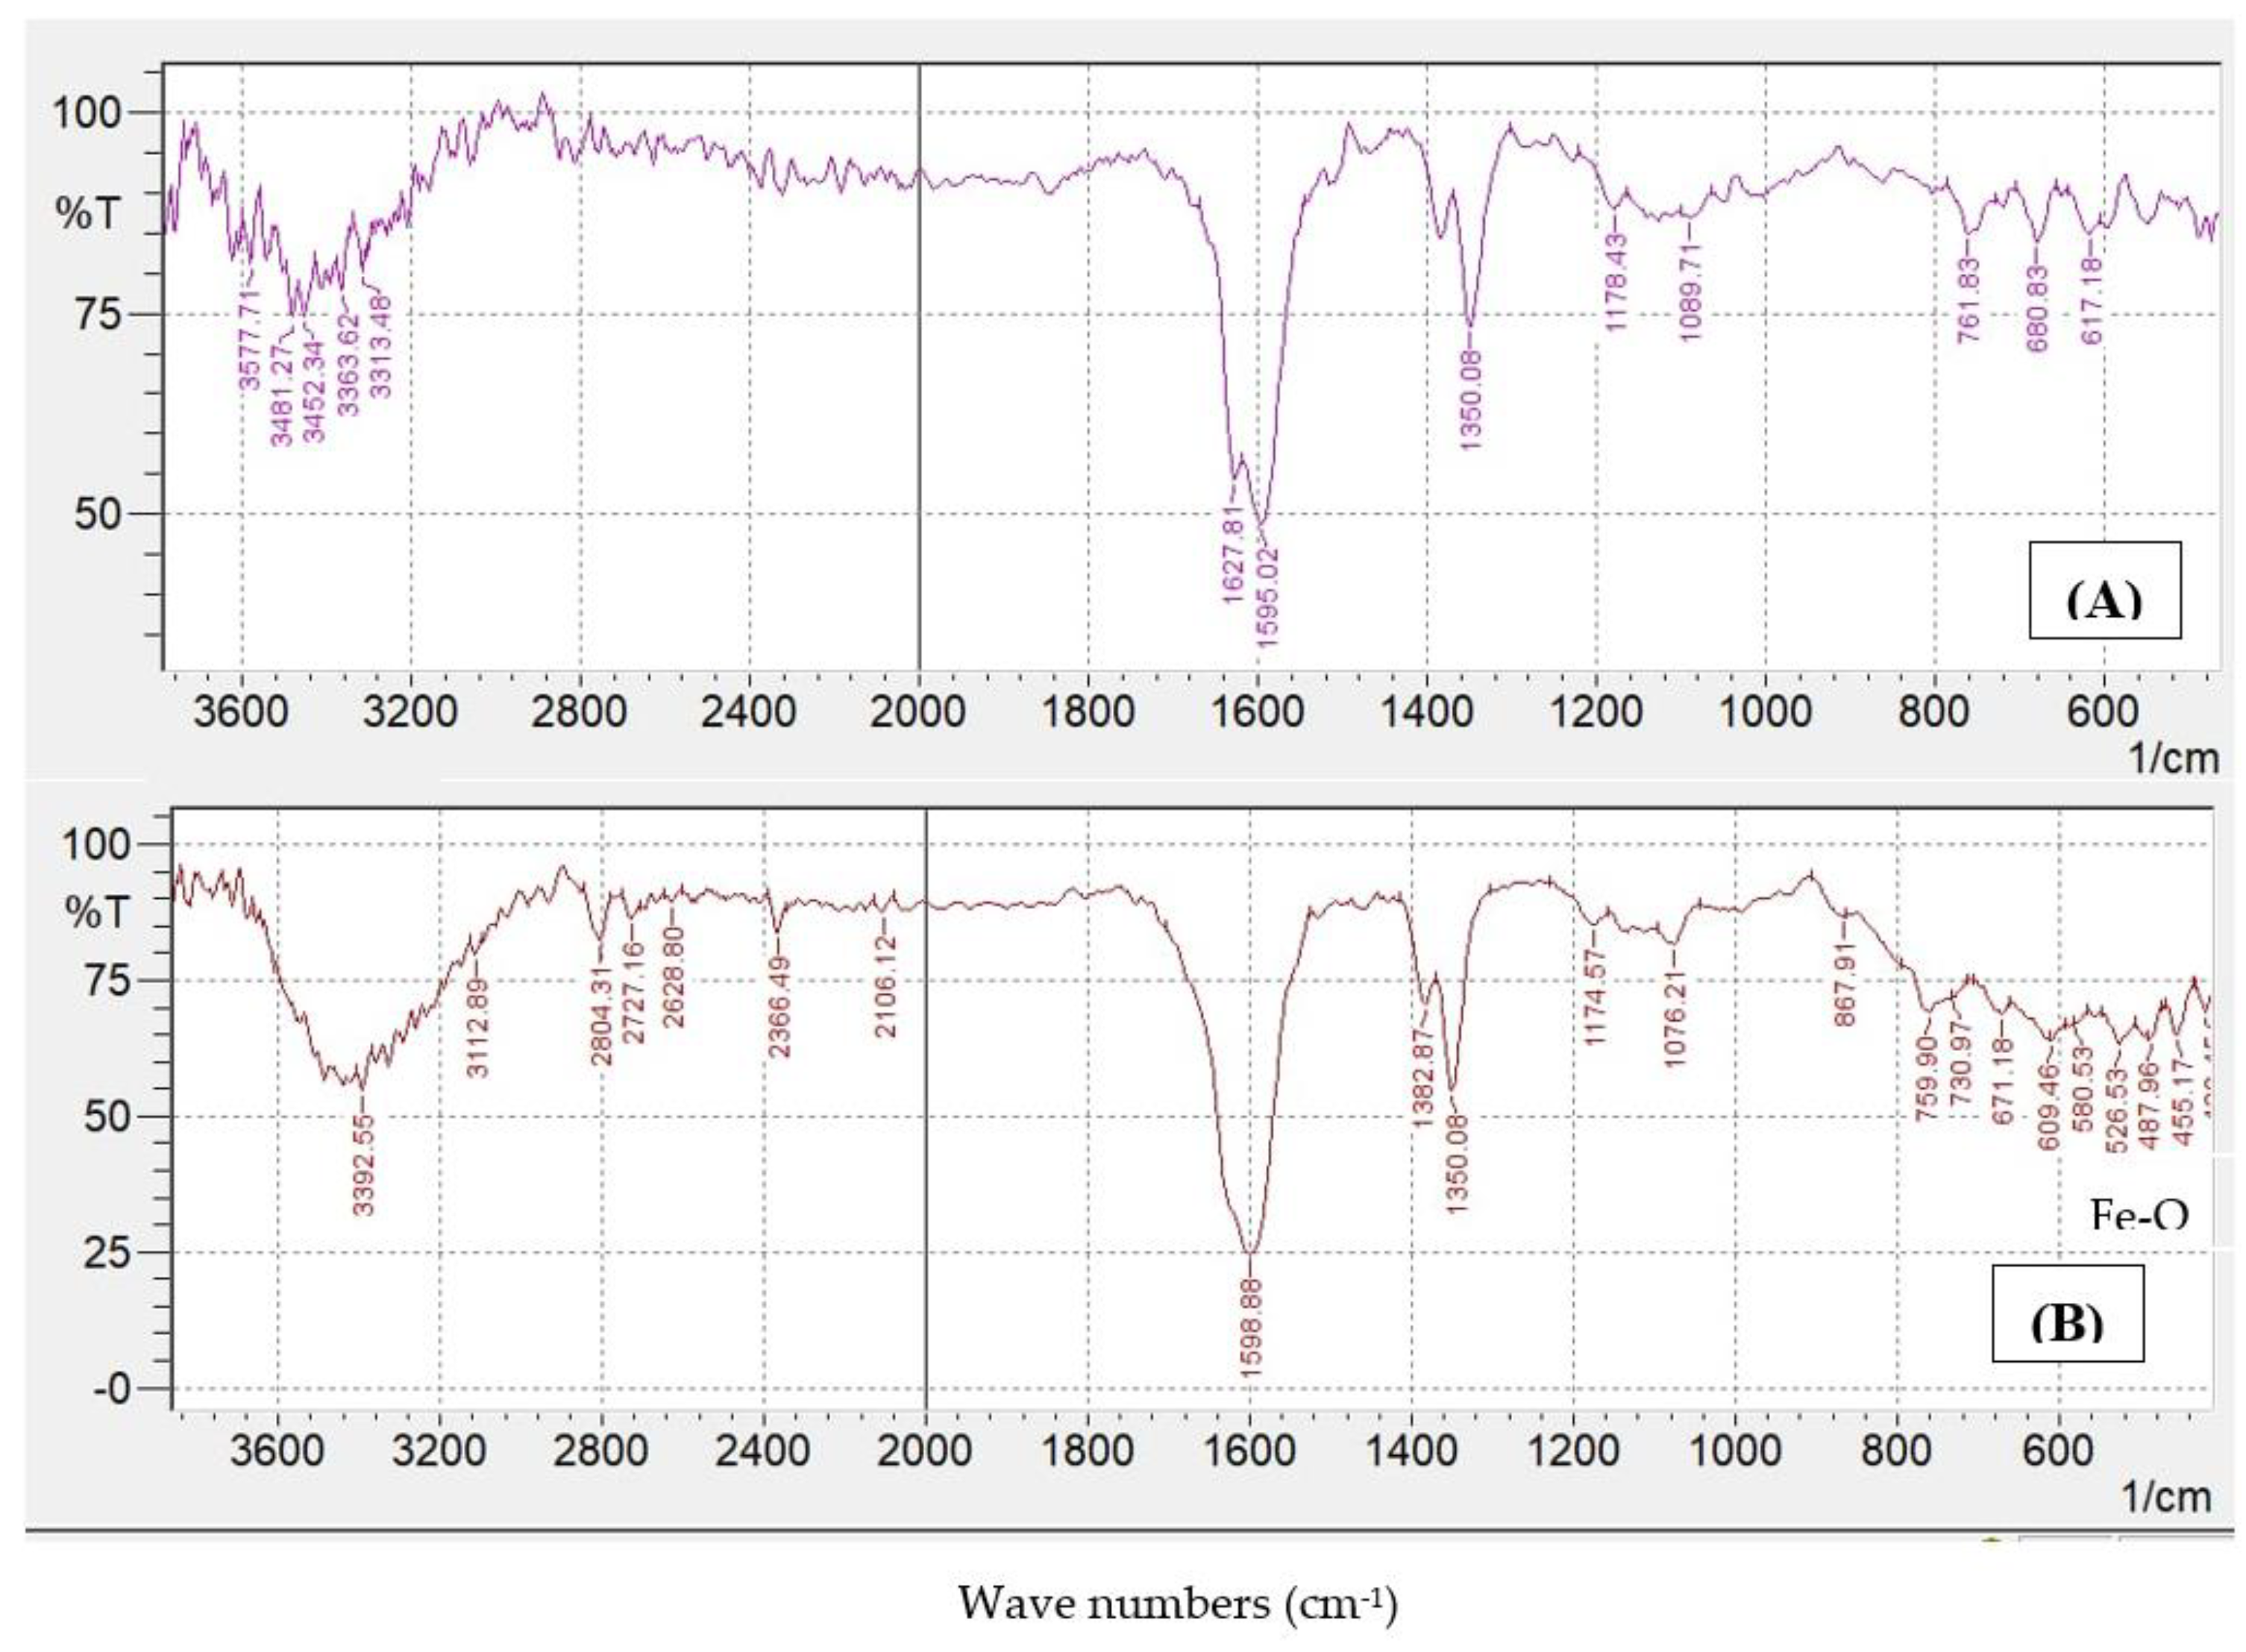
The FTIR test spectrum displays the functional groups of the AC and 8% Fe2O3/AC, as referred to in Figure 4. The band at ~3450 cm−1 was ascribed to O-H stretching vibration of hydroxyl groups. The bands at 1650–1500 cm−1 were attributed to an aromatic C=C ring stretching [18]. The absorption band at 1350 cm−1 was attributed to the C-H asymmetric and symmetric bending and the band between 1178 and 1088 cm−1 to the C-O [19]. The absorption peaks at 700–400 cm−1 corresponded to C-C bond stretching vibration [19]. After the loading process of Fe2O3 over AC, the absorption bands at ~470 cm−1 and ~550 cm−1 were increased, which was ascribed to Fe–O stretching [20,21].

3. Results and Discussion

3.1. Effect of Operating Conditions on the Catalytic Oxidation of Phenol

3.1.1. Effect of Stirrer Speed

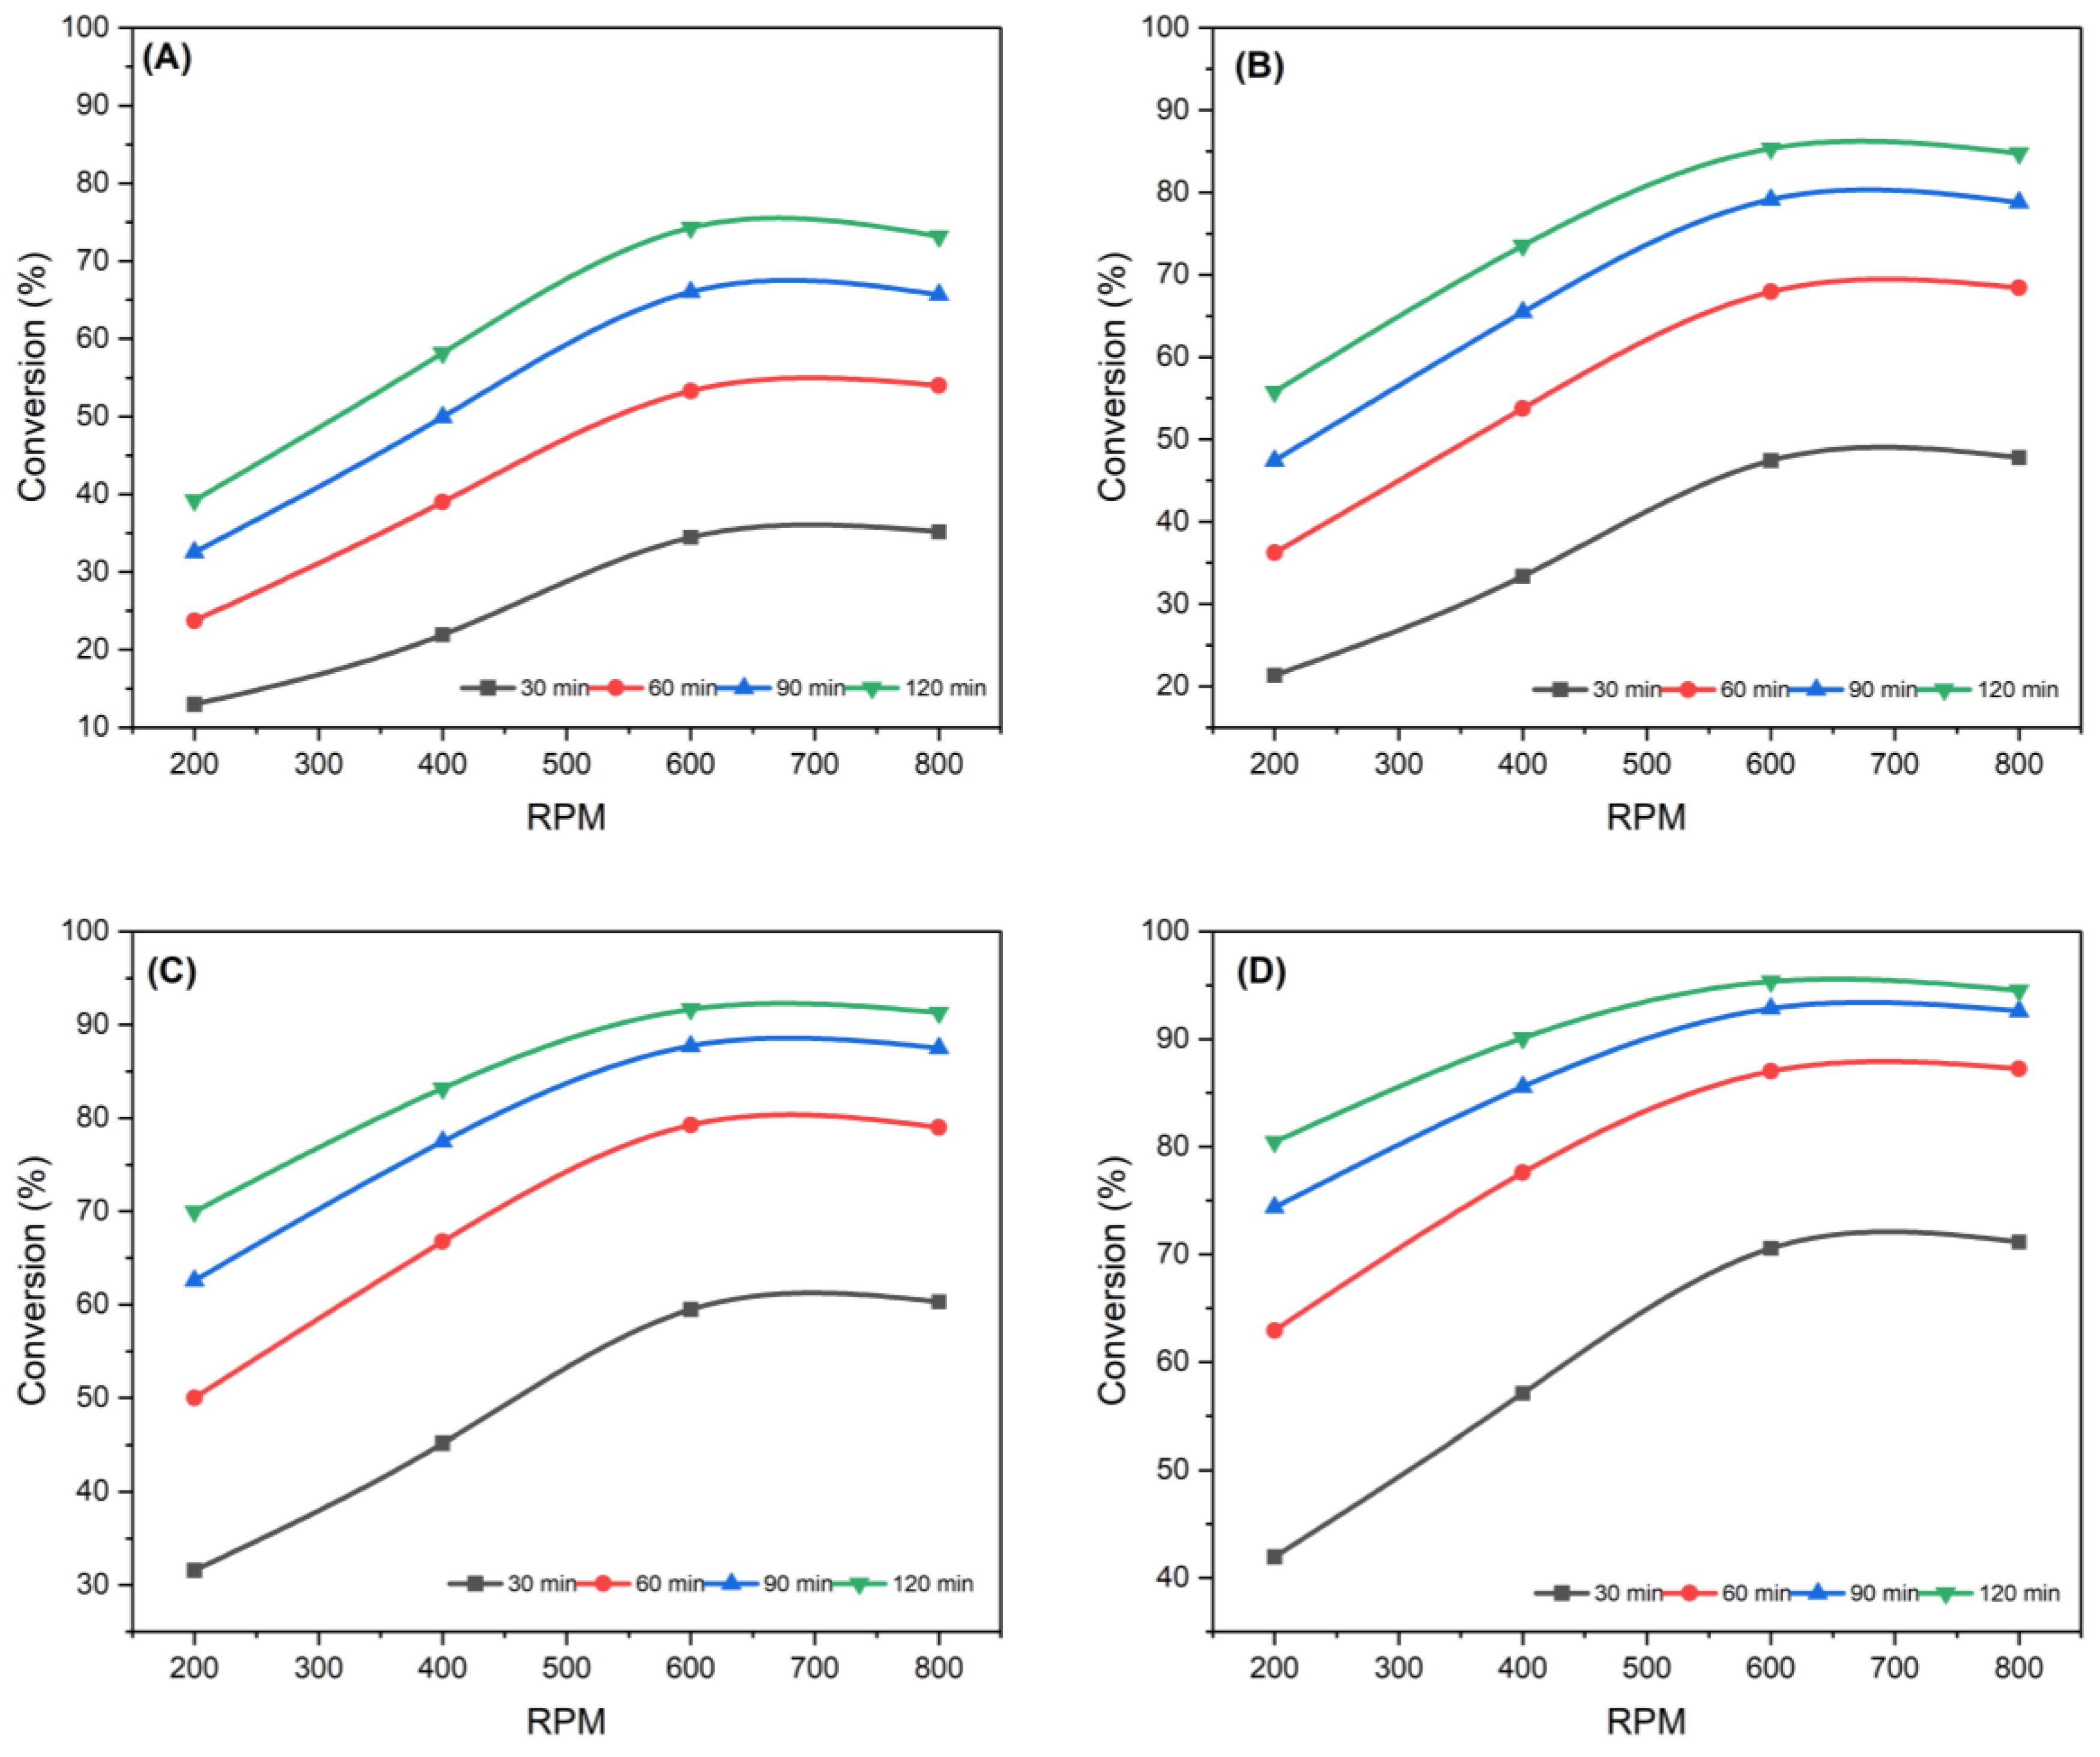
To investigate the effect of stirrer speed on the efficiency of the phenol oxidation process, several experiments were carried out at different speed such as 200, 400, 600, and 800 RPM; at constant pressure; at different reaction times such as 30, 60, 90, and 120 min; and at different reaction temperatures such as 25, 45, 65, and 85 °C using designed catalyst (8% Fe2O3/AC) and H2O2 as an oxidant. Figure 5A–D illustrates the impact of stirrer speed on phenol removal for various operating conditions. Clearly, for each set of operating conditions, it was noted that the higher the stirrer speed the higher the conversion of phenol was, except in Figure 5D. The conversion of phenol increased from 80.45% to 94.16% (Figure 5D) when the speed was increased from 200 to 800 RPM with the time of 120 min and temperature of 85 °C [22]. However, the maximum removal of phenol was 95.35% at the best parameters (120 min, 85 °C, and 600 RPM). The influence of mixing intensity had good activity for the dispersion of the catalyst and provided excellent performance in the oxidation of phenol using H2O2 oxidant. When the stirrer speed was increased above 800 RPM and the temperature beyond 65 °C, the conversion of phenol decreased due to random mixing which affected the conversion of phenol.

3.1.2. Effect of Reaction Time

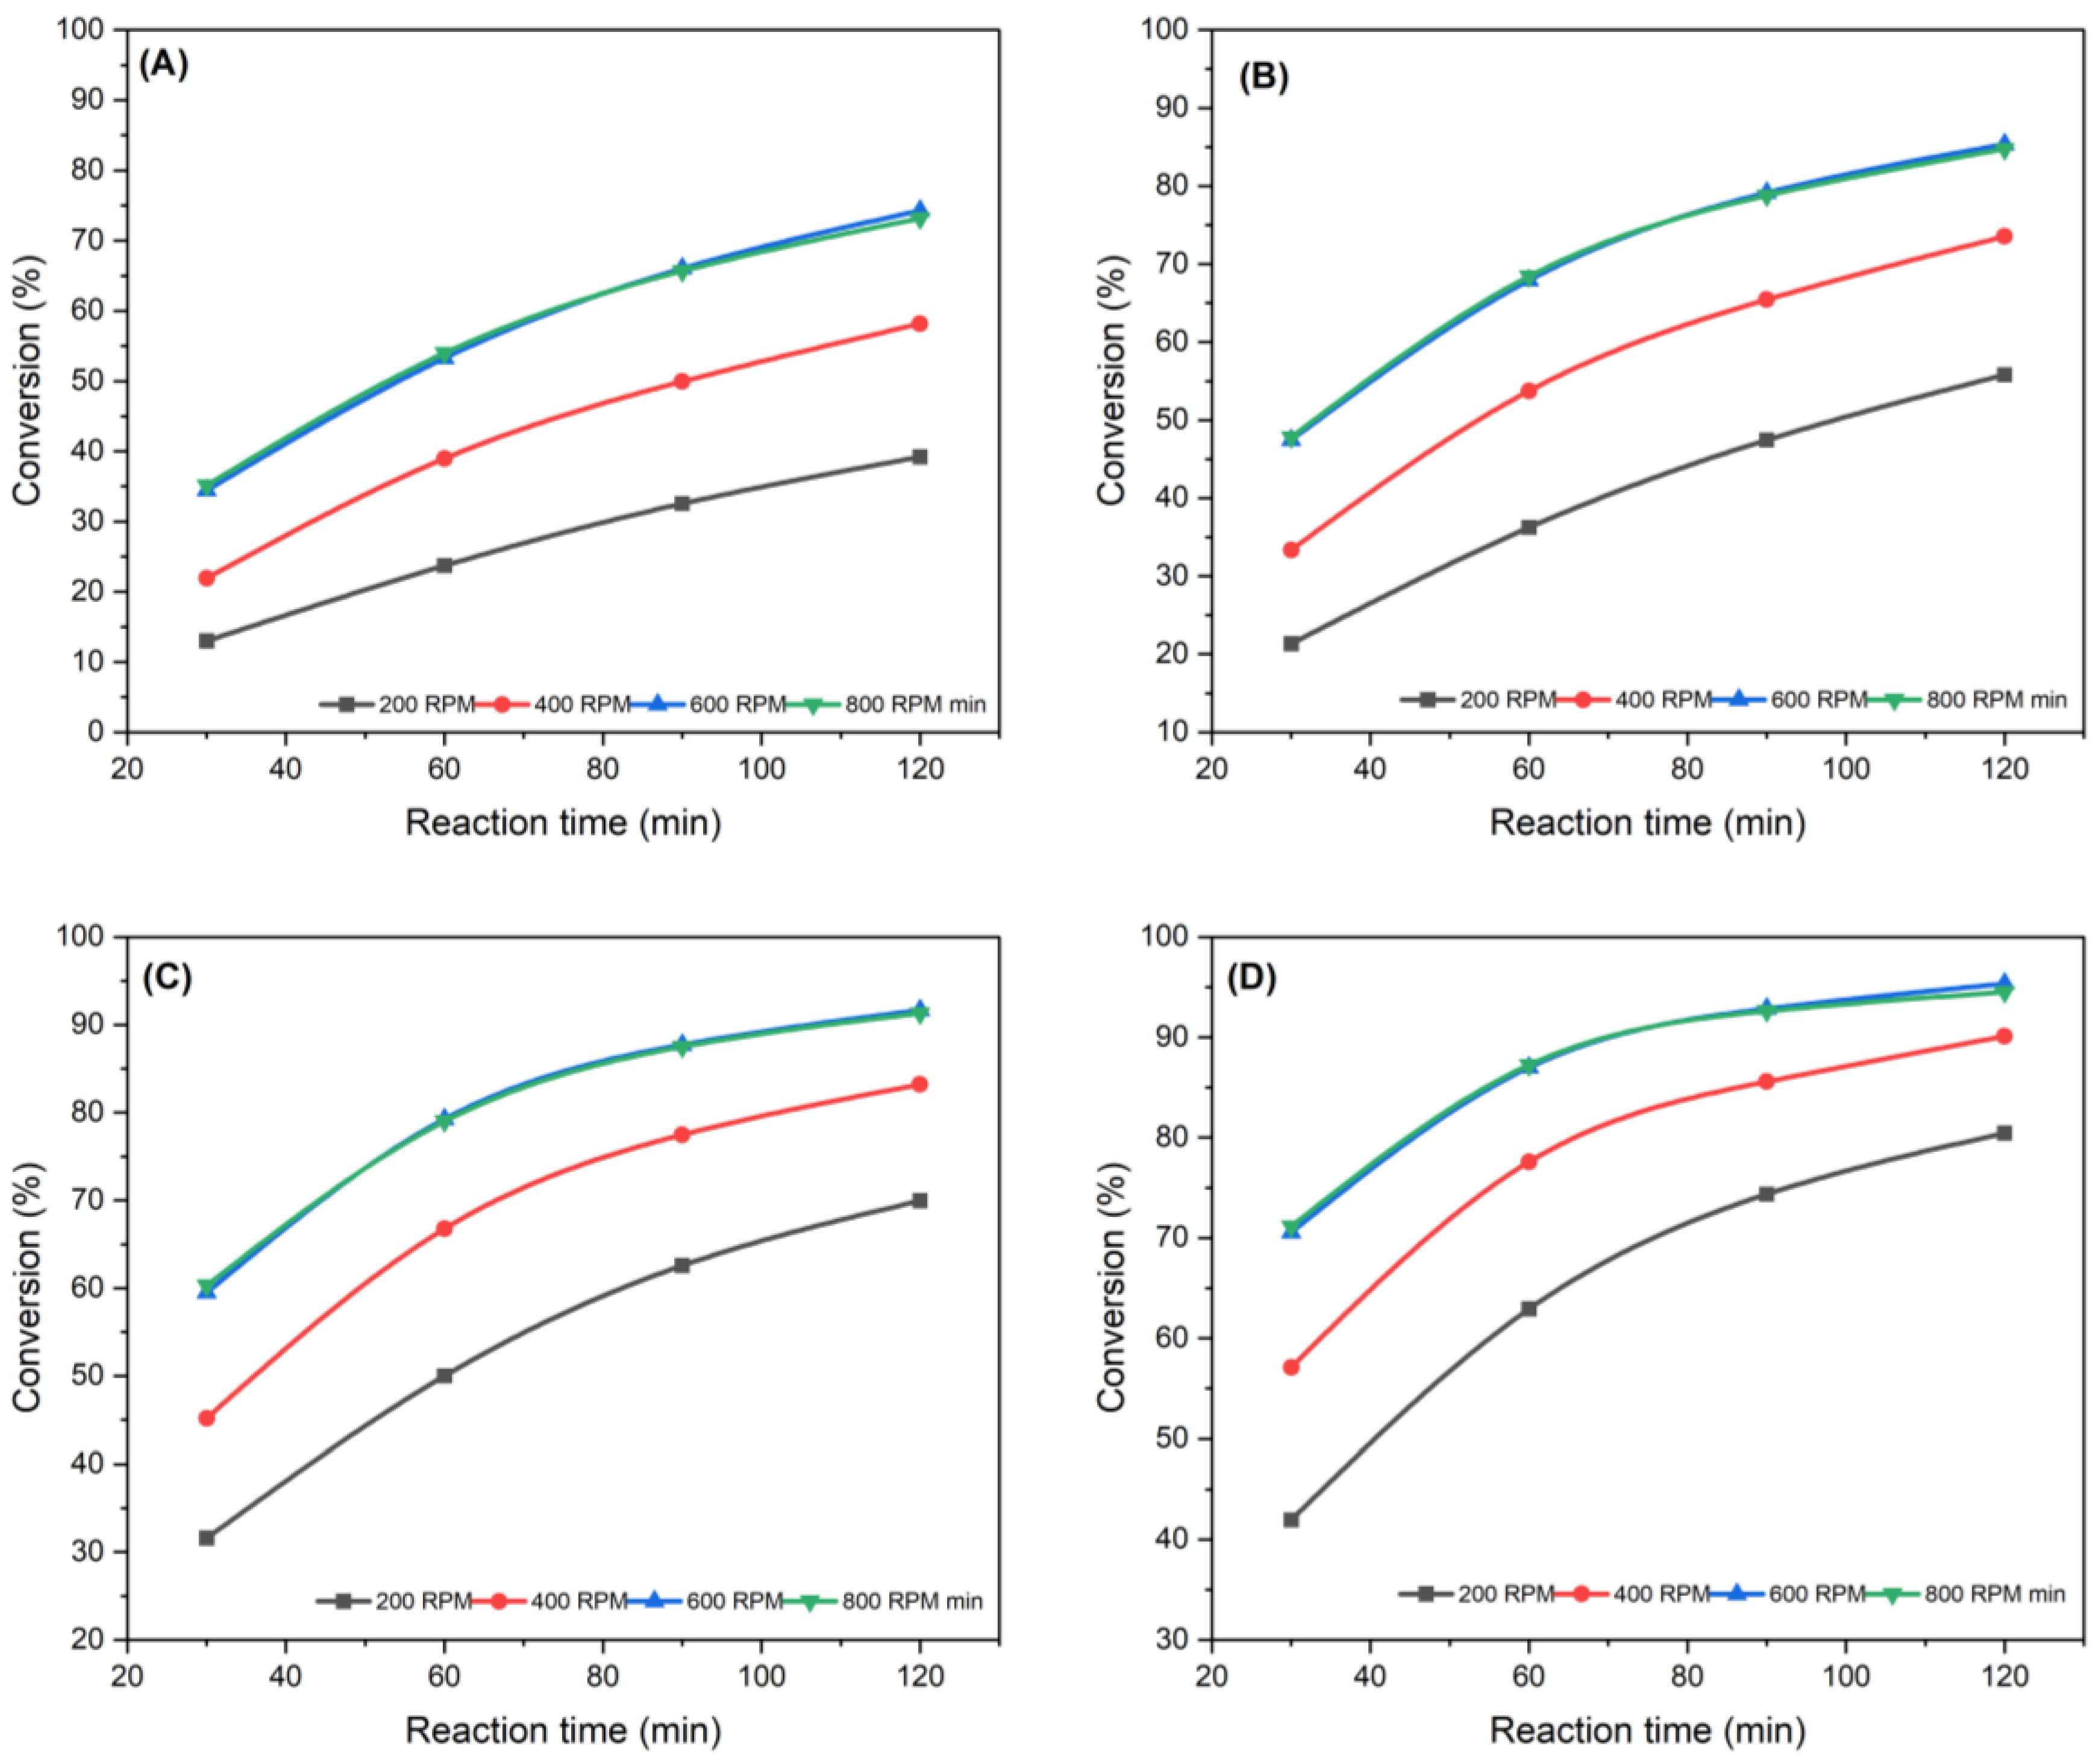
The impact of reaction time on phenol removal is shown in Figure 6A–D at different operating conditions. Figure 6A–D illustrates the impact of reaction time on the oxidation performance. It can be noticed that phenol removal in the BBBR reactor was dramatically promoted via raising the time of reaction as the phenol removal improved from 83.55% to 95.35% when the reaction time was enhanced from 30 min to 120 min at reaction temperature 85 °C and speed of digital 600 RPM, as shown in Figure 6C. This behavior is repeated to improve the time of contacting the oxidant and phenol, consequently supplying sufficient reaction time between phenol and hydroxyl radicals [23,24]. Therefore, oxidation technology needs sufficient time to complete as any other reaction and is improved as time is enhanced. The best oxidation performance was under the oxidation time of 120 min.

3.1.3. Influence of Reaction Temperature

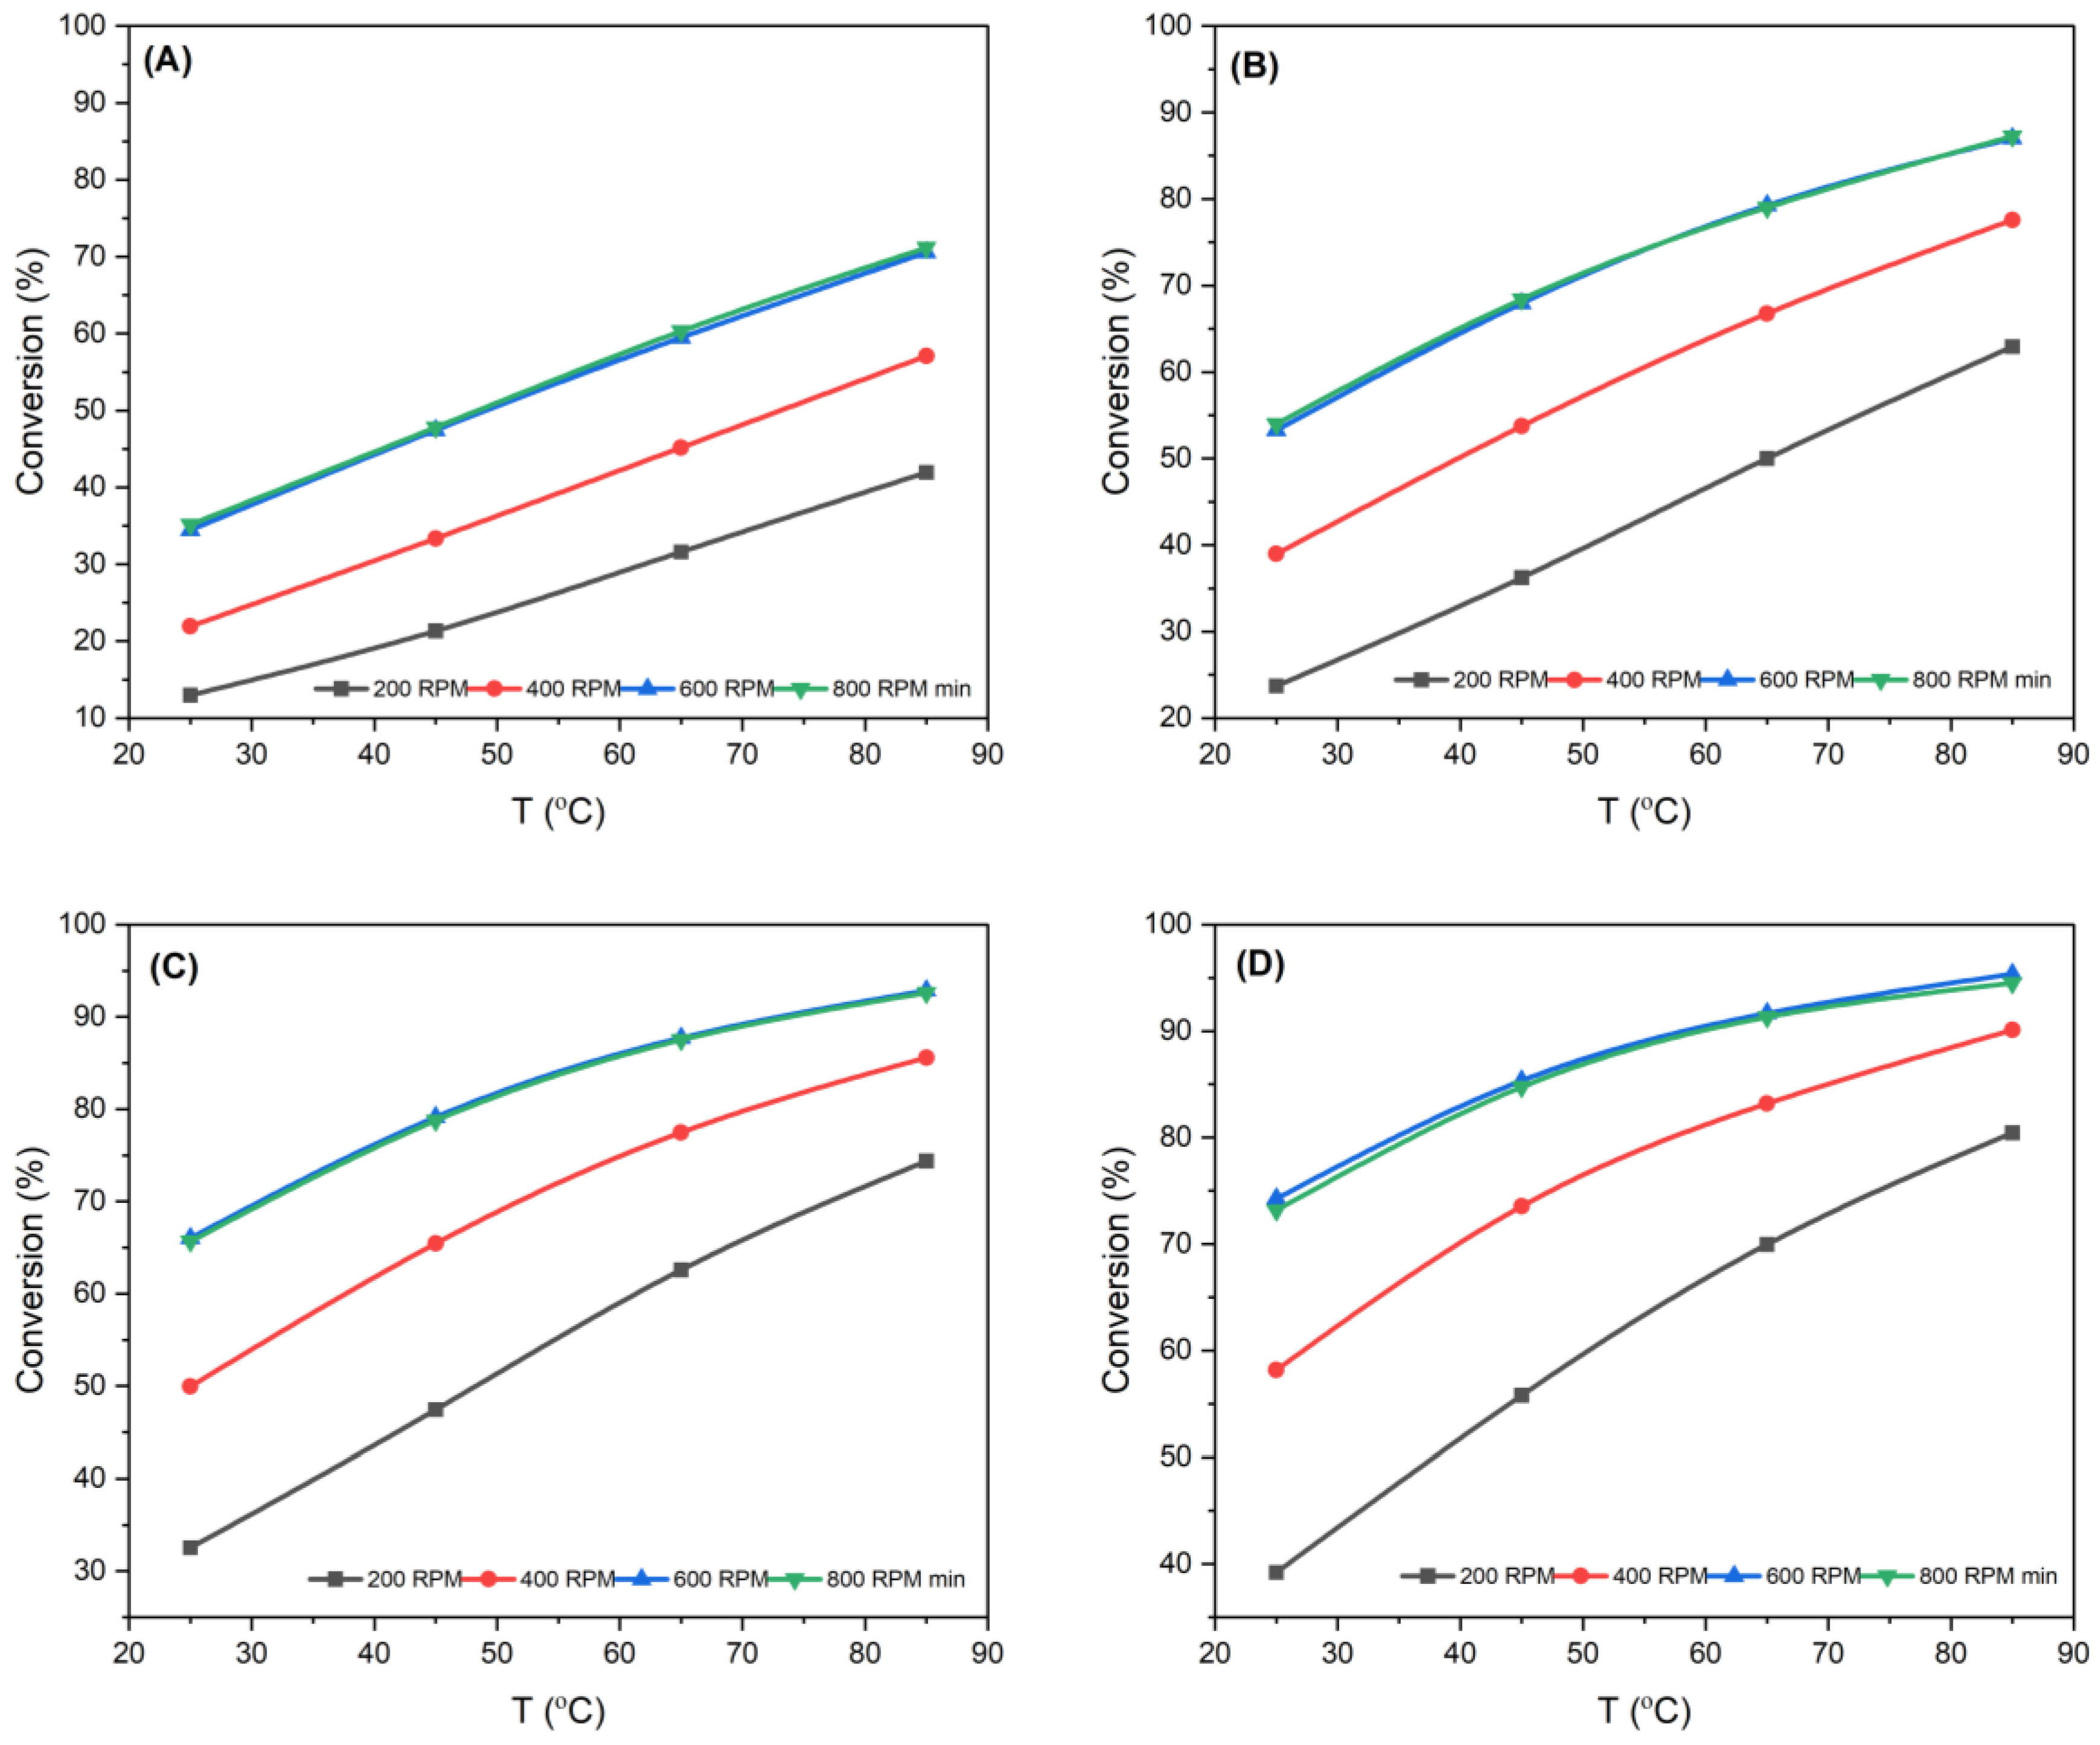
Figure 7A–C shows the effect of temperature on the oxidation of phenol. At different temperatures (25, 45, 65, and 85) °C, the optimal conversion of phenol was 95.35% at the reaction temperature 85 °C. Enhancing the temperature from 25 °C to 85 °C improved the phenol removal from 36.83% to 95.35% at 600 RPM and 120 min. Oxygen free radicals were formed with enhancing temperature, and reacted with oxygen and water to generate H2O2 and O3 [25]. Also, rising temperature improved the number of molecules sharing in oxidizing of phenol via enhancing the activation energy, which improved the phenol and oxygen diffusion inside the catalyst pores [16,17]. Figure 7A–C refers to the impact of the temperature on the phenol oxidation process.

4. Mathematical Model of DBBBR for Catalytic Phenol Oxidation Process

Mathematical models play a fundamental part in science and engineering in order to reinforce a conception of considerable operations and systems by employing mathematical equations. Mathematical modeling for the catalytic phenol oxidation process was applied by utilizing the gPROMS Version 7.1 (General Process Modeling System) program [14,15]. The equations provided in the mathematical modeling are listed in Table 4 [26,27,28,29,30,31,32,33,34,35,36,37,38,39].

5. Kinetic Parameters Estimation Technique

The kinetic parameters of the catalytic phenol oxidation reaction can be determined by conducting the mathematical modeling process with careful matching of the results of practical experiments with the expected data. In order to estimate the optimal values for kinetic parameters, the minimization of the following objective function was evaluated as summarized below:
OBJ = n = 1 Nt ( C phenol exp C phenol pred ) 2
In Equation (18), Nt is the number of experiments, C phenol exp means the experimental data, and C phenol pred is the mathematical model’s results.
The phenol conversion can be calculated using:
X phenol = 1 C phenol C phenol . t  

6. Optimization Problem Formulation for Evaluation of Kinetic Parameter

The problem of parameter evaluation was configured as follows:
Given—The conditions of the catalytic phenol oxidation reaction, the catalyst, and the reactor formation.
Obtain—The kinetic parameters (n, ko, and EA) for each designed catalyst.
So as to minimize—The sum of squared error (SSE).
Subjected to—Constraints of operation
Mathematically, by counting on the first approach, the optimization problem was presented as follows:
Min : SSE n , E A , k 0 S . t . f ( z , x ( z ) , ( z ) , u ( z ) , v ) = 0 C L C C U n l n n u E A L E A E A U k O L k i k O U
S.t.f(z, x(z), ẋ(z), u(z), v) = 0: refers to the oxidation process model. z: the independent variable. u(z): the decision variable. x(z): represents the set of all variables. ẋ(z): represents the derivative of the variables with respect to time. v: is the control variable. C, CL, CU: concentration, lower and upper bounds of concentration. L, U: are lower and upper bounds.

7. Description of Mathematical Modeling

7.1. Determination of Kinetic Parameters

The optimal kinetic parameters of the catalytic phenol removal process were specified by applying the mathematical modeling technique, which minimized the error between the concentrations of phenol resulting from experimental runs and values determined by the model. The constant parameters applied in the modeling technique are reported in Table 5 and the optimal model parameters at various rotation speeds are presented in Table 6, Table 7, Table 8 and Table 9.

7.2. Results of Experiment and Simulation

The experiment’s results and predicted data are summarized in Table 10, Table 11, Table 12 and Table 13. The generated values of kinetic parameters from ODS modeling give error <5% for all results.

8. Maximizing Phenol Removal Based on Optimal Operating Conditions

8.1. Formulation of Optimization Problem

The optimal kinetic parameters were employed to evaluate the best conditions for achieving the highest elimination of phenol. Therefore, the problem of optimization was created as follows:
Obtain—The optimal parameters for high conversion of phenol compounds.
So as to minimize—The phenol in wastewater.
Subjected to—Constraints in the operation.
The problem was represented mathematically as follows:
Min C phenol T j , time i j , C phenol j , ( j = RPM - 1 , 2 , 3 , 4 ) S . t . f ( z , x ( z ) , ( z ) , u ( z ) , v ) = 0 time L j time j time U j C phenol . tL j C phenol . t j C phenol . tU j T L j T j T U j X phenol . tL j X phenol . t j X phenol . tU j
The optimization technique was performed using gPROMS.

8.2. Optimal Values of Operating Conditions for Minimum Phenolic Compounds

The optimal operating conditions determined via using the optimization technique are presented in Table 14.

9. Conclusions

A novel nano-catalyst (8% Fe2O3/AC) was designed by employing the impregnated method in order to promote the catalytic phenol oxidation process, which was conducted in a recently developed but modified digital basket baffle batch reactor (DBBBR). There was a high morphology of metal oxide dispersed on the catalyst, as reported by SEM. The phenol oxidation process has shown dependency on the porosity of the prepared nano-catalyst, where such adsorbents’ surfaces (activated carbon) have the same base as the active metal oxides (Fe2O3). The designed nano-catalyst (8% Fe2O3/AC) was found to be a good adsorbent towards the phenolic compound, resulting in elimination of 95.35% phenol at mild operating conditions (reaction temperature 85 °C, reaction time 120 min, and speed of mixing 800 RPM). In the catalytic phenol removal process, it was observed that the utilization of nano-particles for catalyst preparation showed high performance. The IWI impregnation process is a good method for nano-catalyst preparation owing to the excellent dispersion of the active metal beside the high pore volume and surface area of the catalyst (8% Fe2O3/AC). The performance of 8% Fe2O3/AC depended, fundamentally, on the active compound and the amount of metal oxide loaded over the catalyst support (AC). The minimization of the sum of the squared error between the experimental data and predicted results of phenol removal was considered as a base for the optimization technique to estimate the optimal parameters for the kinetic process. The predicted conversion of phenol illustrated excellent agreement with the experimental results for a wide range of the operating condition, with absolute average errors less than 5%.

Author Contributions

Conceptualization, A.T.N. and J.I.H.; methodology, M.A.A. and A.T.N.; software, A.T.N. and S.A.H.; validation, A.T.N. and A.T.J.; formal analysis, A.T.N.; investigation, S.A.H. and A.T.N.; resources, M.A.A.; data curation, M.A.A. and J.I.H.; writing—original draft preparation, M.A.A.; writing—review and editing, I.M.M. and A.T.N.; visualization, A.T.N.; supervision, I.M.M. and A.T.N.; project administration, I.M.M. All authors have read and agreed to the published version of the manuscript.

Funding

This research received no external funding.

Data Availability Statement

All data and/or models used in the study appear in the submitted article.

Conflicts of Interest

The authors declare no conflict of interest.

Nomenclature

C ph Phenol concentration (mol/cm3)
X ph Conversion of phenol (-)
C ph Final concentration of phenol (mol/cm3)
C ph . t Initial concentration of phenol present in wastewater (mol/cm3)
kReaction rate constant
kAppApparent rate constant
D ei Effective diffusivity (cm2/s)
D ki Knudsen diffusivity
D mi Molecular diffusivity (cm2/s)
EAActivation energy (J/mol K)
M w , ph Molecular weight of phenol (gm/gmol)
TcCritical temperature of phenol (°R)
TbBoiling point temperature of phenol (°C)
TbrReduced boiling point temperature
TrReduced temperature
RGas constant (J/mol K)
n Order of reaction
r ph Reaction rate of phenol
r g Pore radius (nm)
r p Particle radius (nm)
S p External surface area of catalyst particle (cm2/gm)
S g Specific surface area of particle (cm2)
V p External volume of catalyst particle (cm3)
V g Pore volume (cm3/gm)
v l Liquid molar volume
v cl Critical molar volume of liquid (cm3/gmole)
v ph Molar volume of phenol
v c , ph Critical volume of phenol (cm3/gmole)
Greek Symbols
η 0 Effectiveness factor
α Constant factor
Φ Volume fraction of molecule
B Porosity
T Tortuosity
ρ B Bulk density (gm/cm3)
ρ p Particle density (gm/cm3)
μ ph Viscosity of phenol (mPa s)
μ ph , b Viscosity of phenol at boiling point (mPa s)
Initial (at time = 0)

References

  1. Zhang, S.; Zhou, L.; Li, Z.; Esmailpour, A.A.; Li, K.; Wang, S.; Liu, R.; Li, X.; Yun, J. Efficient Treatment of Phenol Wastewater by Catalytic Ozonation over Micron-Sized Hollow MgO Rods. ACS Omega 2021, 6, 25506–25517. [Google Scholar] [CrossRef] [PubMed]
  2. Iurascu, B.; Siminiceanu, I.; Vione, D.; Vicente, M.; Gil, A. Phenol degradation in water through a heterogeneous photo-Fenton process catalyzed by Fe-treated laponite. Water Res. 2009, 43, 1313–1322. [Google Scholar] [CrossRef]
  3. Hamad, K.I.; Humadi, J.I.; Issa, Y.S.; Gheni, S.A.; Ahmed, M.A.; Hassan, A.A. Enhancement of activity and lifetime of nano-iron oxide catalyst for environmentally friendly catalytic phenol oxidation process. Clean. Eng. Technol. 2022, 11, 100570. [Google Scholar] [CrossRef]
  4. Turhan, K.; Uzman, S. Removal of phenol from water using ozone. Desalination 2008, 229, 257–263. [Google Scholar] [CrossRef]
  5. Hamin, J.M.; Aysar, T.J.; Ban, A.A.; Hala, M.H. Preparation of synthetic composite nano-catalyst for oxidative desulfu-rization of kerosene. Energy Sources Part A Recovery Util. Environ. Eff. 2023, 45, 1672–1685. [Google Scholar]
  6. Jarullah, A.T.; Ahmed, A.N.; Ahmed, B.A.; Ahmed, A.M. Design of New Composites Nano-Catalysts for Naphtha Reforming Process: Experiments and Process Modeling. Tikrit J. Eng. Sci. 2023, 30, 46–59. [Google Scholar] [CrossRef]
  7. Pan, W.; Fang, B.X.; Xin, L.Y. Catalytic oxidation of phenol in wastewater-A new application of the amorphous Fe78Si9B13 alloy. Chin. Sci. Bull. 2012, 57, 33–40. [Google Scholar]
  8. Hamoud, S.; Sayari, A.; Belkacemi, K.; Bonneviot, L.; Larachi, F. Catalytic wet oxidation of phenol over Ptx-Ag1−xMnO2/CeO2 catalysts. Catal. Today 2000, 62, 379–388. [Google Scholar] [CrossRef]
  9. Barrault, J.; Bouchoule, C.; Tatibouët, J.M.; Abdellaoui, M.; Majesté, A.; Louloudi, I.; Papayannakos, N.; Yan, Y.; Wu, X.; Zhang, H. Catalytic wet peroxide oxidation of phenol over Fe2O3/MCM-41 in a fixed bed reactor. Sep. Purif. Technol. 2016, 171, 52–61. [Google Scholar]
  10. Jangid, P.; Inbaraj, M.P. Applications of nanomaterials in wastewater treatment. Mater. Today Proc. 2021, 43, 2877–2881. [Google Scholar] [CrossRef]
  11. Humadi, J.I.; Nawaf, A.T.; Jarullah, A.T.; Ahmed, M.A.; Hameed, S.A.; Mujtaba, I.M. Design of new nano-catalysts and digital basket reactor for oxidative desulfurization of fuel: Experiments and modelling. Chem. Eng. Res. Des. 2023, 190, 634–650. [Google Scholar] [CrossRef]
  12. Pinho, M.T.; Ribeiro, R.S.; Gomes, H.T.; Faria, J.L.; Silva, A.M.T. Screening of Activated Carbons for the Treatment of Highly Concentrated Phenol Solutions Using Catalytic Wet Peroxide Oxidation: The Effect of Iron Impurities on the Catalytic Activity. Catalysts 2020, 10, 1318. [Google Scholar] [CrossRef]
  13. Jain, M.; Yadav, M.; Kohout, T.; Lahtinen, M.; Garg, V.K.; Sillanpää, M. Development of iron oxide/activated carbon na-noparticle composite for the removal of Cr(VI), Cu(II) and Cd(II) ions from aqueous solution. Water Resour. Ind. 2018, 20, 54–74. [Google Scholar] [CrossRef]
  14. Nawaf, A.T.; Jarullah, A.T.; Gheni, S.A.; Mujtaba, I.M. Development of Kinetic and Process Models for the Oxidative Desulfurization of Light Fuel, Using Experiments and the Parameter Estimation Technique. Ind. Eng. Chem. Res. 2015, 54, 12503–12515. [Google Scholar] [CrossRef] [Green Version]
  15. Jarullah, A.T.; Ahmed, M.A.; Al-Tabbakh, B.A.; Mujtaba, I.M. Design of a new synthetic nanocatalyst resulting high fuel quality based on multiple supports: Experimental investigation and modeling. Chem. Prod. Process. Model. 2022, 18, 265–293. [Google Scholar] [CrossRef]
  16. Aabid, A.A.; Humadi, J.I.; Ahmed, G.S.; Jarullah, A.T.; Ahmed, M.A.; Abdullah, W.S. Enhancement of Desulfurization Process for Light Gas Oil Using New Zinc Oxide Loaded Over Alumina Nanocatalyst. Appl. Sci. Eng. Prog. 2023, 16, 6756. [Google Scholar] [CrossRef]
  17. Humadi, J.I.; Gheni, S.A.; Ahmed, S.M.R.; Abdullah, G.H.; Phan, A.N.; Harvey, A.P. Fast, non-extractive, and ultradeep desulfurization of diesel in anoscillatory baffled reactor. Process Saf. Environ. Prot. 2021, 152, 178–187. [Google Scholar] [CrossRef]
  18. Saleh, T.A. Nanotechnology in Oil and Gas Industries: Principles and Applications; Springer: Cham, Switzerland, 2017. [Google Scholar]
  19. Saka, C. BET, TG–DTG, FT-IR, SEM, iodine number analysis and preparation of activated carbon from acorn shell by chemical activation with ZnCl2. J. Anal. Appl. Pyrolysis 2012, 95, 21–24. [Google Scholar] [CrossRef]
  20. Bakti, A.I.; Gareso, P.L. Characterization of Active Carbon Prepared from Coconuts Shells using FTIR, XRD and SEM Techniques. J. Ilm. Pendidik. Fis. Al Biruni 2018, 7, 33–39. [Google Scholar] [CrossRef] [Green Version]
  21. Ramzannezhad, A.; Bahari, A. Characteristics of Fe3O4, α -Fe2O3, and γ -Fe2O3 Nanoparticles as Suitable Candidates in the Field of Nanomedicine. J. Supercond. Nov. Magn. 2017, 30, 2165–2174. [Google Scholar]
  22. Khoshnam, M.; Farahbakhsh, J.; Zargar, M.; Mohammad, A.W.; Benamor, A.; Ang, W.L.; Mahmoudi, E. α-Fe2O3/graphene oxide powder and thin film nanocomposites as peculiar photocatalysts for dye removal from wastewater. Sci. Rep. 2021, 11, 20378. [Google Scholar] [CrossRef] [PubMed]
  23. Kuśmierek, K.; Świątkowski, A. The influence of different agitation techniques on the adsorption kinetics of 4-chlorophenol on granular activated carbon. React. Kinet. Catal. Lett. 2015, 116, 261–271. [Google Scholar] [CrossRef] [Green Version]
  24. Humadi, J.I.; Gheni, S.A.; Ahmed, S.M.R.; Harvey, A. Dimensionless evaluation and kinetics of rapid and ultradeep desulfurization of diesel fuel in an oscillatory baffled reactor. RSC Adv. 2022, 12, 14385–14396. [Google Scholar] [CrossRef] [PubMed]
  25. Ahmed, G.S.; Humadi, J.I.; Aabid, A.A. Mathematical Model, Simulation and Scale up of Batch Reactor Used in Oxidative Desulfurization of Kerosene. Iraqi J. Chem. Pet. Eng. 2021, 22, 11–17. [Google Scholar] [CrossRef]
  26. Zazo, J.A.; Pliego, G.; Blasco, S.; Casas, J.A.; Rodriguez, J.J. Intensification of the Fenton process by increasing the tem-perature. Ind. Eng. Chem. Res. 2011, 50, 866–870. [Google Scholar] [CrossRef]
  27. Lann, L.M.V.; Cabassud, M.; Casamatta, G. Modeling, Optimization and Control of Batch Chemical Reactors in Fine Chemical Production. IFAC Proc. Vol. 1998, 31, 715–724. [Google Scholar] [CrossRef]
  28. Froment, G.F.; Bischoff, K.B.; Wilde, J.D. Chemical Reactor Analysis and Design; Wiley: New York, NY, USA, 1990. [Google Scholar]
  29. Marroquín, G.; Ancheyta, J.; Esteban, C. A batch reactor study to determine effectiveness factors of commercial HDS catalyst. Catal. Today 2005, 104, 70–75. [Google Scholar] [CrossRef]
  30. Jarullah, A.T.; Ahmed, G.S.; Al-Tabbakh, B.A.; Mujtaba, I.M. Enhancement of light naphtha quality and environment using new synthetic nano-catalyst for oxidative desulfurization: Experiments and process modeling. Comput. Chem. Eng. 2020, 140, 106869. [Google Scholar] [CrossRef]
  31. Humadi, J.I.; Razzaq, G.H.A.; Khamees, L.A.; Ahmed, M.A.; Saeed, L.I. Improved Kerosene Quality with the Use of a Gamma Alumina Nanoparticles Supported Zinc Oxide Catalyst in a Digital Batch Baffled Reactor: Experiments and Process Modelling. Korean Chem. Eng. Res. 2023, 61, 226–233. [Google Scholar]
  32. Mohammed, A.E.; Jarullah, A.T.; Ghenia, S.A.; Mujtaba, I.M. Optimal design and operation of an industrial three phase reactor for the oxidation of phenol. Comput. Chem. Eng. 2016, 94, 257–271. [Google Scholar] [CrossRef] [Green Version]
  33. Duduković, M.P.; Larachi, F.; Mills, P.L. Multiphase catalytic reactors: A perspective on current knowledge and future trends. Catal. Rev. 2002, 44, 123–246. [Google Scholar] [CrossRef]
  34. Mohammed, A.E.; Jarullaha, A.T.; Ghenia, S.A.; Mujtaba, I.M. Significant Cost and energy Savings Opportunities in industrial three phase reactor for phenol oxidation. Comput. Chem. Eng. 2017, 104, 201–210. [Google Scholar] [CrossRef] [Green Version]
  35. Nawaf, A.T. Optimal Kinetic Parameters of Trickle bed Reactor for Oxidation of 2-Proplymercaptan in Naphtha. Diyala J. Eng. Sci. 2019, 12, 83–100. [Google Scholar] [CrossRef]
  36. Al-Obaidi, M.A.; Kara-Zaïtri, C.; Mujtaba, I.M. Removal of phenol from wastewater using spiral-wound reverse osmosis process: Model development based on experiment and simulation. J. Water Process Eng. 2017, 18, 20–28. [Google Scholar] [CrossRef] [Green Version]
  37. Al-Obaidi, M.A.; Jarullah, A.T.; Kara-Zaïtri, C.; Mujtaba, I.M. Simulation of hybrid trickle bed reactor–reverse osmosis process for the removal of phenol from wastewater. Comput. Chem. Eng. 2018, 113, 264–273. [Google Scholar] [CrossRef] [Green Version]
  38. Jarullah, A.T.; Ahmed, A.M.; Hussein, H.M.; Ahmed, A.N.; Mohammed, H.J. Evaluation of synthesized Pt/HY-H- Mor-denite composite catalyst for Isomerization of Light Naphtha. Tikrit J. Eng. Sci. 2023, 30, 94–103. [Google Scholar] [CrossRef]
  39. Nawaf, A.T.; Gheni, S.A.; Jarullah, A.T.; Mujtaba, I.M. Optimal Design of a Trickle Bed Reactor for Light Fuel Oxidative Desulfurization Based on Experiments and Modeling. Energy Fuels 2015, 29, 3366–3376. [Google Scholar] [CrossRef] [Green Version]
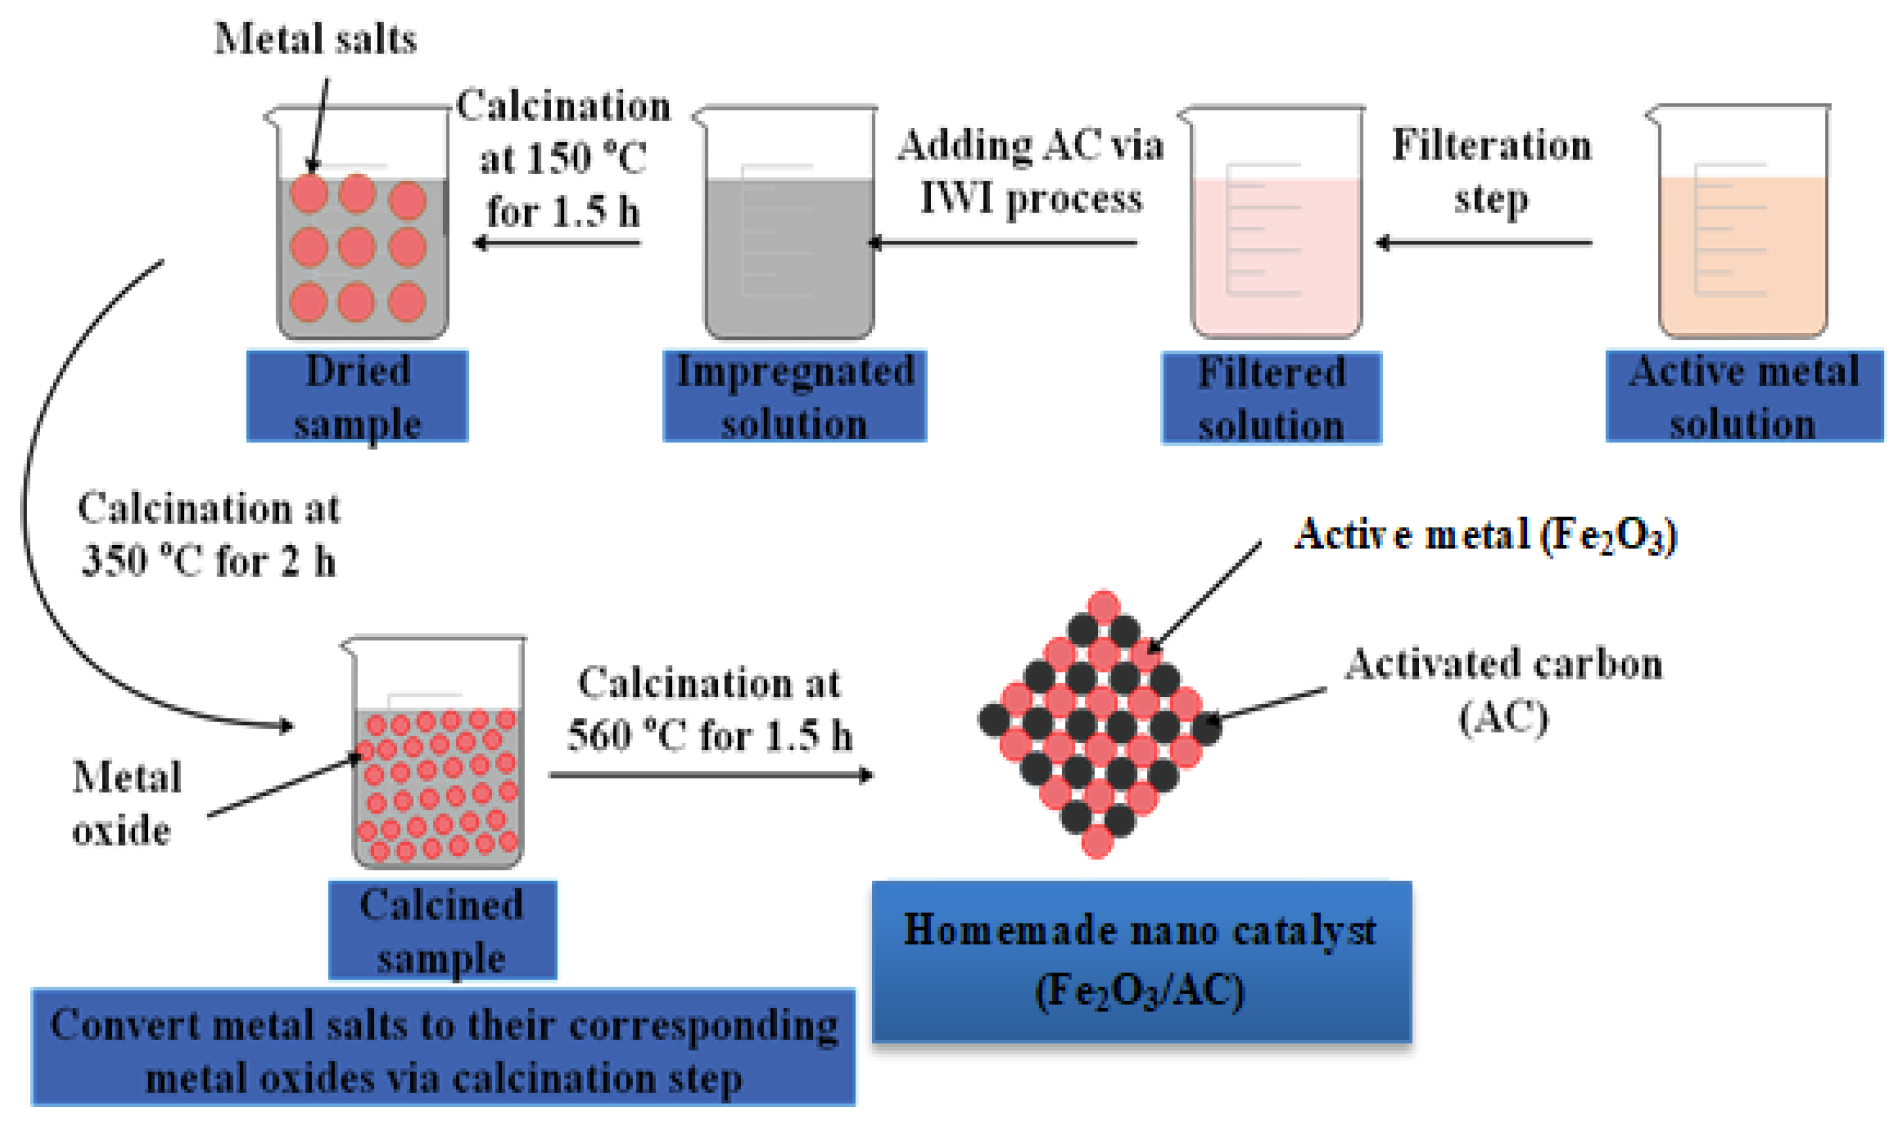
Figure 1. Synthesis of nano-catalyst (8% Fe2O3/AC) using the IWI process.
Processes 11 01990 g001
Figure 2. Schematics of the novel digital basket baffle batch reactor system.
Processes 11 01990 g002
Figure 3. SEM images (A) and EDX (B) for the designed nano-catalyst (8% Fe2O3/AC).
Processes 11 01990 g003
Figure 4. FTIR for (A) activated carbon (AC) and (B) nano-catalyst (8% Fe2O3/AC).
Processes 11 01990 g004
Figure 5. Effect of mixing speed on the removal of phenol process using (8%Fe2O3/AC) at different reaction times (30, 60, 90, and 120) min and at (A) 25 °C, (B) 45 °C, (C) 65 °C, and (D) 85 °C.
Processes 11 01990 g005
Figure 6. Impact of oxidation time on the removal of phenol process using (8%Fe2O3/AC) at different speeds of mixing (200, 400, 600, and 800) min and at (A) 25 °C, (B) 45 °C, (C) 65 °C, and (D) 85 °C.
Processes 11 01990 g006
Figure 7. Effect of reaction temperature on the removal of phenol process using (8%Fe2O3/AC) at different speeds of mixing (200, 400, 600, and 800) min and at (A) 30 min, (B) 60 min, (C) 90 min, and (D) 120 min.
Processes 11 01990 g007
Table 1. The specifications of the DBBBR.
DescriptionSpecification
Dimension of reactor Height = 12 cm, Diameter = 10 m
Length of the rod37 cm
Type of impeller (Stainless steel)Four basket impeller
Height of basket 1.2 cm
Length of basket1.2 cm
Width of basket1.2 cm
Impeller diameter94 mm
Height of baffle (Stainless steel)10 cm
Width of baffle 1.5–1.8 cm
Table 2. BET results for AC and prepared nano-catalyst.
PropertySupport (AC)Nano-Catalyst (8% Fe2O3/AC)
Surface area, m2g−1908.880778.107
Total pore volume, cm3g−10.5120.4416
Mean pore diameter, nm2.2552.3824
Table 3. The amount of element on nano-catalyst.
ElementLine TypeWeight %Weight % SigmaAtomic %
CK series57.770.3570.37
OK series26.800.3324.51
FeK series10.460.192.74
Table 4. The set of equations utilized in the mathematical modeling process.
Parameter (Symbol)Equations/ValuesEquation No.
Rate of reaction ( r ph ) ( r ph ) = ƞ 0   k   C ph n (1)
Arrhenius equation (k)k = k0 e ( EA RT ) (2)
The final phenol content ( C ph ) C ph = [ C ph , t ( 1 n ) + ( n 1 ) . t .   K in   ƞ 0 ] ( 1 1 n ) (3)
The effectiveness factor ( ƞ 0 ) ƞ 0 = 3 ( ɸ   cot h ɸ 1 ) ɸ 2 (4)
Thiele modulus ( ɸ ) ɸ = V P   S P ( n + 1 2 ) k in   C ph ( n 1 ) ρ p D ei (5)
The catalyst effective diffusivity ( D ei ) D ei = B T 1 1 D mi + 1 D ki (6)
The porosity of catalyst ( B ) B = V g ρ p (7)
Particle density ( ρ p ) ρ p = ρ B 1 B (8)
The tortuosity factor (𝒯)Tortuosity factor (𝒯) of the pore network (2 to 7)----
The Knudsen diffusivity ( D ki ) D ki = 9700   r g ( T M w , ph ) 0.5 (9)
Mean pore radius ( r g ) r g = 2 V g S g (10)
The molecular diffusivity ( D mi ) D mi = 8.93 10 8 ( v l 0.267 T v ph 0.267 µ ph ) (11)
The molar volume of the liquid ( v l ) v l = 0.285 ( v cl ) 1.048 (12)
The molar volume of the phenol compound ( v ph ) v ph = 0.285 ( v cph ) 1.048 (13)
The external volume of the catalyst (For sphere particle) ( V p ) V p = 4 3 π ( r p ) 3 (14)
The external surface of the catalyst (For sphere particle) (Sp) S p = 4 π ( r p ) 2 (15)
The phenol viscosity ( µ ph ) µ ph = exp [ ln ( α µ ph , b ) ln ( µ ph , b ) ln ( α µ ph , b ) ] ϕ (16)
Constant factor ( α ) 0.1175 for alcohols and 0.248 for other materials.----
Molecule volume fraction ( ϕ ) ϕ = 1 ( T / T c ) 1 ( T b / T c ) (17)
Table 5. Constant parameters applied in the modeling.
Parameter, UnitValue
Initial content of phenol (Ct), ppm839
Reaction time 1, 2, 3, 4, min30, 60, 90, 120
Reaction temperature (T1, 2, 3, 4), °C25, 45, 65, 85
R, J/mole.°K8.314
Vg, cm3/gm0.4536
Sg, cm2/gm7,073,700
Vp, cm30.0114137
Sp, cm20.28274
ρB. gm/cm31.79377
M.Wt of phenol 184
rg, nm1.28249
v cl , cm3/gmole 55.95
v c , ph , cm3/gmole 229
Tc, °R1250
Table 6. Oxidation model parameters (Optimal) under 200 RPM.
ParameterValue
n (-)1.9997
EA (KJ/mol)28.8292
ko ( wt 0.999726 . min 1 ) 9989.6200
SSE (-)1.13996 × 10⁻⁵
Table 7. Oxidation model parameters (Optimal) under 400 RPM.
ParameterValue
n (-)1.9869
EA (KJ/mol)28.1398
ko ( wt 0.999726 . min 1 ) 15,712.4700
SSE (-)7.81139 × 10⁻⁶
Table 8. Oxidation model parameters (Optimal) under 600 RPM.
ParameterValue
n (-)1.9265
EA (KJ/mol)25.6211
ko ( wt 0.999726 . min 1 ) 11,854.0200
SSE (-)7.3293 × 10⁻⁶
Table 9. Oxidation model parameters (Optimal) under 800 RPM.
ParameterValue
n (-)1.9629
EA (KJ/mol)25.9162
ko ( wt 0.999726 . min 1 ) 14,265.0800
SSE (-)7.0075 × 10⁻⁶
Table 10. Experiment and simulation results under 200 RPM.
Temperature
(°C)
Time
(min)
Phenol Concentration (ppm)Conversion %Error %
ExperimentalPredictedExperimentalPredicted
2530730725.3912.9913.540.63
2560640633.2623.7224.521.05
2590566558.6432.5433.421.301
25120510497.6239.2140.692.43
4530660654.5221.3421.990.831
4560535523.0436.2337.662.24
4590441428.6247.4448.912.81
45120371359.3655.7957.173.14
6530574570.5331.5931.100.60
6560419408.4550.0151.322.52
6590314308.1562.5763.271.86
65120252243.1269.9671.023.52
8530487479.4541.9542.861.56
8560311303.1262.9363.882.53
8590215211.0674.3774.841.83
85120164158.2680.4581.143.50
Table 11. Experiment and simulation results under 400 RPM.
Temperature
(°C)
Time
(min)
Phenol Concentration (ppm)Conversion %Error %
ExperimentalPredictedExperimentalPredicted
2530655655.1021.9321.810.15
2560512524.2638.9837.512.40
2590420428.9949.9448.872.14
25120351358.8058.1657.242.22
4530559564.3133.3732.740.95
4560388398.9853.7552.452.84
4590290297.3565.4464.562.53
45120222232.0573.5472.344.53
6530460464.4545.1744.640.97
6560279285.3366.7565.102.27
6590189194.1777.4776.862.73
65120141143.0683.1982.951.46
8530360365.5357.0956.431.54
8560188194.5677.5976.813.49
8590121122.9085.5885.351.57
851208387.0790.1189.624.90
Table 12. Experiment and simulation results under 600 RPM.
Temperature
(°C)
Time
(min)
Phenol Concentration (ppm)Conversion %Error %
ExperimentalPredictedExperimentalPredicted
2530550547.3034.4534.770.50
2560392375.1653.2855.294.30
2590285271.5766.0367.634.71
25120216206.5074.2675.394.40
4530441422.0347.4449.704.30
4560269259.0867.9469.123.69
4590175169.2879.1479.823.27
45120123120.6285.3485.621.94
6530340339.8659.4859.490.04
6560174169.8379.2679.762.40
6590103102.1087.7287.830.87
651207069.6591.6691.700.50
8530247249.9370.5670.211.19
8560109108.2287.0187.100.72
85906061.4492.8592.682.40
851203940.9195.3595.124.90
Table 13. Experiment and simulation results under 800 RPM.
Temperature
(°C)
Time
(min)
Phenol Concentration (ppm)Conversion %Error %
ExperimentalPredictedExperimentalPredicted
2530544522.0235.1637.784.04
2560386381.9153.9954.481.06
2590288278.9965.6766.753.13
25120225213.9873.1874.504.90
4530438446.7747.8046.752.00
4560265265.0468.4268.410.02
4590178175.3178.7879.111.51
45120128126.3284.7484.941.31
6530333344.2060.3158.983.36
6560172174.8079.5079.171.63
6590105106.7687.4987.281.68
651207373.8391.3091.201.13
8530242253.7671.1669.764.86
8560107112.2487.25086.624.90
85906264.9692.6192.264.77
851204643.9394.5294.774.52
Table 14. Optimal operating conditions for the oxidation process utilizing the designed catalyst.
Parameter, UnitValues
RPM-1RPM-2RPM-3RPM-4
C phenol . t , ppm8658641104956
T, °C77808781
Time, min200193190180
Conversion, %86.9993.4998.1096.99
Disclaimer/Publisher’s Note: The statements, opinions and data contained in all publications are solely those of the individual author(s) and contributor(s) and not of MDPI and/or the editor(s). MDPI and/or the editor(s) disclaim responsibility for any injury to people or property resulting from any ideas, methods, instructions or products referred to in the content.