Article

A New Fast Calculating Method for Meshing Stiffness of Faulty Gears Based on Loaded Tooth Contact Analysis

1
Shaanxi Engineering Laboratory for Transmissions and Controls, Northwestern Polytechnical University, Xi’an 710072, China
2
National Key Laboratory of Science and Technology on Helicopter Transmission, Nanjing University of Aeronautics and Astronautics, Nanjing 210016, China
3
Key Laboratory of Vehicle Transmission, China North Vehicle Research Institute, Beijing 100072, China
*
Author to whom correspondence should be addressed.
Processes 2023, 11(7), 2003; https://doi.org/10.3390/pr11072003
Submission received: 17 May 2023 / Revised: 17 June 2023 / Accepted: 30 June 2023 / Published: 3 July 2023

Abstract

:
Gear transmission systems are widely used in various fields. The occurrence of gear cracks, tooth pitting, and other faults will lead to the dynamic characteristics deterioration of the transmission system. In order to calculate the meshing stiffness of faulty gear pairs more effectively and precisely, this article improves the loaded tooth contact analysis (LTCA) method by analyzing the influence of different fault types on gear deformation, including bending-shearing deformation and contact deformation, which combines the accuracy of the finite element method (FEM) and the rapidity of the analytical method (AM). The improved LTCA method can model the fault areas accurately and optimize the deformation coordination equation under the actual meshing situation of the faulty gear tooth, making it suitable for calculating the meshing stiffness of faulty gears. Based on the calculation results of the finite element method, the accuracy of the improved meshing stiffness calculation method has been verified, and the sensitivity of different fault type parameters on meshing stiffness has been studied.

1. Introduction

Gear transmission systems, as an intermediate transmission mechanism, are widely used in industrial, civil, and military fields, such as helicopters, wind turbines, excavators, vehicles, and machine tools. Unlike other transmission devices, the gear transmission system is not only subjected to external excitation from the working machinery during operation [1,2] but also subjected to internal inherent excitation generated by the TVMS of its own gear pairs. This has an undeniable impact on its accuracy and dynamic characteristics. Therefore, accurately calculating the TVMS of the gear pair is crucial for studying the dynamic response of the gear transmission system. At present, there are three main types of methods for solving healthy gear pairs meshing stiffness: The analytical method, the finite element method, and the analytical-finite element method. The analytical method simplifies the gear tooth as a cantilever beam to solve the gear meshing stiffness. This method has high computational efficiency and is convenient to apply, but it is difficult to accurately calculate the contact deformation of the tooth surface. The finite element method has a high computational accuracy and its calculation results have been unanimously approved by researchers. However, it is often used as a benchmark to evaluate the accuracy of other calculation methods because of its long calculation time cost. The analytical-finite element method combines the advantages of the two methods, ensuring computational accuracy while maintaining high computational efficiency. In the analytical-finite element method, the analytical method is used to solve contact deformation of the gear surface, and the finite element method is used to solve bending-shearing deformation of the gear tooth [3,4].
The potential energy method, as an analytical method, simplifies the gear tooth as a cantilever beam, taking the bending stiffness, shearing stiffness, axial compression stiffness, Hertz contact stiffness, and fillet foundation stiffness into consideration [5,6,7]. When there are cracks or pitting on the gear tooth, certain relevant parameters in the potential energy method calculation equation will change from constants to variables, such as the inertia moment and cross-sectional area of the gear tooth [8,9]. The finite element method involves a large amount of calculation. If we consider the gear pairs under crack or pitting faults, we also need to build a 3D model of the faulty area. This will increase the number of finite element meshes and further reduce the calculation efficiency [10,11]. Especially when it is necessary to consider the impact of different faulty sizes on meshing stiffness, repeating calculations can lead to a sharp increase in calculation time costs.
The occurrence of cracks will cause changes in the relevant parameters of the gear tooth cantilever beam model. Based on the potential energy method, Chen et al. [12] proposed that the occurrence of cracks will reduce the effective tooth thickness, leading to a decrease in meshing stiffness. Then a meshing stiffness analysis and calculation model for non-uniformly distributed root cracks in the tooth width direction was studied, which can better predict the meshing stiffness of gear pairs with initial or larger tooth cracks. Based on the gear tooth profile equation, Cui et al. [13] referred to the actual manufacturing process and introduced parabola and straight influence lines to study the influence of variable tooth crack angles on meshing stiffness. In addition, researchers studied the gear meshing stiffness under various types of tooth cracks. Mohammed and Rrantalo [14] modeled and analyzed the propagation of cracks in the depth and length directions, studied the natural frequency of the gear pair, and conducted a time–frequency analysis. Chen and Shao [15] studied the influence of gear tooth cracks with different crack sizes and angles on the dynamic response of planetary gear systems and obtained the dynamic characteristics differences of planetary gear systems under the sun gear crack or planetary gear crack. Chen and Shao [16] proposed a method for calculating meshing stiffness, which can calculate the meshing stiffness with different crack lengths and depths and simulate the impact of crack size on the dynamics characteristics.
The occurrence of pitting faults will affect the morphology of the tooth surface. Research has found that when there is pitting on the contact line, the meshing stiffness will reduce significantly. Jiang et al. [17] considered the changes in meshing position and the loss of contact line length caused by tooth spalling faults, calculated the contact line length at the actual meshing position, and obtained the time-varying contact stiffness through the Hertz contact algorithm. Han et al. [18] combined the slicing method and potential energy method to study the effect of pitting on the time-varying meshing stiffness of helical gear pairs. When calculating the meshing stiffness of pitting gear pairs, we often use rectangular or circular pits to model the pitting area. Liang et al. [19] simulated pitting faults by using a circular pitting model, derived the meshing stiffness of external spur gears with the potential energy method, studied the effect of tooth surface pitting on the gear meshing stiffness, and verified it by using the finite element method. Saxena et al. [20] proposed a method to calculate the meshing stiffness of different types of pitting considering the sliding friction and pointed out that the shape, size, and position of the spalling are important parameters of the time-varying meshing stiffness. Some researchers describe the severity of pitting faults based on the size of pitting and the number of pitting. Liang et al. [21] used the 2 mm diameter circular pits to model pitting fault, described the severity of pitting by the number of pits, derived the meshing stiffness of gear pairs by using the potential energy method, and obtained the relationship between pitting severity and meshing stiffness. Feng et al. [22] used a tribological model to predict wear depth and pitting density, modified the geometric profile and contact area of gears in the dynamic model, and demonstrated the ability and effectiveness of the proposed method in detecting and predicting surface pitting propagation by using the experimental methods.
The analytical-finite element method combines the advantages of computational efficiency and accuracy. Vijayakar [23] proposed a model that combines surface integration and finite element analysis to effectively obtain the total deformation for 3D contact problems. Hedlund [24] used the finite element method to obtain the bending deformation of the gear tooth and established a line contact model to predict contact deformation, taking into account of the nonlinearity contact stiffness. Fang [25] established an LTCA model that can consider many geometric and mechanical factors such as accurate geometric properties, the tooth surface gap, the inter-tooth gap, gear deformation, etc., and made the simulation more realistic. Chang et al. [26] combined the finite element method with the local contact analysis of elastic bodies, separating the deformation at each contact point into linear global terms and nonlinear local contact terms. After verification, the meshing stiffness calculated by the proposed method is highly consistent with the published formulas, with lower time consumption and improved stability. Feng et al. [27] established two types of LTCA models for spur gear meshing pairs: The line contact model and the surface contact model. They analyzed the impact of different contact models on meshing stiffness under load. Cappellini [28] clearly analyzed the accuracy of the finite element analysis contact model for gear pairs and pointed out that the calculation error of meshing stiffness may come from the local contact deformation calculated by the Hertz analysis method.
Based on the analysis above, it can be seen that research on the meshing stiffness calculation methods for faulty gear pairs primarily focuses on analytical methods or finite element methods. Only a few researchers use the analytical-finite element method. The analytical-finite element method combines the advantages of the other two methods, combining the advantages of high computational efficiency and high accuracy. Therefore, this article improved the calculation method for the meshing stiffness of gears with cracks and pitting faults based on the LTCA method. Starting from the deformation coordination conditions of the gear pair, the deformation of possible contact points on the gear tooth surface under different fault types was studied. The improved LTCA method can model the fault areas accurately and optimize the deformation coordination equation under the actual meshing situation of the faulty gear tooth. This method essentially belongs to the analytical-finite element method.

2. Loaded Tooth Contact Analysis Method

2.1. Coordination Conditions for Meshing Deformation of Gear Pairs

The meshing process of the spur gear pair is shown in Figure 1a. Where, the N1N2 is the meshing line of the gear end-face, and N1 and N2 are located in driven gear and driving gear respectively; the B1B2 is the meshing line of the gear tooth surface, and B1 and B2 are the meshing start and exit points of the target gear tooth respectively; the M is the meshing point of the gear pair at a certain moment Using the actual meshing line B1B2 as the width and the tooth surface width B as the length, the meshing surface of the gear pair is developed. According to finite element theory, the tooth surface is discretized into a series of possible contact points distributed along the meshing contact line, as shown in Figure 1b.
During the meshing process of the spur gear pair, there are two meshing periods: The single-tooth meshing period and the double-teeth meshing period. The meshing process is shown in Figure 1b. Where the p b t is the base pitch of gear, the line 1–7 is the meshing line of different meshing moment. The meshing contact line 1–4 is a meshing cycle, the contact line 1–3 is a double-teeth meshing period, and the contact line 3–4 is a single-tooth meshing period. When the gear pair is meshing in the double-teeth meshing period, the target tooth surface contact line 1 and the adjacent tooth surface contact line 4 simultaneously participate in meshing, and the target tooth surface contact line 2 and the adjacent tooth surface contact line 5 simultaneously participate in meshing. When the gear pair is meshing in the single-tooth meshing period, only one contact line, located between contact lines 3 and 4 on the target tooth surface, participates in meshing.
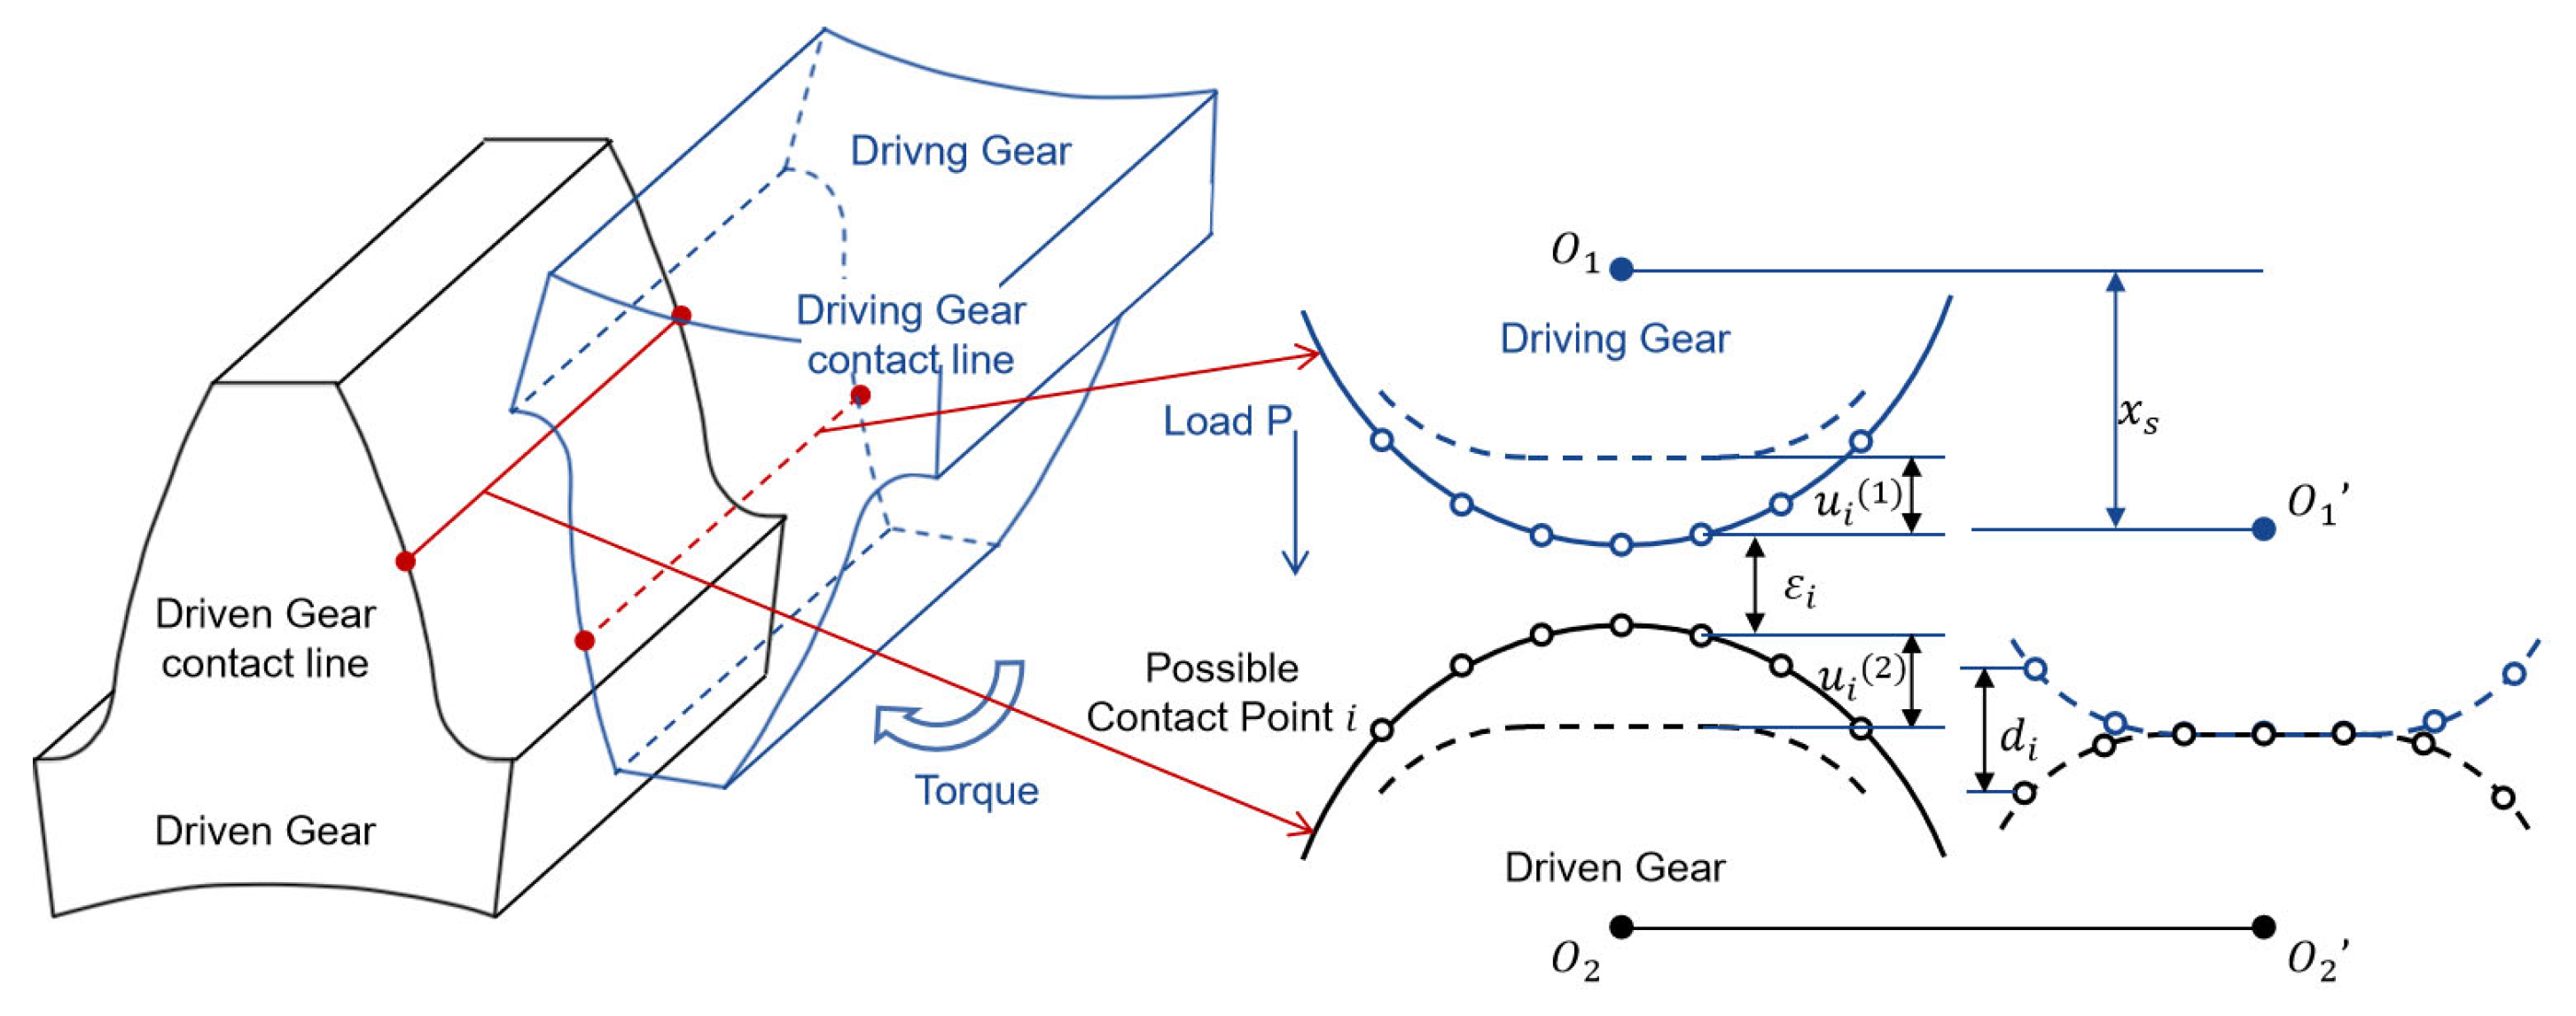
The gear pair can be regarded as the process of contact between two elastic bodies. The contact process between two contact lines is shown in Figure 2. The driven gear is painted in black line and the driving gear is painted in blue line. The red line is the meshing contact line at a certain moment. The two tooth surfaces approach and come into contact. We can consider the meshing between gear pairs as the contact between the contact lines. Then the contact lines are discretized into a series of possible contact points. Therefore, at a certain meshing moment, the contact between gear pairs can be regarded as the deformation between the possible contact points on the contact lines. After applying an external load P , the possible contact points may become close and come into contact and cause deformation. u i 1 , u i 2 represents the contact deformation of possible contact points in the driving and driven gears, ε i represents the initial clearance between possible contact points, x s represents the distance between possible contact points, and d i represents the remaining contact gap between possible contact points.
The deformation coordination conditions at possible contact point i can be expressed by Equation (1) as follows [29]:
u i ( 1 ) + u i ( 2 ) + ε i x s d i = 0
The elastic contact deformations in Equation (1) are divided into two parts: Macroscopic deformation and microscopic deformation, where macroscopic deformation includes overall bending and shearing deformation, which is linear to the load. Microscopic deformation refers to the contact deformation at the contact point, which is non-linear to the load. After careful analysis of its macroscopic deformation and microscopic contact deformation, the deformation coordination condition of the contact point at any meshing position can be further rewritten as Equation (2):
λ b F + u c + ε x s d = 0
where λ b is the bending-shear flexibility coefficient matrix, F is the load vector at each contact point, u c is the contact deformation vector of each contact point, ε is the initial gap vector at each contact point, and d is the remaining gap at the contact point.
If the load of contact point i is bigger than 0, it is considered that the two meshing tooth surfaces are in contact at this point, and the remaining gap at this contact point is 0; if the load of contact point i is 0, it indicates that the two meshing tooth surfaces are not in contact at this point, and the remaining gap at this point is greater than 0 [30]. It can be represented by Equation (3) as:
w h e n   F i > 0 , d i = 0 w h e n   F i = 0 , d i > 0
At the same meshing position, the sum of the loads distributed by the possible contact points on each contact line should be equal to the total normal load of the gear pair, so we present Equation (4):
i = 1 n F i = I F = P
where P is the total normal load and I is the row vector 1,1 , 1 , , 1 .
By considering Equations (2)–(4), the matrix form of the contact equation for the LTCA of the gear pair at any meshing position can be obtained, as shown in Equation (5).
λ b F + u c + ε x s d = 0 i = 1 n F i = I F = P w h e n   F i > 0 , d i = 0 w h e n   F i = 0 , d i > 0

2.2. Iterative Algorithm for Solving Coordination Deformation Equation

After establishing the LTCA equation, the macro flexibility coefficient matrix of the tooth surface is separated and obtained by using the finite element method, and the contact deformation of possible contact points on the tooth surface is calculated by using the analytical contact deformation equation. This will greatly improve computational efficiency.
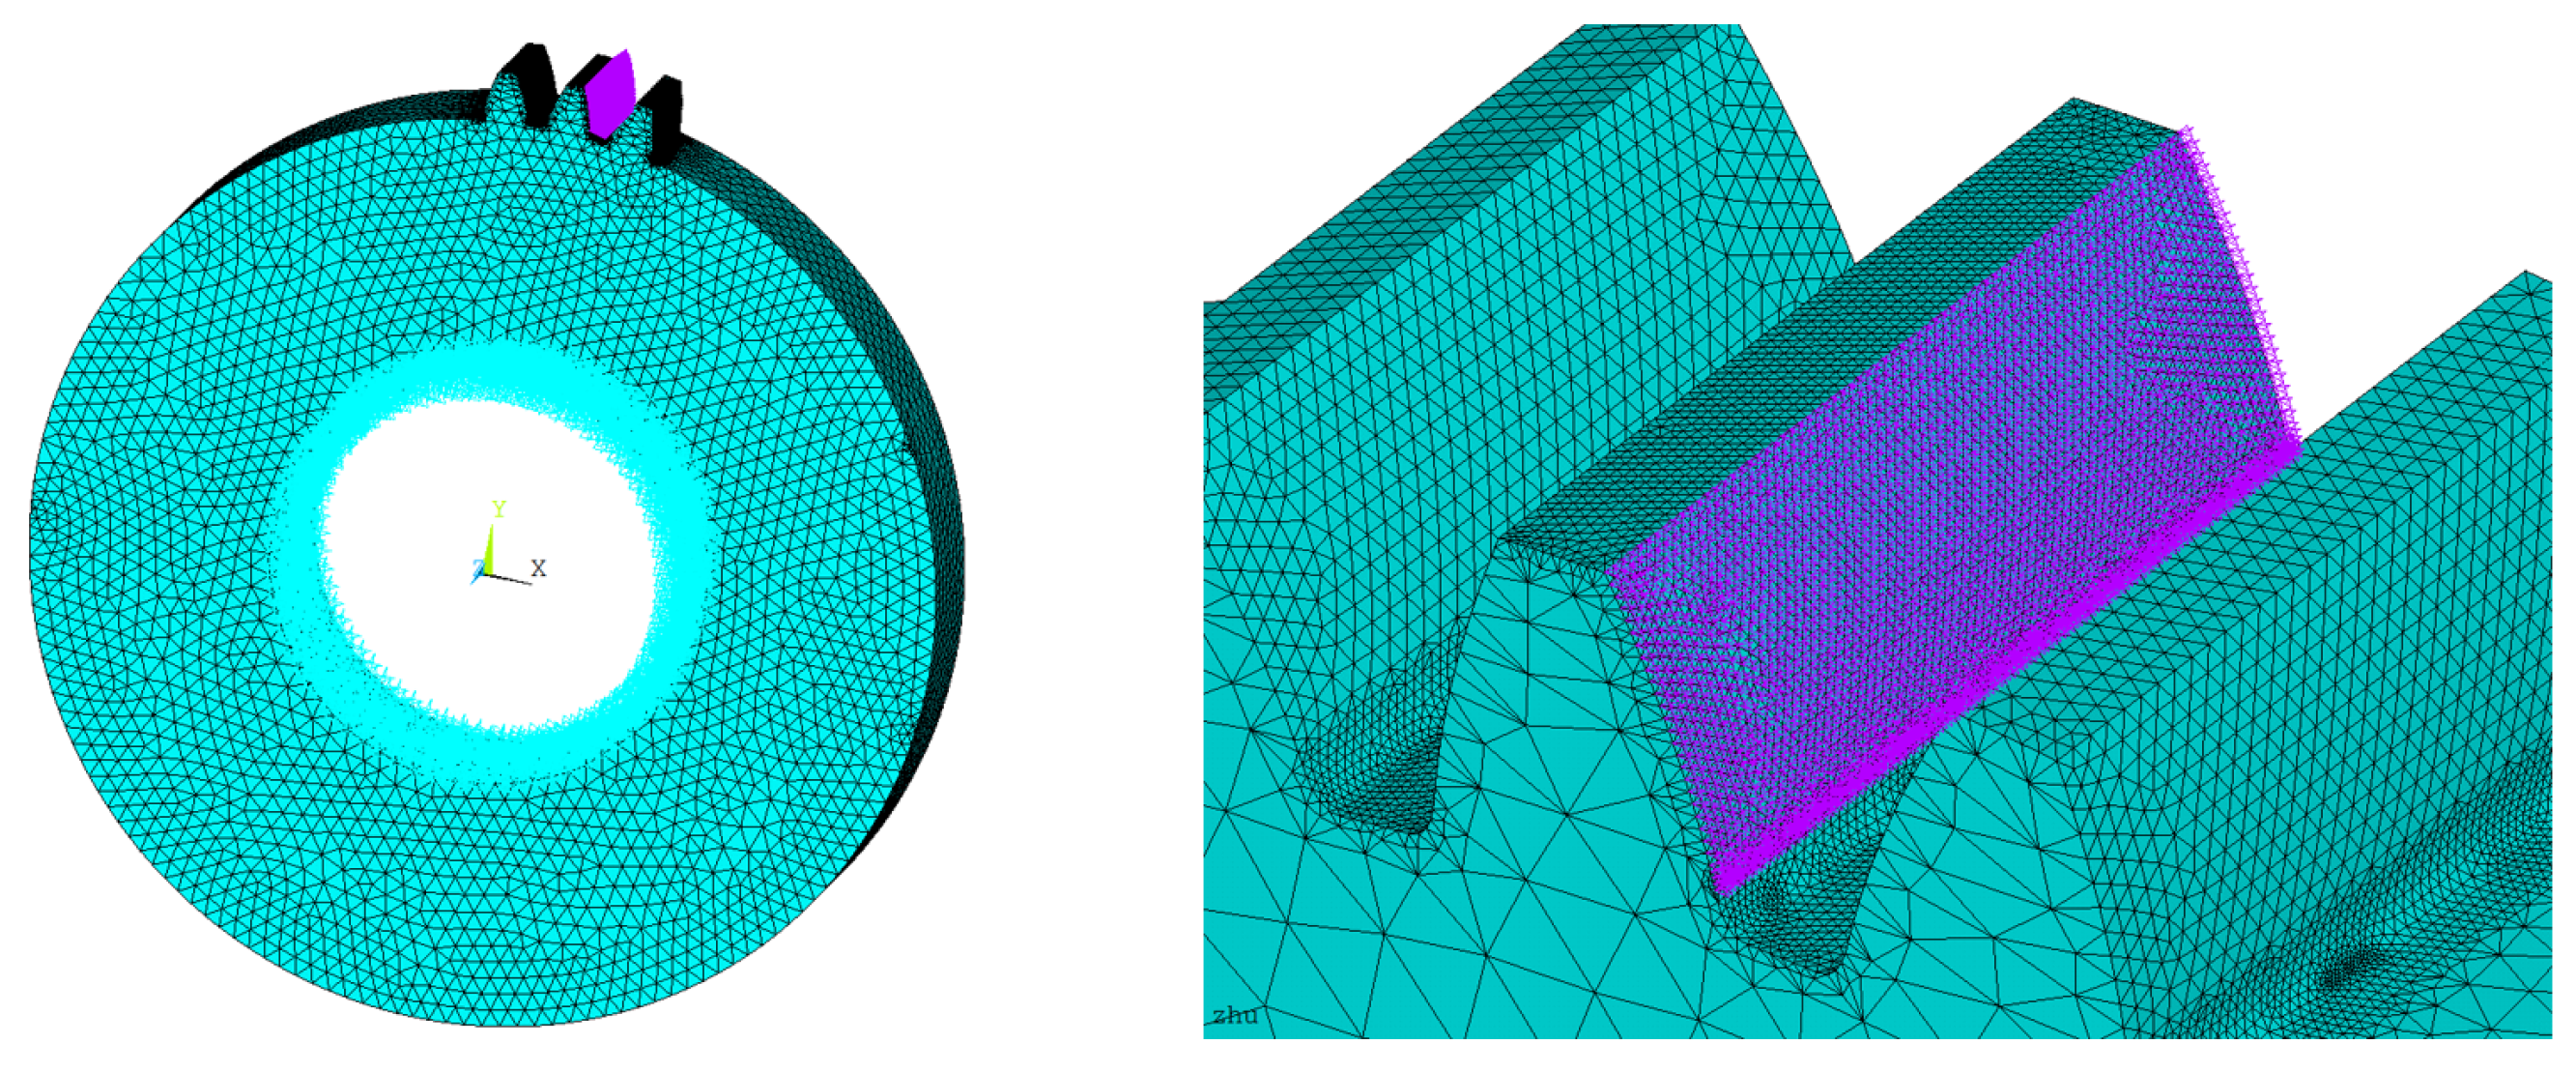
The 3D coordinates of the tooth surface are calculated based on the theoretical involute equation by using MATLAB. The obtained coordinates are saved and imported into ANSYS, and then the driving gear and driven gear are modeled by using the APDL commands. The nodes at the target tooth surface are set as external nodes. Then the normal stiffness matrix k t o t a l of the tooth surface nodes is obtained by using the finite element Substructure method, as shown in Figure 3 [31]. We then perform the inverse operation on this matrix to obtain the flexibility coefficient matrix λ t o t a l of the tooth surface nodes. Similarly, the local flexibility coefficient matrix of the gear tooth λ l o c a l can be obtained. The normal macroscopic deformation flexibility matrix of the tooth surface meshing nodes is shown in Equation (6). The obtained flexibility coefficient matrix corresponds to the grid nodes divided by ANSYS instead of the possible contact points on the contact lines described earlier. Interpolation is performed to obtain the required flexibility matrix corresponding to the contact points on different contact lines.
λ b = λ t o t a l λ l o c a l
where λ b is the bending-shear flexibility coefficient matrix of the mesh nodes on the tooth surface, and λ t o t a l , λ l o c a l represent the flexibility coefficient matrix of the mesh nodes on the tooth surface in the total FE model and the local FE model.
A non-error involute cylindrical gear pair is in line contact. Ignoring the local boundary effect of line contact, the k-th contact line is equally divided into n k segments, where n k is the number of contact points on the contact line, as shown in Figure 1b. Therefore, each segment can be regarded as two short cylinders with a curvature radius at each contact point. The classical Hertz theory only provides partial theoretical solutions for line contact and does not provide a calculation equation for elastic contact deformation. According to the calculation equation for elastic contact deformation of finite length line contact, the contact deformation of each segmented contact line can be obtained as Equation (7) [32]:
u c _ i = F i π l i E * ln 6.59 l i 3 E * R 1 + R 2 F i R 1 R 2
where u c _ i is the contact deformation of the i -th segmented contact line; l i is the length of the segmented contact line; F i is the load on the segmented contact line; R 1 , R 2 are the normal curvature radius of two gears at the contact point; and E * is the equivalent elastic modulus.
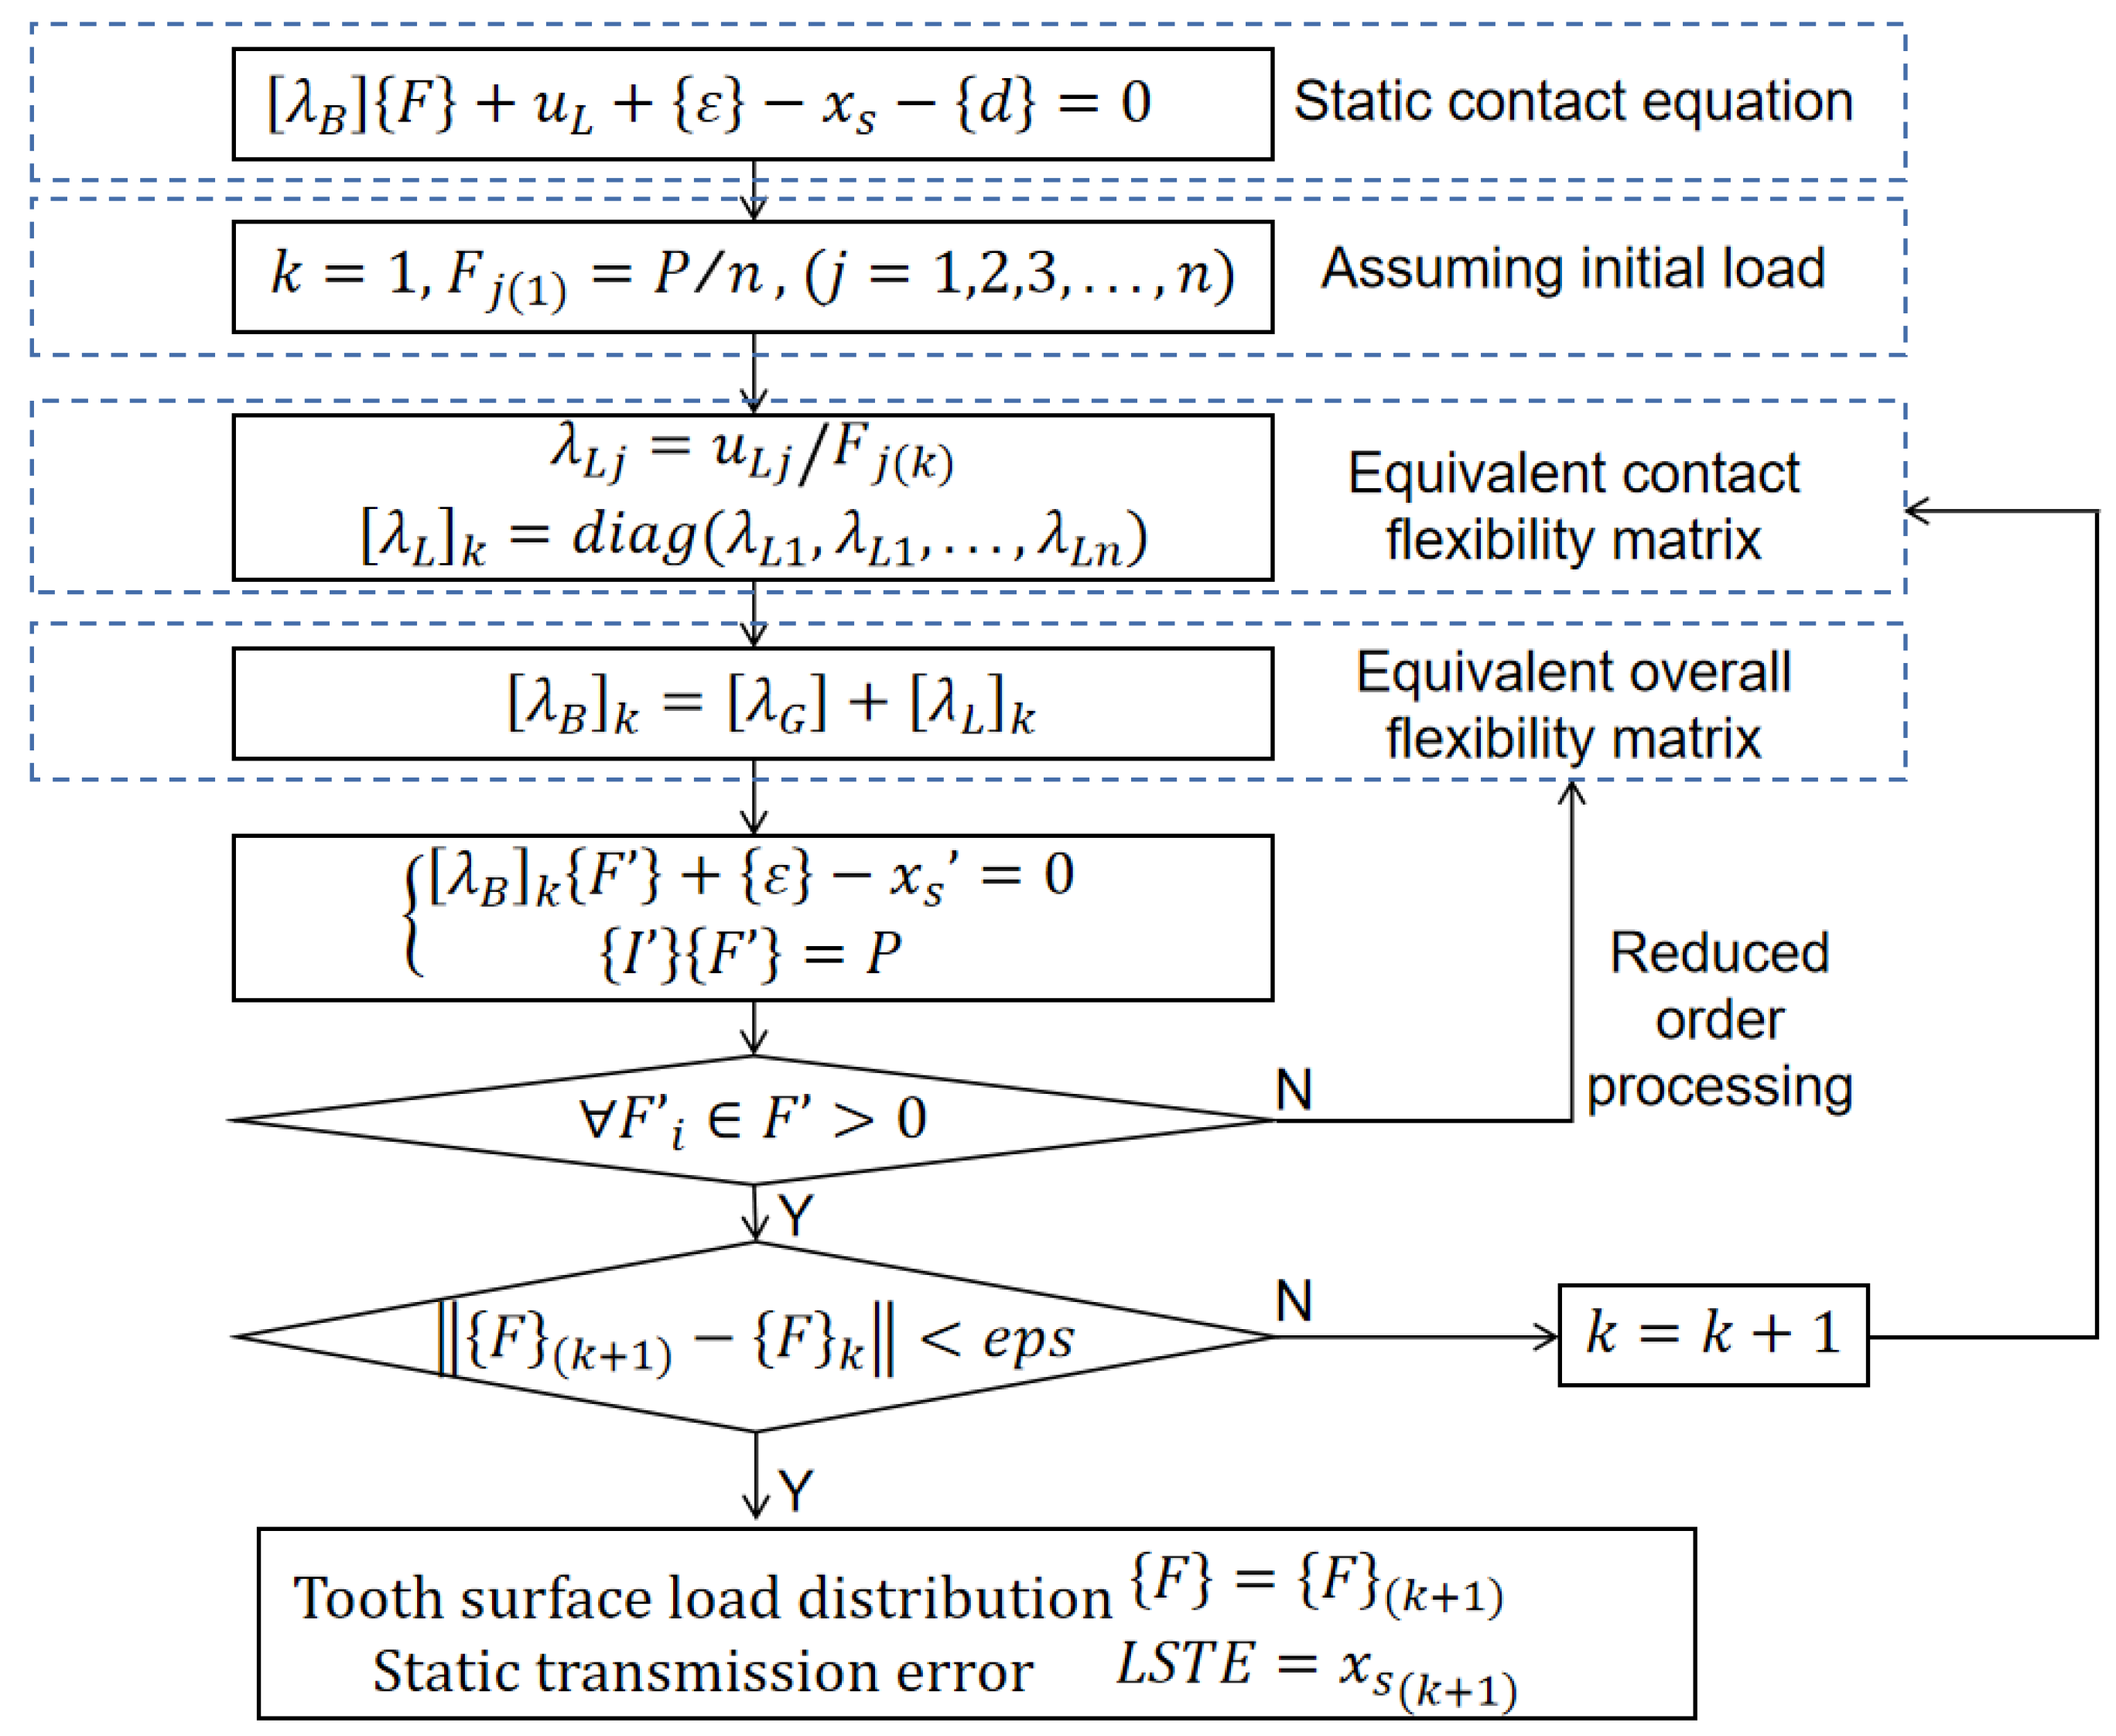
At any meshing position of the gear pair, solving the LTCA equation is equivalent to solving the matrix equation in Equation (5). Equation (5) is a nonlinear equation system that is difficult to solve directly. Therefore, an iterative format needs to be constructed for the solution. The iterative solution algorithm process is shown in Figure 4 [33].

3. Calculation of the Faulty Gears Meshing Stiffness Based on LTCA

3.1. Meshing Stiffness Calculation Method for Crack Gear Pairs

Based on the LTCA method mentioned above, the method for the meshing stiffness of gear pairs with cracks is improved. When we pay attention to Equation (1), it is known that the elastic deformation is divided into two parts: One is the macroscopic deformation, which is linear to the load, and the other is the microscopic contact deformation, which is nonlinear to the load. Due to gear cracks, the flexibility coefficient of tooth bending and shearing deformation will change, leading to changes in macroscopic deformation that are linear to the load. The existence of gear cracks does not change the position of possible contact points on the tooth surface, and it can be considered that the influence of cracks on microscopic contact deformation can be ignored. Therefore, in the calculation of meshing stiffness based on the LTCA method in the case of crack failure, it is necessary to focus on the macroscopic deformation. Furthermore, the calculation method of the macroscopic deformation flexibility coefficient matrix in the deformation coordination condition should be optimized.
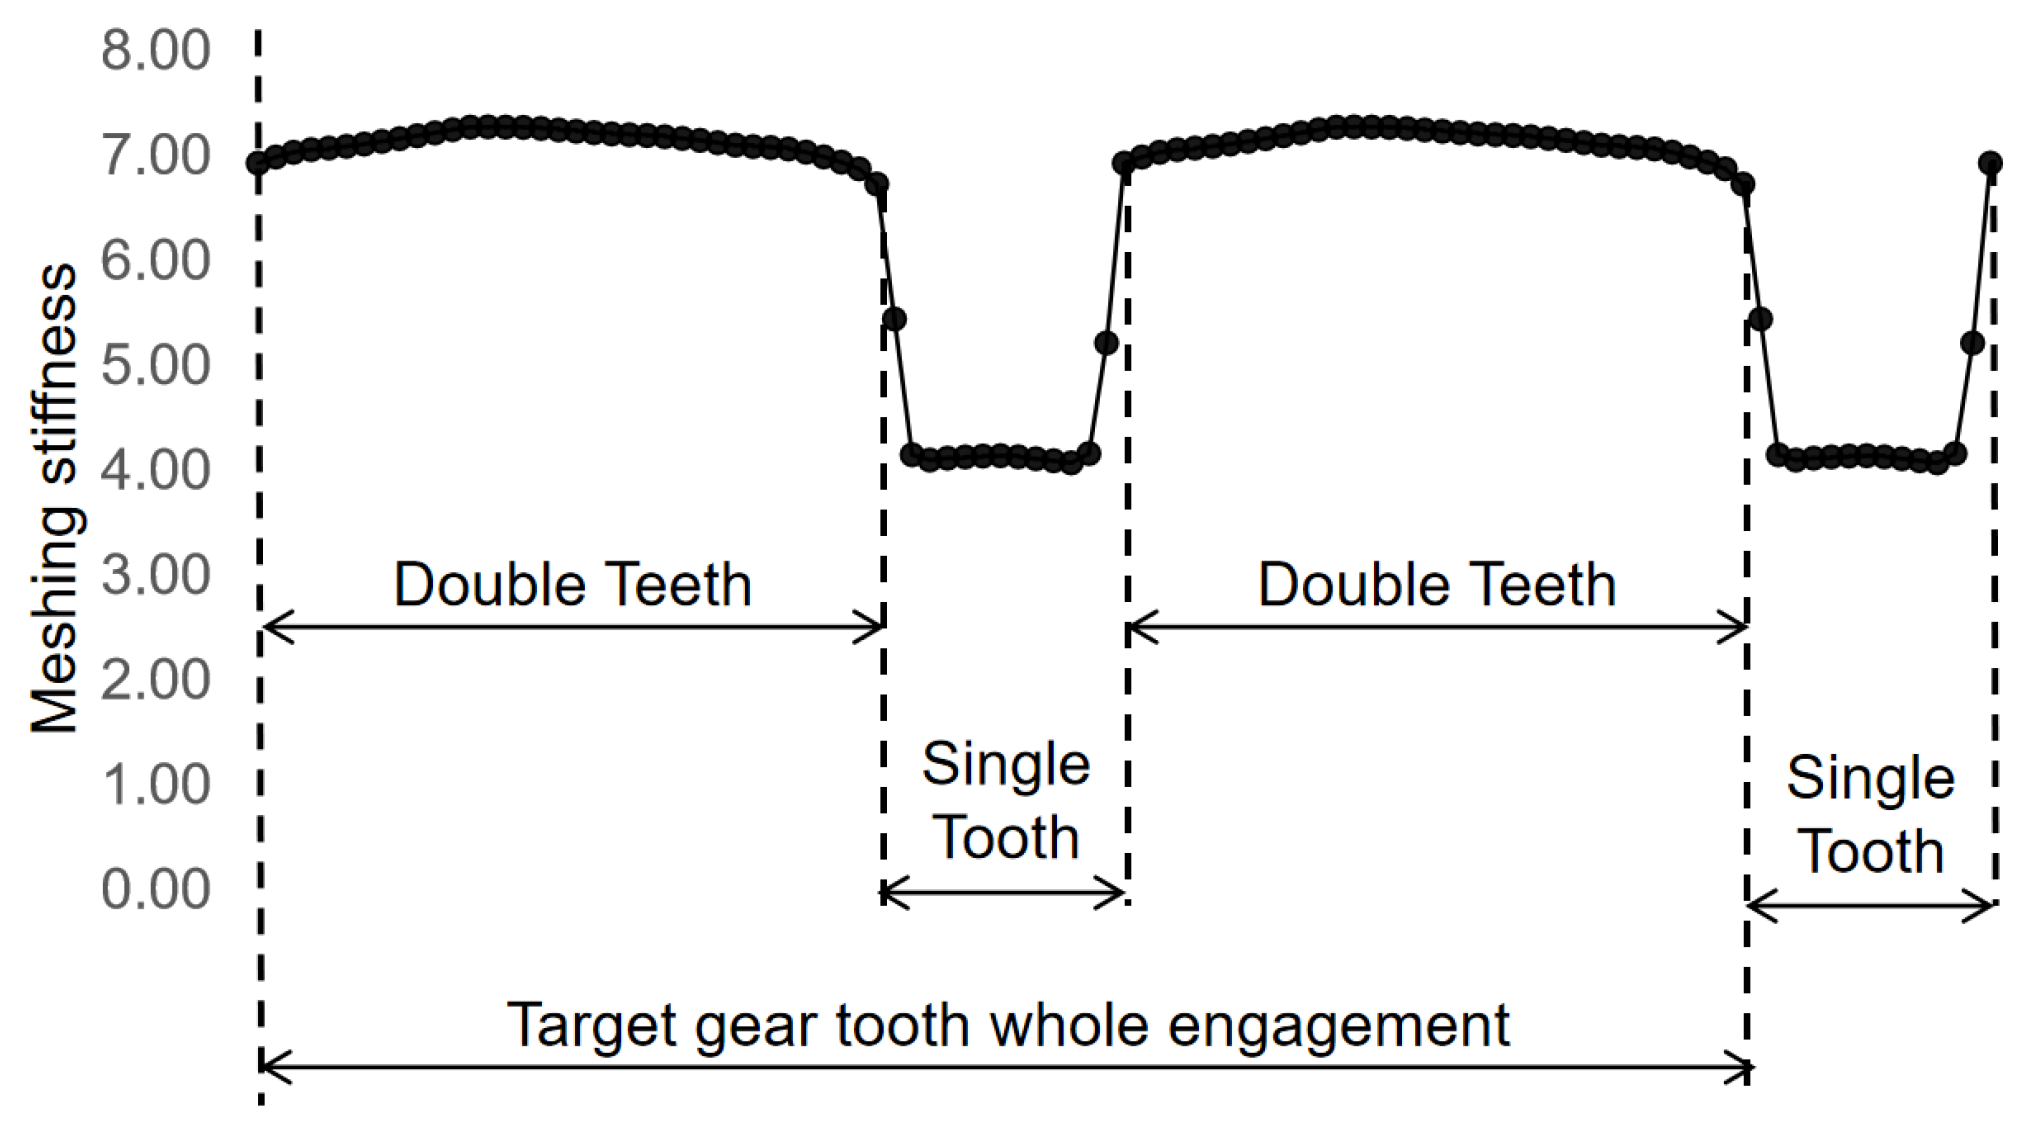
The research object of this paper is cylindrical spur gears, which have two meshing periods: A single-tooth meshing period and a double-teeth meshing period, as shown in Figure 5. Under the influence of a gear crack, the cracked tooth experiences “double teeth—single tooth—double teeth” meshing periods. During the double-teeth meshing period, the target gear pair has two contact lines in contact, with one contact line between the healthy tooth–healthy tooth and another contact line between the faulty tooth–healthy tooth. During this period, the meshing stiffness of the gear pair will be affected by the gear crack. Therefore, in the double-teeth meshing period, partial adjustments need to be made to the deformation coordination equation mentioned in Section 2.2.
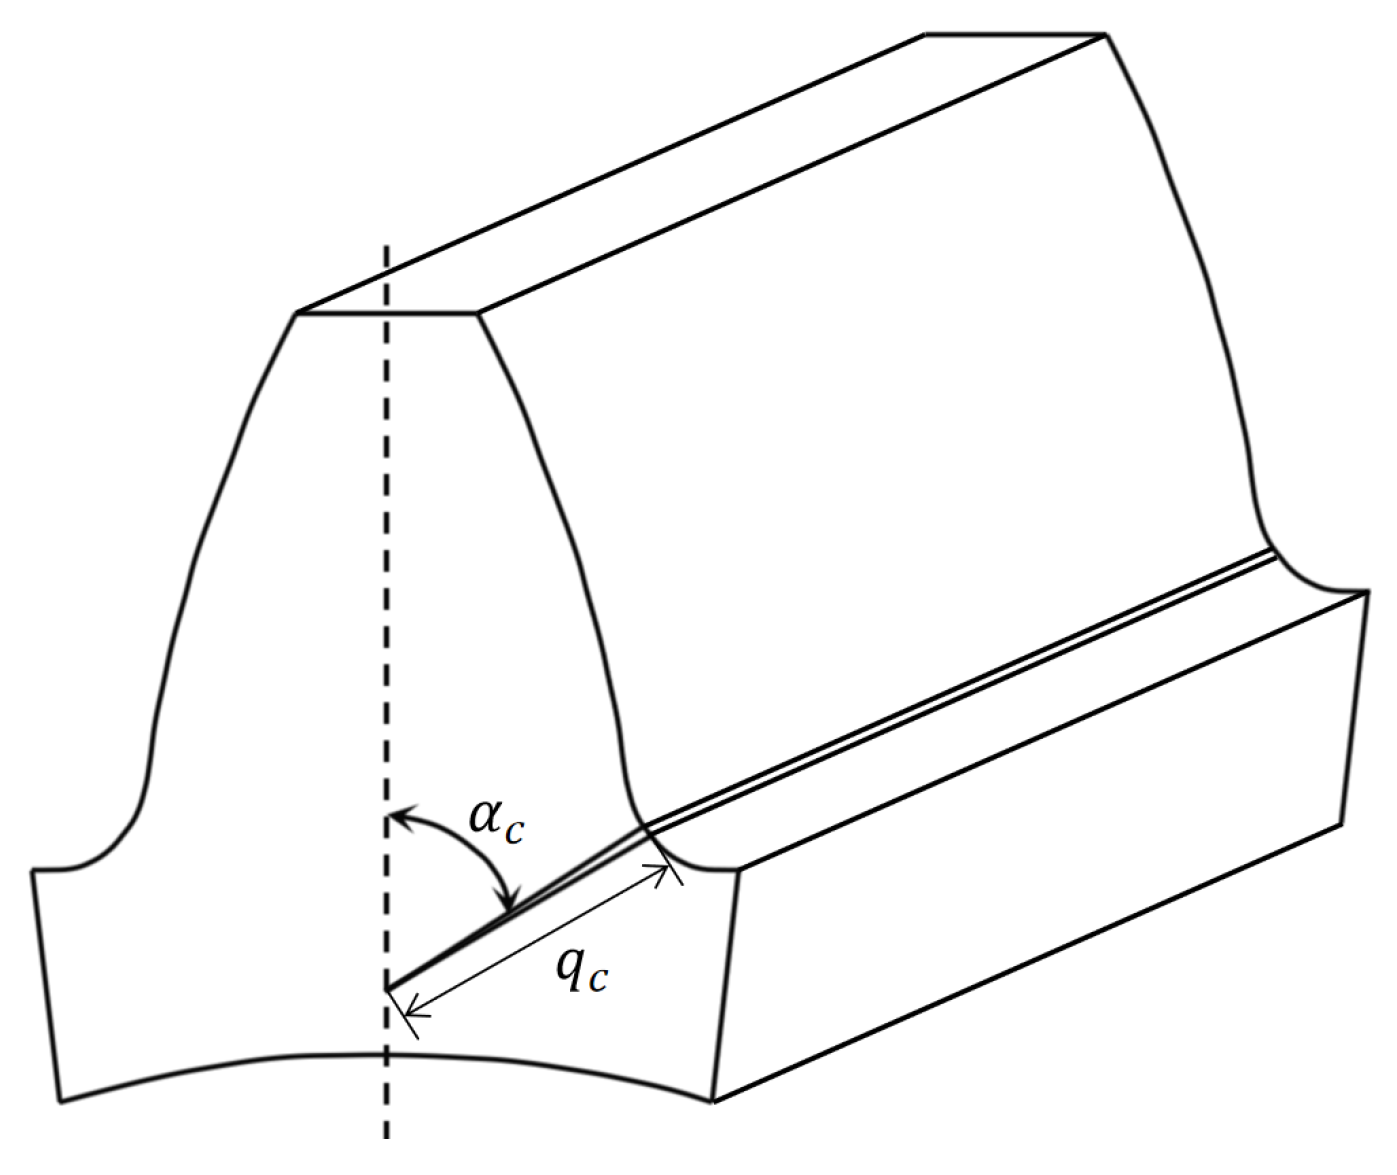
We used APDL to parameterize the modeling of tooth crack and set the crack to be evenly distributed along the tooth width direction, with a size of q c ( 0 100 % , 100 % means the missing the entire gear tooth), and extending inward along the straight line of angle α c , as shown in Figure 6.
We modeled the cracked gear pair in ANSYS and refined the mesh of the fault area. Then the stiffness matrix of the condensed external nodes obtained by the Substructure method was derived, and the macro deformation flexibility matrix of the cracked gear tooth surface was calculated. We established two different teeth surface contact flexibility matrices to adapt to the calculation of meshing stiffness of faulty gear pair, as shown in Figure 7. The line 1–7 is the meshing contact line of the gear pair, and the red line is the meshing contact line at a same meshing moment. The left tooth surface and right tooth surface in the figure are the contact lines of adjacent tooth surfaces of the same gear, but there is a crack in the right gear tooth. Taking a certain meshing moment in the double-teeth meshing period as an example, contact line 5 of the left gear tooth is in contact, while contact line 2 of the right gear tooth is in contact at the same time. The flexibility matrix of the left tooth surface participating in meshing is the superposition of the flexibility matrix under the healthy conditions of the driving gear and the driven gear. The flexibility matrix of the right tooth surface participating in meshing is the superposition of the flexibility matrix of the driving gear under faulty conditions and the driven gear under healthy conditions. As shown in Equation (8), the flexibility matrix of all possible contact points at any meshing moment is finally obtained and inserted into Equation (5) for calculation.
λ G l o b a l _ i j = λ G l o b a l _ i j h l + λ G l o b a l _ i j h r λ G l o b a l _ i j c l + λ G l o b a l _ i j h r h e a l t h y h e a l t h y c r a c k h e a l t h y
where λ G l o b a l _ i j is the flexibility coefficient of the mesh nodes on the tooth surface, and λ G l o b a l _ i j ( h l ) , λ G l o b a l _ i j ( h r ) , λ G l o b a l _ i j ( c l ) are the flexibility coefficient of the mesh nodes on the tooth surface of the left healthy gear tooth, right healthy gear tooth, and left crack gear tooth.
Through iterative calculation, the final gear tooth meshing stiffness curve under the crack state is obtained.

3.2. Meshing Stiffness Calculation Method for Pitting Gear Pairs

Pitting is a gear failure model that manifests as tooth surface defects. They are unlike gear cracks because gear cracks do not involve changes in possible contact points on the tooth surface. Therefore, for the LTCA method used in this paper, pitting causes defects in the gear tooth, which not only leads to changes in macroscopic deformation linearly related to the load but also leads to changes in microscopic contact deformation nonlinear related to the load. Therefore, additional gap values may be generated between the contact points due to pitting. The macroscopic deformation can be processed by the finite element Substructure method to obtain the tooth surface flexibility coefficient matrix. We defined the additional gap at potential contact points caused by pitting and imported them into the deformation coordination equation to calculate the changes in microscopic contact deformation caused by pitting. If the elastic deformation of the possible contact points in the pitting area is less than the pitting depth, the possible contact points in the pitting area will not be in contact and will not participate in load sharing.
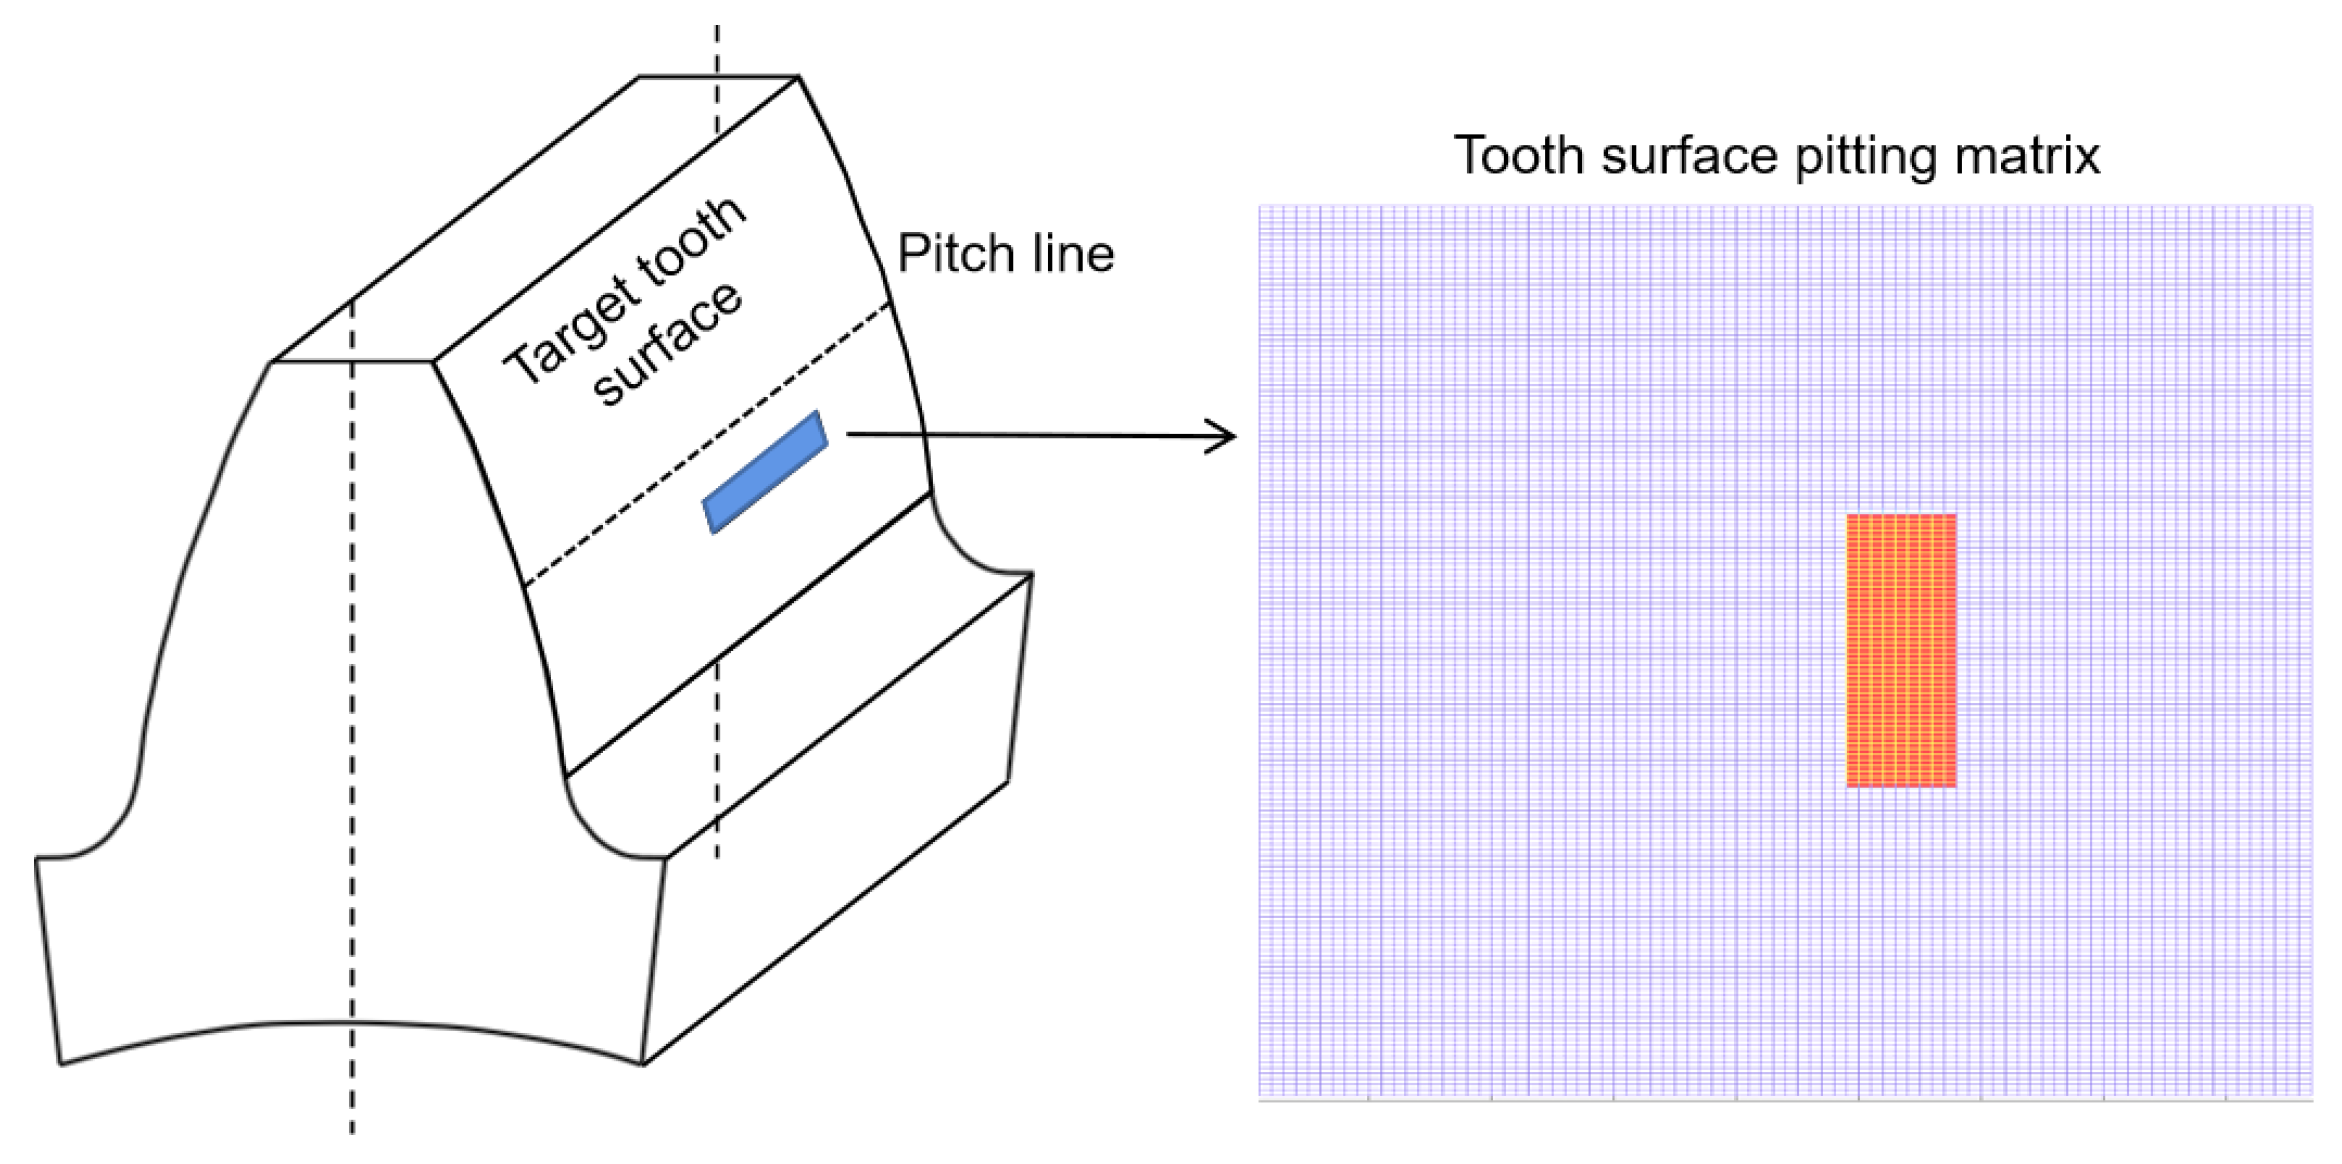
Due to the fact that pitting will involve changes in the contact points of the tooth surface, additional matrices need to be defined in the calculation to represent the pitting area. There are x elements along the tooth width direction and y elements along the gear tooth transverse direction, with x · y elements in total, where x and y are adjustable variables. Except for the pitting area, the elements at other positions are all 0, and the values of the elements in the pitting area are defined as the depth of the gear face pitting, as shown in Figure 8. This article uses the rectangular pitting model to simulate a pitting fault, so the values of the elements located in the pitting area are represented by the depth of the rectangular pitting. When constructing the deformation coordination equation, an additional contact gap caused by tooth surface pitting ε p i t should be introduced to represent the initial gap of tooth contact caused by pitting, as shown in Equation (9).
u i 1 + u i 2 + ε i + ε p i t x s d i = 0
where ε p i t is the initial contact gap caused by tooth surface pitting.
The modeling data of the gear pair in ANSYS comes from the 3-dimensional coordinates of the tooth surface obtained from the involute equation in MATLAB. Therefore, the pitting data defined in MATLAB can also be accurately modeled in finite element software to obtain a 3-dimensional simulation model of the pitting on the tooth surface. Based on the normal component the point on the tooth surface, we calculated the coordinate change of the contact point on the tooth surface caused by the pitting fault. We also established a 3D model of tooth surface pitting in ANSYS and defined the tooth surface and pitting area as external nodes. The condensed stiffness matrix was derived by using the finite element Substructure method, and further calculation and processing were carried out to obtain the corresponding tooth surface flexibility coefficient matrix under the finite element node. Based on the 3-dimensional coordinates of the tooth surface under pitting and the finite element node coordinates, the flexibility matrix is interpolated to obtain the discrete tooth surface flexibility matrix at possible contact points on the contact lines.
Due to the fact that the target gear pair will experience a “double teeth—single tooth” alternating meshing period, the treatment method of the tooth surface flexibility coefficient matrix is consistent with the gear crack. It is divided into two parts for calculation: healthy tooth–healthy tooth and pitting tooth–healthy tooth. By combining these two flexibility coefficient matrices, the flexibility matrix of possible contact points on the tooth surface under the double-teeth meshing period is obtained. As shown in Equation (10), we substituted this into the deformation coordination equation for an iterative solution.
λ G l o b a l _ i j = λ G l o b a l _ i j h l + λ G l o b a l _ i j h r λ G l o b a l _ i j p l + λ G l o b a l _ i j h r h e a l t h y h e a l t h y p i t t i n g h e a l t h y
where λ G l o b a l _ i j ( p l ) is the flexibility coefficient of the mesh nodes on the tooth surface of the left pitting gear tooth.
Through iterative calculation, the final gear tooth meshing stiffness curve under a pitting state is obtained.

3.3. Verification of Meshing Stiffness Calculation Results

Based on the meshing stiffness calculation results of the finite element method, we verify the meshing stiffness results calculated by the improved LTCA method. First, we calculate and compare the meshing stiffness of the healthy gear pair to verify the correctness of the LTCA method. Second, we calculate and compare the meshing stiffness of the faulty gear pair to verify the correctness of the improved LTCA method used to calculate the meshing stiffness of the faulty gear pair.
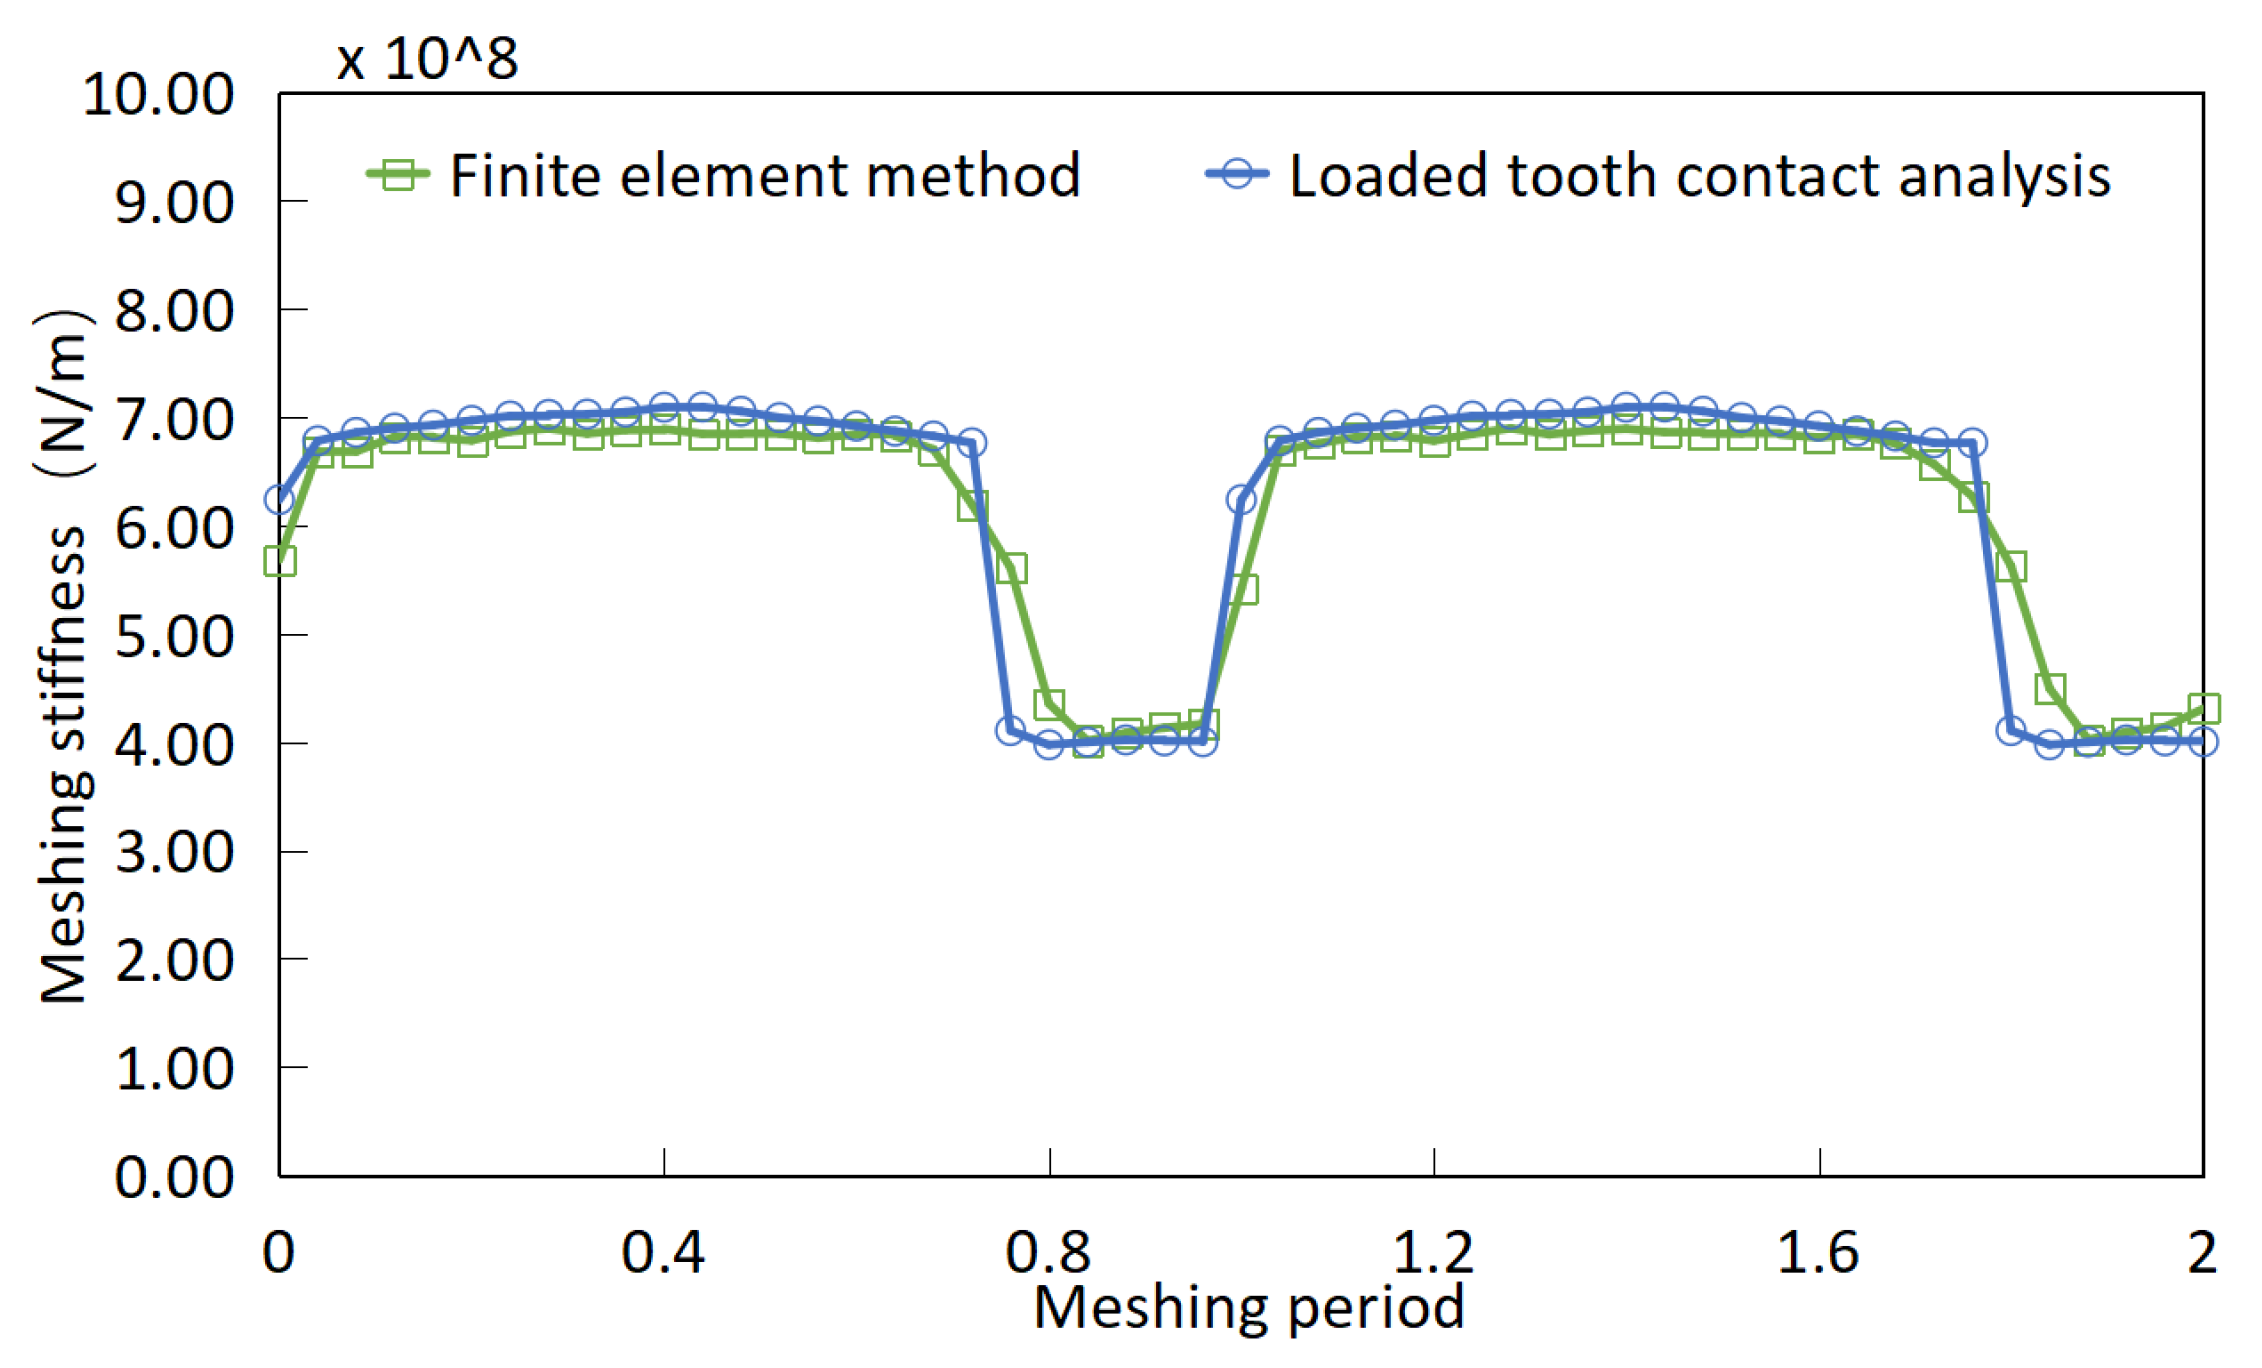
The parameters of the gear pair are shown in Table 1. The gear pair is modeled in 3D and analyzed by using ANSYS Workbench. The meshing stiffness results are compared with the results calculated by using the LTCA method described in Section 2. The stiffness results obtained by different methods are shown in Figure 9.
As shown in Figure 9, it can be seen that the stiffness values calculated by the finite element method and the LTCA method are very close. The mean meshing stiffness obtained by the finite element method is 6.18 × 10 8 , while the mean meshing stiffness obtained by the improved LTCA method is 6.23 × 10 8 , with an error of only 0.81 % . The meshing stiffness errors in the double-teeth and single-tooth meshing regions are 2.05 % and 3.50 % . It can be seen that the meshing stiffness obtained by the two methods is basically the same. The calculation results of the two methods only have significant errors at the moment of a single- and double-teeth meshing alternation. The stiffness calculated by the finite element method is smoother during the alternation from double teeth to a single tooth, but the LTCA method struggles to reflect the smooth transition of the stiffness curve.
For the basic parameters of the gear pair listed in Table 1, the improved meshing stiffness calculation method in this article will be validated, and the finite element results will also be used as the validation benchmark. The length, width, and depth of the rectangular pitting are 10   m m × 1   m m × 0.2   m m , while in crack faults, the crack size is a half-tooth crack with a propagation angle of 70°. The calculation results are shown in Figure 10, where Figure 10a shows the meshing stiffness results for the pitting fault and Figure 10b shows the meshing stiffness results for the crack fault. For the calculation of the meshing stiffness of gear pairs with pitting faults, the stiffness results of the two methods in the non-pitting area are consistent with the stiffness results of healthy gear pairs. When calculating the meshing stiffness of the pitting area, the contact points on the meshing line are separated due to tooth surface pitting, which leads to a slight difference in the stiffness results between the two methods. The decreased percentages of the meshing stiffness in the pitting area calculated by the LTCA and the finite element method are 9.44 % and 2.75 % , respectively.
For the calculation of the meshing stiffness of gear pairs with crack faults, the occurrence of crack faults leads to an overall decrease in meshing stiffness during the engagement of the faulty tooth. The mean meshing stiffness difference between the two methods is 3.39 % , and the difference is stable within 10 % during the full tooth engagement period. It can be seen that the two calculation methods show good consistency in calculating the stiffness of gear pairs with the same type of fault.
In the same hardware configuration, the improved LTCA method can improve computational efficiency significantly. Table 2 compares the computational time cost between the finite element method and the improved LTCA method in this paper. It can be clearly concluded that the meshing stiffness calculation time cost of the LTCA method is more than 95% shorter than using FEM. This will greatly improve the efficiency of analyzing the dynamic characteristics of the transmission system.

4. Research on Parameters Sensitivity of Fault Degradation

4.1. Parameters Sensitivity Study of Meshing Stiffness on Crack Degradation

This section will use an improved LTCA method to study the impact of changes in gear crack parameters on the meshing stiffness. The crack propagation angle and crack length are shown in Table 3.
The cracked tooth participates in the entire meshing cycle, including “double teeth—single tooth—double teeth”, and the manifestation of crack failure is the overall decrease in the meshing stiffness.
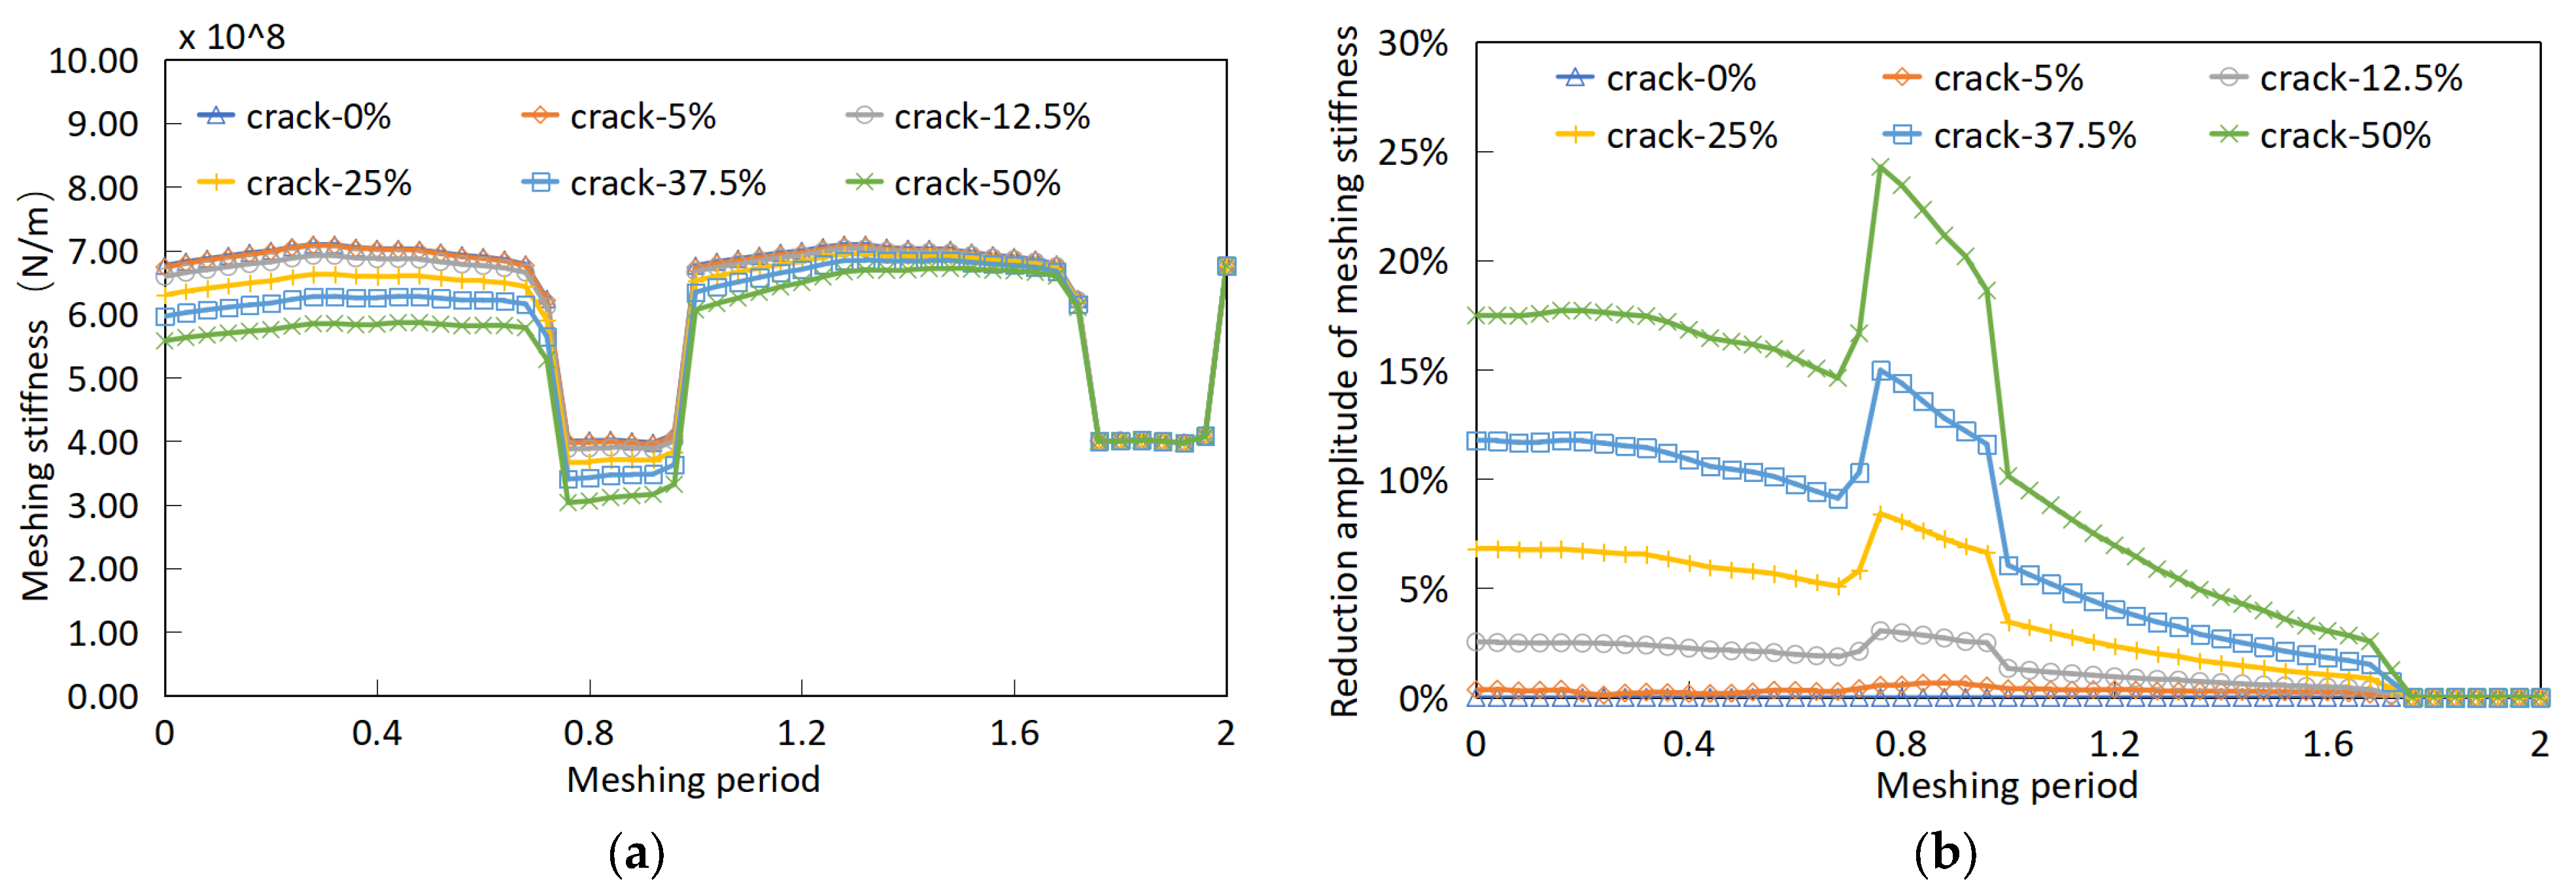
The change in gear crack size leads to a change in the meshing stiffness of the gear pair, as shown in Figure 11. Figure 11a shows the meshing stiffness values under the different crack sizes conditions, and Figure 11b shows the percentage decrease in meshing stiffness compared to a healthy gear tooth under different crack sizes. Comparing the results of the stiffness, it can be seen that as the crack size increases, the decrease in stiffness becomes more pronounced. As shown in Figure 11, the stiffness change can be ignored when the crack sizes change from 0 5 % , but the stiffness shows a significant decrease in the crack sizes from 5 12.5 % .
In the single-tooth meshing period, the decreased percentage of stiffness is higher than that in the double-teeth period. It can be concluded that in the double-teeth meshing period, the load is shared by both healthy and faulty gear teeth. Cracks only have an impact on the single-gear tooth stiffness and have no effect on any adjacent healthy tooth. Therefore, it has a good stiffness foundation in the double-teeth meshing period. When the crack occurs on the gear tooth, its adjacent gear tooth can also share the load with the crack tooth together. However, in the single-tooth meshing period, the impact of the crack on stiffness is the most severe. The half-tooth-sized crack will cause a nearly 25 % decrease in meshing stiffness in this period.
As shown in Figure 12, in the case of a half-tooth (50%) crack, the meshing stiffness varies with the propagation angle. Although the sizes of the cracks remain unchanged and are all half-tooth cracks, the actual size of the cracks will continue to increase due to the decrease in the propagation angle, resulting in a decrease in the actual meshing stiffness with the decrease in the propagation angle. However, the overall decrease in meshing stiffness is small, and the most severe section is still located within the single-tooth meshing period.
Based on the results above, in order to identify early cracks in the transmission mechanism, we can not only study the impact of the crack on the dynamic characteristics of the system but also develop other programs or algorithms that focus on assisting in identifying cracks. One strategy is to reduce the impact of various types of noise, and the other is to amplify and extract the signals caused by cracks to improve the speed and accuracy of early identification of faulty gear pairs to further reduce safety hazards.

4.2. Parameters Sensitivity Study of Meshing Stiffness on Pitting Degradation

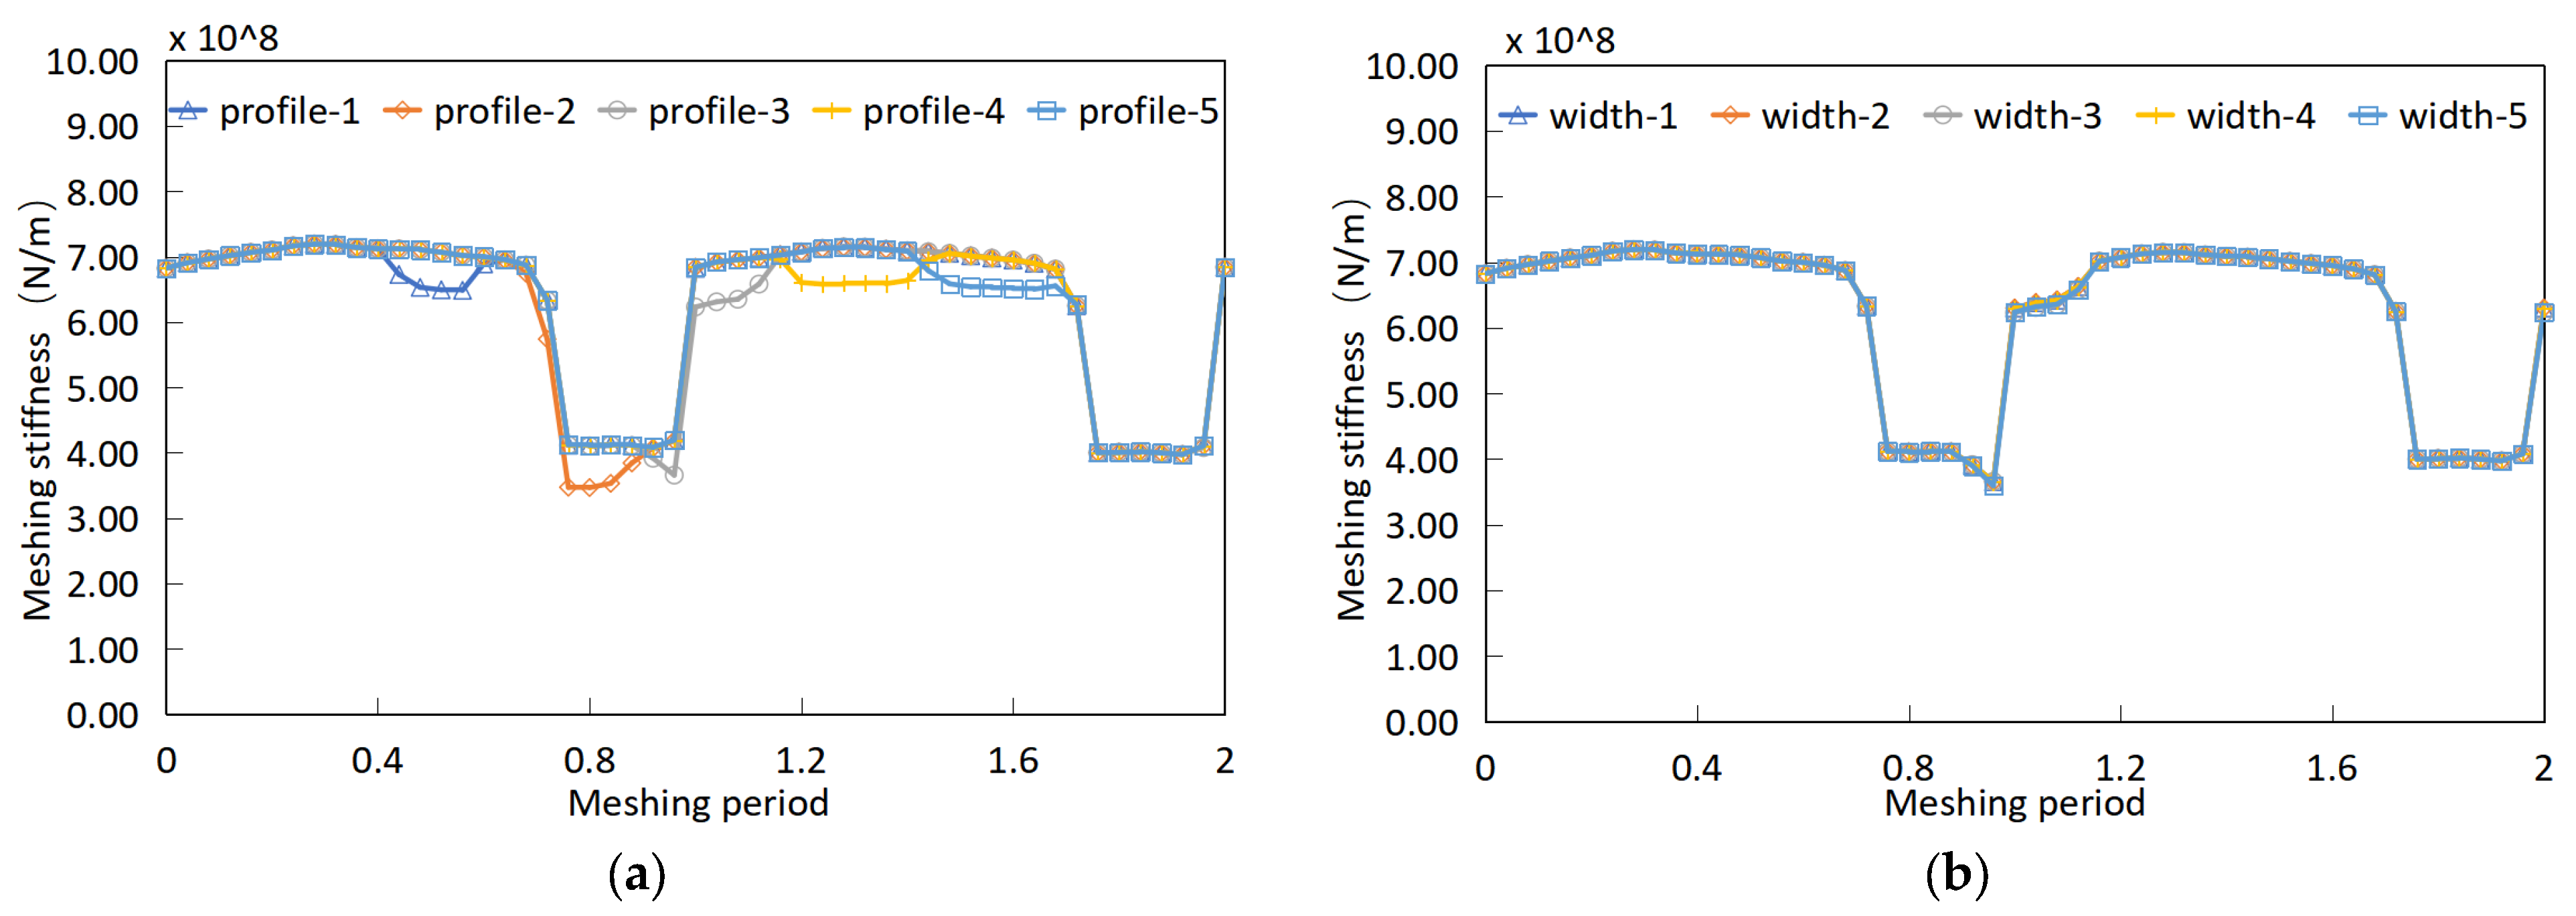
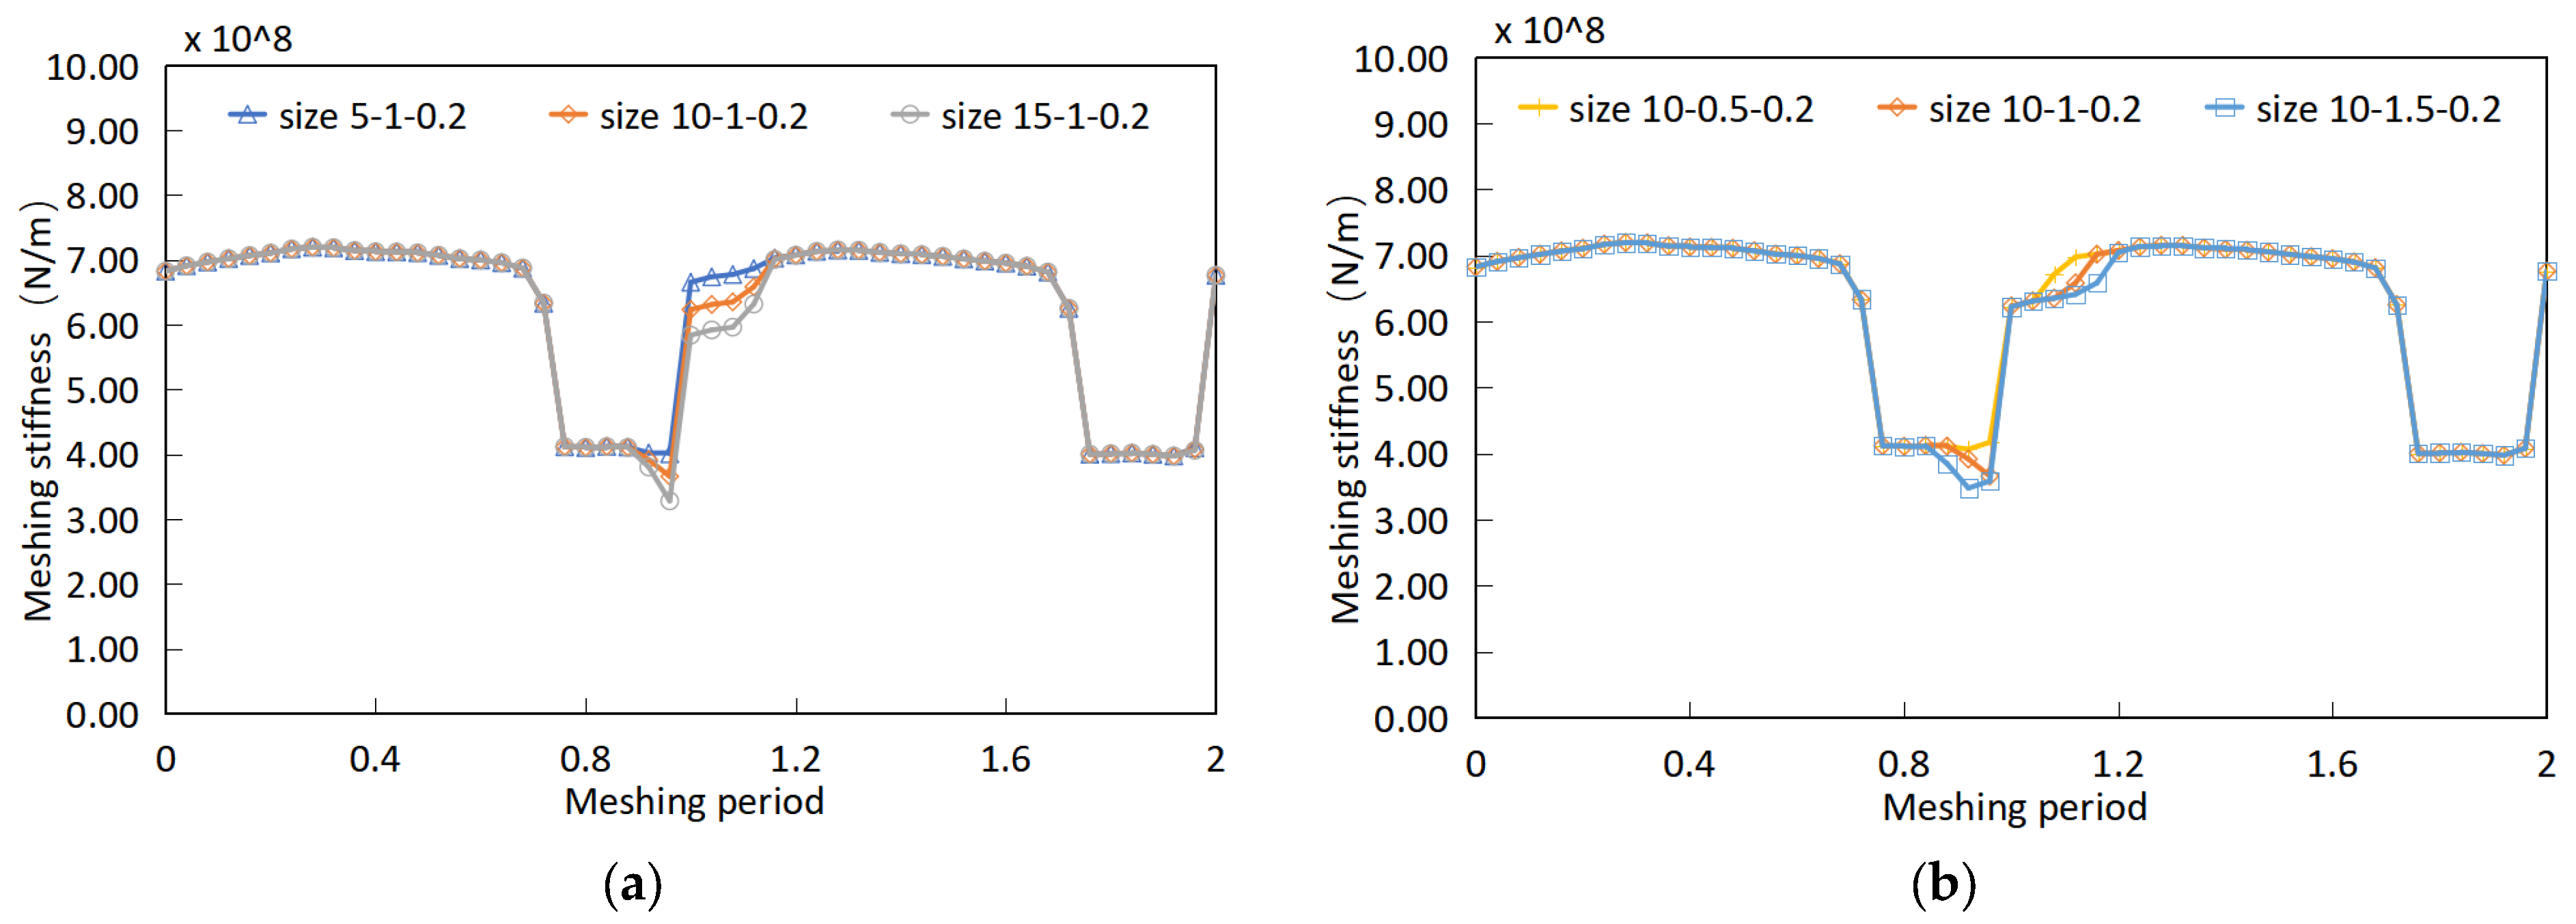
This section will use the improved method to study the impact of changes in rectangular pitting parameters on the meshing stiffness. The arrangement along the tooth profile direction, along the tooth width direction, and the size of the pitting are shown in Table 4. In order to study the influence of the pitting location on the meshing stiffness of gear pairs, under the fixed pitting size situation, we changed its location along the tooth profile direction and tooth width direction. Using the midpoint of the tooth surface pitch line as the center, we uniformly distributed five pitting positions along the tooth profile and tooth width direction to study the changes in the meshing stiffness caused by the different pitting positions. The numbers in the tooth profile and tooth width only represent the different positions. In order to study the influence of pitting sizes on the meshing stiffness of gear pairs, under the fixed pitting position situation, we sequentially changed the length and width of the rectangular pitting on the tooth surface and used the improved LTCA method to study the influence of the pitting sizes on the gear pair meshing stiffness.
The pitting tooth participates in the entire meshing period, experiencing the “double teeth—single tooth—double teeth” meshing period. Pitting faults are manifested in two ways: A slight decrease in the overall meshing stiffness of the gear pair and a local decrease in the pitting meshing area.
The change in meshing stiffness caused by the position of pitting along the tooth surface direction is shown in Figure 13a. It can be concluded that the gear meshing stiffness will decrease when meshing in the pitting area, and the decrease in meshing stiffness can be ignored at other meshing moments. The varying location of pitting along the length of the tooth surface will affect the distribution of the stiffness-reduced area on the horizontal axis, which affects the duration of the stiffness-reduction area during the meshing process. However, the amplitude of stiffness reduction has not changed significantly.
The change in the position of pitting along the tooth width direction leads to a change in the meshing stiffness of the gear pair, as shown in Figure 13b. Five different pitting positions were considered here, and it can be seen from the figure that when the pitting position changes along the tooth width direction, the meshing stiffness does not change significantly. This is also related to the gear parameters selected. The gear used is an unmodified theoretical spur cylindrical gear pair, and the tooth surface load will be evenly distributed on the tooth surface meshing line. Therefore, the meshing stiffness is basically consistent when the pitting changes along the tooth width position. However, if taking the gear modification into consideration, this conclusion is not applicable, and further research is needed.
From the comparison of the above two sets of data, it can be seen that the effect of the pitting position change along the tooth width direction on the meshing stiffness is not significant. However, the pitting position change along the tooth profile direction will result in the lateral translation of the meshing stiffness reduction area along the horizontal axis. Therefore, we modify the size of rectangular pitting to study the changes in meshing stiffness under different pitting sizes.
The change in meshing stiffness of the gear pair caused by the different pitting sizes is shown in Figure 14. Five pitting sizes were considered here, including changes in the length and width of rectangular pitting. From the stiffness data in the figure, it can be seen that the change in the length of the pitting will result in a significant decrease in stiffness within the pitting area. The change in pitting length will directly affect the length of the actual contact line at the meshing position, resulting in a sharp decrease in the number of contact points. The longer the length along the tooth width direction of the pitting, the shorter the actual contact line length and the greater the load value shared by each contact point, resulting in a decrease in meshing stiffness. The change in the width of the pitting will lead to an expansion of the influence area of pitting on the stiffness. Pitting will make the actual contact line smaller than the theoretical contact line, and the change in pitting width will lead to an increase in the meshing time of the meshing area. Therefore, it can be clearly seen in the meshing stiffness that the stiffness reduction amplitude of pitting of the same lengths and different widths sizes are basically the same, but it will increase the duration of the stiffness decrease time caused by pitting.

5. Conclusions

This article improved the LTCA method to calculate the meshing stiffness of crack or pitting gear pairs efficiently and accurately, combining the advantages of the accuracy of the finite element method and the rapidity of the analytical method. The improved method can effectively extract the macroscopic flexibility coefficients of each tooth surface and accurately calculate the contact deformation of the tooth surface. For faulty gear pairs, the contact deformation of possible contact points at any meshing moment can be obtained through an organic combination based on the position of the meshing contact line. The conclusions drawn in this article are as follows:
(1)
The simulation results show that the improved method has many advantages when compared with the other methods for calculating the meshing stiffness of faulty gear pairs. It can ensure high computational accuracy, significantly improve computational efficiency, reduce the time cost of engineering research, and achieve efficient modeling of fault transmission systems.
(2)
The stiffness calculation results of crack and pitting faults indicate that the meshing stiffness decreases more severely under crack faults, manifested as a decrease in the whole meshing stiffness of cracked gear teeth. However, the variation of the meshing stiffness of the gear pair under pitting faults is slightly different from the cracked gear pair, manifested as a decrease in the meshing stiffness when the pitting area is meshing, with a limited reduction amplitude in the entire meshing stiffness.
(3)
The meshing stiffness of the gear pair is closely related to the length of the actual meshing contact line. The growth of pitting along the tooth width direction will lead to a decrease in the actual length of the meshing contact line, resulting in a greater decrease in meshing stiffness; the growth of pitting along the tooth profile direction will lead to a longer duration of the short contact line, resulting in a longer duration of the decrease in meshing stiffness.
The improved method can be used for calculating the meshing stiffness of gear pairs with uniformly distributed full-tooth-width cracks and rectangular pitting faults. Developing a more precise meshing stiffness calculation method for faulty gear pairs will be covered in our future research work.

Author Contributions

Conceptualization, H.W. and Z.L.; methodology, Z.L.; software, Z.L.; validation, F.L., C.W. and J.Z.; formal analysis, M.Q.; investigation, Z.L.; resources, H.W.; data curation, J.Z.; writing—original draft preparation, Z.L.; writing—review and editing, H.W. All authors have read and agreed to the published version of the manuscript.

Funding

This research was funded by the National Key Laboratory of Science and Technology on Helicopter Transmission (Grant No. HTL-O-21G01).

Data Availability Statement

The data presented in this study are available on request from the corresponding author. The data are not publicly available due to restrictions e.g., privacy or ethical.

Conflicts of Interest

The authors declare no conflict of interest.

References

  1. Kan, K.; Binama, M.; Chen, H.; Zheng, Y.; Zhou, D.; Su, W.; Muhirwa, A. Pump as turbine cavitation performance for both conventional and reverse operating modes: A review. Renew. Sustain. Energy Rev. 2022, 168, 112786. [Google Scholar] [CrossRef]
  2. Kan, K.; Chen, H.; Zheng, Y.; Zhou, D.; Binama, M.; Dai, J. Transient characteristics during power-off process in a shaft extension tubular pump by using a suitable numerical model. Renew. Energy 2021, 164, 109–121. [Google Scholar] [CrossRef]
  3. Chang, L.; Liu, G.; Zheng, Y.; Ding, Y.F. A modified method for determining mesh stiffness of gears based on finite element method and elastic contact theory. Hangkong Dongli Xuebao 2014, 29, 682–688. [Google Scholar]
  4. Zhang, C.; Dong, H.; Wang, D.; Dong, B. A new effective mesh stiffness calculation method with accurate contact deformation model for spur and helical gear pairs. Mech. Mach. Theory 2022, 171, 104762. [Google Scholar] [CrossRef]
  5. Ma, H.; Pang, X.; Feng, R.; Zeng, J.; Wen, B. Improved time-varying mesh stiffness model of cracked spur gears. Eng. Fail. Anal. 2015, 55, 271–287. [Google Scholar] [CrossRef]
  6. Mohammed, O.D.; Rantatalo, M.; Aidanpää, J.-O. Improving mesh stiffness calculation of cracked gears for the purpose of vibration-based fault analysis. Eng. Fail. Anal. 2013, 34, 235–251. [Google Scholar] [CrossRef]
  7. Liang, X.; Zuo, M.J.; Pandey, M. Analytically evaluating the influence of crack on the mesh stiffness of a planetary gear set. Mech. Mach. Theory 2014, 76, 20–38. [Google Scholar] [CrossRef]
  8. Yang, L.; Wang, L.; Yu, W.; Shao, Y. Investigation of tooth crack opening state on time varying meshing stiffness and dynamic response of spur gear pair. Eng. Fail. Anal. 2021, 121, 105181. [Google Scholar] [CrossRef]
  9. Luo, Y.; Baddour, N.; Liang, M. Dynamical modeling and experimental validation for tooth pitting and spalling in spur gears. Mech. Syst. Signal Process. 2019, 119, 155–181. [Google Scholar] [CrossRef]
  10. Mohamed, A.; Sassi, S.; Paurobally, M.R. Numerical simulation of one-stage gearbox dynamics in the presence of simultaneous tooth cracks. In Proceedings of the 24th International Congress on Sound and Vibration, ICSV 2017, London, UK, 23–27 July 2017. [Google Scholar]
  11. Lei, Y.; Liu, Z.; Wang, D.; Yang, X.; Liu, H.; Lin, J. A probability distribution model of tooth pits for evaluating time-varying mesh stiffness of pitting gears. Mech. Syst. Signal Process. 2018, 106, 355–366. [Google Scholar] [CrossRef]
  12. Chen, Z.; Zhai, W.; Shao, Y.; Wang, K.; Sun, G. Analytical model for mesh stiffness calculation of spur gear pair with non-uniformly distributed tooth root crack. Eng. Fail. Anal. 2016, 66, 502–514. [Google Scholar] [CrossRef]
  13. Cui, L.; Huang, J.; Zhai, H.; Zhang, F. Research on the meshing stiffness and vibration response of fault gears under an angle-changing crack based on the universal equation of gear profile. Mech. Mach. Theory 2016, 105, 554–567. [Google Scholar] [CrossRef]
  14. Mohammed, O.D.; Rantatalo, M. Dynamic response and time-frequency analysis for gear tooth crack detection. Mech. Syst. Signal Process. 2016, 66–67, 612–624. [Google Scholar] [CrossRef]
  15. Chen, Z.; Shao, Y. Dynamic Features of a Planetary Gear System with Tooth Crack Under Different Sizes and Inclination Angles. J. Vib. Acoust. 2013, 135, 031004. [Google Scholar] [CrossRef]
  16. Chen, Z.; Shao, Y. Dynamic simulation of spur gear with tooth root crack propagating along tooth width and crack depth. Eng. Fail. Anal. 2011, 18, 2149–2164. [Google Scholar] [CrossRef]
  17. Jiang, H.; Shao, Y.; Mechefske, C.K. Dynamic characteristics of helical gears under sliding friction with spalling defect. Eng. Fail. Anal. 2014, 39, 92–107. [Google Scholar] [CrossRef]
  18. Han, L.; Qi, H. Influences of tooth spalling or local breakage on time-varying mesh stiffness of helical gears. Eng. Fail. Anal. 2017, 79, 75–88. [Google Scholar] [CrossRef]
  19. Liang, X.; Zhang, H.; Liu, L.; Zuo, M.J. The influence of tooth pitting on the mesh stiffness of a pair of external spur gears. Mech. Mach. Theory 2016, 106, 1–15. [Google Scholar] [CrossRef]
  20. Saxena, A.; Parey, A.; Chouksey, M. Time varying mesh stiffness calculation of spur gear pair considering sliding friction and spalling defects. Eng. Fail. Anal. 2016, 70, 200–211. [Google Scholar] [CrossRef]
  21. Liang, X.; Zuo, M.J.; Feng, Z.; Liu, L. A mesh stiffness evaluation model to reflect tooth pitting growth of a pair of external spur gears. In Proceedings of the 2016 Prognostics and System Health Management Conference (PHM-Chengdu), Chengdu, China, 19–21 October 2016; pp. 1–6. [Google Scholar] [CrossRef]
  22. Feng, K.; Smith, W.A.; Randall, R.B.; Wu, H.; Peng, Z. Vibration-based monitoring and prediction of surface profile change and pitting density in a spur gear wear process. Mech. Syst. Signal Process. 2021, 165, 108319. [Google Scholar] [CrossRef]
  23. Vijayakar, S. A combined surface integral and finite element solution for a three-dimensional contact problem. Int. J. Numer. Methods Eng. 1991, 31, 525–545. [Google Scholar] [CrossRef]
  24. Hedlund, J.; Lehtovaara, A. A parameterized numerical model for the evaluation of gear mesh stiffness variation of a helical gear pair. Proc. Inst. Mech. Eng. Part C J. Mech. Eng. Sci. 2008, 222, 1321–1327. [Google Scholar] [CrossRef]
  25. Fang, Z. A Model and method for loaded teeth contact analysis (LTCA) of gear teeth. Mech. Transm. 1998, 2–4, 53. [Google Scholar]
  26. Chang, L.; Liu, G.; Wu, L. A robust model for determining the mesh stiffness of cylindrical gears. Mech. Mach. Theory 2015, 87, 93–114. [Google Scholar] [CrossRef]
  27. Feng, Z.; Jin, G.; Zhu, R. Calculation and analysis of spur gear meshing stiffness based on LTCA. Mech. Transm. 2019, 43, 78–83, 91. [Google Scholar]
  28. Cappellini, N.; Tamarozzi, T.; Blockmans, B.; Fiszer, J.; Cosco, F.; Desmet, W. Semi-analytic contact technique in a non-linear parametric model order reduction method for gear simulations. Meccanica 2018, 53, 49–75. [Google Scholar] [CrossRef]
  29. Chang, L.; Liu, G.; Wu, L. Determination of composite meshing errors and its influence on the vibration of gear system. J. Mech. Eng. 2015, 51, 123–130. [Google Scholar] [CrossRef]
  30. Chang, L.; He, Z.; Yuan, B.; Song, W. A model for coupling analysis of the nonlinear contact characteristics and dynamics of gear pairs. Hsichiao Tung Ta Hsueh/J. Xi’an Jiaotong Univ. 2022, 56, 1–10. [Google Scholar]
  31. Yuan, B. Meshing Characteristics and Dynamic Analysis of Marine Gear Systems with High Speed and Heavy Load. Ph.D. Thesis, Northwestern Polytechnical University, Xi’an, China, 2019. [Google Scholar]
  32. Ding, C.; Zhang, L.; Zhou, F.; Zhu, J.; Zhao, S.K. Theoretical formula for calculation of line-contact elastic contact deformation. Tribology 2001, 21, 135–138. [Google Scholar]
  33. Chang, L. A Generalized Dynamic Model for Parallel Shaft Gear Transmissions and the Influences of Dynamic Excitations. Ph.D. Thesis, Northwestern Polytechnical University, Xi’an, China, 2014. [Google Scholar]
Figure 1. The meshing process of straight cylindrical gear pairs and the meshing surface of gear pairs. (a) Meshing process of gear pair. (b) Distribution of contact lines on the meshing surface.
Processes 11 02003 g001
Figure 2. Coordination relationship of gear pair meshing deformation.
Processes 11 02003 g002
Figure 3. Tooth surface stiffness matrix extraction based on finite element Substructure method.
Processes 11 02003 g003
Figure 4. Iterative solution process for nonlinear equations.
Processes 11 02003 g004
Figure 5. Time-varying meshing stiffness history of spur gear pairs.
Processes 11 02003 g005
Figure 6. Schematic diagram of modeling parameters for gear tooth crack.
Processes 11 02003 g006
Figure 7. Position relationship of meshing contact line during double-teeth meshing process. (a) Healthy Tooth–Healthy Tooth. (b) Fault tooth–healthy tooth.
Processes 11 02003 g007
Figure 8. Definition of tooth pitting.
Processes 11 02003 g008
Figure 9. Comparison and verification of meshing stiffness by using LTCA.
Processes 11 02003 g009
Figure 10. Comparison and verification of meshing stiffness of LTCA considering faults. (a) Pitting gear pair. (b) Crack gear pair.
Processes 11 02003 g010
Figure 11. The effect of crack length on meshing stiffness in crack failure mode. (a) The value of meshing stiffness. (b) The reduction amplitude of meshing stiffness.
Processes 11 02003 g011
Figure 12. Effect of crack propagation angle on meshing stiffness under half-tooth crack size.
Processes 11 02003 g012
Figure 13. The effect of changing the position of pitting. (a) Pitting position along the tooth profile direction. (b) Pitting position along the tooth width direction.
Processes 11 02003 g013
Figure 14. The effect of changing the size of pitting on meshing stiffness. (a) Different pitting lengths. (b) Different pitting widths.
Processes 11 02003 g014
Table 1. Gear pair calculation model parameter table.
ParameterModule
(mm)
Teeth
Number
Width
(mm)
Pressure Angle (°)Elastic Modulus (Pa)Poisson’s RatioPower
(kW)
Speed
(r/min)
Driving gear64534202.05 × 10110.3278.32640.74
Driven gear353395.24
Table 2. Comparison of time consumption between two methods for calculating meshing stiffness.
Type of Gear PairTime Consumption (s)
Finite Element MethodLTCA Method
Healthy35,653.30241.06
Crack44,719.41267.08
Pitting42,376.48282.96
Table 3. Parameter settings under gear tooth crack fault.
Gear Crack ParametersGear Crack Parameters Settings
Crack length0%5%12.5%25%37.5%50%
Crack angle75°70°65°
Table 4. Parameter setting under tooth pitting fault.
Gear Pitting ParametersGear Pitting Parameter Settings
Tooth profileProfile-1Profile-2Profile-3Profile-4Profile-5
Tooth widthWidth-1Width-2Width-3Width-4Width-5
Pitting size
(length-width)
5 × 1 mm10 × 0.5 mm10 × 1 mm10 × 1.5 mm15 × 1 mm
Disclaimer/Publisher’s Note: The statements, opinions and data contained in all publications are solely those of the individual author(s) and contributor(s) and not of MDPI and/or the editor(s). MDPI and/or the editor(s) disclaim responsibility for any injury to people or property resulting from any ideas, methods, instructions or products referred to in the content.