Article

A Study on the Stability of Reinforced Tunnel Face Using Horizontal Pre-Grouting

1
School of Energy and Mining Engineering, China University of Mining and Technology-Beijing, Beijing 100083, China
2
China Construction Second Engineering Bureau Ltd., Beijing 100160, China
*
Author to whom correspondence should be addressed.
Processes 2023, 11(7), 2044; https://doi.org/10.3390/pr11072044
Submission received: 29 May 2023 / Revised: 25 June 2023 / Accepted: 4 July 2023 / Published: 8 July 2023

Abstract

:
As tunnel excavation under poor geological conditions is liable to cause ground collapses, reinforcement measures are necessary to reduce construction risks. The stability of a tunnel face that was reinforced using horizontal pre-grouting was investigated through numerical simulation and theoretical analysis in this study. An analytical model was developed using the limit equilibrium method and taking into account the impact of horizontal grouting reinforcement (HGR) on the tunnel face. Subsequently, a comprehensive numerical simulation was conducted to confirm the validity of the model. By performing a parametric analysis, it was found that the limit support pressure exhibited a linear relationship with the cohesion and friction angle. In addition, the limit support pressure is more sensitive to changes in the cohesion and friction angle than changes in the stiffness ratio and thickness of HGR. The HGR more effectively decreases the limit support pressure in conditions of low cohesion (or friction angle) compared with conditions of high cohesion (or friction angle).

1. Introduction

Compared with traditional methods, shield tunneling technology is a scientific and effective method for excavating tunnels, which significantly reduces the adverse effects of construction on the environment. The stability of the tunnel face is critical for safe excavation. Inadequate support pressure may lead to large-scale collapses or ground surface uplift, resulting in damage to the surrounding environment and property. Therefore, it is essential to predict the controllable range of support pressure in the tunnel face to minimize construction disturbance.
In recent years, many scholars have adopted various methods to explore the controllable range of support pressure, such as experimental tests, numerical simulations, and theoretical analysis. Experimental tests are widely used in the study of tunnel face stability and are typically performed to visualize destructive phenomena and obtain monitoring results close to the practical situation. Two categories of tests, 1 g model tests [1,2,3,4] and centrifuge tests [5,6,7], are often used.
With the recent advancements in computational technology, numerical simulations have become a momentous tool for exploring large-scale destruction phenomena and mechanisms. Shield tunneling is a typical three-dimensional problem; a numerical model can meticulously simulate the construction process of shield tunneling under complex formation boundary conditions. Consequently, continuum methods (finite element method and finite difference method) and discrete methods (discrete element method) have become indispensable to many scholars in studying this problem and verifying their results. The finite element method involves dividing the continuous solution domain into a finite number of interconnected elements, each of which is defined by a set of nodes. Then, interpolation is used to solve each element, and the set of solutions derived from all elements constitutes the solution of the entire problem domain [8,9,10]. On the other hand, in the finite difference method, the solution domain is discretized into a finite number of grids, and the differential equations and boundary conditions are approximated using difference equations. This conversion changes the problem of solving differential equations into the problem of solving algebraic equations, and the approximate solution of each grid node can be obtained by solving these algebraic equations [11,12]. Meanwhile, the discrete element method discretizes the research area into various rigid elements that are interconnected by nodes. By solving the motion equation for each element iteratively, the overall motion of the research area can be obtained [13,14,15].
The limit support pressure of tunnel faces has typically been explored through theoretical analysis using either the limit equilibrium method [16,17,18] or the limit analysis method [19,20,21,22]. The limit analysis method calculates the limit support pressure of the tunnel face by assuming the shape of slides in front of the tunnel face based on plastic theory. In contrast, the limit equilibrium method determines the limit support pressure by analyzing the static and moment balances of each wedge in sliding soil. While the limit analysis method requires the selection of an appropriate static stress field or kinematic deformation field and is considered complex, the intuitive mechanical concept and simplicity have led to the extensive adoption of the limit equilibrium method in tunnel face stability analysis. Horn’s classical limit equilibrium model, which was the first model proposed based on silo theory consisting of a wedge in front of the tunnel face and a prism extending to the surface, did not have a calculation formula associated with it [19]. However, Jancsecz and Steiner [23] improved the three-dimensional wedge-prism model by considering the overlying soil’s soil arching effect. Kraus [24] analyzed the shear force on the sliding surface using the limit equilibrium method and calculated the limit support pressure by using one-fourth circles, half-circles, and half-spheres. The results show that the limit support pressure calculated using the half-sphere model is closest to its real-world practical application. Recently, various factors such as seepage flow, high water pressure, ground heterogeneity, and fault fracture have been considered by extending the classical wedge-prism model [10,17,18,25,26,27].
Most tunnels constructed in coastal cities are built on soft ground. Soft ground has a low shear strength, high compressibility, low bearing capacity, and other unfavorable properties, making it difficult to maintain the stability of tunnel faces [28]. Therefore, tunnel reinforcement techniques such as horizontal pre-grouting, face bolting, three-shaft stirring piles, and freezing methods are typically used to enhance the stability of tunnel faces. Among these, horizontal pre-grouting reinforcement is currently one of the most effective methods. Zhang et al. [26] proposed a 3D model based on the limit equilibrium method and strength reduction technique to analyze the stability of a reinforced bolting face. Su et al. [29] developed an analytical model to predict the limit support pressure acting on tunnel faces in the three-shaft stirring pile reinforcement layer for shallow shield tunneling. However, comprehensive research on the stability of tunnel faces reinforced using horizontal pre-grouting is lacking, and the failure mechanisms of such reinforcements remain unclear.
This study aims to establish an analytical model to predict the limit support pressure acting on tunnel faces in horizontal pre-grouting ground. Section 2 presents the computational model based on the limit equilibrium method, and formulas for calculating the limit support pressure at tunnel faces are derived. Section 3 evaluates the accuracy of the proposed model by comparing its results with those obtained from a numerical simulation. Finally, the study investigates the impact of different ground and reinforcement parameters, such as stiffness (k), thickness (t), cohesion (c), and friction angle (φ).

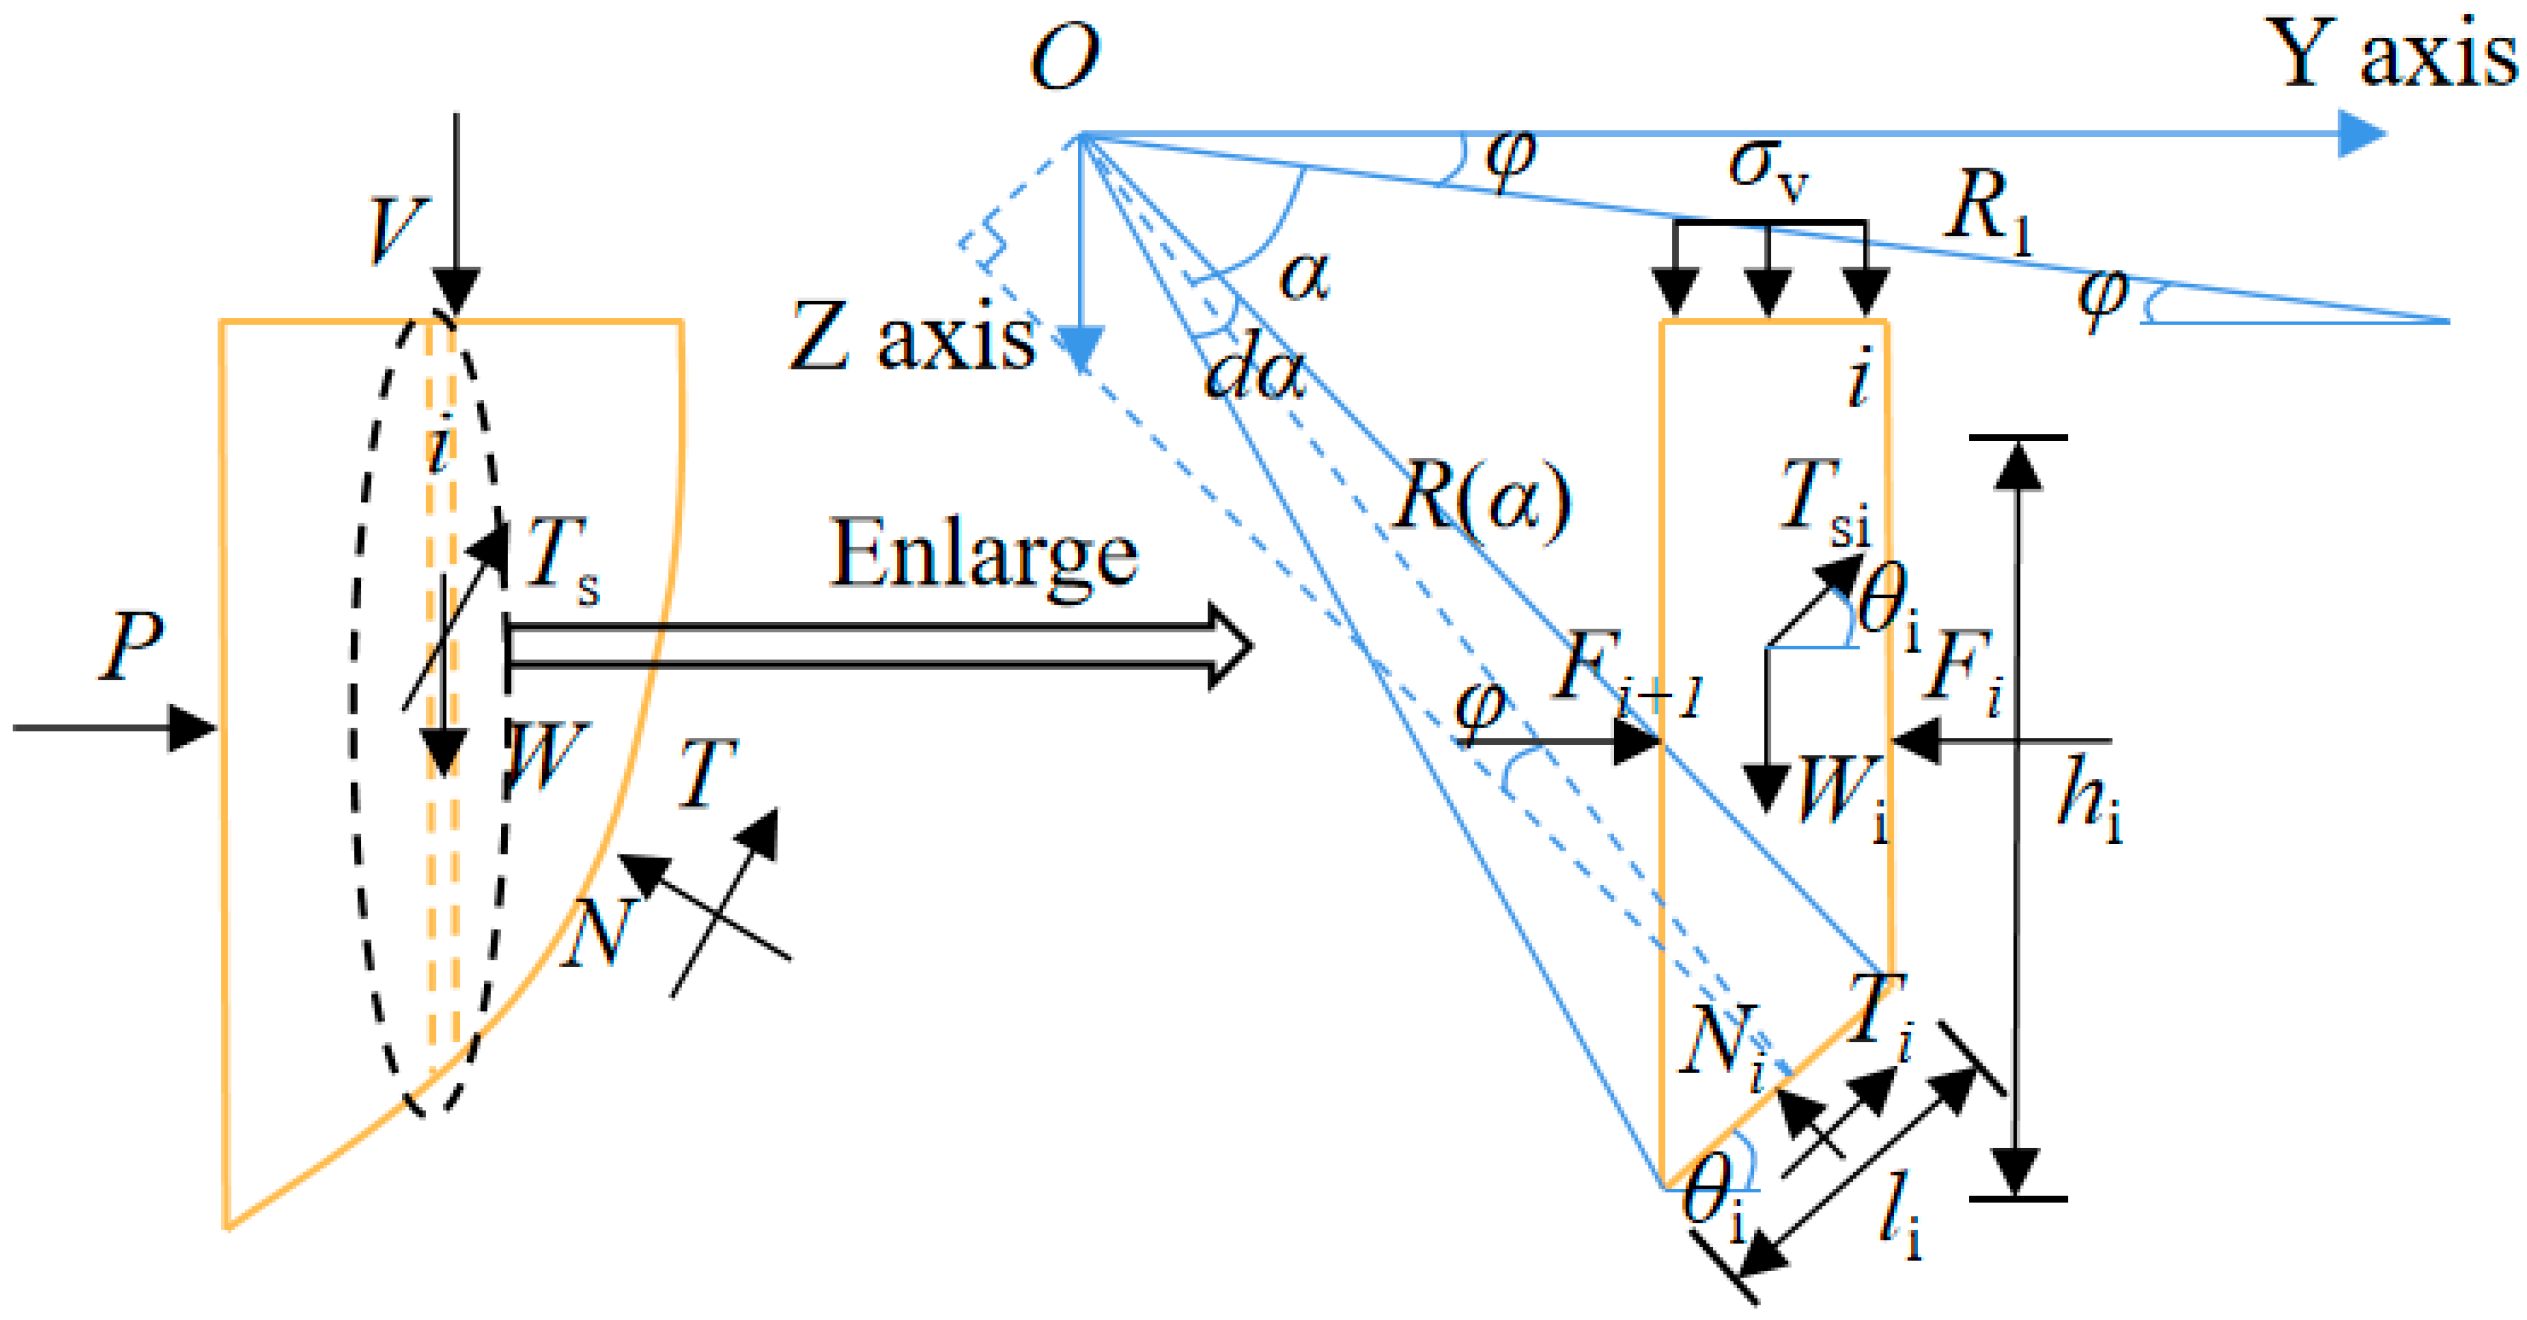
2. Establishment of the Limit Equilibrium Model
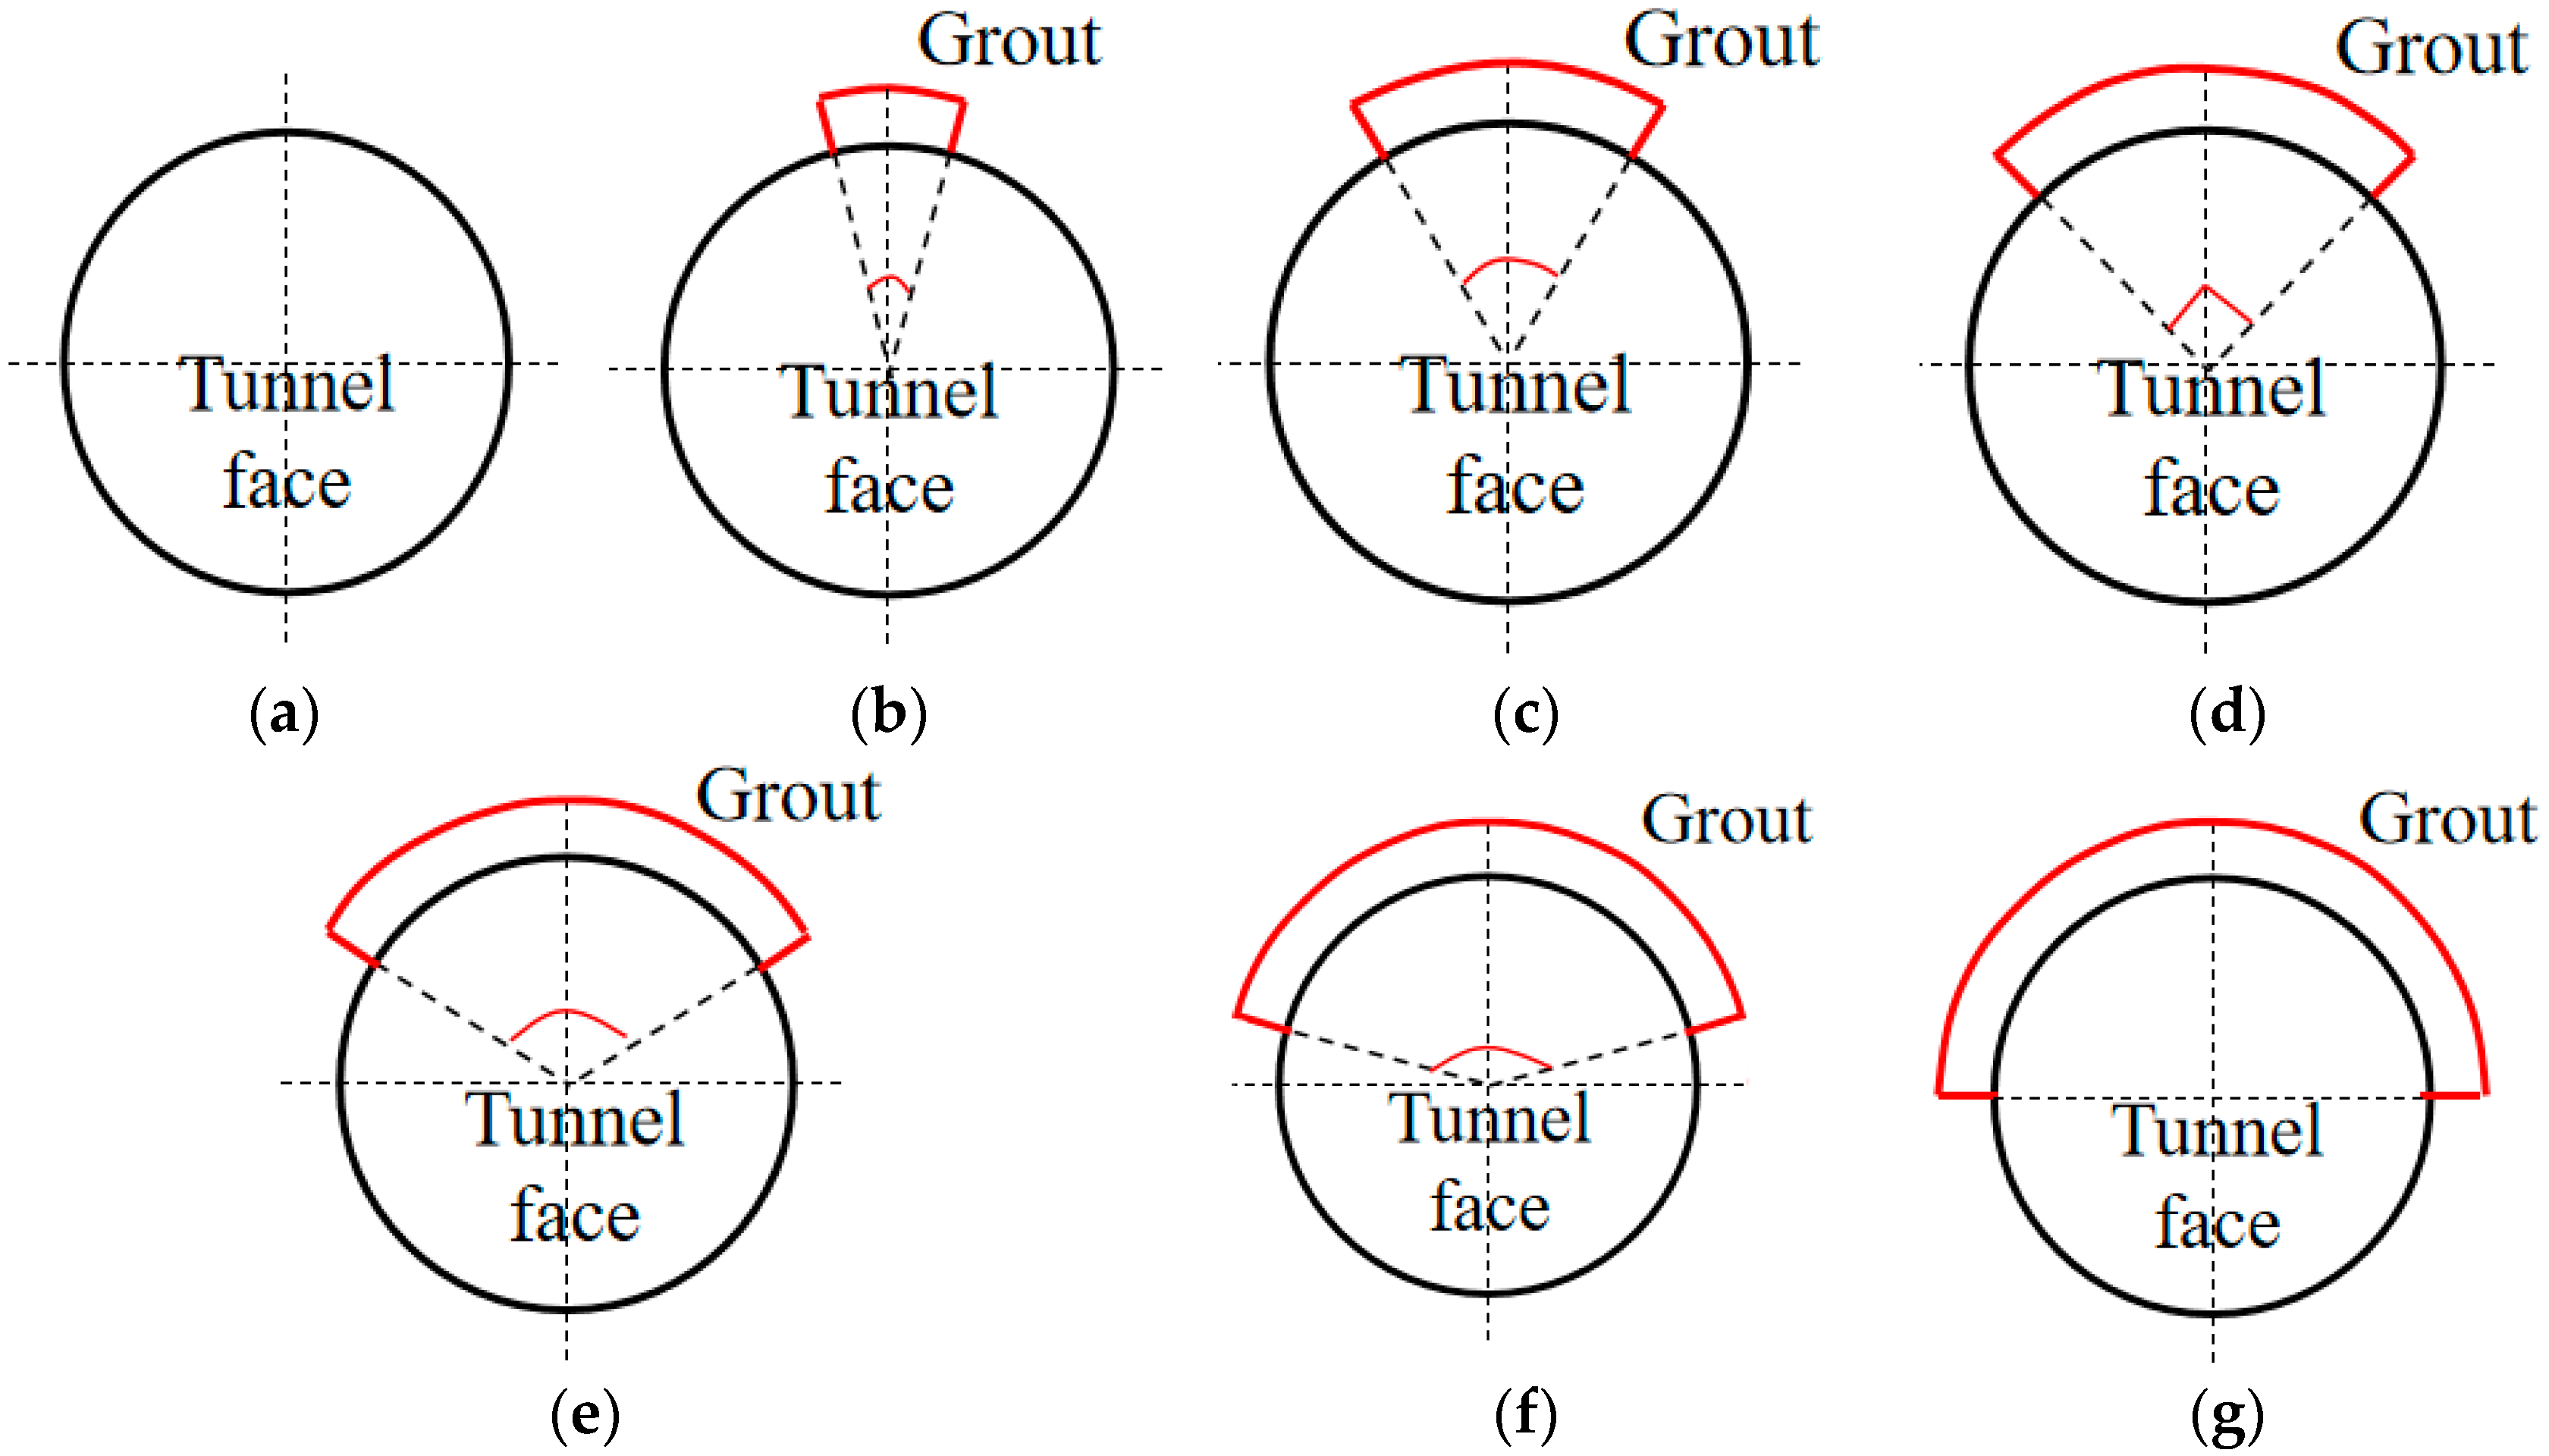
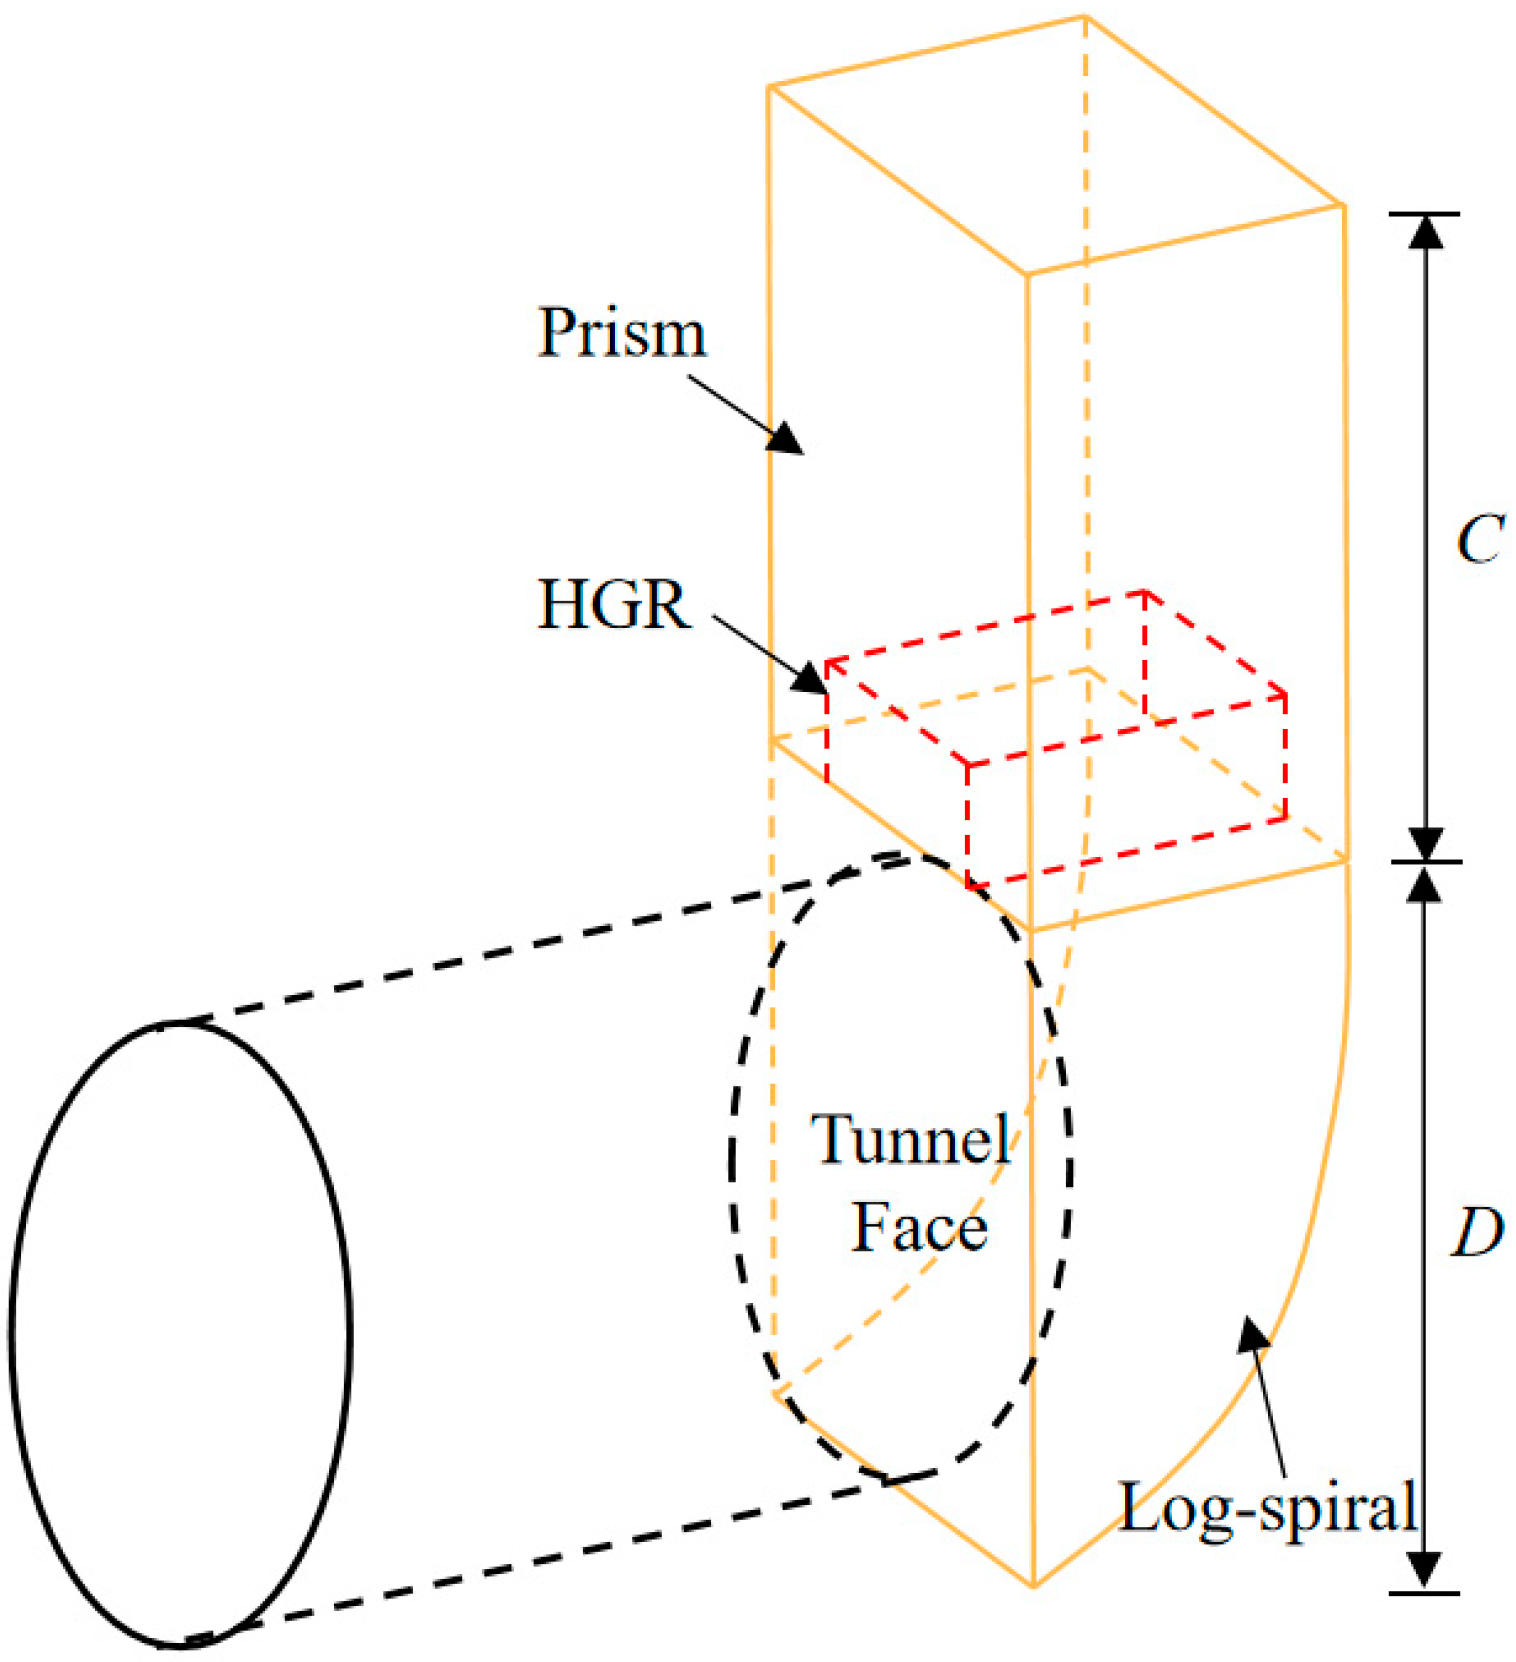
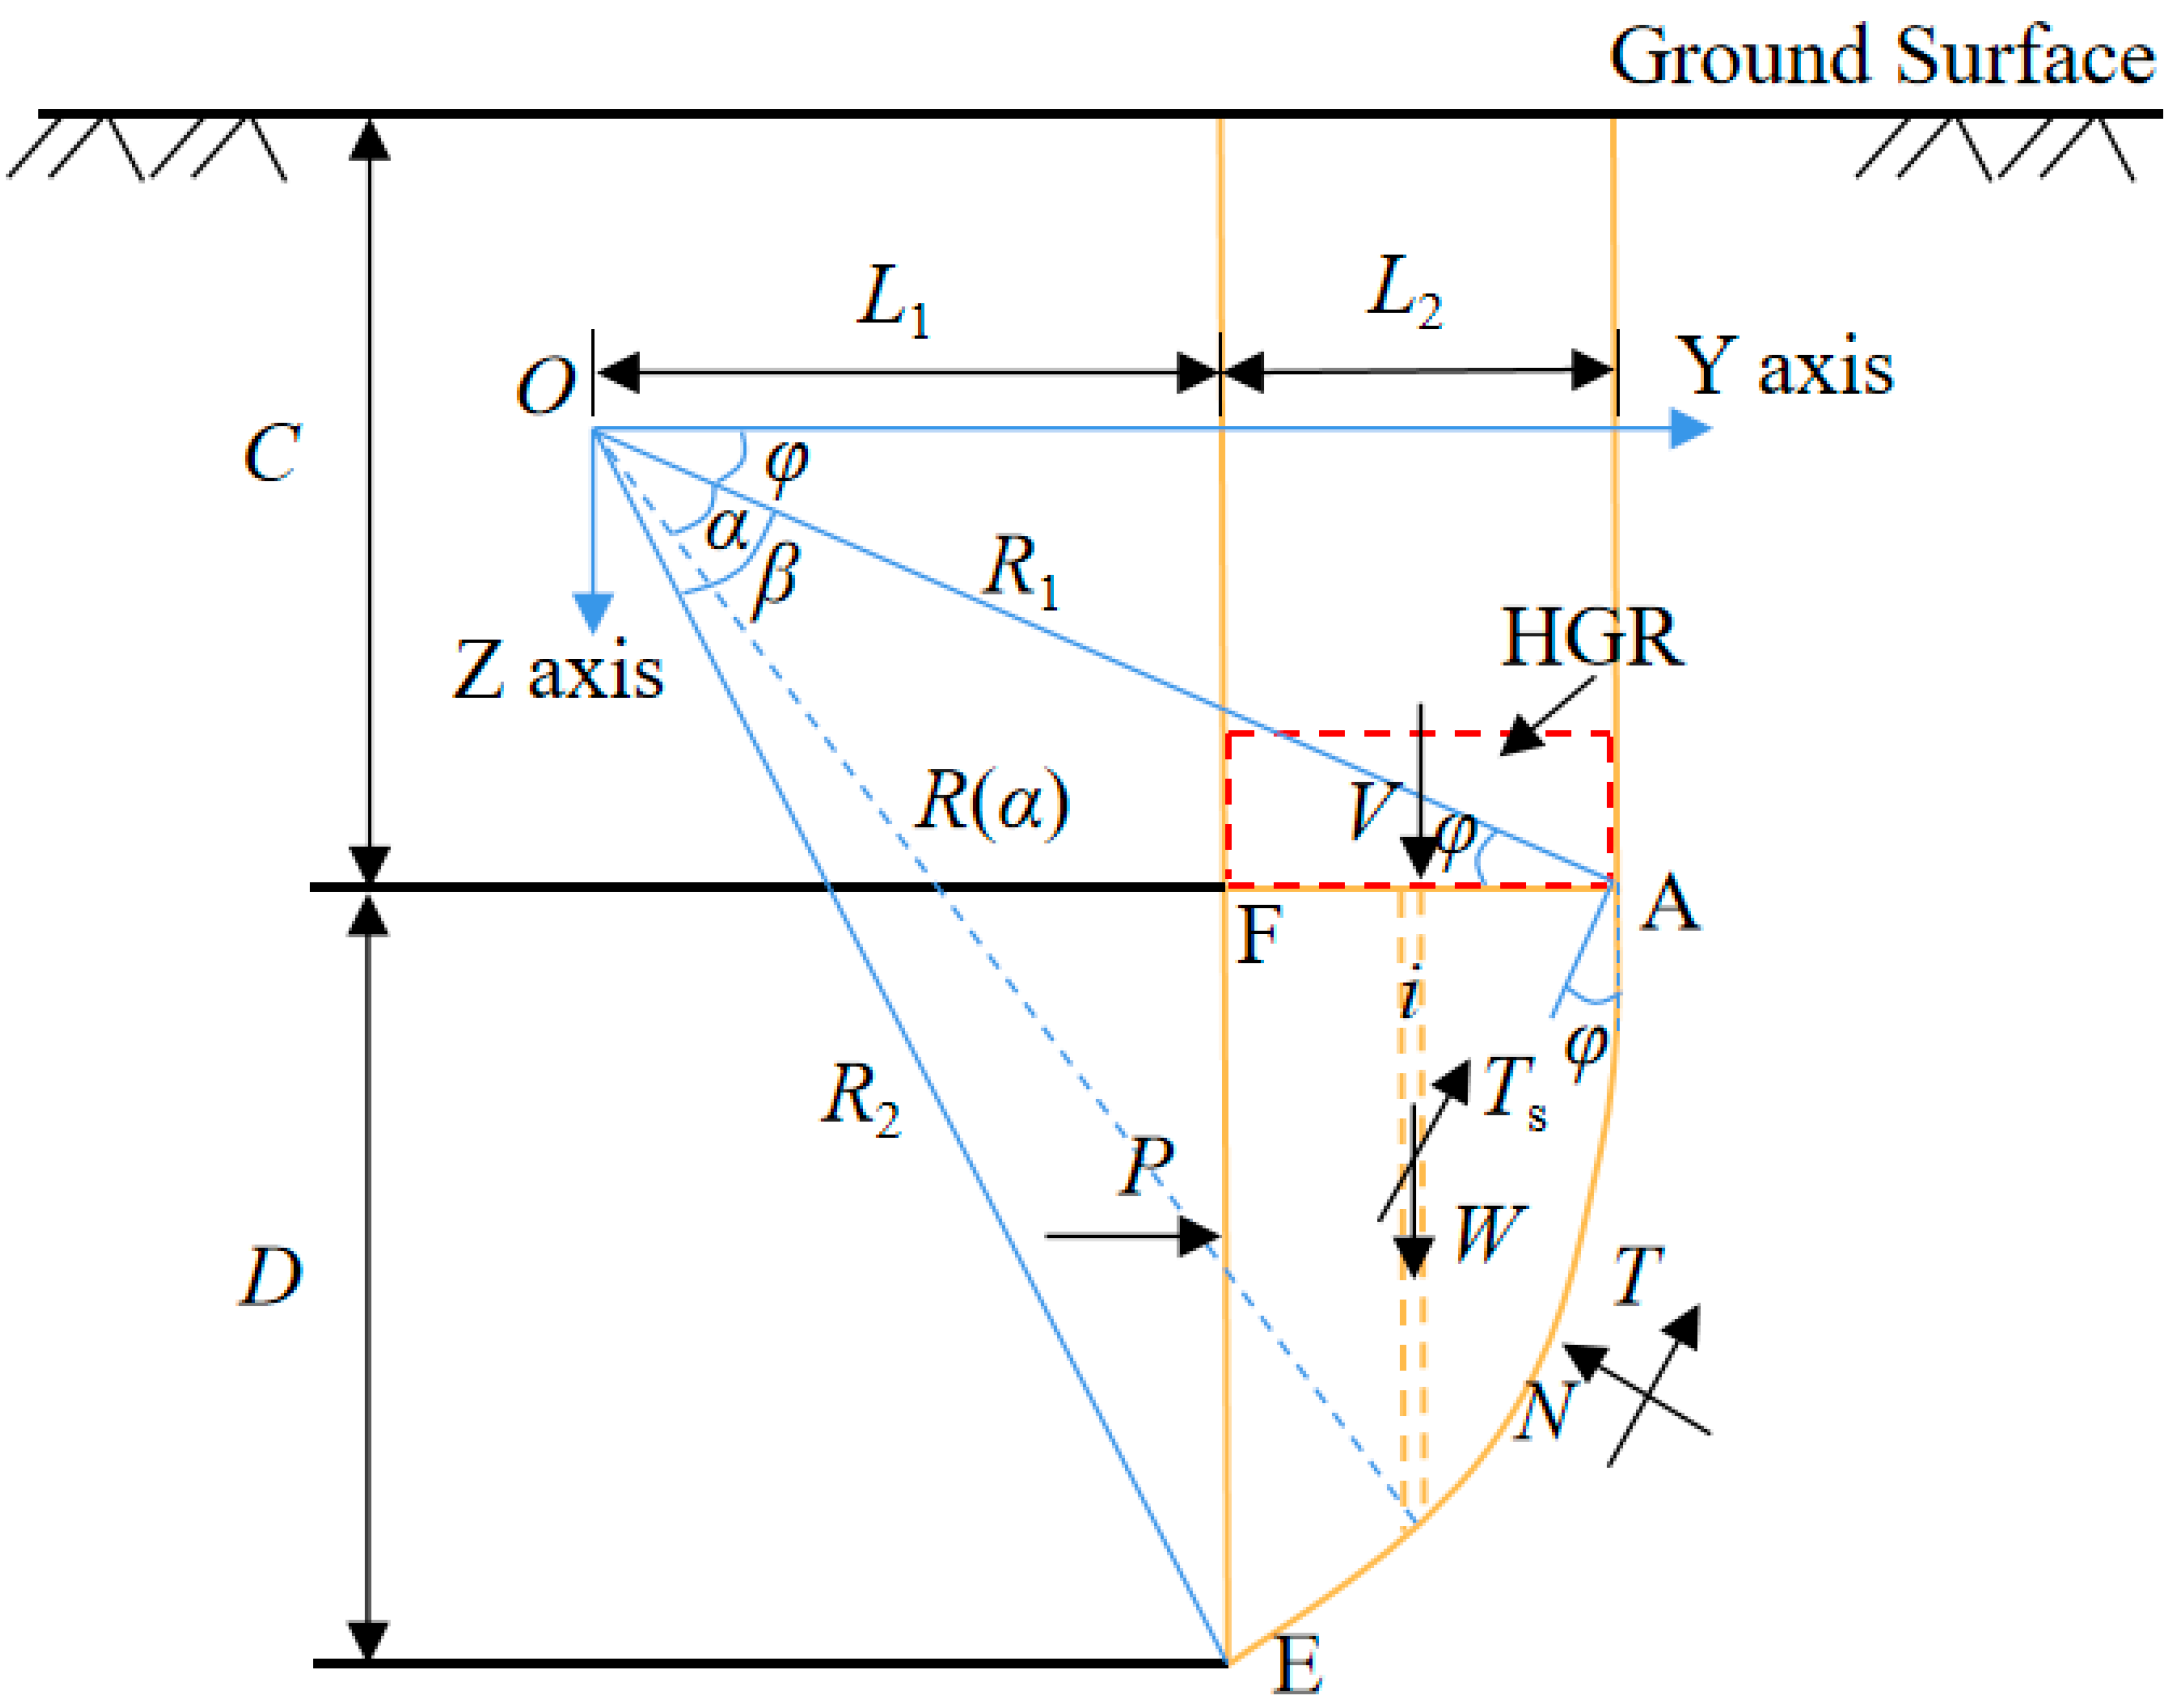
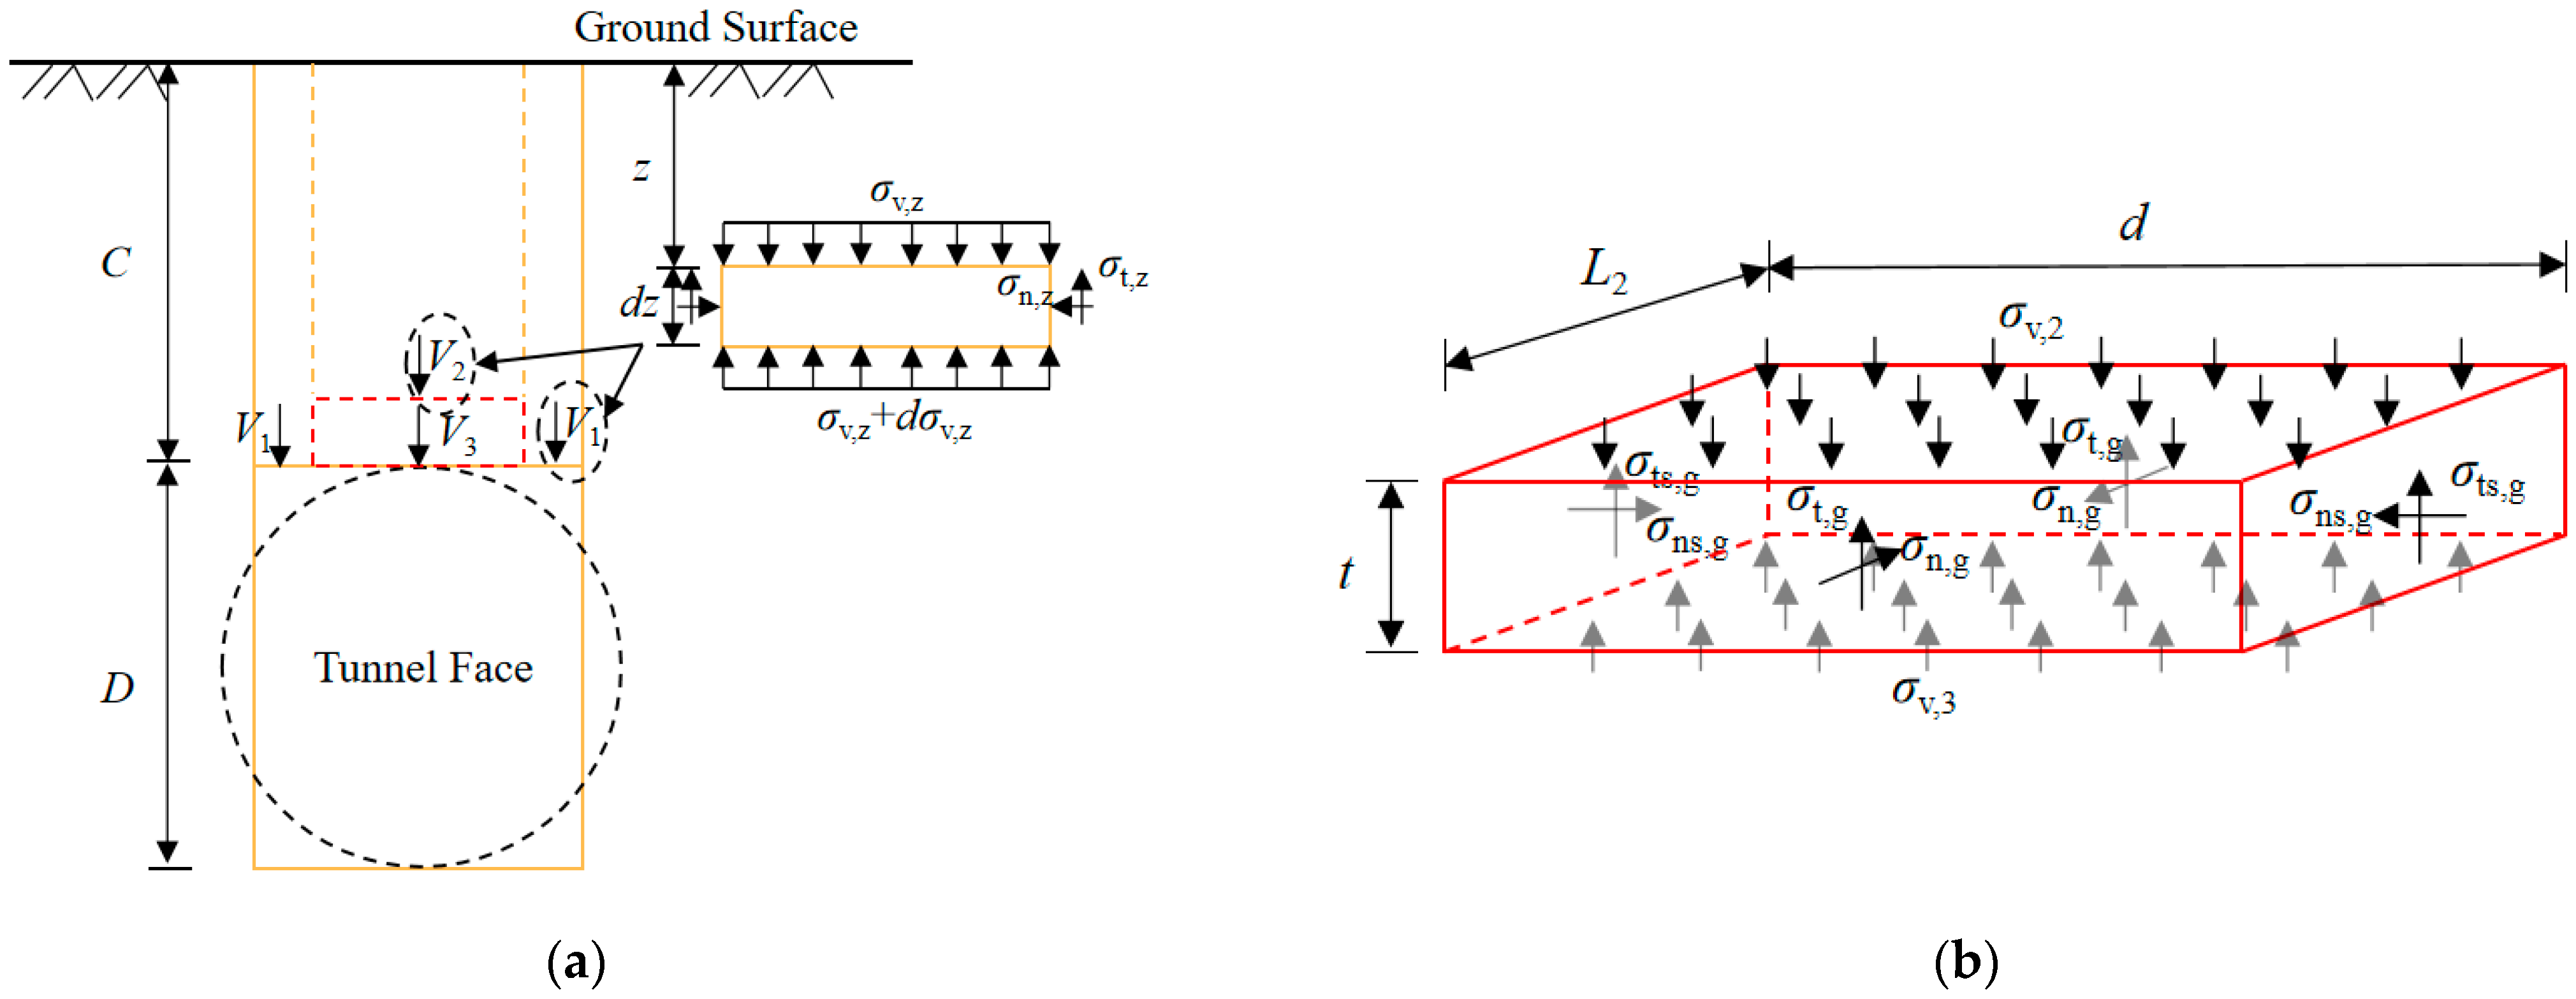
2.1. Overview

Shield tunneling is associated with significant risk in the case of poor geological conditions and complex surroundings. Generally, horizontal pre-grouting is adopted to reinforce the soil layer to decrease the risks associated with excavation. The efficiency of excavation is affected by the range of reinforcement of this horizontal grouting. Seven kinds of grouting reinforcement ranges are listed in Figure 1, as described in field grouting experiments. In Figure 1, the red line indicates the grouting zone and the symbol A represents the center angle of a circular tunnel. Figure 1a shows non-grouting reinforcement, and Figure 1g shows upper semicircular grouting reinforcement.
Previous research [30,31] has shown that the failure zone of a shallowly buried tunnel can extend to the ground surface if the tunnel face is unstable. The slip surface in front of the tunnel face can be more accurately described by a logarithmic spiral rather than a straight line in the longitudinal section [32]. To predict the limit support pressure of the tunnel face after horizontal pre-grouting reinforcement, a theoretical model based on the limit equilibrium method was established, as depicted in Figure 2. The model consists of a log-spiral slip surface in front of the tunnel face and an overlying prism vertically downward with horizontal grouting reinforcement (HGR), similar to classical wedge models. The variable D represents the tunnel diameter, and C denotes the thickness of the cover layer above the tunnel crown. To simplify the construction of the model mechanism, the circular cross-section of the shield face is approximated by a square with the same area [27,32]. Research has indicated that this simplification is acceptable, as the predicted limit support pressure obtained from this model can reasonably match the pressure obtained from existing studies [3,17,33]. The arc grouting zone is also simplified accordingly.
Figure 3 depicts a coordinate system established with point O as the origin, and the Y-axis and Z-axis parallel to the horizontal and vertical directions, respectively. The longitudinal section of the slip surface is bounded by a logarithmic spiral that emerges from point A and ends at point E.
The equation for the logarithmic spiral in a polar (R, α) coordinate system can be expressed as follows:
R ( α ) = R 1 e α tan φ  
where φ is the internal friction angle of the soil; α is the angle between R and R1; and R1 is the radius of the log-spiral OA and is assumed to form an angle φ with the horizontal line. Consequently, the logarithmic spiral is perpendicular to the horizontal line at point A.
According to the geometric relationships shown in Figure 3, the following equations can be obtained:
R 2 sin ( φ + β ) R 1 sin ( φ ) = D  
Therefore, the geometric parameters R1, R2, L1, and L2 in Figure 3 can be expressed as:
R 1 = D e β tan φ sin ( φ + β ) sin ( φ )
R 2 = D e β tan φ e β tan φ sin ( φ + β ) sin ( φ )
L 1 = R 2 cos ( φ + β ) = D e β tan φ cos ( φ + β ) e β tan φ sin ( φ + β ) sin ( φ )
L 2 = R 1 cos φ L 1 = D cos φ D e β tan φ cos ( φ + β ) e β tan φ sin ( φ + β ) sin ( φ )
where β is the failure angle between R1 and R2; L1 is the horizontal distance between points O and F; and L2 is the horizontal distance between points F and A.
One particular property of the log-spiral defined by Equation (1) is that the normal direction of any radial line forms an angle φ with the tangent at the point of intersection between the radial line and the spiral [26].

2.2. Solving for Limit Support Pressure

The limit support pressure can be determined by the moment equilibrium of the log-spiral. This equation can be expressed as follows:
M v + M w M N T 2 M T S M p = 0
where MV is the moment of the vertical force V; MW is the moment of the weight W; MNT is the moment of the slip resistant force at the log-spiral surface; MTS is the moment of the shear resistant force Ts at the lateral slip surface; and MP is the moment of support force P on the tunnel face.
The five moments in Equation (7) can be calculated as illustrated below.
(1)
Calculation of MV
As shown in Figure 4a, the vertical force V can be calculated as follows:
V = 2 V 1 + V 3
where V1 is the vertical force acting on the top of the tunnel at the left and right sides of the HGR, and V3 represents the vertical force acting directly on the tunnel vault as a result of HGR.
To consider the soil arching effect above the tunnel, a soil unit is incorporated for moment analysis (as shown in Figure 4a). The equation of vertical stress equilibrium can be expressed as follows, in accordance with Terzaghi’s earth pressure theory:
  B L 2 σ v , z + B L 2 γ d z = ( σ v , z + d σ v , z ) B L 2 + 2 L 2 σ t , z d z
σ t , z = c + σ n , z tan φ = c + ( σ v , z + γ d z / 2 ) K 0 tan φ
d σ v , z = ( γ 2 σ t , z B ) d z
The vertical pressure acting on the top of tunnel σv can be described as follows:
σ v , z = ( B γ c ) ( 1 e z K 0 tan φ B ) K 0 tan φ
B = B L 2 2 ( B + L 2 )
B = π D 4
K 0 = 1 sin φ
where B is the equivalent width; B’ is the ratio of the volume of the cuboid to its circumferential area; γ is the unit weight of the soil; c is the cohesion of the soil; and K0 is the coefficient of static earth pressure.
Therefore, V1 can be expressed as:
V 1 = L 2 ( B d ) σ v , C = L 2 ( B d ) ( B γ c ) ( 1 e C K 0 tan φ B ) K 0 tan φ
The force analysis of the HGR is shown in Figure 4b; the equation of vertical stress equilibrium can be obtained as follows:
d L 2 σ v , 2 + γ g d t L 2 = d L 2 σ v , 3 + 2 ( t L 2 σ t s , g + d t σ t , g )
σ v , 2 = ( B γ c ) ( 1 e ( C t ) K 0 tan φ B ) K 0 tan φ
σ t s ,   g = c g + σ n s ,   g tan φ g = c g + ( σ v , 2 + t γ g 2 ) K g tan φ g
σ t , g = c g + σ n , g tan φ g = c g + ( σ v , 2 + t γ g 2 ) K g tan φ g
K g = 1 sin φ g
where d is the equivalent width of the HGR; t is the thickness of the HGR; γg is the unit weight of the HGR; cg and φg are the cohesion and internal friction angle of the soil, respectively; Kg is the coefficient of static earth pressure for the HGR; σv,2 and σv,3 are the vertical stresses on the upper and lower sides of the HGR, respectively; σt,g is the shear stress at the front and rear sides of the HGR; and σts,g is the shear stress at the right and left sides of the HGR.
Substitute Equations (18)–(21) into Equation (17), and σv,3 can be expressed as follows:
σ v , 3 = [ d L 2 ( B γ c ) ( 1 e ( C t ) K 0 tan φ B ) + γ g d t L 2   ] t K 0 tan φ ( L 2 + d ) [ 2 c + ( 2 σ v , 2 + t γ g ) K g tan φ g ] d L 2 K 0 tan φ
Therefore, V3 can be obtained:
V 3 = max { 0 , d L 2 σ v , 3 }
After taking the moment from V to center point O, the moment Mv can be obtained as follows:
M v = V ( L 1 + L 2 2 ) = ( 2 V 1 + V 3 ) [ 0.5 D e β tan φ cos ( φ + β ) + D cos φ ] e β tan φ sin ( φ + β ) sin ( φ )
(2)
Calculation of MN,T, MTS, MW
To analyze the forces acting on the log-spiral area depicted in Figure 3, a unit must be intercepted as demonstrated in Figure 5. The ith soil slice experiences its weight Wi, the vertical earth pressure σv, lateral slip plane shear force Tsi, lateral slip plane normal force Nsi, log-spiral-shaped surface shear force Ti and normal force Ni, as well as the interaction forces Fi and Fi–1 between adjacent soil slices.
By applying the Mohr-Coulomb criterion and vertical equilibrium condition to the ith soil slice, one can derive the following equations:
σ v l i cos θ i + W i = N i cos θ i + T i sin θ i + 2 T si sin θ i
W i = γ h i B l i cos θ i
T si = c h i l i cos θ i + N si tan φ = h i l i cos θ i [ c + K 0 tan φ ( σ v + γ h i / 2 ) ]
σ v = 2 σ v , 1 + σ v , 3
where li is represents the bottom length of the slice; hi denotes the height of the slice; and θi represents the angle between the tangent direction at the bottom of the slice and the horizontal direction.
Substitute Equations (26)–(28) into Equation (25), and Ni, Ti can be expressed as follows:
N i = ( 2 σ v , 1 + σ v , 3 ) l i cos θ i + γ h i B l i cos θ i h i l i cos θ i sin θ i [ 2 c + K 0 tan φ ( 4 σ v , 1 + 2 σ v , 3 + γ h i ) ] c B l i sin θ i cos θ i + tan φ sin θ i
T i = c B l i + ( 2 σ v , 1 + σ v , 3 ) l i cos θ i + γ h i B l i cos θ i h i l i cos θ i sin θ i [ 2 c + K 0 tan φ ( 4 σ v , 1 + 2 σ v , 3 + γ h i ) ] c B l i sin θ i cos θ i + tan φ sin θ i tan φ
The relevant parameters in these formulas are calculated as follows:
θ i = π 2 α
h i = R ( α ) sin ( α + φ ) R 1 sin φ
l i = R ( α ) cos φ d α
R ( α ) = R 1 e α tan φ
According to the geometric relationship in Figure 3, the moments of MN,T, MTS, and MW are calculated as follows:
d M N T = T i R ( α ) cos φ N i R ( α ) sin φ = c B l i R ( α ) cos φ = c B R 1 2 e 2 α tan φ d α
M N T = c B R 1 2 0 β e 2 α tan φ d α
d M T S = T s i cos θ i ( R 1 sin φ + h i 2 ) = [ c + K 0 tan φ ( σ v + γ h i / 2 ) ] h i R 1 e α tan φ sin 2 α ( R 1 sin φ + h i / 2 ) cos φ d α
M T S = 0 β [ c + K 0 tan φ ( σ v + γ h i / 2 ) ] h i R 1 e α tan φ sin 2 α ( R 1 sin φ + h i / 2 ) cos φ d α
d M W = W i R ( α ) cos ( α + φ ) = γ B R 1 3 e 2 α tan φ [ e α tan φ sin ( α + φ ) sin φ ] cos ( α + φ ) sin α cos φ d α
M W = γ B R 1 3 cos φ 0 β e 2 α tan φ [ e α tan φ sin ( α + φ ) sin φ ] cos ( α + φ ) sin α d α
(3)
Calculation of limit support pressure σp
According to the geometric relationship in Figure 3, the moments of Mp are calculated as follows:
M p = [ R 2 sin ( φ + β ) D 2 ] P
By substituting Equations (24), (36), (38) and (40) into Equation (7), the limit support pressure σp can be calculated with MATLAB as follows:
σ p ,   c = M v + M w M N T 2 M T S [ R 2 sin ( φ + β ) D 2 ] B D

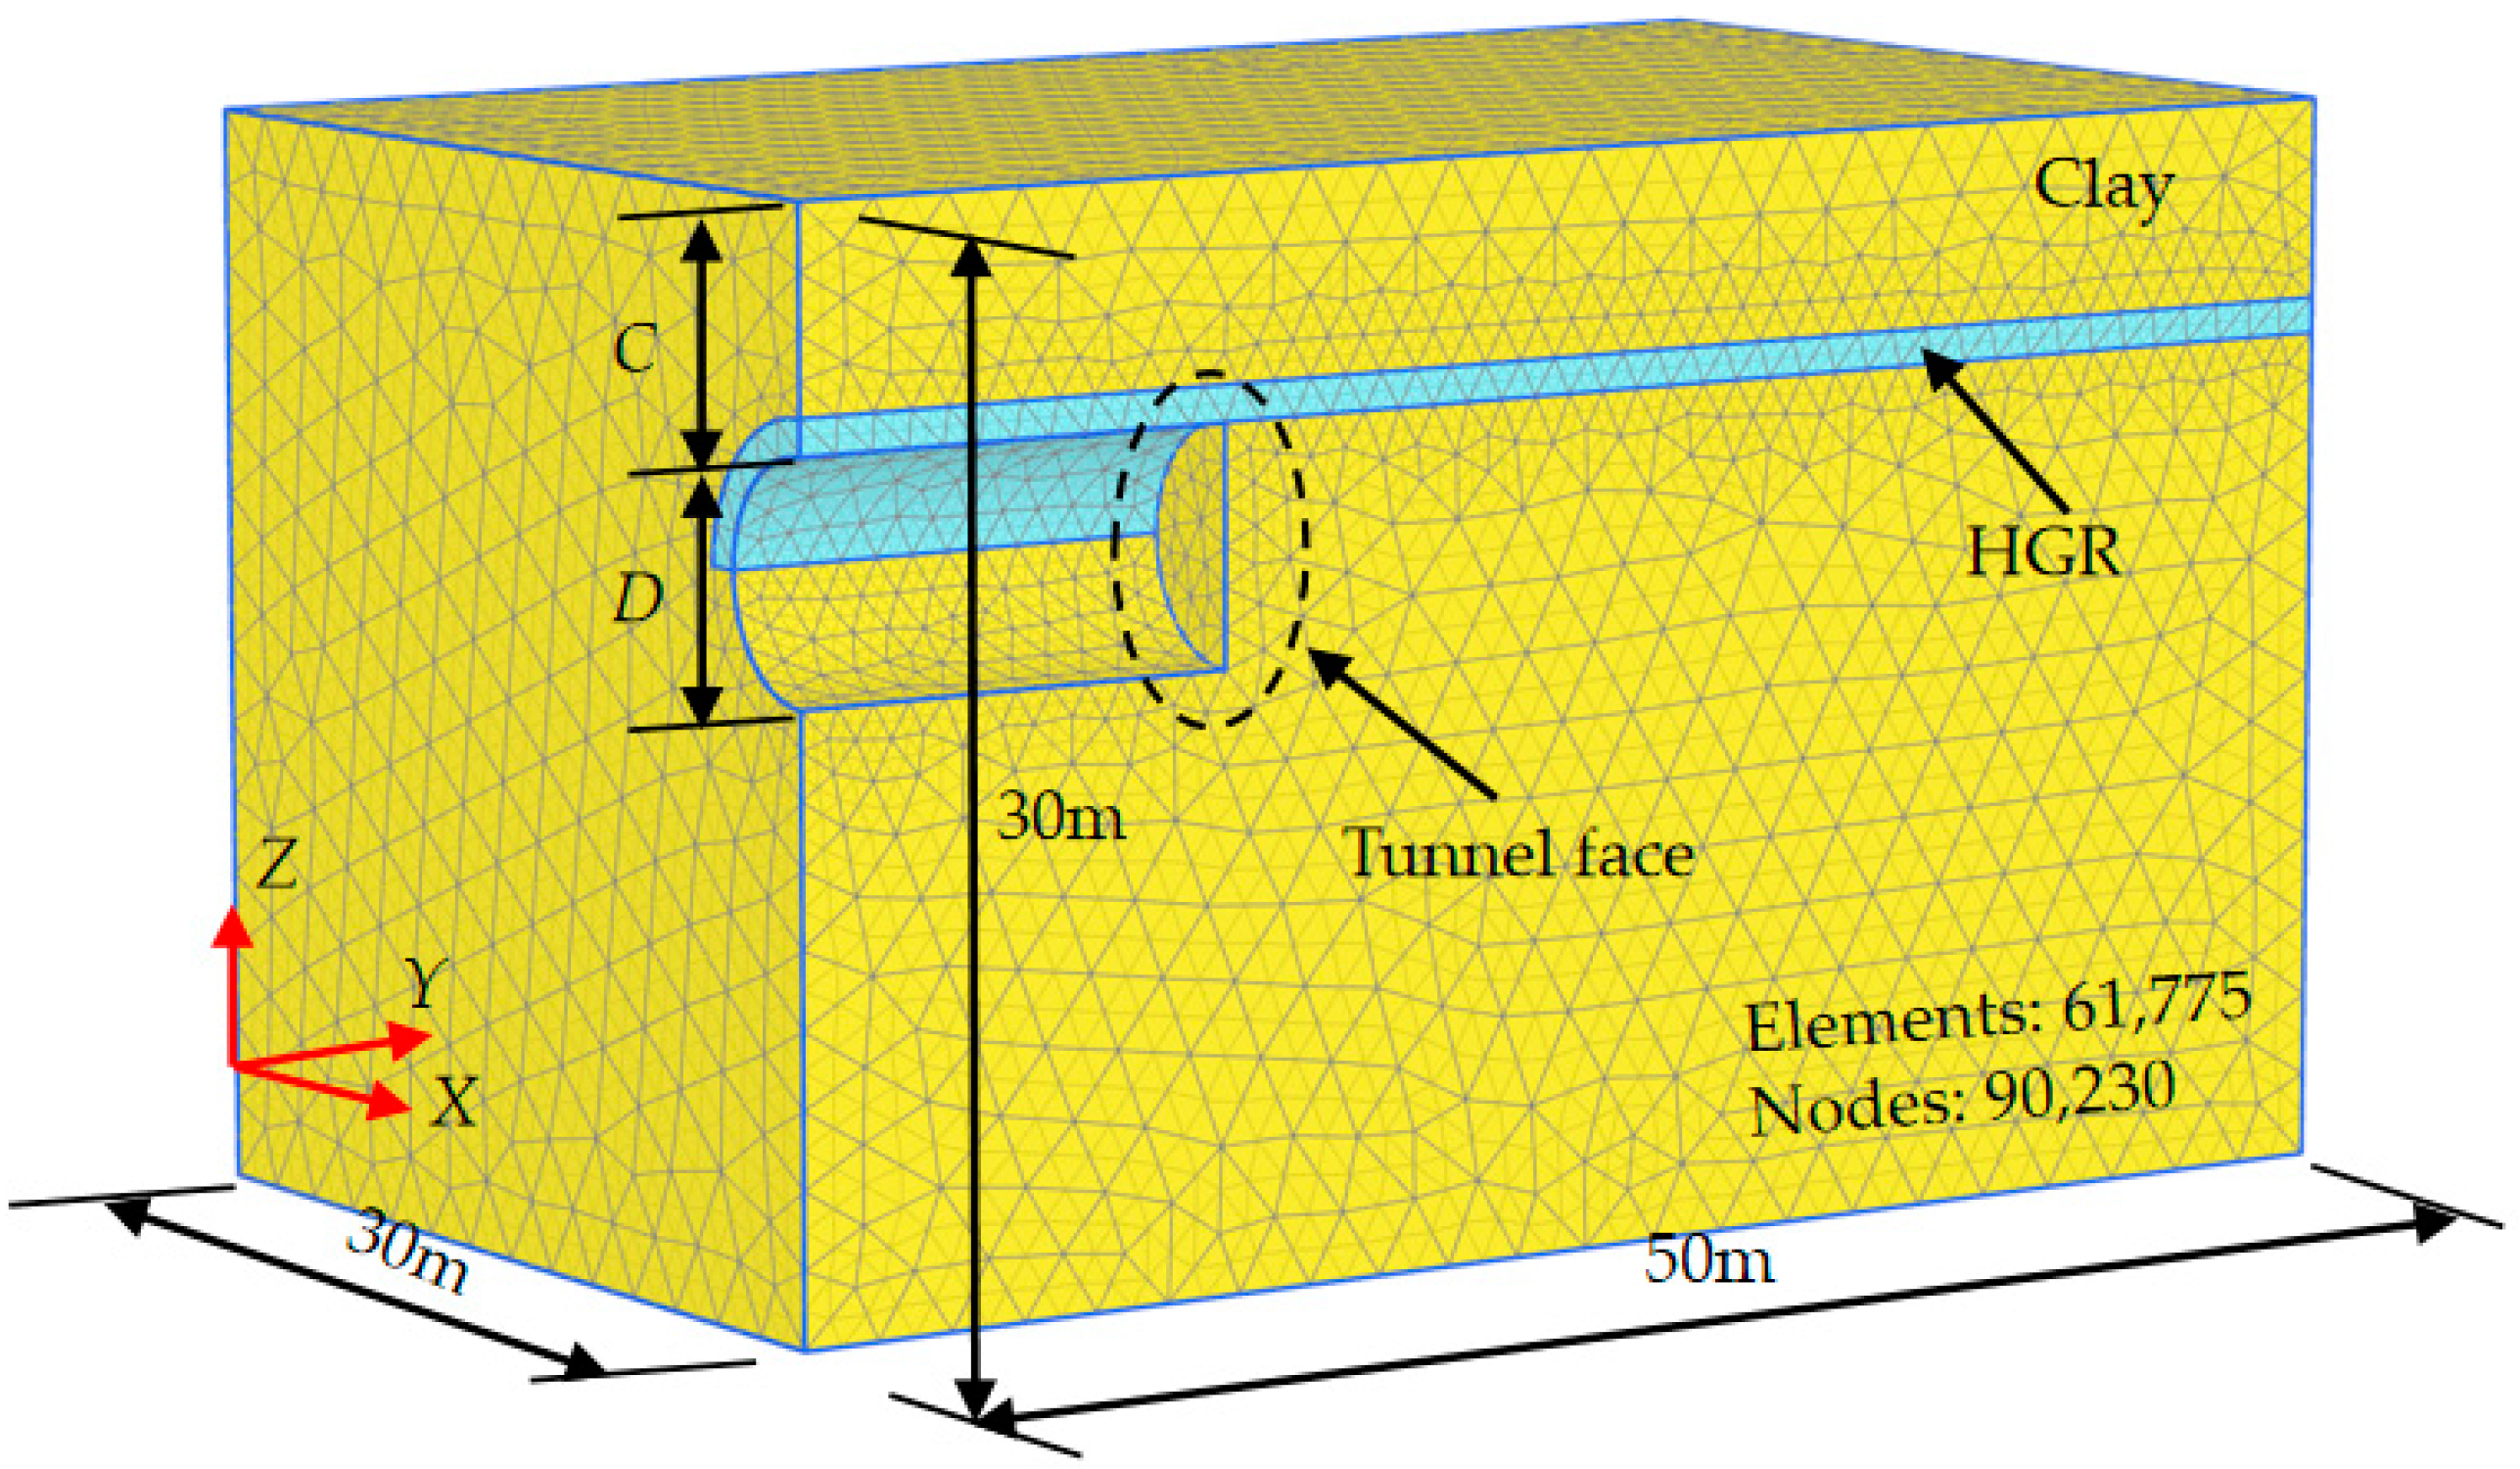
3. Establishment of the Numerical Mode

To validate the accuracy of the proposed model, a numerical simulation was performed using the commercial software PLAXIS 3D to calculate the limit support pressure of the tunnel face. In addition, the stability of the tunnel face reinforced by HGR was investigated while considering different ground and reinforcement parameters (stiffness k, thickness t, cohesion c, and friction angle φ).

3.1. Constitutive Model for Soil

A constitutive model is utilized to describe the relationship between stress and strain. In this study, a small strain hardening model (HSS) was employed to model the soil’s nonlinear characteristics and unloading behavior. The HSS is an extension of the traditional hardening model (HS) and is widely accepted by researchers [34,35]. The HSS is incorporated in PLAXIS 3D and is commonly used for deformation analysis in shield tunneling projects [36,37]. This constitutive model includes 13 parameters, and the values of the soil parameters are provided in Table 1. The lining was modeled using a shell structural element, taking into account an elastic modulus of 33.5 GPa, Poisson ratio of 0.2, thickness of 20 cm, and unit weight of 27 kN/m3.

3.2. Simulation Process

This study mainly focuses on the stability of the tunnel face. The practical shield tunneling process was not considered and was simulated using the “one-step tunneling” method, which has been verified by many researchers [42]. The following three phrases were adopted to investigate the active failure of the tunnel face:
(1)
Establish corresponding numerical model, apply boundary conditions, and generate initial ground stress;
(2)
Replace the original soil with HGR, freeze the “soil unit” inside the tunnel, activate the “shell unit” of the lining and apply support pressure on the tunnel face;
(3)
Gradually decrease the support pressure until a small increment dramatically increases the horizontal displacement of the tunnel face, at which point the support pressure is defined as the limit support pressure.

3.3. Numerical Model

To investigate the stability of the tunnel face, half of the model was created based on the symmetry between structure and load, as depicted in Figure 6. The shield tunneling was simulated in the Y-axis with a diameter of 6.6 m (D) and a depth of 6.6 m (C). The model was designed to be sufficiently large to eliminate any boundary effects, with dimensions of 30 m in the X-direction and Z-direction and 50 m in the Y-direction. The boundary conditions were specified as follows: the ground surface was free, the four vertical surfaces in the normal directions were fixed, and the base was fixed as well. Since the groundwater table was assumed to be located well below the tunnel invert, it was not taken into account in the analyses. Once the model was meshed, it consisted of 22,758 nonuniform elements and 34,654 nodes.

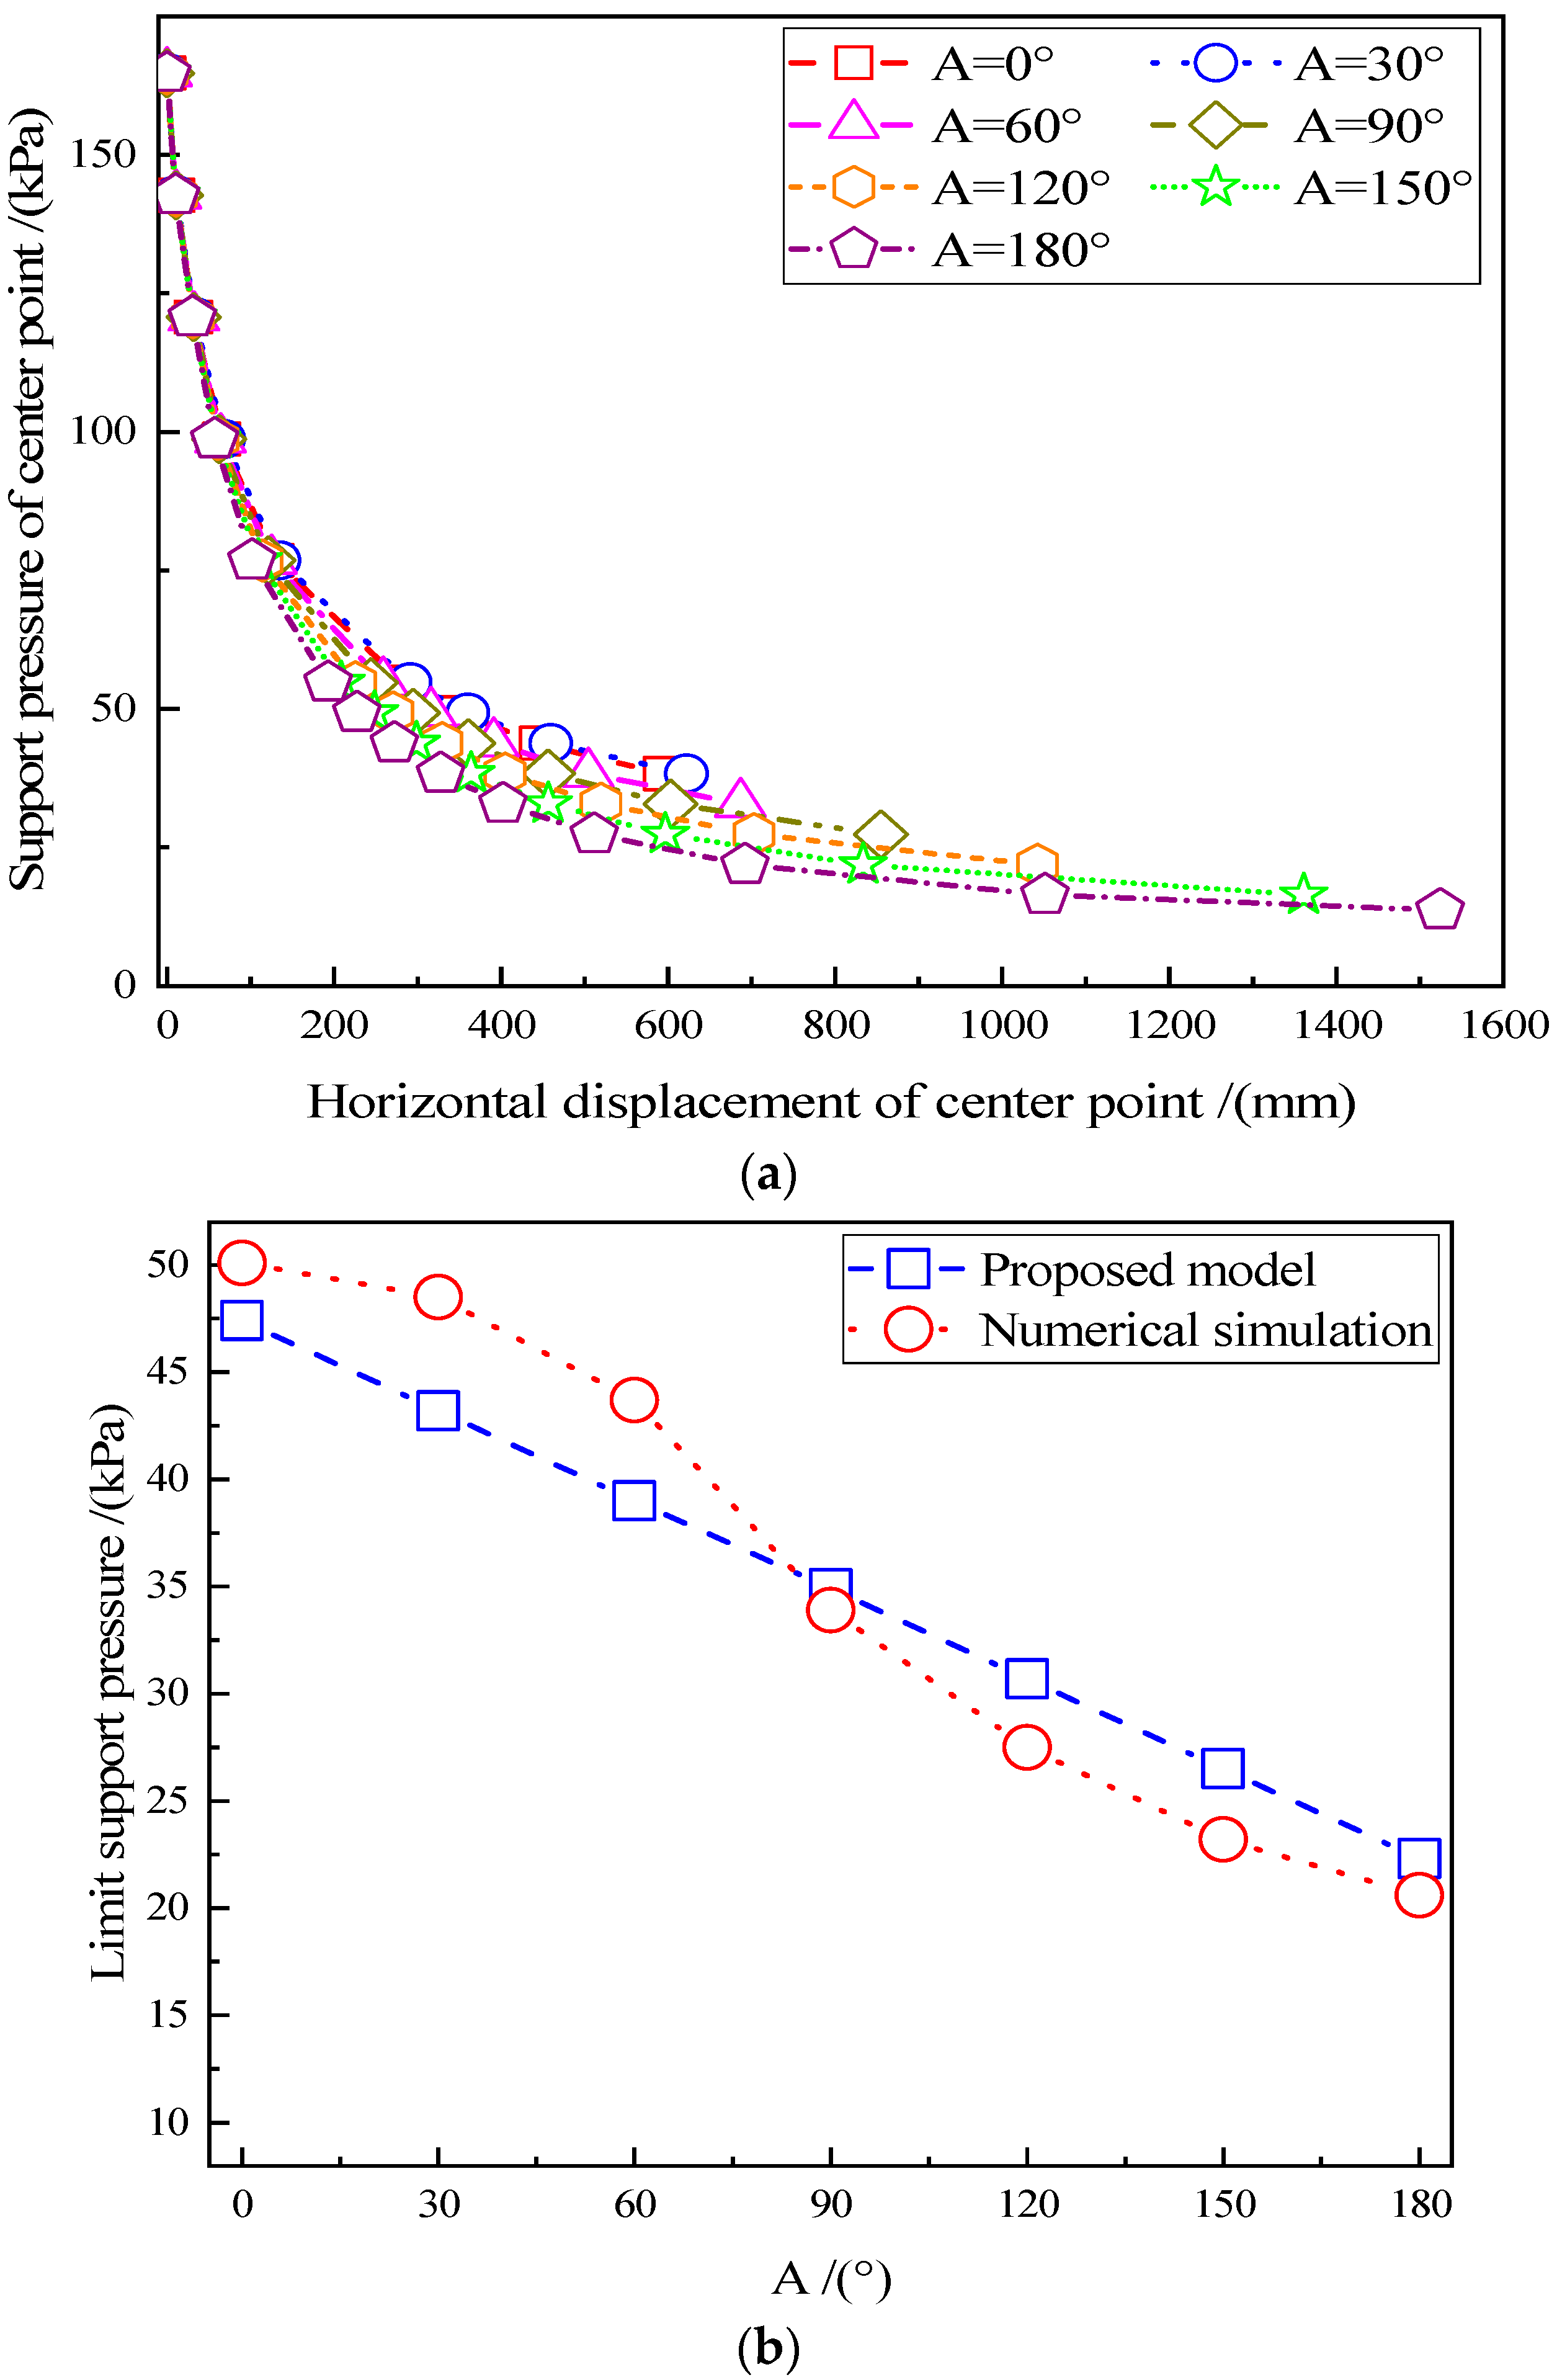
3.4. Limit Support Pressure

The numerical simulation was conducted based on the seven HGR ranges presented in Figure 1. Figure 7a depicts the relationship curve between the horizontal displacement and the support pressure of the tunnel face under different reinforcement ranges. The horizontal displacement of the tunnel face gradually increases as the support pressure decreases. Once the support pressure drops below the critical value, the horizontal displacement undergoes a significant increase, resulting in the instability of the tunnel face. Figure 7b presents a comparison between the numerical simulation and the proposed model. The trend in the limit support pressure calculated using these two methods is similar. As the value of A increases, the limit support pressure decreases. This outcome is chiefly attributed to the increase in the range of HGR as A increases, leading to an enhancement in the tunnel face displacement restriction ability, which subsequently reduces the limit support pressure required to maintain the stability of the tunnel face.
As shown in Table 2, seven cases with reinforced ground and A = 0°, 30°, 60°, 90°, 120°, 150°, and 180° were analyzed. In Table 2, Pa is the analytical results, while Pn represents the results of the numerical simulation. The “Difference” indicates the average difference between the analytical and numerical results. Generally, the “Differences” are at around 10%, which means that the predicted limit support pressures of the two methods are in good agreement.

3.5. Parameter Analysis

The effects of the ground and reinforcement parameters (stiffness k, thickness t, cohesion c, friction angle φ) on the limit support pressure were analyzed.

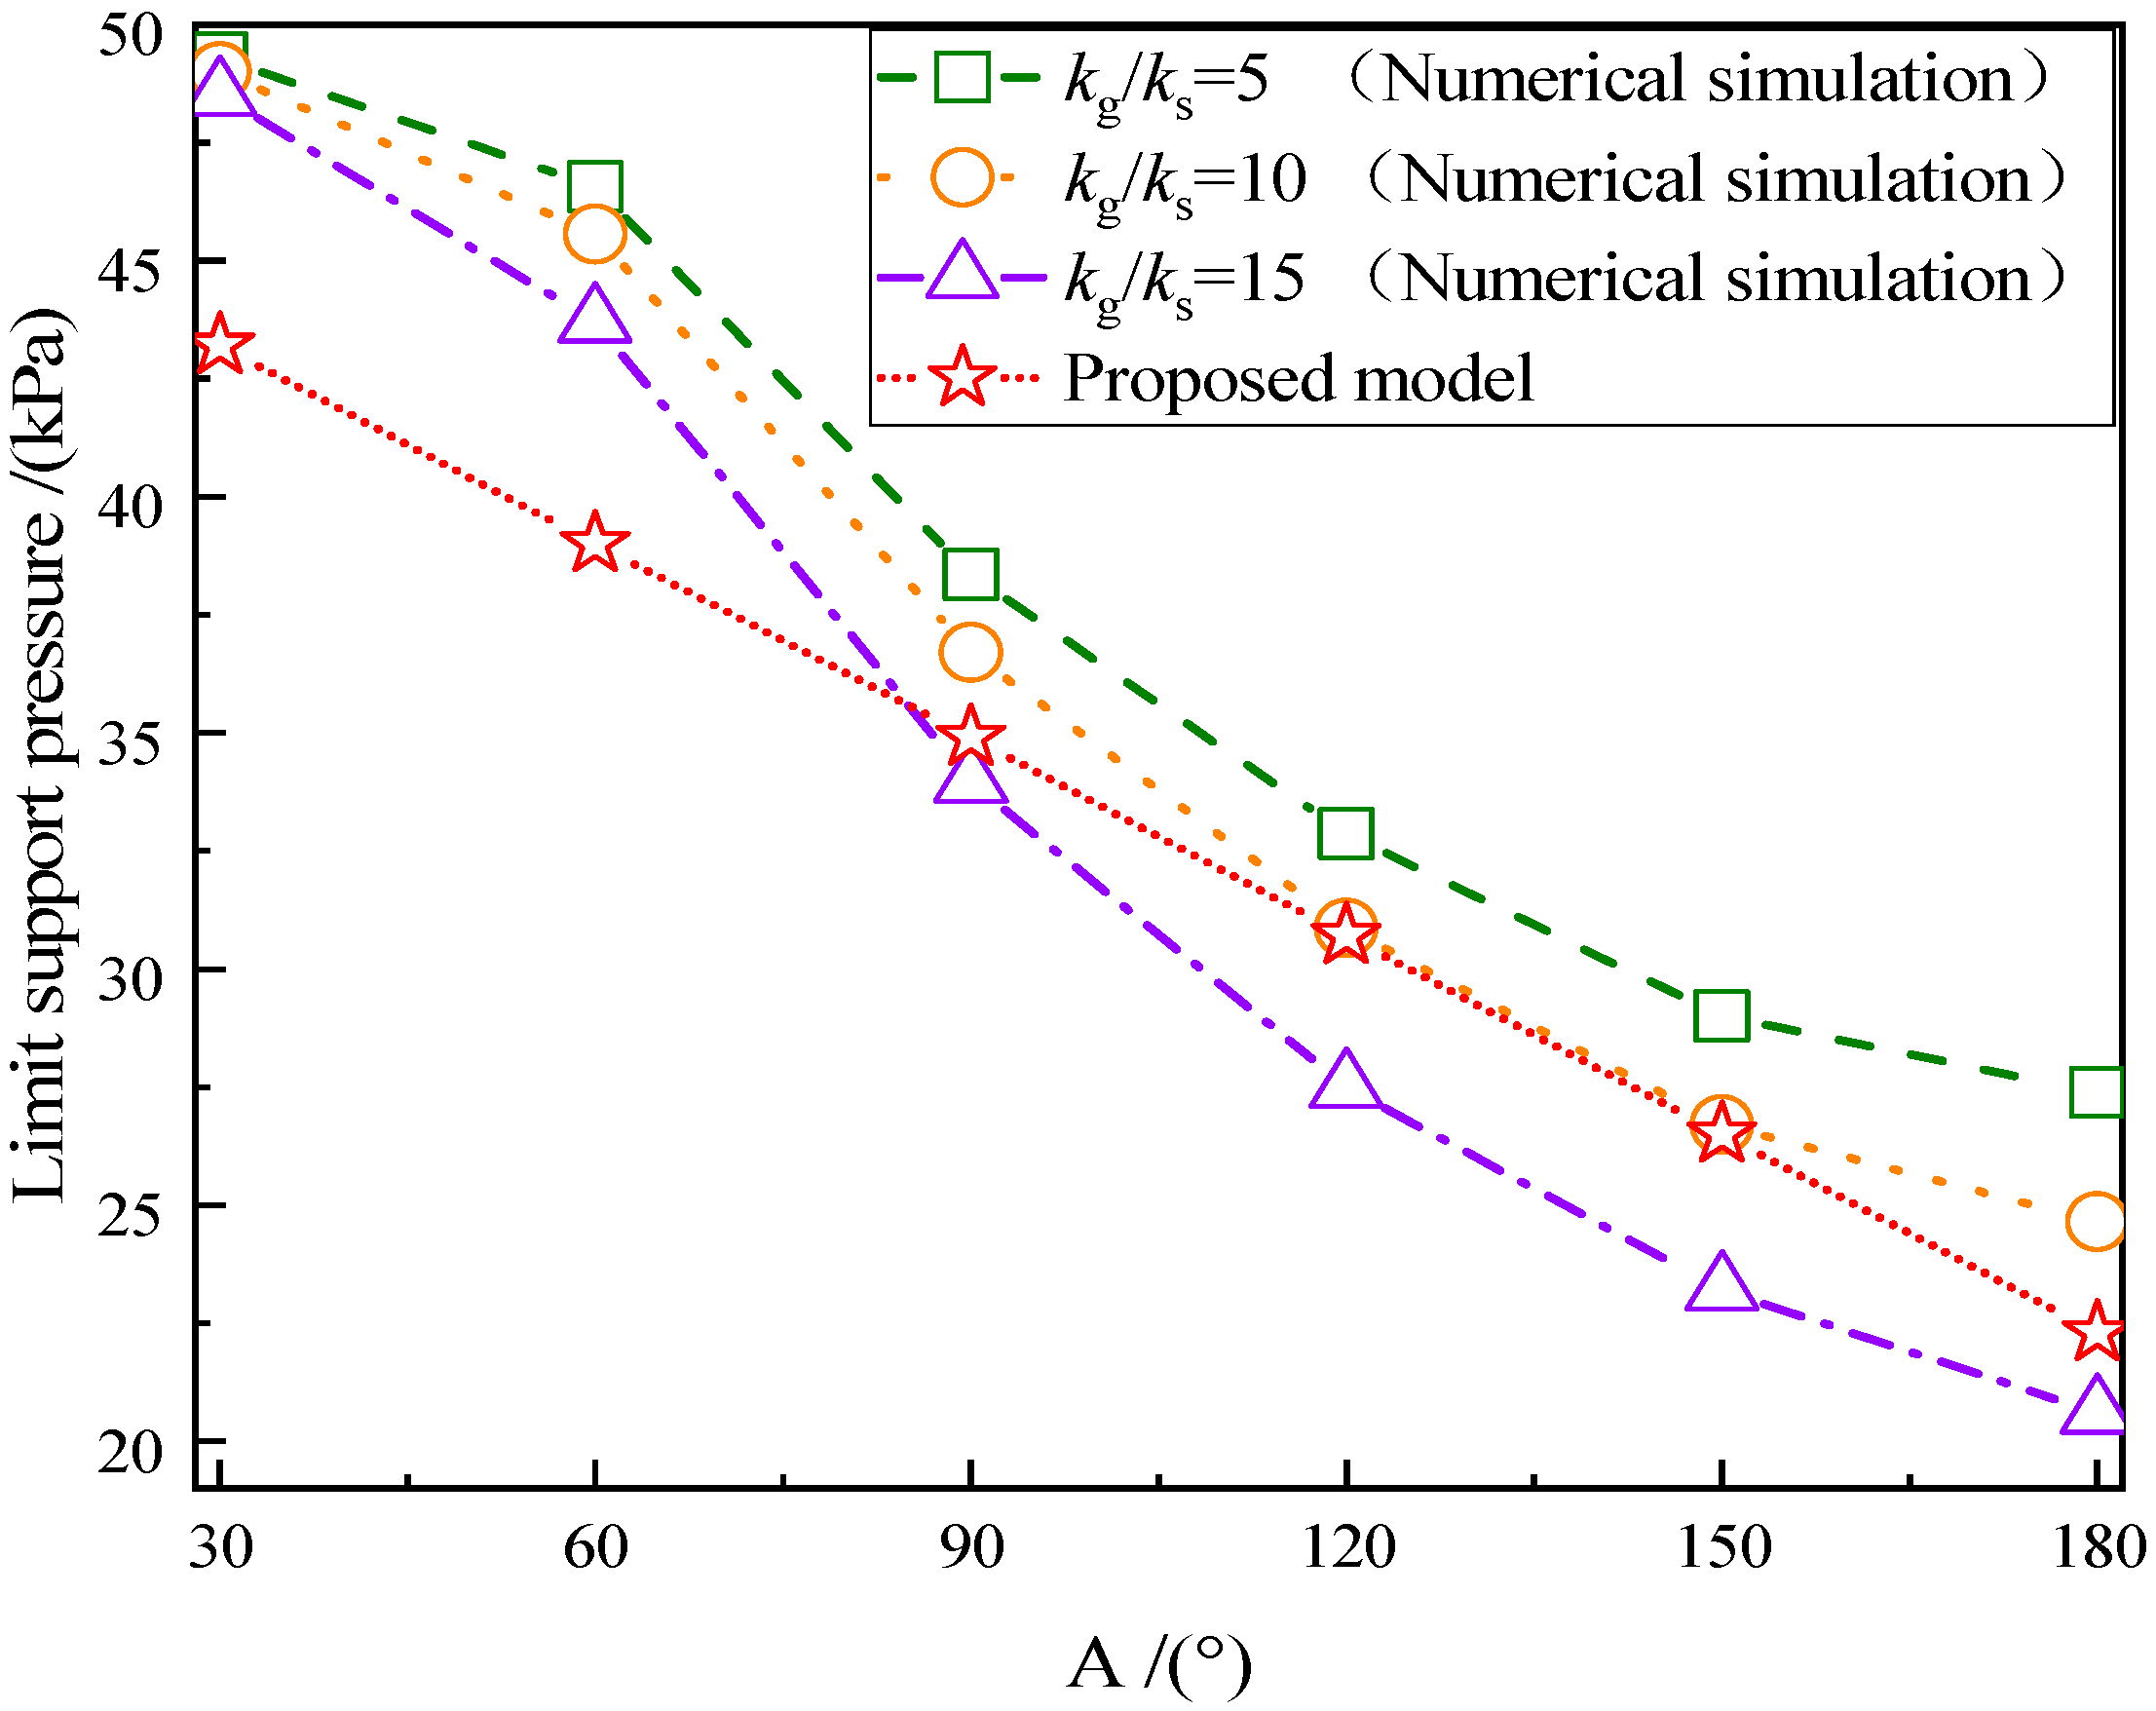
3.5.1. Effect of HGR Stiffness

The effect of changes in HGR stiffness on the limit support pressure with A (°) values ranging between 30° and 180° is shown in Figure 8; the effective cohesion and effective friction angle of clay and the HGR, as well as the burial depth of the tunnel, were kept constant. In addition, for the limit equilibrium model, the wedge was assumed to be a rigid body and the stiffness parameter was not included in the theoretical formula, which was found to be acceptable simplifications by many studies [26,27,32]. In Figure 8, kg is the stiffness of the HGR, and ks is the stiffness of clay. The three stiffness ratios predicted using a numerical simulation show similar trends in limit support pressure with increasing A. It was found that when A is small, the stiffness ratios have little influence on the limit support pressure of the tunnel face. The predicted results of the three stiffness ratios are 49.3 kPa, 49.0 kPa, and 48.5 kPa when A = 30°; with increasing A, the gap between the three stiffness ratios increases. When A = 180°, the limit support pressures predicted using the three stiffness ratios are 27.4 kPa, 24.7 kPa, and 20.6 kPa, respectively. Furthermore, as the HRG in the proposed model is rigid, increasing the stiffness ratio makes the predicted results of the numerical simulation more relevant to the proposed model.

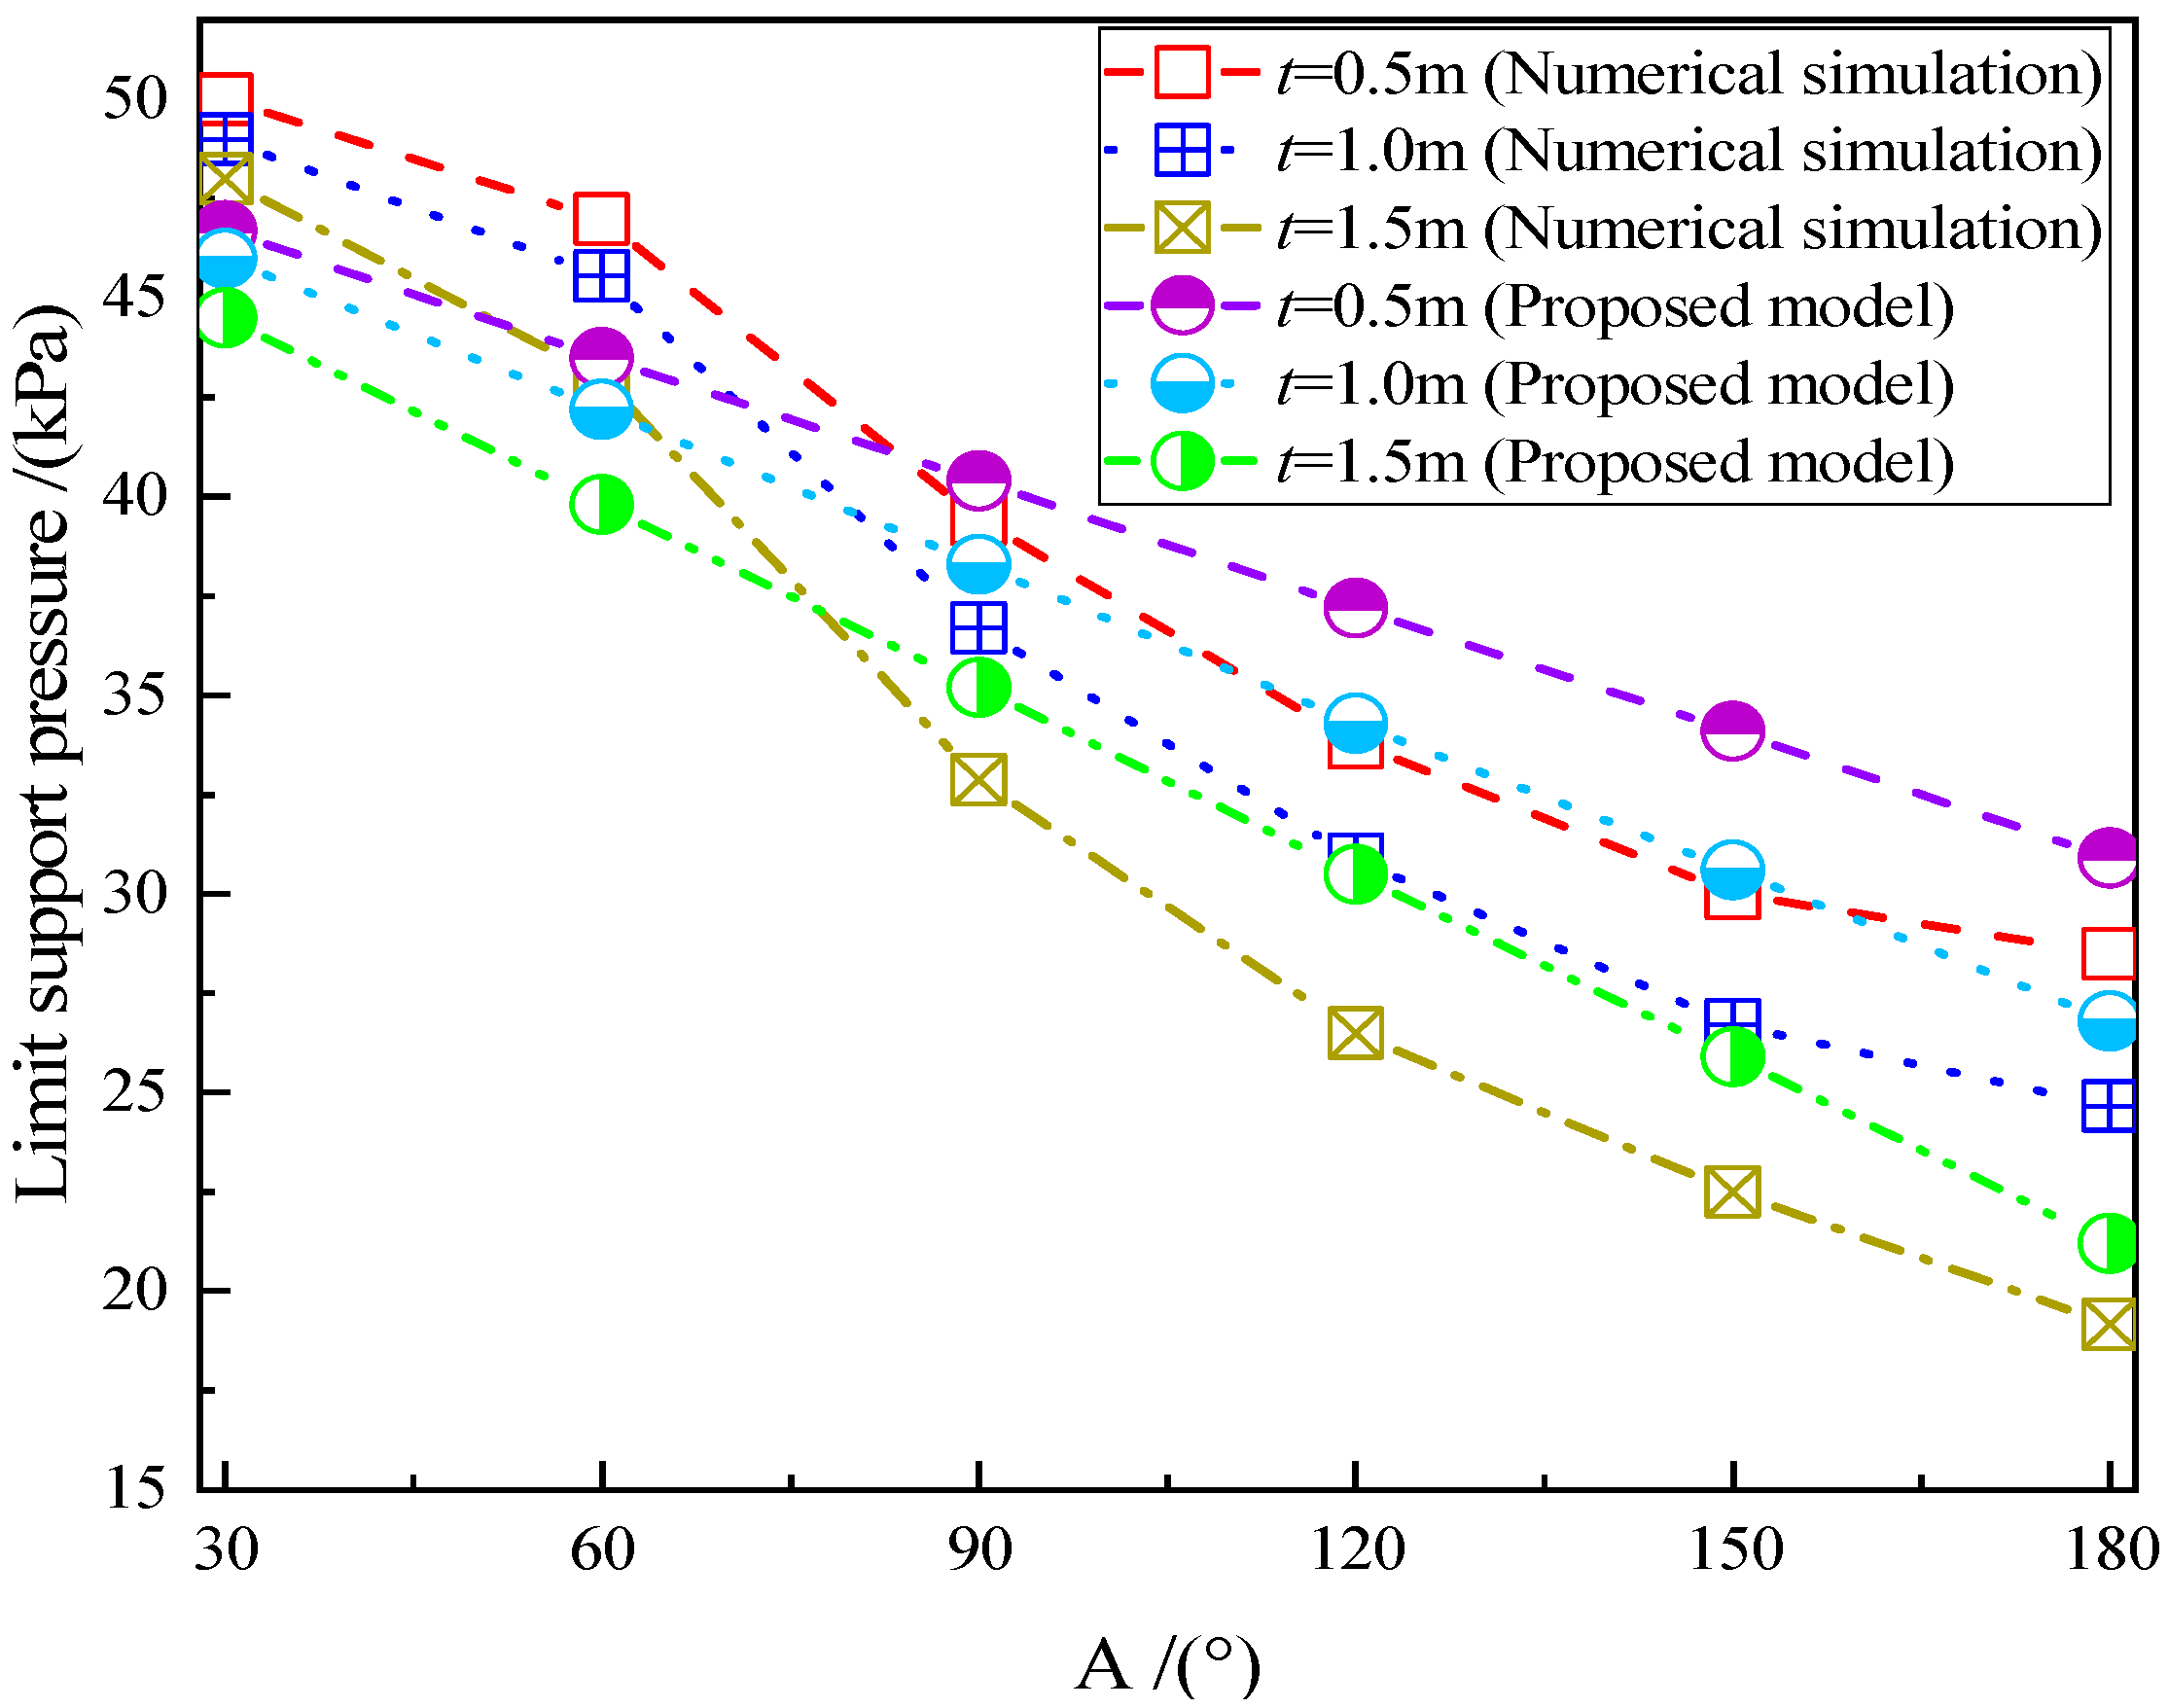
3.5.2. Effect of HGR Thickness

The effect of changes in HGR thickness on the limit support pressure with A (°) values ranging between 30° and 180° is shown in Figure 9; the effective cohesion and effective friction angle of clay and the HGR, as well as the burial depth of the tunnel, were kept constant. The three thicknesses predicted using the numerical simulation show that with increasing A, the variation in the limit support pressure first decreases slowly, then decreases rapidly, and finally decreases moderately. Additionally, the limit support pressure predicted by the proposed model under the three thicknesses decreases linearly with A. Furthermore, it is obvious that when A is small, the thickness of the HGR has little influence on the limit support pressure of the tunnel face, and this degree of influence increases with A, which is consistent with the observation in Figure 8. This is mainly because when A is small, the gaps in reinforcement volume of the HGR across different thicknesses are small, and the ability to maintain the stability of the tunnel face is weak, so the limit support pressure changes little.

3.5.3. Effect of Effective Cohesion

The effect of the effective cohesion of clay on the limit support pressure with A (°) values ranging between 30° and 180° is shown in Figure 10. Compared with Figure 8 and Figure 9, the influence of cohesion on the limit support pressure of the tunnel face is greater than that of the stiffness ratio and thickness of HGR. Essentially, the limit support pressure predicted using the two methods decreases linearly with increasing A. When effective cohesion increases from 5 kPa to 15 kPa, the predicted results of the proposed models are 64.6 kPa, 46 kPa, and 20.6 kPa at A = 30°, and 36.6 kPa, 26.8 kPa, and 10.5 kPa at A = 180°. Additionally, the absolute values of the slopes of the six lines decrease from 0.187 to 0.067 as the effective cohesion increases from 5 kPa to 15 kPa, indicating that the limit support pressure is more sensitive to variations in A with low effective cohesion compared to conditions of high effective cohesion.

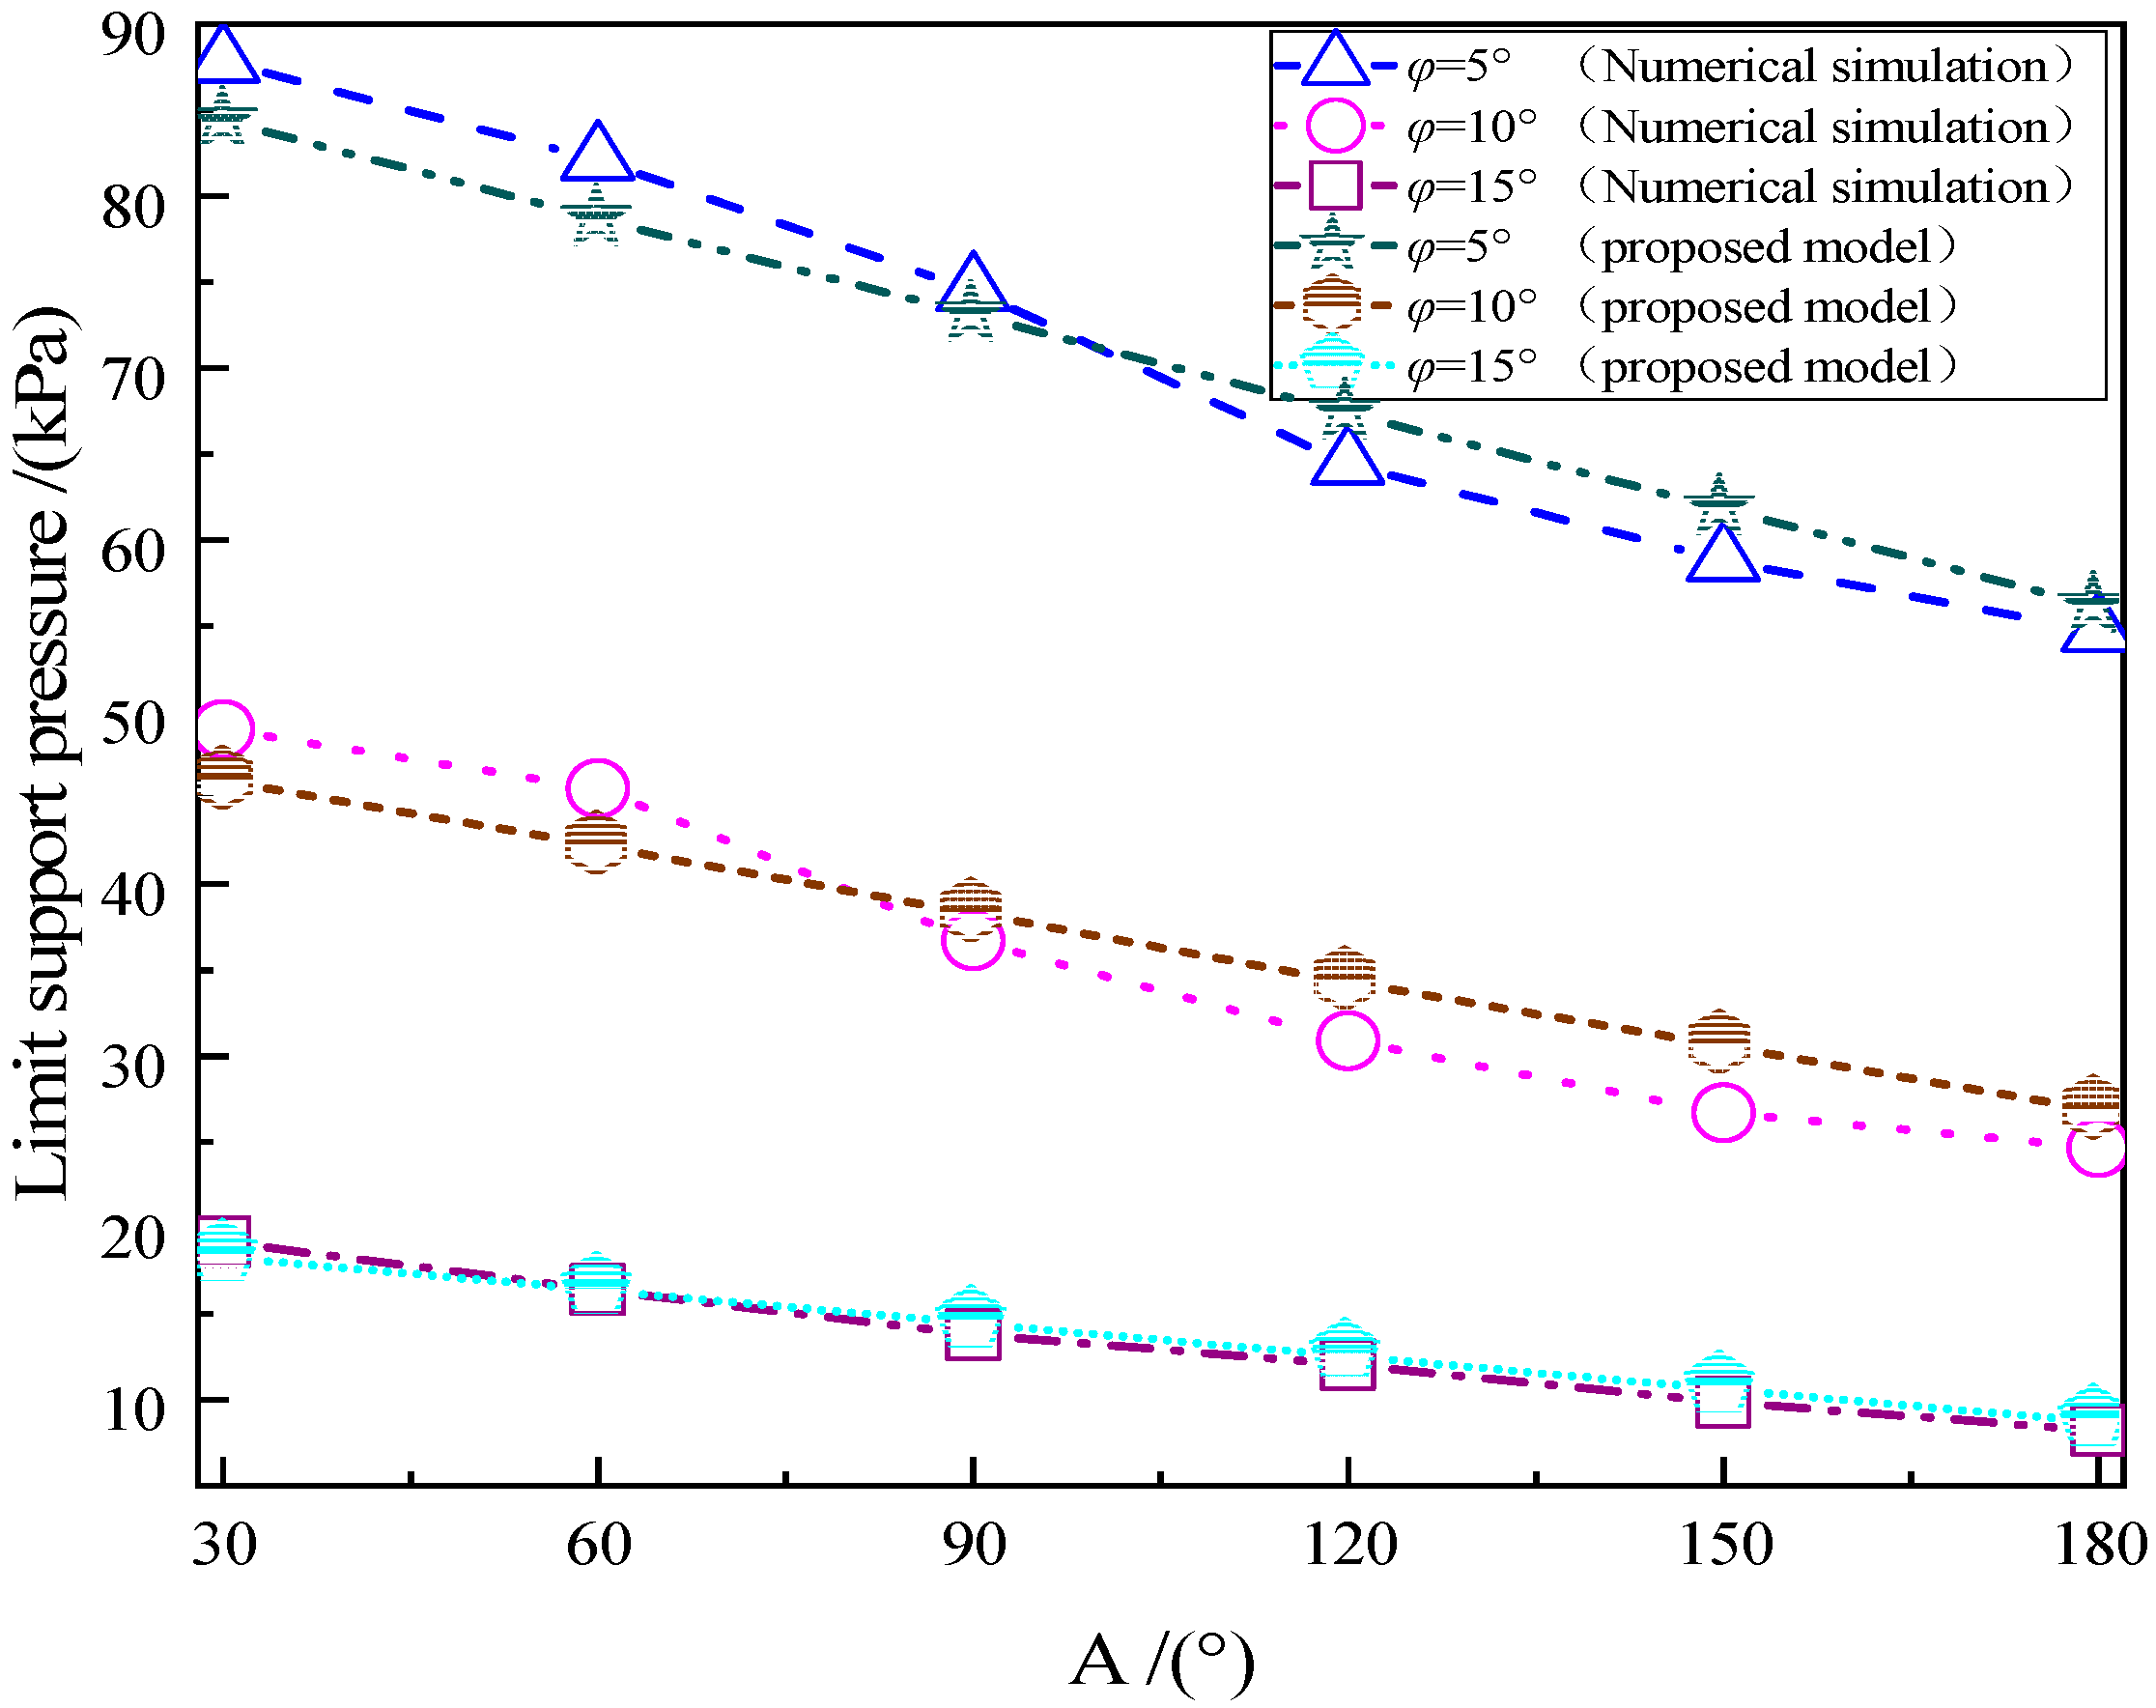
3.5.4. Effect of Effective Friction Angle

The effect of the effective friction angle of clay on the limit support pressure with A (°) values ranging between 30° and 180° is shown in Figure 11. Essentially, the limit support pressure of the tunnel face predicted using a numerical simulation (or the proposed model) decreases linearly with increasing A. Meanwhile, the absolute values of the line slopes decrease as the effective friction angle increases. When the friction angle increases from 5° to 15°, the predicted results of the proposed models are 84.4 kPa, 46 kPa, and 18.3 kPa at A = 30°, and 56.1 kPa, 26.8 kPa, and 8.7 kPa at A = 180°, indicating that the limit support pressure is more sensitive to variations in A with low effective friction angle compared to conditions of high effective friction angle.

3.5.5. Parameter Comparison

Improvements in limit support pressure of the tunnel face in relation to different parameters are shown in Table 3. The parameter IR indicates the improvement rate in the limit support pressure as A increases from 30° to 180°. For example, when kg/ks = 5, its IR = |27.4 − 49.3|/(180 − 30)% = 14.6%. It can be seen that, on one hand, with increases in stiffness ratio and thickness, the IR increases accordingly; on the other hand, the IR decreases with increasing cohesion and friction angle. This implies that enhancing the HGR will improve its ability to maintain the stability of the tunnel face. Furthermore, the HGR more effectively decreases the limit support pressure under low-cohesion (or friction angle) conditions compared to high-cohesion (or friction angle) conditions. As shown in Table 3, the CR represents the rate of variation in IR as the parameter increases, which indicates that increases in the friction angle and cohesion of soil layers exceedingly improve the ability of a tunnel face to maintain its stability.

4. Conclusions

This paper aimed to investigate the stability of a tunnel face, which was reinforced using horizontal pre-grouting, through numerical simulation and theoretical analysis. The study focused on identifying the effects of various factors on the limit support pressure. The main results of the research are summarized as follows.
(1)
The trend in the limit support pressure predicted by the numerical simulation and proposed model is similar. As A increases, the limit support pressure generally decreases. However, the differences are consistently approximately 10%.
(2)
The limit support pressure is linearly related to cohesion and friction angle. Moreover, changes in these two factors influence the limit support pressure more than changes in the stiffness ratio and thickness of HGR.
(3)
HGR is more effective in reducing the limit support pressure under low-cohesion (or friction angle) conditions than under high-cohesion (or friction angle) conditions. Increasing the friction angle and cohesion of soil layers significantly improves the ability of the tunnel face to maintain stability.

Author Contributions

Y.R.: Conceptualization, Methodology, Writing—original draft, Data curation. J.Z.: Funding acquisition, Conceptualization, Supervision. D.C.: Funding acquisition, Conceptualization, Writing—Review and Editing, Supervision. Y.S.: Writing—Review and Editing. L.K.: Formal analysis& Editing. All authors have read and agreed to the published version of the manuscript.

Funding

This research was supported by the following grants: the National Natural Science Foundation of China (Grant No. 52004286), the Fundamental Research Funds for the Central Universities (Grant No. 2022XJNY02), the R&D Program of China Construction Second Engineering Bureau LTD. (2020ZX140001), and the R&D Program of China State Construction Engineering Corporation LTD. (CSCEC-2021-Z-25), all of which were gratefully acknowledged.

Data Availability Statement

All data generated or analyzed during this study have been included in this article.

Acknowledgments

We would like to thank the anonymous reviewers for their valuable comments and suggestions that lead to a substantially improved manuscript.

Conflicts of Interest

The authors declare no conflict of interest.

References

  1. Sterpi, D.; Cividini, A. A Physical and Numerical Investigation on the Stability of Shallow Tunnels in Strain Softening Media. Rock Mech. Rock Eng. 2004, 37, 277–298. [Google Scholar] [CrossRef]
  2. Kirsch, A. Experimental Investigation of the Face Stability of Shallow Tunnels in Sand. Acta Geotech. 2010, 5, 43–62. [Google Scholar] [CrossRef] [Green Version]
  3. Chen, R.; Li, J.; Kong, L.; Tang, L. Experimental Study on Face Instability of Shield Tunnel in Sand. Tunn. Undergr. Space Technol. 2013, 33, 12–21. [Google Scholar] [CrossRef]
  4. Lu, X.; Zhou, Y.; Huang, M.; Zeng, S. Experimental Study of the Face Stability of Shield Tunnel in Sands under Seepage Condition. Tunn. Undergr. Space Technol. 2018, 74, 195–205. [Google Scholar] [CrossRef]
  5. Chambon, P.; Corté, J. Shallow Tunnels in Cohesionless Soil: Stability of Tunnel Face. J. Geotech. Eng. 1994, 120, 1148–1165. [Google Scholar] [CrossRef]
  6. Idinger, G.; Aklik, P.; Wu, W.; Borja, R.I. Centrifuge Model Test on the Face Stability of Shallow Tunnel. Acta Geotech. 2011, 6, 105–117. [Google Scholar] [CrossRef] [Green Version]
  7. Chen, R.; Yin, X.; Tang, L.; Chen, Y. Centrifugal Model Tests on Face Failure of Earth Pressure Balance Shield Induced by Steady State Seepage in Saturated Sandy Silt Ground. Tunn. Undergr. Space Technol. 2018, 81, 315–325. [Google Scholar] [CrossRef]
  8. Wong, K.S.; Ng, C.W.W.; Chen, Y.M.; Bian, X.C. Centrifuge and Numerical Investigation of Passive Failure of Tunnel Face in Sand. Tunn. Undergr. Space Technol. 2012, 28, 297–303. [Google Scholar] [CrossRef]
  9. Paternesi, A.; Schweiger, H.F.; Scarpelli, G. Numerical Analyses of Stability and Deformation Behavior of Reinforced and Unreinforced Tunnel Faces. Comput. Geotech. 2017, 88, 256–266. [Google Scholar] [CrossRef]
  10. Han, K.; Wang, L.; Su, D.; Hong, C.; Chen, X.; Lin, X.-T. An Analytical Model for Face Stability of Tunnels Traversing the Fault Fracture Zone with High Hydraulic Pressure. Comput. Geotech. 2021, 140, 104467. [Google Scholar] [CrossRef]
  11. Zhang, X.; Wang, M.; Lyu, C. Experimental and numerical study on tunnel faces reinforced by horizontal bolts in sandy ground. Tunn. Undergr. Space Technol. 2022, 123, 104412. [Google Scholar] [CrossRef]
  12. Man, J.; Huang, H.; Ai, Z.; Chen, J.; Wang, F. Stability of complex rock tunnel face under seepage flow conditions using a novel equivalent analytical model. Int. J. Rock Mech. Min. Sci. 2023, 170, 105427. [Google Scholar] [CrossRef]
  13. Wang, J.; Lin, G.; Xu, G.; Wei, Y.; Li, S.; Tang, X.; He, C. Face stability of EPB shield tunnels in multilayered ground with soft sand lying on hard rock considering dynamic excavation process: A DEM study. Tunn. Undergr. Space Technol. 2022, 120, 104268. [Google Scholar] [CrossRef]
  14. Fu, Y.; Zeng, D.; Xiong, H.; Li, X.; Chen, Y. Seepage effect on failure mechanisms of the underwater tunnel face via CFD-DEM coupling. Comput. Geotech. 2022, 146, 104591. [Google Scholar] [CrossRef]
  15. Yin, Z.-Y.; Wang, P.; Zhang, F. Effect of Particle Shape on the Progressive Failure of Shield Tunnel Face in Granular Soils by Coupled FDM-DEM Method. Tunn. Undergr. Space Technol. 2020, 100, 103394. [Google Scholar] [CrossRef]
  16. Horn, N. Horizontal earth pressure on the vertical surfaces of the tunnel tubes. In Proceedings of the National Conference of the Hungarian Civil Engineering Industry, Budapest, Hungary, 28 July 1961; pp. 7–16. [Google Scholar]
  17. Anagnostou, S. The Contribution of Horizontal Arching to Tunnel Face Stability. Geotechnik 2012, 35, 34–44. [Google Scholar] [CrossRef]
  18. Liu, X.; Wang, F.; Fang, H.; Yuan, D. Dual-Failure-Mechanism Model for Face Stability Analysis of Shield Tunneling in Sands. Tunn. Undergr. Space Technol. 2019, 85, 196–208. [Google Scholar] [CrossRef]
  19. Dormieux, L. Upper and Lower Bound Solutions for the Face Stability of Shallow Circular Tunnels in Frictional m. Géotechnique 1990, 40, 581–606. [Google Scholar]
  20. Mollon, G.; Dias, D.; Soubra, A.H. Probabilistic Analysis and Design of Circular Tunnels against Face Stability. Int. J. Geomech. 2009, 9, 237–249. [Google Scholar] [CrossRef] [Green Version]
  21. Mollon, G.; Dias, D.; Soubra, A. Face Stability Analysis of Circular Tunnels Driven by a Pressurized Shield. J. Geotech. Geoenviron. Eng. 2010, 136, 215–229. [Google Scholar] [CrossRef] [Green Version]
  22. Mollon, G.; Dias, D.; Soubra, A.H. Rotational Failure Mechanisms for the Face Stability Analysis of Tunnels Driven by a Pressurized Shield. Int. J. Numer. Anal. Methods Geomech. 2011, 35, 1363–1388. [Google Scholar] [CrossRef] [Green Version]
  23. Jancsecz, S.; Steiner, W. Face Support for a Large Mix-Shield in Heterogeneous Ground Conditions. In Proceedings of the Tunnelling’94, Chapman and Hall, London, UK, 5–7 July 1994; pp. 531–550. [Google Scholar]
  24. Krause, T. Schildvortrieb Mit Fluessigkeits-Und Erdgestuetzter Ortsbrust. Ph.D. Thesis, Technische Universitaet Braunschweig, Braunschweig, Germany, 1987. [Google Scholar]
  25. Chen, R.P.; Tang, L.J.; Yin, X.S.; Chen, Y.M.; Bian, X.C. An Improved 3D Wedge-Prism Model for the Face Stability Analysis of the Shield Tunnel in Cohesionless Soils. Acta Geotech. 2015, 10, 683–692. [Google Scholar] [CrossRef]
  26. Zhang, X.; Wang, M.; Wang, Z.; Li, J.; Liu, D. A Limit Equilibrium Model for the Reinforced Face Stability Analysis of a Shallow Tunnel in Cohesive-Frictional Soils. Tunn. Undergr. Space Technol. 2020, 105, 103562. [Google Scholar] [CrossRef]
  27. Huang, M.; Li, Y.; Shi, Z.; Lu, X. Face Stability Analysis of Shallow Shield Tunneling in Layered Ground under Seepage Flow. Tunn. Undergr. Space Technol. 2022, 119, 104201. [Google Scholar] [CrossRef]
  28. Coulter, S.; Martin, C.D. Effect of Jet-Grouting on Surface Settlements above the Aeschertunnel, Switzerland. Tunn. Undergr. Space Technol. 2006, 21, 542–553. [Google Scholar] [CrossRef]
  29. Su, D.; Song, Q.; Lin, X.; Li, Q.; Chen, X. Limit Equilibrium Models for Active Failures of Large-Diameter Shield Tunnel Faces in Soft Clay Reinforced with Soil-Cement Walls. Comput. Geotech. 2023, 153, 105104. [Google Scholar] [CrossRef]
  30. Takano, D.; Otani, J.; Nagatani, H.; Mukunoki, T. Application of X-Ray CT on Boundary Value Problems in Geotechnical Engineering: Research on Tunnel Face Failure. In Proceedings of the ASCE, Clearwater Beach, FL, USA, 17–20 June 2012; pp. 1–6. [Google Scholar]
  31. Alagha, A.S.N.; Chapman, D.N. Numerical Modelling of Tunnel Face Stability in Homogeneous and Layered Soft Ground. Tunn. Undergr. Space Technol. 2019, 94, 103096. [Google Scholar] [CrossRef]
  32. Yu, L.; Zhang, D.; Fang, Q.; Cao, L.; Zhang, Y.; Xu, T. Face Stability of Shallow Tunnelling in Sandy Soil Considering Unsupported Length. Tunn. Undergr. Space Technol. 2020, 102, 103445. [Google Scholar] [CrossRef]
  33. Perazzelli, P.; Leone, T.; Anagnostou, G. Tunnel Face Stability under Seepage Flow Conditions. Tunn. Undergr. Space Technol. 2014, 43, 459–469. [Google Scholar] [CrossRef]
  34. Jallow, A.; Ou, C.-Y.; Lim, A. Three-Dimensional Numerical Study of Long-Term Settlement Induced in Shield Tunneling. Tunn. Undergr. Space Technol. 2019, 88, 221–236. [Google Scholar] [CrossRef]
  35. Zheng, G.; Yang, X.; Zhou, H.; Du, Y.; Sun, J.; Yu, X. A Simplified Prediction Method for Evaluating Tunnel Displacement Induced by Laterally Adjacent Excavations. Comput. Geotech. 2018, 95, 119–128. [Google Scholar] [CrossRef]
  36. Soubra, A.-H.; Dias, D.; Emeriault, F.; Kastner, R. Three-Dimensional Face Stability Analysis of Circular Tunnels by a Kinematical Approach. In Proceedings of the ASCE Geocongress, New Orleans, LA, USA, 9–12 March 2008; pp. 894–901. [Google Scholar]
  37. Mu, L.; Huang, M. Small Strain Based Method for Predicting Three-Dimensional Soil Displacements Induced by Braced Excavation. Tunn. Undergr. Space Technol. 2016, 52, 12–22. [Google Scholar] [CrossRef]
  38. Bolton, M.D. The Strength and Dilatancy of Sands. Geotechnique 1987, 36, 219–226. [Google Scholar] [CrossRef]
  39. Gu, X.; Hu, J.; Huang, M. K-0 of Granular Soils: A Particulate Approach. Granul. Matter 2015, 17, 703–715. [Google Scholar] [CrossRef]
  40. Yang, J.; Gu, X.Q. Shear Stiffness of Granular Material at Small Strains: Does It Depend on Grain Size? Geotechnique 2013, 63, 165–179. [Google Scholar] [CrossRef] [Green Version]
  41. Fu, Y.; He, S.; Zhang, S.; Yang, Y. Parameter Analysis on Hardening Soil Model of Soft Soil for Foundation Pits Based on Shear Rates in Shenzhen Bay, China. Adv. Mater. Sci. Eng. 2020, 2020, 7810918. [Google Scholar] [CrossRef] [Green Version]
  42. Zhang, C.; Han, K.; Zhang, D. Face Stability Analysis of Shallow Circular Tunnels in Cohesive-Frictional Soils. Tunn. Undergr. Space Technol. 2015, 50, 345–357. [Google Scholar] [CrossRef]
Figure 1. Horizontal grouting reinforcement (a) A = 0° (b) A = 30° (c) A = 60° (d) A = 90° (e) A = 120° (f) A = 150° (g) A = 180°.
Processes 11 02044 g001
Figure 2. Limit equilibrium model for HGR.
Processes 11 02044 g002
Figure 3. Longitudinal section of log-spiral prism model.
Processes 11 02044 g003
Figure 4. Cross section of log-spiral prism model (a) Calculation of vertical force (b) Force analysis of the HGR.
Processes 11 02044 g004
Figure 5. Force analysis of the ith soil slice.
Processes 11 02044 g005
Figure 6. Three-dimensional model for exploring stability of tunnel face.
Processes 11 02044 g006
Figure 7. Determination of the limit support pressure (a) Relationship between the support pressure and the horizontal displacement (b) Relationship between the limit support pressure and A (°).
Processes 11 02044 g007
Figure 8. Limit support pressure versus HGR stiffness (t = 1 m).
Processes 11 02044 g008
Figure 9. Limit support pressure versus HGR thickness (kg/ks = 10).
Processes 11 02044 g009
Figure 10. Limit support pressure versus effective cohesion (t = 1 m, kg/ks = 10).
Processes 11 02044 g010
Figure 11. Limit support pressure versus friction angle (t = 1 m, kg/ks = 10).
Processes 11 02044 g011
Table 1. Main parameters of the HSS model.
ParameterMethodValue
ClayHGR
Effective cohesion, c′ (kPa)Triaxial consolidated and drained test10.1250
Effective friction angle, φ′ (°)Triaxial consolidated and drained test10.335
Dilation angle, Ψ (°)Ψ = 0 when φ′ < 30° [38]00
Lateral pressure coefficient, K0K0 = 1 − sin φ′ [39]0.830.43
Failure ratio, RfRf = 0.50 when e > 1.5, Rf =−0.9(e − 1.5) + 0.5 when 1.0 < e ≤ 1.5, [40]0.90.9
Secant stiffness in triaxial test, E50ref (MPa)E50ref = (0.7~1.0)Es1−2 [41]1.5022.5
Tangent stiffness, Eoedref (MPa)Eoedref = 0.9Es1−2 [41]1.5022.5
Reference shear modulus, G0ref (MPa)G0ref = (1.5~2.5)Eurref [40]13.0195
Reference stiffness stress, Pref (kPa)Plaxis manual100100
Poisson’s ratio for unloading–reloading, νurPlaxis manual0.20.2
Unloading/reloading stiffness, Eurref (MPa)Eurref = (3~8)Eoedref [41]6.090
Power for dependency of stiffness, mPlaxis manual0.50.1
Shear strain corresponding to an initial shear modulus of 70%, γ0.7γ0.7 = (1~4) × 10−4 [40]1 × 10−44 × 10−4
Table 2. Differences between the analytical and numerical results.
A (°)0306090120150180
Pa (kPa)47.443.239.034.930.726.522.3
Pn (kPa)50.148.543.733.927.523.220.6
Difference (%)5.511.411.42.911.013.37.9
Note: Pa: analytical result; Pn: numerical result; Difference = |Pa − Pn|/[0.5(Pa + Pn)].
Table 3. Comparison of different parameters.
ParametersStiffness Ration (kg/ks)Thickness (t)Cohesion (c)Friction Angle (φ)
510150.5 m1.0 m1.5 m5 kPa10 kPa15 kPa10°15°
A = 30° (kPa)49.349.048.550.049.048.063.049.021.987.849.019.2
A = 180° (kPa)27.424.720.628.4824.6519.1738.024.79.954.724.78.2
IR (%)14.616.218.614.316.219.216.716.28.022.116.27.3
CR (%)|18.6% − 14.6%| = 4|19.2% − 14.3%| = 4.9|8.0% − 16.7%| = 8.7|7.3% − 22.1%| = 14.8
Disclaimer/Publisher’s Note: The statements, opinions and data contained in all publications are solely those of the individual author(s) and contributor(s) and not of MDPI and/or the editor(s). MDPI and/or the editor(s) disclaim responsibility for any injury to people or property resulting from any ideas, methods, instructions or products referred to in the content.

