Abstract
The mononuclear ruthenium 1-Cl and dinuclear ruthenium 2-Cl complexes undergo a photo-induced ligand exchange in water, affording the corresponding 1-H2O and 2-H2O complexes. The use of indium tin oxide nanoparticles (nanoITOs) to explore the photo-electrochemistry of the in situ-generated 1-H2O and 2-H2O in solution revealed greater photocurrents produced by these two complexes when compared with an experiment using a buffer only. Interestingly, the high photocurrent shown by the dinuclear complex 2-H2O was accompanied by the deposition of its higher oxidation state (H2O)RuII–RuIII(OH), as evidenced with cyclic voltammetry, SEM and XPS. The IPCE and spectro-electrochemistry studies supported by TD-DFT calculations revealed the visible light harvesting ability of 1-H2O and 2-H2O in solution and the subsequent electron injection into the conduction band of the nanoITOs, enhanced in 2-H2O via a plausible chelating effect.
1. Introduction
The photo-electrochemical (PEC) conversion of water to hydrogen fuel has attracted much interest because of its potential to realize sustainable energy devices that can eventually replace fossil fuels [1,2,3]. However, electrocatalytic water splitting driven by photon energy has yet to achieve efficiency and durability levels suitable for practical application [4,5,6,7,8,9,10]. Perhaps the challenging aspect in this regard is that the water oxidation half reaction (2H2O → O2 + 4H+ + 4e−) is a difficult process that requires efficient water oxidation catalysts. Despite its energy-demanding nature, the 1.23 V thermodynamic requirement for water oxidation can be driven by light using semiconductors with appropriate band gaps [4], although the main challenge is that most metal oxide semiconductors do not catalyze the water oxidation reaction efficiently. Considerable efforts to improve the efficiency of low-cost semiconductors, such as TiO2, BiVO4 and Fe2O3, have recently been undertaken through many different techniques, including heterojunction, band alignment [11,12,13,14,15,16,17,18] and the incorporation of cocatalysts [19,20,21,22,23,24,25,26].
The integration of molecular materials with catalytic and photosensitizing functions is particularly attractive, owing to the easy modification of these materials via synthesis to achieve desired properties, such as a light-harvesting capability up to the near-infrared region [27], properties that are difficult to achieve with semiconductor-only systems. The facile absorption of molecular materials onto the surface of metal oxide semiconductors also allows for the detailed identification of the photophysical properties and energetic factors associated with the charge transfer processes [28,29,30,31], which drive the oxidation of chemical species on the photoanode surface [27,32,33]. Our group recently identified that the performance of TiO2-based dye-sensitized photo-electrochemical (DSPEC) devices relies on many factors, such as the ground- and excited-state energies of the photosensitizers, hole mobility, reorganization energy and hydrophobicity [34]. We observed the crucial role of the hole-hopping energetics of the photosensitizer molecules on a TiO2 surface that was proven experimentally [34] and through the use of a theoretical calculation [35], which also proved to suppress electron–hole recombination in a TiO2-coated BiVO4 system [36].
Despite the advantage of the surface binding of photosensitizer or catalyst molecules through anchoring groups such as phosphonic and carboxylic acids for facilitating an effective charge transfer [37,38], this is often hindered by the fact that the molecules can easily detach from the metal oxide surface in aqueous environments under prolonged light irradiation [38], although we recently found that this can be minimized through a “hydrophobicity” approach, where the ruthenium photosensitizer molecule was structurally modified with a long alkyl chain [34,39].
Although a study of the photo-driven hole and electron transfer using surface-bound ruthenium complexes on indium tin oxide nanoparticles (nanoITOs) has been published [40,41,42,43], the use of nanoITOs for photo-driven water splitting research has not been widely explored, despite having a band gap range (3.5–4.3 eV) suitable for water splitting [44]. In this work, we explore for the first time the photo-electrochemistry of ruthenium complexes using a nanoITO working electrode in the metal-oxide–solution interface, as shown in Figure 1a. The novel PEC technique is composed of a mononuclear ruthenium complex [Ru(terpy)(Me2bipy)(H2O)]2+ (1-H2O) and dinuclear [{Ru(terpy)(H2O)}2(μ-bb5)]4+ (2-H2O) (where terpy = 2,2′:6′,2′′-terpyridine; Me2bipy = 4,4′-dimethyl-2,2′-bipyridine; and bb5 = bis[4(4′-methyl-2,2′-bipyridyl)]-1,5-alkane) dissolved in a pH 7 buffer solution, which interacts with light on the electroactive nanoITO surface. We present the study of the photo-induced ligand exchange of the precursor complexes [Ru(terpy)(Me2bipy)(Cl)]+ (1-Cl) and [{Ru(terpy)(Cl)}2(μ-bb5)]2+ (2-Cl) to the corresponding 1-H2O and 2-H2O complexes, the TD-DFT calculations, electrochemistry and photo-electrochemistry, incident photon to current efficiency (IPCE) and spectro-electrochemistry to reveal the photo-electrochemical properties of the in situ-generated 1-H2O and 2-H2O in the solution-based PEC platform.
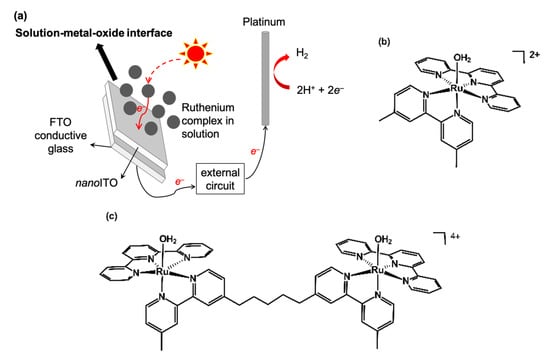
Figure 1.
(a) Solution-based PEC diagram in the present study; (b) chemical structure of 1-H2O; (c) chemical structure of 2-H2O.
2. Materials and Methods
2.1. General
UV/vis spectra were recorded on a Shimadzu UV-2600 spectrometer (Shimadzu, Kyoto, Japan). Fluorescence spectra were recorded on a Jasco FP-6500 spectrofluorometer (Jasco, Tokyo, Japan). 1H-NMR spectra were collected at 298 K using a Bruker instrument (500 MHz) (Bruker, Billerica, MA, USA). Electrospray ionization mass spectrometry (ESI-MS) spectra were measured on a Bruker microTOF II mass spectrometer. An elemental analysis was carried out on an Exeter Analytical, Inc. (Chelmsford, MA, USA), CE-440F elemental analyzer. A scanning electron microscopy (SEM) analysis of the electrodes was performed on a JEOL JSM-6100 microscope (JEOL, Tokyo, Japan). XPS data were recorded using a JPS-9010MX photoelectron spectrometer.
2.2. Materials
ITO nanoparticles (<100 nm) were purchased from DLS. RuCl3 hydrate, 4,4′-Di-tert-butyl-2,2’-bipyridyl and 2,2′:6′,2′’-terpyridine were purchased from Sigma Aldrich (St. Louis, MO, USA). Other chemicals were purchased from Tokyo Chemical Company, Kanto Chemical and Wako (Tokyo, Japan). Organic solvents were dried and distilled according to the standard methods when necessary. The ligand bis[4(4′-methyl-2,2′-bipyridyl)]-1,5-alkane (bb5) was synthesized according to the reported procedure [45].
2.3. Synthesis
The synthesis of the mononuclear [Ru(terpy)(Me2bipy)Cl]Cl (1-Cl) and dinuclear [{Ru(terpy)(Cl)}2(μ-bb5)]Cl2 (2-Cl) complexes was performed according to the previously reported methods with slight modifications [46,47]. The typical procedure was as follows: Solid [Ru(terpy)Cl3] (0.20 g, 0.45 mmol) and appropriate ligands (0.45 mmol for Me2bpy and 0.23 mmol for bb5) were refluxed in EtOH/H2O (4:1; 40 mL) for 4 h. After cooling, the solvent mixture was evaporated to dryness. The crude product was dissolved in acetone and loaded onto a silica gel column. The pure complexes were separated from their impurities using MeOH/(CH3)2CO (2:1) as the eluent. The separation of the geometric isomers of [{Ru(terpy)(Cl)}2(μ-bb5)]Cl2 was not attempted.
[Ru(terpy)(Me2bipy)Cl]Cl: 1H-NMR (500 MHz, D2O) δ 9.56 (d, J = 5.75 Hz); 8.38 (d, J = 8.15 Hz); 8.32 (s); 8.25 (d, J = 8.1 Hz); 7.98 (t); 7.74 (t); 7.65 (d, J = 5.05 Hz); 7.58 (d, J = 5.1); 7.12 (t); 6.95 (d, J = 5.9 Hz); 2.33 (s); 1.93 (s). ESI-MS: 554.1 [M]+. Elemental analysis: Calcd. for C27H23Cl2N5Ru·4H2O: C, 49.02; H, 4.72; N, 10.59. Found: C, 48.41; H, 4.45; N, 10.39.
[{Ru(terpy)(Cl)}2(μ-bb5)]Cl2: 1H-NMR (500 MHz, D2O) δ9.59 (s); 9.54 (s); 9.47 (d, J = 5.65 Hz); 9.46 (t); 8.40 (d, J = 2.85 Hz); 8.36 (d, J = 11.05 Hz); 8.25 (m); 8.06 (m); 7.99 (m); 7.66 (m); 7.56 (m); 7.47 (m); 7.37 (t); 7.29 (m); 6.85 (m); 2.59 (m); 2.27 (s); 2.07-2.02 (m); 1.2 (m). ESI-MS: 574.1 [M]+/2. Elemental analysis: Calcd. for C57H50Cl4N10Ru2·6H2O: C, 51.59; H, 4.71; N, 10.55. Found: C, 51.37; H, 4.67; N, 10.15.
2.4. Film Preparation
An ITO paste was produced by blending 15 g of an ITO dispersion (<100 nm (DLS), 30 wt% in isopropanol) with 25 mL 10 wt% ethyl cellulose in ethanol and 20 mL terpineol. The ethanol was evaporated using a rotary evaporator once a completely uniform solution was obtained. The FTO/ITO film (0.81 cm2 film area and 7 mm thickness) was then created through screen-printing on top of conductive FTO glass and sintering at 450 °C. The ITO films were then prepared through screen-printing on top of conductive FTO glass, followed by sintering at 450 °C to obtain an FTO/ITO film (0.81 cm2 film area and 7 μm thickness).
2.5. Electrochemistry and Photo-Electrochemistry
Custom-built glass cells were utilized for conducting the electrochemical and photo-electrochemical experiments. A coiled Pt electrode was used as the counter electrode, while Ag/AgCl (3M NaCl) served as the reference electrode (ENHE = EAg/AgCl + 0.198). A three-electrode system was connected to a Hokuto Denko Hz-3000 potentiostat, which was controlled through a computer using Hz-3000 software. The complexes were dissolved in a pH 7 phosphate buffer for the electrochemistry experiments, and cyclic and linear sweep voltammetry measurements were taken at a scan rate of 100 mV s−1. During the PEC measurements, the nanoITO photoanode was illuminated from the front side using a 500 W Xenon light source (Ushio Optical modulex solar simulator SX-UI500NQ, Ushio, Tokyo, Japan) with a typical light intensity of 160 mW cm−2, as measured with a TENMARS TM- 208 solar light meter.
2.6. Spectro-Electrochemistry
The spectro-electrochemistry was performed manually using on a custom-made glass cell containing FTO/nanoITOs at a 1 cm path length. The cell was inserted into a UV–Vis machine and the electrodes were connected to a potentiostat and a computer for potential-controlled measurements. The absorption spectra of the nanoITOs in buffer only and that of the aqua complexes were taken at the potentials 0.2 V, 0.6 V, 0.8 V, 1.0 V, 1.2 V, 1.4 V, 1.6 V and 1.7 V. The scans were conducted when the currents were constant.
2.7. Gas Measurements
The developed hydrogen gas from the cathodic area was introduced into a Shimadzu GC-8A gas chromatograph, which was equipped with a micropacked RT-Msieve 5A packed column and a TCD detector by utilizing a Vici pressure lock gas syringe. The GC assessments were carried out at a temperature of 40 °C in an oven, utilizing nitrogen gas as a carrier, with an injection temperature of 120 °C. The determination of molecular oxygen was carried out with a Delta Ohm (HD-2109.2) dissolved oxygen meter.
2.8. IPCE Measurements
The incident photon-to-charge carrier efficiencies (IPCEs) of the nanoITOs in buffer only and in the presence of the aqua complexes were measured in a custom-made three-electrode cell. The cell consisted of a Ag/AgCl reference electrode, FTO/nanoITOs as the working electrode and Pt as the counter electrode. To obtain monochromatic lights ranging from 400 to 670 nm, Xenon light was filtered through appropriate bandpass filters. The intensity of the light was measured using an ADCMT 8230E Optical Power Meter from ADC Corporation (Toyama, Japan). The measurement was conducted with an external bias of 1.0 V vs. NHE. The data parameters were collected and calculated according to Equation (1).
2.9. Theoretical Calculation
Theoretical energy levels were obtained using a B3LYP functional, which used the Stuttgart ECP (SDD) basis set for Ru and 6-31G** for all the other atoms (C, H, O, N, P), calculated in a polarizable continuum model (PCM) of water using the Gaussian 09 package [48]. The molecular orbitals were visualized using the Gauss view 5.0.8 program.
3. Results and Discussion
3.1. Synthesis and Characterizations
The synthesis of the precursor complexes [Ru(terpy)(Me2bipy)(Cl)]+ (1-Cl) and [{Ru(terpy)(Cl)}2(bb5)]2+ (2-Cl) followed the method reported previously [46,47]. The complexes were purified via silica gel column chromatography with methanol/acetone (2:1) as the eluent. The purity of the complexes was confirmed with 1H NMR, ESI mass spectrometry and an elemental analysis. The complexes [Ru(terpy)(Me2bipy)(H2O)]2+ (1-H2O) and [{Ru(terpy)(H2O)}2(bb5)]4+ (2-H2O) were generated in situ by irradiating 1-Cl and 2-Cl, respectively, in a pH 7 phosphate buffer (vide infra).
3.2. Photo-Induced Ligand Exchange
The absorption spectra of 1-Cl and 2-Cl in pure water exhibited absorptions that peaked at λmax 486 nm (ε = 8714 M−1 cm−1) and at λmax 488 nm (ε = 17,904 M−1 cm−1), respectively. These peaks were ascribed to the MLCT bands, which resulted from the transfer of charge from the metal to the ligand. Additionally, there were distinctive peaks observed at 314.5 and 315 nm for 1-Cl and 2-Cl, respectively, which were attributed to the ligand-based π–π* transition. The molar extinction coefficient for 2-Cl was found to be twice that for 1-Cl, which was consistent with the “dinuclearity” present in 2-Cl.
The coordination chemistry of 1-Cl and 2-Cl featured a typical lability of the complexes because of the presence of the labile chlorido ligand, which can undergo aquation, accompanied by the blue-shift character of the absorption as it changed from RuII(Cl) to RuII(H2O) [47]. While the ligand exchange could be triggered thermally [47] and through an acid treatment [49], in the present investigation, we observed that the aquation process could be generated through light irradiation (Equations (2) and (3)). As seen in Figure S1, the exposure of the water solution of 1-Cl and 2-Cl to visible light irradiation caused the movement of the MLCT band to λmax 479 nm and to λmax 480 nm, respectively, indicating the ligand exchange to aqua [47]. Additionally, 1HNMR monitoring showed the characteristic upfield shift in the C6 proton resonance following the light irradiation of 1-Cl and 2-Cl, as shown in Figures S11 and S12, indicating the formation of 1-H2O and 2-H2O, consistent with a previous report [47,50].
[RuII(terpy)(Me2bipy)(Cl)]+ + H2O → [RuII(terpy)(Me2bipy)(H2O)]2+
{[RuII(terpy)(Cl)]2(μ-bb5)}2+ + 2H2O → {[RuII(terpy)(H2O)]2(μ-bb5)}4+
The TD-DFT calculations for 1-Cl, 1-H2O, 2-Cl and 2-H2O presented in Figure 2 showed that the ligand exchange from Cl to H2O caused the stabilization of both the LUMO and HOMO of the metal complexes. Although the HOMO–LUMO gaps in the aqua complexes were slightly larger than the chlorido counterparts, as indicated by the experimental and calculated absorption maxima in Table S1, the exchange of Cl for H2O appeared to be thermodynamically favorable due to the HOMO and LUMO stabilization.
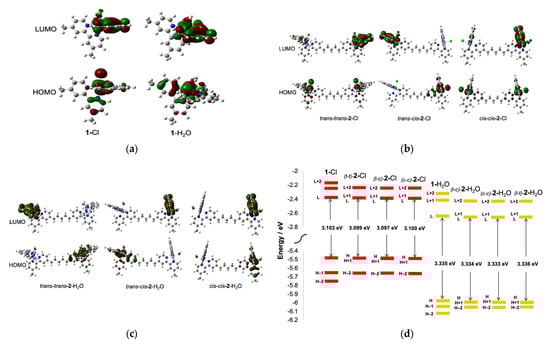
Figure 2.
(a) The HOMO and LUMO surface plots of 1-Cl and 1-H2O; (b) the HOMO and LUMO surface plots of trans-trans-2-Cl, trans-cis-2-Cl and cis-cis-2-Cl; (c) the HOMO and LUMO surface plots of trans-trans-2-H2O, trans-cis-2-H2O and cis-cis-2-H2O; (d) HOMO and LUMO energies of all geometric isomers of 2-Cl and 2-H2O, showing the stabilization of both HOMO and LUMO following the formation of the aqua forms, although there was an apparent increase in the HOMO–LUMO energy gap consistent with the experimental electronic absorption presented in Table S1.
3.3. Electrochemistry on nanoITO Surface
To examine the redox properties of the complexes, cyclic voltammetry (CV) experiments were conducted for 1-Cl and 2-Cl, and for the in situ-generated 1-H2O and 2-H2O in a three-electrode setup comprising of a nanoITO working electrode, a platinum counter electrode and a Ag/AgCl reference. Complexes 1-Cl and 2-Cl were dissolved in the pH 7.0 phosphate buffer and the CV was measured immediately. As illustrated in Figure 3, the mononuclear complex 1-Cl showed a reversible wave at the E1/2 0.86 V corresponding to the RuII(Cl)/RuIII(Cl) redox cycle [43]. The measurement for 2-Cl observed only one redox wave at the E1/2 0.88 V assigned to (Cl)RuII–RuII(Cl)/(Cl)RuIII–RuIII(Cl), despite having two metal centers. The concentration of the 2-Cl solution in the buffer was half that of the mononuclear 1-Cl, and the CV data revealed that they had the same current height, as seen in Figure 3. This result indicated that the single redox wave in 2-Cl contained two sets of the one-electron process originating from two identical metal centers. The identical redox character of the two coordination sites was evident from the HOMO surface plots in trans-trans-2-Cl and in cis-cis-2-Cl (Figure 2), which suggested that each coordination site in the dinuclear chloride complex possessed an identical electron distribution.
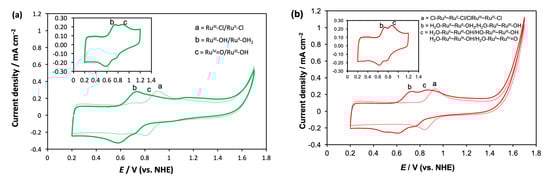
Figure 3.
(a) The CV of 1-Cl (dotted line) and the photo-generated 1-H2O (solid line); (b) the CV of 2-Cl (dotted line) and 2-H2O (solid line). The electrochemical measurements were carried out using a three-electrode system with nanoITO screen-printed on FTO as working electrode, Ag/AgCl as the reference electrode and Pt as the counter electrode. Complexes 1-Cl (0.2 mM) and 2-Cl (0.1 mM) were dissolved in pH 7 phosphate buffer. Complexes 1-H2O and 2-H2O were generated in situ by exposing the chloride complex solutions to Xenon light (160 mW cm–2) for 15 min. The scan rate used in all cases was 100 mV s–1.
Complexes 1-H2O and 2-H2O were generated in situ by irradiating 1-Cl and 2-Cl solutions in the pH 7 phosphate buffer, respectively, for 15 min. Figure 3a displays the CV of 1-H2O, which exhibited two one-electron redox cycles at 0.67 V and 0.82 V, respectively. These cycles were attributed to the proton-coupled electron transfer (PCET) processes RuII(H2O)/RuIII(OH) and RuIII(OH)/RuIV=O, respectively [49]. These results confirmed the photo-induced aquation process, which was consistent with the UV–Vis and 1HNMR observations described earlier. The pH-dependent PCET and evidence of one-electron oxidation of RuII(H2O) to RuIII(OH) in neutral pH was reported on previously [51,52]. In contrast to 1-H2O, the CV of the in situ-generated aqua complex 2-H2O exhibited multiple cathodic peaks that were clearly identified when scanned from 0.2 to 1.6 V, although the forward anodic scan showed only two distinctive peaks (Figure 3b). While the CV scan from 0.2 to 1.2 V featured two well-defined redox cycles (inset of Figure 3b), the presence of the multiple cathodic peaks after the forward anodic scan to 1.6 V indicated the accumulation of higher oxidation 2-H2O states on the nanoITO surface beyond 1.2 V. This provided evidence of the stepwise one-electron PCETs in 2-H2O. Moreover, unlike 2-Cl, the HOMO surface plots of all the geometric isomers of 2-H2O exhibited a nonidentical electron distribution pattern of the two coordination sites (Figure 2c). This strongly suggests that each site possesses different redox behavior. As a result, the two redox cycles noticed for 2-H2O were assigned as a stepwise one-electron oxidation: (H2O)RuII–RuII(OH2)/(H2O)RuII–RuIII(OH) (0.68 V) and (H2O)RuII–RuIII(OH)/(HO)RuIII–RuIII(OH) (0.82 V). Consistent with the PCET via hydrogen bonding in the dinuclear ruthenium complexes bridged by a nonflexible linker [52], in the current study, 2-H2O was proposed to feature a hydrogen-bonded PCET, because the flexibility of the alkyl bridge would allow for the orientation of the two coordination sites to be optimal for hydrogen bonding, as demonstrated in Figure 4. The complete assignments of the redox potentials of each complex are presented in Table 1.
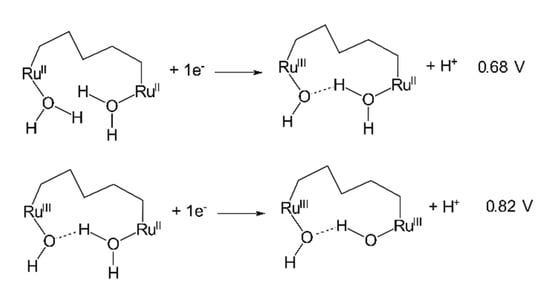
Figure 4.
The proposed PCET in 2-H2O showing the (H2O)RuII–RuII(OH2)/(H2O)RuII–RuIII(OH) at 0.68 V and (H2O)RuII–RuIII(OH)/(HO)RuIII–RuIII(OH) at 0.82 V. The flexibility of the alkyl bridging ligand is predicted to facilitate the interaction of the two metal centers through hydrogen bonding.

Table 1.
The assignments of the redox potentials of 1-Cl and 2-Cl and those of the photo-generated 1-H2O and 2-H2O observed on nanoITO surface. The measurements were performed in 0.1 M pH 7 phosphate buffer. The in situ generation of the aqua complexes was carried out by irradiating the complex solutions for 15 min. All the potential values were relative to NHE. E½ = |Epa − Epc|/2. ΔE = Epa − Epc in mV.
3.4. Photo-Electrochemistry on nanoITO Surface
The linear scan voltammetry (LSV) tests were carried out in the range 0.2–1.6 V under visible light irradiation to explore the photocurrent responses of the aqua complexes in the buffer solution on the surface of nanoITOs, with the data shown in Figure 5a. The J–V curve for the nanoITOs in the buffer only in the absence of light irradiation demonstrated that the onset of water oxidation occurred at a 1.5 V applied potential, or 680 mV overpotential. In stark contrast, under visible light irradiation, the J–V curve for the nanoITOs showed a much earlier onset at 0.9 V or 83 mV overpotential. The lower amount of overpotential under light irradiation indicated that nanoITOs can absorb photon energy to create a hole–electron separation at an applied bias to facilitate water oxidation on the surface. The LSV under light irradiation carried out for the nanoITOs in the presence of 1-H2O and 2-H2O also revealed a lower onset potential, which was characterized by an apparent increase in the photocurrent in the potential range 0.6–1.3 V, where PCET occurred.
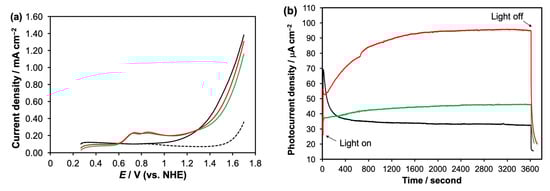
Figure 5.
(a) The J–V curves of nanoITOs in phosphate buffer without light irradiation (dashed line), nanoITO under visible light irradiation (black solid line), nanoITO in the presence of 1-H2O (green) and nanoITO in the presence of 2-H2O (red) performed under light irradiation; (b) the J–t curves for nanoITO in buffer-only (black), in the presence of 1-H2O (green) and in the presence of 2-H2O (red) obtained under on–off Xenon light irradiation (160 mW cm−2) held at 1.0 V for a period of 3600 s.
Based on the LSV results, the photolysis experiments were then performed at a potential of 1.0 V for a duration 3600 s, with the data presented in Figure 5b. In buffer only, the nanoITOs gave a photocurrent spike at 70 A cm−2, which dropped quickly to the steady-state current of 33 A cm−2 due to the fast electron–hole recombination. The presence of 1-H2O in the solution gave the lower photocurrent spike, but a higher and more persistent steady-state current at 40 A cm−2. In contrast to the buffer-only and 1-H2O experiments, the photolysis experiment in the presence of 2-H2O exhibited a progressive increase in the photocurrent for 1200 s before leveling off at 95 A cm−2. Although no oxygen gas was detected by the oxygen sensor, the buffer-only produced 0.20 μmol H2, while 1-H2O and 2-H2O generated 0.23 μmol and 0.70 μmol hydrogen gas, respectively.
The curve-shaped photocurrent response shown by 2-H2O that was significantly higher than the other two systems was indicative of the chemical processes unique to the dinuclear complex occurring during the photolysis on the surface of the nanoITOs. Our SEM investigation of the nanoITO surface after the photolysis in the presence of 2-H2O revealed the deposited microparticle, as shown in Figure 6b(1). While no deposition occurred for 1-H2O (Figure 6b(2)), the greater photocurrent by 2-H2O must have, therefore, been caused exclusively by the photo-electrochemical process involving the accessible redox states of the dinuclear complex. The CV analysis of the deposited product in the phosphate buffer (Figure 6a) showed two redox cycles at E1/2 0.82 V and 1.28 V, which were assigned to the (H2O)RuII–RuIII(OH)/(HO)RuIII–RuIII(OH) and (HO)RuIII–RuIII(OH)/(HO)RuIII–RuIV(O) redox events, respectively. Therefore, we suspected that the deposited product was the dinuclear complex in its oxidized (H2O)RuII–RuIII(OH) form that accumulated on the nanoITO surface. As seen in Figure 6a, although the first CV cycle of the deposited complex displayed two distinctive redox cycles, the current height belonging to (HO)RuIII–RuIII(OH)/(HO)RuIII–RuIV(O) gradually decreased as further cycles proceeded, accompanying the appearance of the (H2O)RuII–RuII(OH2)/(H2O)RuII–RuIII(OH) redox. Therefore, during the multiple CV scans, the complex returned to its (H2O)RuII–RuII(OH2) state. The decrease in the current heights after multiple scans was possibly due to the dissolution of the deposited microparticle in the buffer solution. The XPS spectrum of the deposited product on the nanoITOs (Figure 6c) showed the presence of Ru 3d 3/2, Ru 3d 5/2, C 1 s, O 1 s and N 1 s at binding energies 298, 285, 285, 533 and 402 eV, respectively [53], which further confirmed the deposition of the dinuclear complex molecule on the surface.
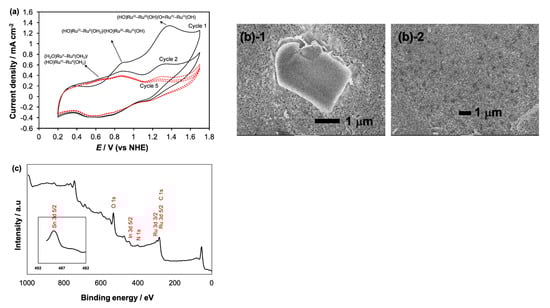
Figure 6.
(a) The cyclic voltammogram of the deposited product obtained after the photolysis of 2-H2O. The nanoITO working electrode that contained the deposited product was taken out and rinsed and the CV was performed in pH 7.0 phosphate buffer; (b(1)) the SEM image of the nanoITO obtained after the photolysis of 2-H2O, showing the deposited microparticle believed to be the stable oxidized form of (H2O)RuII–RuIII(OH) in comparison with the SEM image of nanoITOs after photolysis of 1-H2O (b(2)), which showed no deposition; (c) the XPS spectrum of the nanoITOs containing the deposited product after the photolysis of 2-H2O, showing Ru 3d 3/2, Ru 3d 5/2, C 1 s, O 1 s and N 1 s peaks.
3.5. Plausible Photo-Electrochemical Mechanism
We conducted the incident photon to current efficiency (IPCE) spectroscopy and spectro-electrochemistry studies of buffer-only, 1-H2O and 2-H2O solutions to corroborate the photo-electrochemical mechanism in the three systems. As shown in Figure 7, the IPCE spectra of the nanoITOs in a buffer-only system at a potential of 1.0 V were consistent with its absorption spectrum at the same potential (Figure S5), which indicated that the photon-to-current conversion through nanoITOs occurred primarily in the UV region. In contrast to the nanoITOs in buffer only, the IPCE measurements for nanoITOs in 1-H2O and 2-H2O showed typical peaks at approximately 450 nm and considerable photon conversion beyond 500 nm, which clearly resembled the absorption spectra of the corresponding complexes (see Figures S6 and S7). The resemblance of the IPCE of 1-H2O and 2-H2O with their absorption spectra confirmed that the complex molecules absorbed the photon energy in the visible region and converted it to a current via electron injection into the conduction band of the nanoITOs. Although the %IPCE was very low, the higher value observed for 2-H2O in comparison to 1-H2O indicated the better photon-to-current conversion by the dinuclear complex, which was consistent with the photolysis data (Figure 5b).
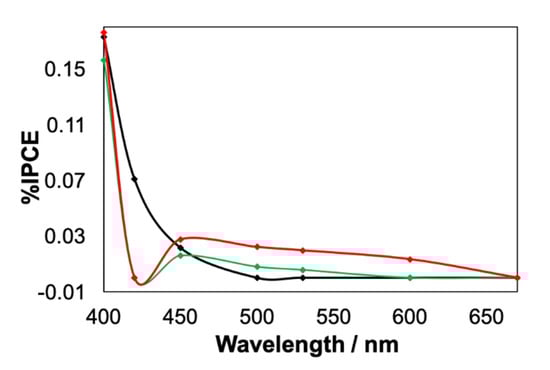
Figure 7.
The IPCE spectra of nanoITOs in buffer only (black), in the presence of 1-H2O (green) and in the presence of 2-H2O (red) performed at 1.0 V.
Figure 8 shows the redox state regions of 1-H2O and 2-H2O derived from the spectro-electrochemistry experiments performed in the range 0.2–1.7 V (see Figures S5–S7). A close inspection of the absorbance changes in the MLCT band plotted against the applied potential for 1-H2O revealed the presence of three regions corresponding to RuII(OH2), RuIII(OH) and RuIV(O), while 2-H2O displayed four distinctive regions belonging to (H2O)RuII–RuII(OH2), (H2O)RuII–RuIII(OH), (HO)RuIII–RuIII(OH) and (HO)RuIII–RuIV(O), which confirmed the stepwise one-electron PCET in 2-H2O.
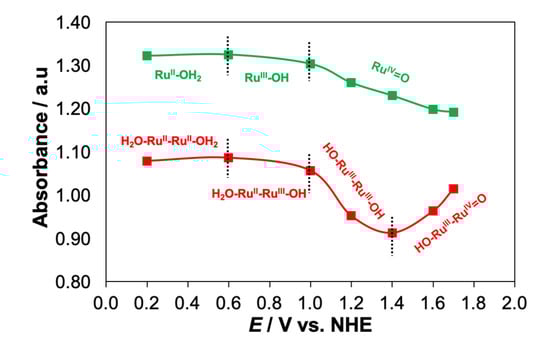
Figure 8.
The redox state regions of 1-H2O (green) and 2-H2O (red) obtained from the plots of the absorbance change in the MLCT band in response to the changing potentials.
The spectro-electrochemistry measurements also revealed that increasing the applied potential to 1.0 V for both 1-H2O and 2-H2O resulted in only a slight decrease in the MLCT band (Figures S6 and S7), suggesting the dominant RuII(H2O) and (H2O)RuII–RuII(OH2) species existing on the surface of the nanoITOs. During a bulk electrolysis or a chemical oxidation of RuII(OH2), the MLCT band completely disappeared as it underwent oxidation to RuIII(OH) and further to RuIV(O) [50]. In this investigation, the slight decrease in the MLCT band intensity during the photolysis experiments inferred that the visible-light-absorbing species RuII(H2O) of 1-H2O and (H2O)RuII–RuII(OH2) of 2-H2O existed in the solution–metal-oxide interface.
In the buffer-only system (Figure 9), the absorption of the photon energy by the nanoITOs caused hole–electron separation in the semiconductor. The photocurrent declined rapidly, because the electron recombined easily with the hole. The generated photocurrent during the photolysis was low and was not sufficient to drive the oxidation of the water molecules to oxygen.
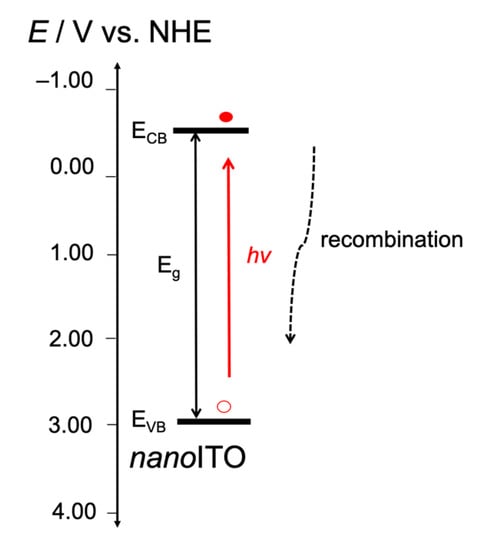
Figure 9.
The proposed energy diagram for the photo-electrochemical process following the light absorption by nanoITOs in buffer-only system performed at 1.0 V. The electron–hole separation that occurred in competition with electron recombination, leading to the sharp decline in the photocurrent, as shown in Figure 5b. The nanoITO conduction band (ECB) −0.77 V SCE or equal to −0.53 V NHE followed that reported previously [40]. The band gap energy (Eg) +3.45 eV was estimated from the Tauc plot derived from the UV–visible spectrum at 1.0 V, as given in Figure S8.
In the presence of 1-H2O, the higher photocurrent spike and the improved steady-state photocurrent were due to the hole being used to oxidize the mononuclear ruthenium complex in the solution–metal-oxide interface, which, therefore, prevented electron/hole recombination. Given that the potentials of RuII(OH2)/RuIII(OH) (+0.67 V) and RuIII(OH)/RuIV=O (+0.82 V) were lower that the EVB of the nanoITOs, the hole extraction by both RuII(H2O) and RuIII(OH) was thermodynamically preferable. As inferred from Figure 7, the IPCE spectrum of the nanoITOs in the presence of 1-H2O indicated that RuII(OH2) could absorb the photon energy at the visible region, which caused the excitation of the molecule and the subsequent electron injection into the conduction band of the nanoITOs. This process could have occurred because the RuII*(OH2)/RuIII(OH) excited-state potential (−1.45 V) was more negative than that of the ECB of the nanoITOs.
In a similar manner, in the presence of 2-H2O, the hole could be transferred to (H2O)RuII–RuII(OH2) and to (H2O)RuII–RuIII(OH) to yield the respective higher-oxidation state complexes, as presented in Figure 10c. The one-electron redox processes (H2O)RuII–RuII(OH2)/(H2O)RuII–RuIII(OH) and (H2O)RuII–RuIII(OH)/(HO)RuIII–RuIII(OH), which occurred at 0.68 V and 0.82 V, respectively, were lower than the EVB of the nanoITOs, thus, allowing the hole transfer to take place. The IPCE spectrum given in Figure 7 (red trace) also indicating that the dinuclear species (H2O)RuII–RuII(OH2) absorbed photon energy in the visible region, which caused its excitation to (H2O)RuII–RuII*(OH2) and the subsequent electron injection into the conduction band of the nanoITOs. Such an electron injection could occur because the (H2O)RuII–RuII*(OH2)/(H2O)RuII–RuIII(OH) excited potential (−1.42 V) was more negative in comparison with the ECB of the nanoITOs.
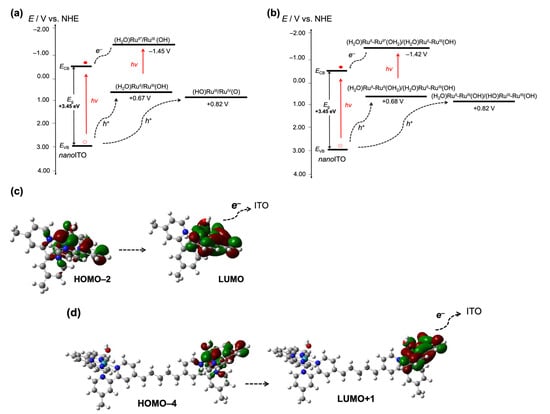
Figure 10.
(a) The proposed energy diagram representing the photo-electrochemical processes occurring on nanoITOs in the presence of 1-H2O during the photolysis at 1.0 V. The created hole was extracted through RuII(OH2) to form RuIII(OH) then RuIV(O). The visible light absorption using RuII(OH2) caused its excitation and subsequent electron injection to form RuIII(OH); (b) the proposed energy diagram representing the photo-electrochemical processes occurring on nanoITOs in the presence of 2-H2O during the photolysis at 1.0 V. The created hole was extracted through (H2O)RuII–RuII(OH2) to form (H2O)RuII–RuIII(OH) then (HO)RuIII–RuIII(OH). The visible light absorption using (H2O)RuII–RuII(OH2) caused its excitation and subsequent electron injection to form (H2O)RuII–RuIII(OH). The ground-state potentials were determined from the CV data, while the excited-state potentials were determined from the equation E*/+ = E0 (RuII/RuIII) – E0-0 [54,55], where E0-0 was obtained from the intersection between absorption and emission (Figure S9). The nanoITO conduction band (ECB) −0.77 V SCE or equal to −0.53 V NHE followed that reported previously [40]. The band gap energy (Eg) +3.45 eV was estimated from the Tauc plot derived from the UV-visible spectrum at 1.0 V as given in Figure S8. [47]; (c) the surface plots of the dominant H–2 → L transition in 1-H2O showing the electron distribution in terpyridine and H2O ligands of the L state; (d) the surface plots of the dominant H–4 → L+1 transition in 2-H2O (trans-trans isomer) showing the electron distribution in terpyridine and H2O ligands of the L+1 state.
The above energetics data were consistent with the previous study, which reported that electron injection by the surface-bound ruthenium complexes into ITO nanoparticles was bias-dependent, and was due to the overlap between the conduction band of the nanoparticles and the the RuIII/RuII* energy [43]. In the present investigation, the very low IPCE values observed for both 1-H2O and 2-H2O suggested that the formation of the respective oxidized products through this photo-electrochemical process did not occur effectively. One possible cause was the ineffective electron injection into the nanoITO conduction band in the solution–metal-oxide interface because of the lack of an anchoring group or binding unit, such as carboxylic acid or phosphonic acid, which would otherwise facilitate a better electron injection [40,41,42,43]. Nevertheless, the dominant H–2 → L transition in the 1-H2O and H–4 → L + 1 transition in 2-H2O rendered the characteristic metal-to-ligand transition in both complexes, where the electron of the LUMO states of both molecules was localized in the terpyridine and aqua (H2O) ligands (Figure 10c,d). Thus, although the binding unit to nanoITO was absent, the accumulation of electrons in the terpyridine and H2O ligands of the excited states of the molecules suggested a possible electron injection through these moieties. The superior steady-state photocurrent shown by 2-H2O associated with the accumulation of the stable photo-oxidized product (H2O)RuII–RuIII(OH) proves that the photo-electrochemical properties of the ruthenium complexes in the solution–metal-oxide interface was structure-dependent. Although the electron injection capacity of both complexes was energetically favorable, the photo-electrochemical enhancement shown by 2-H2O was the likely consequence of its structure. The two coordination sites in 2-H2O possessed different redox characters that were bridged by a flexible alkyl chain, which may have caused a “chelating effect” that directed the orientation of the –OH- and –H2O-rich coordination sites towards the metal oxide through hydrogen bonding as shown in Figure 11. While the “chelating effect” was absent in 1-H2O, through this effect, 2-H2O molecules in the solution interacted better with the nanoITO surface, which led to the facile photodeposition of the oxidized form of the molecule on the surface of the metal oxide.
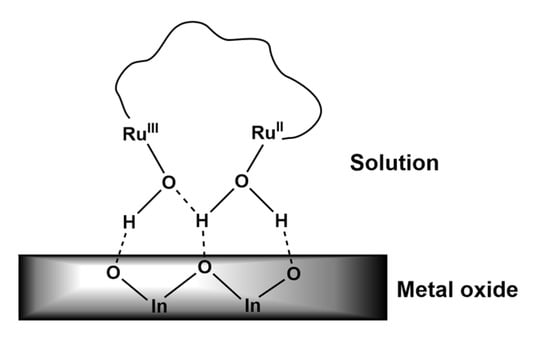
Figure 11.
A diagram of the proposed “chelating effect” depicting the interaction between the two coordination sites of 2-H2O with the metal oxide of nanoITO. The terpyridine ligand and the bipyridine of the bb5 bridging ligand were omitted for clarity.
4. Conclusions
We demonstrated for the first time the photo-induced ligand exchange in 1-Cl and 2-Cl to yield the corresponding aqua complexes 1-H2O and 2-H2O, as monitored by UV–Vis, 1HNMR and photoluminescence spectroscopies. In the buffer-only system, the nanoITO showed a rapid photocurrent decay because of the characteristic electron–hole recombination. In the presence of the in situ-generated 1-H2O and 2-H2O, the photocurrents held at 1.0 V were higher and steadier, which demonstrated the hole extraction through the complex molecules, therefore, inhibiting electron recombination. The IPCE data for both 1-H2O and 2-H2O on the nanoITOs revealed the photon-to-electron conversion in the visible region, because the excitation of the complex molecules facilitated the electron injection into the conduction band of the nanoITOs. Compared with 1-H2O, the more superior photo-electrochemical response and the higher IPCE and hydrogen production shown by 2-H2O were associated with the accumulation of the photo-oxidized product (H2O)RuII–RuIII(OH), which proved that the photo-electrochemistry of the ruthenium complexes in the solution–metal-oxide interface was structure-dependent.
Supplementary Materials
The following supporting information can be downloaded at: https://www.mdpi.com/article/10.3390/pr11072060/s1, Table S1: TD-DFT data for 1-Cl, 1-H2O, 2-Cl and 2-H2O; Figure S1: time-course UV-Vis spectra of 1-Cl during light irradiation; Figure S2: time-course UV-Vis spectra of 2-Cl during light irradiation; Figure S3: photoluminescence spectra for 1-Cl and 1-H2O; Figure S4: photoluminescence spectra for 2-Cl and 2-H2O; Figure S5: the absorption spectra of nanoITO in varying potentials; Figure S6: the absorption spectra of 1-H2O on nanoITO in varying potentials; Figure S7: the absorption spectra of 2-H2O on nanoITO in varying potentials; Figure S8: Tauc plot of nanoITO at 1.0 V; Figure S9: E0-0 value of 1-H2O; Figure S10: E0-0 value of 1-H2O; Figure S11: 1H NMR spectra of 1-Cl and 1-H2O; Figure S12: 1H NMR spectra of 2-Cl and 2-H2O.
Author Contributions
Conceptualization, J.Y.M., U.P., M.A., M.H. and S.; methodology, J.Y.M., U.P., M.A., M.H. and S.; software, M.A. and M.H.; validation, J.Y.M., M.A. and M.H.; formal analysis, J.Y.M., U.P. and S.; investigation, J.Y.M., U.P. and S.; data curation, J.Y.M. and U.P.; writing—original draft preparation, J.Y.M. and U.P.; writing—review and editing, J.Y.M., M.A. and M.H.; visualization, J.Y.M., S.W., H.H.B. and U.P.; supervision, J.Y.M., M.A. and M.H.; funding acquisition, U.P., S.W. and H.H.B. All authors have read and agreed to the published version of the manuscript.
Funding
This research was funded by the Academic Leadership Grant, grant number 2023/UN6.3.1/PT.00/2022. The research was also supported by the Tokyo Human Resources Scholarship fund.
Institutional Review Board Statement
Not applicable.
Informed Consent Statement
Not applicable.
Acknowledgments
We thank Universitas Padjadjaran for the Academic Leadership Grant and the Tokyo Metropolitan Government for the Tokyo Human Resources Scholarship fund. We also thank Professor Shinsuke Takagi of the Department of Applied Chemistry, Tokyo Metropolitan University, for the use of the electrochemical facilities.
Conflicts of Interest
The authors declare no conflict of interest.
References
- Yao, T.; An, X.; Han, H.; Chen, J.Q.; Li, C. Photoelectrocatalytic Materials for Solar Water Splitting. Adv. Energy Mater. 2018, 8, 1800210. [Google Scholar] [CrossRef]
- Jiang, C.; Moniz, S.J.A.; Wang, A.; Zhang, T.; Tang, J. Photoelectrochemical devices for solar water splitting—Materials and challenges. Chem. Soc. Rev. 2017, 46, 4645–4660. [Google Scholar] [CrossRef] [PubMed]
- He, Y.; Hamann, T.; Wang, D. Thin film photoelectrodes for solar water splitting. Chem. Soc. Rev. 2019, 48, 2182–2215. [Google Scholar] [CrossRef] [PubMed]
- Walter, M.G.; Warren, E.L.; McKone, J.R.; Boettcher, S.W.; Mi, Q.; Santori, E.A.; Lewis, N.S. Solar Water Splitting Cells. Chem. Rev. 2010, 110, 6446–6473. [Google Scholar] [CrossRef]
- Guo, L.; Chen, Y.; Su, J.; Liu, M.; Liu, Y. Obstacles of solar-powered photocatalytic water splitting for hydrogen production: A perspective from energy flow and mass flow. Energy 2019, 172, 1079–1086. [Google Scholar] [CrossRef]
- Kanan, M.W.; Nocera, D.G. In Situ Formation of an Oxygen-Evolving Catalyst in Neutral Water Containing Phosphate and Co2+. Science 2008, 321, 1072–1075. [Google Scholar] [CrossRef]
- Cheng, W.-H.; Richter, M.H.; May, M.M.; Ohlmann, J.; Lackner, D.; Dimroth, F.; Hannappel, T.; Atwater, H.A.; Lewerenz, H.-J. Monolithic Photoelectrochemical Device for Direct Water Splitting with 19% Efficiency. ACS Energy Lett. 2018, 3, 1795–1800. [Google Scholar] [CrossRef]
- Ager, J.W.; Shaner, M.R.; Walczak, K.A.; Sharp, I.D.; Ardo, S. Experimental demonstrations of spontaneous, solar-driven photoelectrochemical water splitting. Energy Environ. Sci. 2015, 8, 2811–2824. [Google Scholar] [CrossRef]
- May, M.M.; Lewerenz, H.-J.; Lackner, D.; Dimroth, F.; Hannappel, T. Efficient direct solar-to-hydrogen conversion by in situ interface transformation of a tandem structure. Nat. Commun. 2015, 6, 8286. [Google Scholar] [CrossRef]
- Sun, K.; Liu, R.; Chen, Y.; Verlage, E.; Lewis, N.S.; Xiang, C. A Stabilized, Intrinsically Safe, 10% Efficient, Solar-Driven Water-Splitting Cell Incorporating Earth-Abundant Electrocatalysts with Steady-State pH Gradients and Product Separation Enabled by a Bipolar Membrane. Adv. Energy Mater. 2016, 6, 1600379. [Google Scholar] [CrossRef]
- Safaei, J.; Ullah, H.; Mohamed, N.A.; Noh, M.F.M.; Soh, M.F.; Tahir, A.A.; Ludin, N.A.; Ibrahim, M.A.; Isahak, W.N.R.W.; Teridi, M.A.M. Enhanced photoelectrochemical performance of Z-scheme g-C3N4/BiVO4 photocatalyst. Appl. Catal. B Environ. 2018, 234, 296–310. [Google Scholar] [CrossRef]
- Mohamed, N.A.; Ullah, H.; Safaei, J.; Ismail, A.F.; Noh, M.F.M.; Soh, M.F.; Ibrahim, M.A.; Ludin, N.A.; Teridi, M.A.M. Efficient Photoelectrochemical Performance of γ Irradiated g-C3N4 and Its g-C3N4@BiVO4 Heterojunction for Solar Water Splitting. J. Phys. Chem. C 2019, 123, 9013–9026. [Google Scholar] [CrossRef]
- Ullah, H.; Tahir, A.A.; Mallick, T.K. Structural and electronic properties of oxygen defective and Se-doped p-type BiVO4(001) thin film for the applications of photocatalysis. Appl. Catal. B Environ. 2018, 224, 895–903. [Google Scholar] [CrossRef]
- Nasir, S.N.F.M.; Ullah, H.; Ebadi, M.; Tahir, A.A.; Sagu, J.S.; Teridi, M.A.M. New Insights into Se/BiVO4 Heterostructure for Photoelectrochemical Water Splitting: A Combined Experimental and DFT Study. J. Phys. Chem. C 2017, 121, 6218–6228. [Google Scholar] [CrossRef]
- Wang, S.; Liu, B.; Wang, X.; Zhang, Y.; Huang, W. Nanoporous MoO3−x/BiVO4 photoanodes promoting charge separation for efficient photoelectrochemical water splitting. Nano Res. 2022, 15, 7026–7033. [Google Scholar] [CrossRef]
- Tang, Y.; Jiang, D.; Wang, H.; Zheng, H.; Ren, L.; Wei, K.; Ma, W.; Dai, Y.; Luo, D.; Zhang, X.; et al. Band gap modulation of nanostructured WO3 nanoplate film by Ti doping for enhanced photoelectrochemical performance. J. Cent. South Univ. 2022, 29, 2968–2979. [Google Scholar] [CrossRef]
- Zhang, Y.; Huang, Y.; Zhu, S.; Liu, Y.; Zhang, X.; Wang, J.; Braun, A. Covalent S-O Bonding Enables Enhanced Photoelectrochemical Performance of Cu2S/Fe2O3 Heterojunction for Water Splitting. Small 2021, 17, 2100320. [Google Scholar] [CrossRef]
- Ullah, H.; Tahir, A.A.; Bibi, S.; Mallick, T.K.; Karazhanov, S.Z. Electronic properties of β-TaON and its surfaces for solar water splitting. Appl. Catal. B Environ. 2018, 229, 24–31. [Google Scholar] [CrossRef]
- Yuan, S.-Y.; Jiang, L.-W.; Hu, J.-S.; Liu, H.; Wang, J.-J. Fully Dispersed IrOx Atomic Clusters Enable Record Photoelectrochemical Water Oxidation of Hematite in Acidic Media. Nano Lett. 2023, 23, 2354–2361. [Google Scholar] [CrossRef]
- Wang, S.; He, T.; Yun, J.; Hu, Y.; Xiao, M.; Du, A.; Wang, L. New Iron-Cobalt Oxide Catalysts Promoting BiVO4 Films for Photoelectrochemical Water Splitting. Adv. Funct. Mater. 2018, 28, 1802685. [Google Scholar] [CrossRef]
- Humayun, M.; Ullah, H.; Cheng, Z.-E.; Tahir, A.A.; Luo, W.; Wang, C. Au surface plasmon resonance promoted charge transfer in Z-scheme system enables exceptional photocatalytic hydrogen evolution. Appl. Catal. B Environ. 2022, 310, 121322. [Google Scholar] [CrossRef]
- Shen, S.; Lindley, S.A.; Chen, X.; Zhang, J.Z. Hematite heterostructures for photoelectrochemical water splitting: Rational materials design and charge carrier dynamics. Energy Environ. Sci. 2016, 9, 2744–2775. [Google Scholar] [CrossRef]
- Sivula, K.; Zboril, R.; Le Formal, F.; Robert, R.; Weidenkaff, A.; Tucek, J.; Frydrych, J.; Grätzel, M. Photoelectrochemical Water Splitting with Mesoporous Hematite Prepared by a Solution-Based Colloidal Approach. J. Am. Chem. Soc. 2010, 132, 7436–7444. [Google Scholar] [CrossRef]
- Abdi, F.F.; Han, L.; Smets, A.H.M.; Zeman, M.; Dam, B.; van de Krol, R. Efficient solar water splitting by enhanced charge separation in a bismuth vanadate-silicon tandem photoelectrode. Nat. Commun. 2013, 4, 2195. [Google Scholar] [CrossRef]
- Jeon, T.H.; Choi, W.; Park, H. Cobalt–phosphate complexes catalyze the photoelectrochemical water oxidation of BiVO4 electrodes. Phys. Chem. Chem. Phys. 2011, 13, 21392–21401. [Google Scholar] [CrossRef] [PubMed]
- Liu, B.; Li, J.; Wu, H.-L.; Liu, W.-Q.; Jiang, X.; Li, Z.-J.; Chen, B.; Tung, C.-H.; Wu, L.-Z. Improved Photoelectrocatalytic Performance for Water Oxidation by Earth-Abundant Cobalt Molecular Porphyrin Complex-Integrated BiVO4 Photoanode. ACS Appl. Mater. Interfaces 2016, 28, 18577–18583. [Google Scholar] [CrossRef] [PubMed]
- Suryani, O.; Higashino, Y.; Mulyana, J.Y.; Kaneko, M.; Hoshi, T.; Shigaki, K.; Kubo, Y. A near-infrared organic photosensitizer for use in dye-sensitized photoelectrochemical water splitting. Chem. Commun. 2017, 53, 6784–6787. [Google Scholar] [CrossRef]
- Lyon, L.A.; Hupp, J.T. Energetics of the Nanocrystalline Titanium Dioxide/Aqueous Solution Interface: Approximate Con-duction Band Edge Variations between H0 = −10 and H- = +26. J. Phys. Chem. B 1999, 103, 4623–4628. [Google Scholar] [CrossRef]
- Rothenberger, G.; Fitzmaurice, D.; Grätzel, M. Spectroscopy of conduction band electrons in transparent metal oxide semi-conductor films: Optical determination of the flatband potential of colloidal titanium dioxide films. J. Phys. Chem. 1992, 96, 5983–5986. [Google Scholar] [CrossRef]
- She, C.; Guo, J.; Lian, T. Comparison of Electron Injection Dynamics from Re-bipyridyl Complexes to TiO2 Nanocrystalline Thin Films in Different Solvent Environments. J. Phys. Chem. B 2007, 111, 6903–6912. [Google Scholar] [CrossRef]
- Zigler, D.F.; Morseth, Z.A.; Wang, L.; Ashford, D.L.; Brennaman, M.K.; Grumstrup, E.M.; Brigham, E.C.; Gish, M.K.; Dillon, R.J.; Alibabaei, L.; et al. Disentangling the Physical Processes Responsible for the Kinetic Complexity in Interfacial Electron Transfer of Excited Ru(II) Polypyridyl Dyes on TiO2. J. Am. Chem. Soc. 2016, 138, 4426–4438. [Google Scholar] [CrossRef] [PubMed]
- Ding, X.; Zhang, L.; Wang, Y.; Liu, A.; Gao, Y. Design of photoanode-based dye-sensitized photoelectrochemical cells assembling with transition metal complexes for visible light-induced water splitting. Coord. Chem. Rev. 2018, 357, 130–143. [Google Scholar] [CrossRef]
- Ashford, D.L.; Gish, M.K.; Vannucci, A.K.; Brennaman, M.K.; Templeton, J.L.; Papanikolas, J.M.; Meyer, T.J. Molecular Chromophore–Catalyst Assemblies for Solar Fuel Applications. Chem. Rev. 2015, 115, 13006–13049. [Google Scholar] [CrossRef] [PubMed]
- Purnama, I.; Salmahaminati; Abe, M.; Hada, M.; Kubo, Y.; Mulyana, J.Y. Factors influencing the photoelectrochemical device performance sensitized by ruthenium polypyridyl dyes. Dalton Trans. 2019, 48, 688–695. [Google Scholar] [CrossRef]
- Salmahaminati; Abe, M.; Purnama, I.; Mulyana, J.Y.; Hada, M. Density Functional Study of Metal-to-Ligand Charge Transfer and Hole-Hopping in Ruthenium(II) Complexes with Alkyl-Substituted Bipyridine Ligands. ACS Omega 2021, 6, 55–64. [Google Scholar] [CrossRef]
- Pratomo, U.; Purnama, I.; Mulyana, J.Y. Photo-induced water oxidation via cascade charge transfer on nanostructured Bi-VO4/TiO2 modified with dye and co-catalyst molecules. Inorg. Chim. Acta 2020, 500, 119223. [Google Scholar] [CrossRef]
- Nazeeruddin, M.K.; Angelis, F.D.; Fantacci, S.; Selloni, A.; Viscardi, G.; Liska, P.; Ito, S.; Takeru, B.; Grätzel, M. Combined Experimental and DFT-TDDFT Computational Study of Photoelectrochemical Cell Ruthenium Sensitizers. J. Am. Chem. Soc. 2005, 127, 16835–16847. [Google Scholar] [CrossRef]
- Hanson, K.; Brennaman, M.K.; Luo, H.; Glasson, C.R.K.; Concepcion, J.J.; Song, W.; Meyer, T.J. Photostability of Phos-phonate-Derivatized, RuII Polypyridyl Complexes on Metal Oxide Surfaces. ACS Appl. Mater. Interfaces 2012, 4, 1462–1469. [Google Scholar] [CrossRef]
- Purnama, I.; Kubo, Y.; Mulyana, J.Y. A robust ruthenium complex with nonyl-substituted bpy ligand for dye-sensitized photoelectrochemical cell application. Inorg. Chim. Acta. 2018, 471, 467–474. [Google Scholar] [CrossRef]
- Hoertz, P.G.; Chen, Z.; Kent, C.A.; Meyer, T.J. Application of High Surface Area Tin-Doped Indium Oxide Nanoparticle Films as Transparent Conducting Electrodes. Inorg. Chem. 2010, 49, 8179–8181. [Google Scholar] [CrossRef]
- Farnum, B.H.; Morseth, Z.A.; Lapides, A.M.; Rieth, A.J.; Hoertz, P.G.; Brennaman, M.K.; Papanikolas, J.M.; Meyer, T.J. Photoinduced Interfacial Electron Transfer within a Mesoporous Transparent Conducting Oxide Film. J. Am. Chem. Soc. 2014, 136, 2208–2211. [Google Scholar] [CrossRef] [PubMed]
- Farnum, B.H.; Morseth, Z.A.; Brennaman, M.K.; Papanikolas, J.M.; Meyer, T.J. Driving force dependent, photoinduced electron transfer at degenerately doped, optically transparent semiconductor nanoparticle surface. J. Am. Chem. Soc. 2014, 136, 15869–15872. [Google Scholar] [CrossRef] [PubMed]
- Farnum, B.H.; Nakada, A.; Ishitani, O.; Meyer, T.J. Bias-dependent oxidative or reductive quenching of a molecular excited-state assembly bound to a transparent conductive oxide. J. Phys. Chem. C 2015, 119, 25180–25187. [Google Scholar] [CrossRef]
- Hamberg, I.; Granqvist, C.G.; Berggren, K.F.; Sernelius, B.E.; Engström, L. Band-gap widening in heavily Sn-doped In2O3. Phys. Rev. B 1984, 30, 3240–3249. [Google Scholar] [CrossRef]
- Masaoki, F.; Toshiyuki, Y.; Shuichi, K.; Takashi, K.; Shunichi, N.; Mikiharu, K. Intramolecular Energy Transfer in Covalently Linked Polypyridine Ruthenium(II)/Osmium(II) Binuclear Complexes. Ru(II)(bpy)2Mebpy–(CH2)n–MebpyOs(II)(bpy)2 (n = 2, 3, 5, and 7). Bull. Chem. Soc. Jpn. 1991, 64, 1632–1640. [Google Scholar]
- Mulyana, Y.; Weber, D.K.; Buck, D.P.; Motti, C.A.; Collins, J.G.; Keene, F.R. Oligonuclear polypyridylruthenium(ii) complexes incorporating flexible polar and non-polar bridges: Synthesis, DNA-binding and cytotoxicity. Dalton Trans. 2011, 40, 1510–1523. [Google Scholar] [CrossRef]
- Mulyana, Y.; Collins, G.; Keene, R. Synthesis, nucleic acid binding and cytotoxicity of oligonuclear ruthenium complexes containing labile ligands. J. Incl. Phenom. Macrocycl. Chem. 2011, 71, 371–379. [Google Scholar] [CrossRef]
- Frisch, M.J.; Trucks, G.W.; Schlegel, H.B.; Scuseria, G.E.; Robb, M.A.; Cheeseman, J.R.; Scalmani, G.; Barone, V.; Petersson, G.A.; Nakatsuji, H.; et al. Gaussian 09; Gaussian, Inc.: Wallingford, CT, USA, 2016. [Google Scholar]
- Wasylenko, D.J.; Ganesamoorthy, C.; Koivisto, B.D.; Henderson, M.A.; Berlinguette, C.P. Insight into Water Oxidation by Mononuclear Polypyridyl Ru Catalysts. Inorg. Chem. 2010, 49, 2202–2209. [Google Scholar] [CrossRef]
- Mulyana, Y.; Keene, F.R.; Spiccia, L. Cooperative effects in homogenous water oxidation catalysis by mononuclear ruthenium complexes. Dalton Trans. 2014, 43, 6819–6827. [Google Scholar] [CrossRef]
- Concepcion, J.J.; Jurss, J.W.; Templeton, J.L.; Meyer, T.J. One Site is Enough. Catalytic Water Oxidation by [Ru(tpy)(bpm)(OH2)]2+ and [Ru(tpy)(bpz)(OH2)]2+. J. Am. Chem. Soc. 2008, 130, 16462–16463. [Google Scholar] [CrossRef]
- Berardi, S.; Francàs, L.; Neudeck, S.; Maji, S.; Benet-Buchholz, J.; Meyer, F.; Llobet, A. Efficient Light-Driven Water Oxidation Catalysis by Dinuclear Ruthenium Complexes. Chemsuschem 2015, 8, 3688–3696. [Google Scholar] [CrossRef] [PubMed]
- Agnès, C.; Arnault, J.-C.; Omnès, F.; Jousselme, B.; Billon, M.; Bidan, G.; Mailley, P. XPS study of ruthenium tris-bipyridine electrografted from diazonium salt derivative on microcrystalline boron doped diamond. Phys. Chem. Chem. Phys. 2009, 11, 11647–11654. [Google Scholar] [CrossRef] [PubMed]
- Pan, Q.; Chen, T.; Ma, L.; Wang, G.; Hu, W.-B.; Zou, Z.; Wen, K.; Yang, H. Covalent Triazine-Based Polymers with Controllable Band Alignment Matched with BiVO4 To Boost Photogeneration of Holes for Water Splitting. Chem. Mater. 2019, 31, 8062–8068. [Google Scholar] [CrossRef]
- Takijiri, K.; Morita, K.; Nakazono, T.; Sakai, K.; Ozawa, H. Highly stable chemisorption of dyes with pyridyl anchors over TiO2: Application in dye-sensitized photoelectrochemical water reduction in aqueous media. Chem. Commun. 2017, 53, 3042–3045. [Google Scholar] [CrossRef] [PubMed]
Disclaimer/Publisher’s Note: The statements, opinions and data contained in all publications are solely those of the individual author(s) and contributor(s) and not of MDPI and/or the editor(s). MDPI and/or the editor(s) disclaim responsibility for any injury to people or property resulting from any ideas, methods, instructions or products referred to in the content. |
© 2023 by the authors. Licensee MDPI, Basel, Switzerland. This article is an open access article distributed under the terms and conditions of the Creative Commons Attribution (CC BY) license (https://creativecommons.org/licenses/by/4.0/).