Article

Membrane-Based Micro-Volume Dialysis Method for Rapid and High-Throughput Protein Crystallization

Department of Chemical Engineering, McMaster University, Hamilton, ON L8S 4N7, Canada
Processes 2023, 11(7), 2148; https://doi.org/10.3390/pr11072148
Submission received: 16 May 2023 / Revised: 7 July 2023 / Accepted: 12 July 2023 / Published: 19 July 2023
(This article belongs to the Section Pharmaceutical Processes)

Abstract

:
Protein crystallization techniques are very important in drug development. This paper discusses a membrane-based micro-volume dialysis method suitable for rapid and high-throughput protein crystallization. A droplet of protein solution was deposited on the membrane surface in a micro-volume dialysis device. Crystallizing agents could be added to the protein solution either directly or through the membrane. The crystallization process could easily be monitored in real time under a microscope. Tiny specks, indicative of forming crystals, were observed as early as 30 s from the start of the experiment, and these were clearly distinguishable as tetragonal lysozyme crystals within 2 min. This method is particularly suitable for carrying out screening and optimization experiments, and for studying crystallization kinetics. The easy and direct manner in which protein and crystallizing agents are introduced into the device makes this method amenable to miniaturization and automation. Additionally, this approach would potentially allow for rapid screening of the effects of drug molecules on the crystallization process and the nature of crystal formation.

1. Introduction

Rapid and high-throughput protein crystallization methods are extremely important as research tools [1]. They provide valuable information regarding protein functions [2] and interactions [3] and are therefore very important in biotechnology and drug development [1,2,3,4,5,6]. Protein crystallization, the method by which dissolved protein molecules are converted to their corresponding crystalline forms, is a crucial and frequently a limiting step in crystallography [1,4,5]. It is technically challenging, time-consuming, expensive and laborious, primarily as it is multi-parametric in nature [1,4,5].
Certain well-established methods are more commonly used for obtaining protein crystals. The list includes micro-batch crystallization, vapour diffusion, dialysis, free-interface diffusion and different variants of these [1,4,5,6,7,8]. Vapour diffusion-based methods are most popular as these are generally considered more amenable to miniaturization and automation [9]. The quantity of pure protein available is frequently a limiting factor in many research projects, and this is the main motivation for miniaturization [9]. Crystallization is affected by a multitude of parameters such as temperature, protein concentration, buffer type, precipitant type and concentration. Therefore, many experiments need to be carried out for optimization of crystallization processes, and speed is a vital factor [9]. Screening of conditions ideal for obtaining crystals suitable for X-ray diffraction crystallography is frequently carried out in high-throughput mode [9,10,11]. Researchers have also reported more unconventional approaches towards the miniaturization and automation of crystallization processes, some of which involve microfluidics [12,13,14,15,16,17,18,19,20,21,22,23,24,25]. However, some of these methods involve complicated set-ups and operating protocols, and quite importantly, need considerable specialized expertise.
Dialysis is a dynamic method involving the slow infusion of a crystallizing agent into a protein solution via diffusion through a semi-permeable membrane [1,4,5,8]. While this approach allows operating conditions such as precipitant concentration to be varied and controlled, dialysis-based methods that are currently used require expertise [1]. Additionally, these methods are not particularly amenable to either miniaturization or automation [1,8]. Moreover, it is sometimes not easy to observe crystals being formed in real time as the protein samples are typically enclosed within chambers inside the dialysis devices and are therefore not visually accessible [1,8].
This paper discusses a simple and inexpensive, membrane-based, micro-volume dialysis method and its use for rapid protein crystallization. Lysozyme was chosen as model protein as it is easy to crystallize and has been widely used as model protein in many studies [26,27,28,29,30,31,32,33,34]. The micro-volume dialysis method discussed in this paper is conceptually similar to the micro-volume ultrafiltration [35] and drop-dialysis [36] techniques used for concentrating or desalting small droplet-sized protein samples. However, the device and protocols used in the current study are quite different from those reported in these papers [35,36]. Two crystallizing agents, sodium chloride and polyethylene glycol (PEG), were used to challenge a protein solution droplet placed over a dialysis membrane. A droplet of PEG solution was directly layered over the protein solution, while the sodium chloride solution was placed on the other side of the membrane. The membrane device was placed over a glass slide which was in turn placed on the microscope stage and the crystallization process could be monitored in real-time. Using this method, lysozyme crystals could be very rapidly obtained, tiny specks indicative of forming crystal being observed within 30 s. Several variants of this abovementioned approach were studied, and the results obtained are discussed. Effects of additives on rate and nature of protein crystallization were also studied.

2. Materials and Methods

2.1. Materials

Lysozyme (L6876-5G), polyethylene glycol 6000 (81260) and chemicals used to prepare phosphate buffer were purchased from Sigma-Aldrich, St. Louis, MO, USA. Sodium chloride (SOD002.205) was purchased from BioShop Canada Inc., Burlington, ON, Canada). All buffers and protein solutions were prepared using purified water (18.2 MΩ cm) obtained from a DiamondTM NANOpure (Barnstead, Dubuque, IA, USA) water purification unit. Dialysis membrane (Spectra/Por 4, 11–14 kDa MWCO) was purchased from Spectrum Laboratories Inc., Rancho Dominguez, CA, USA.

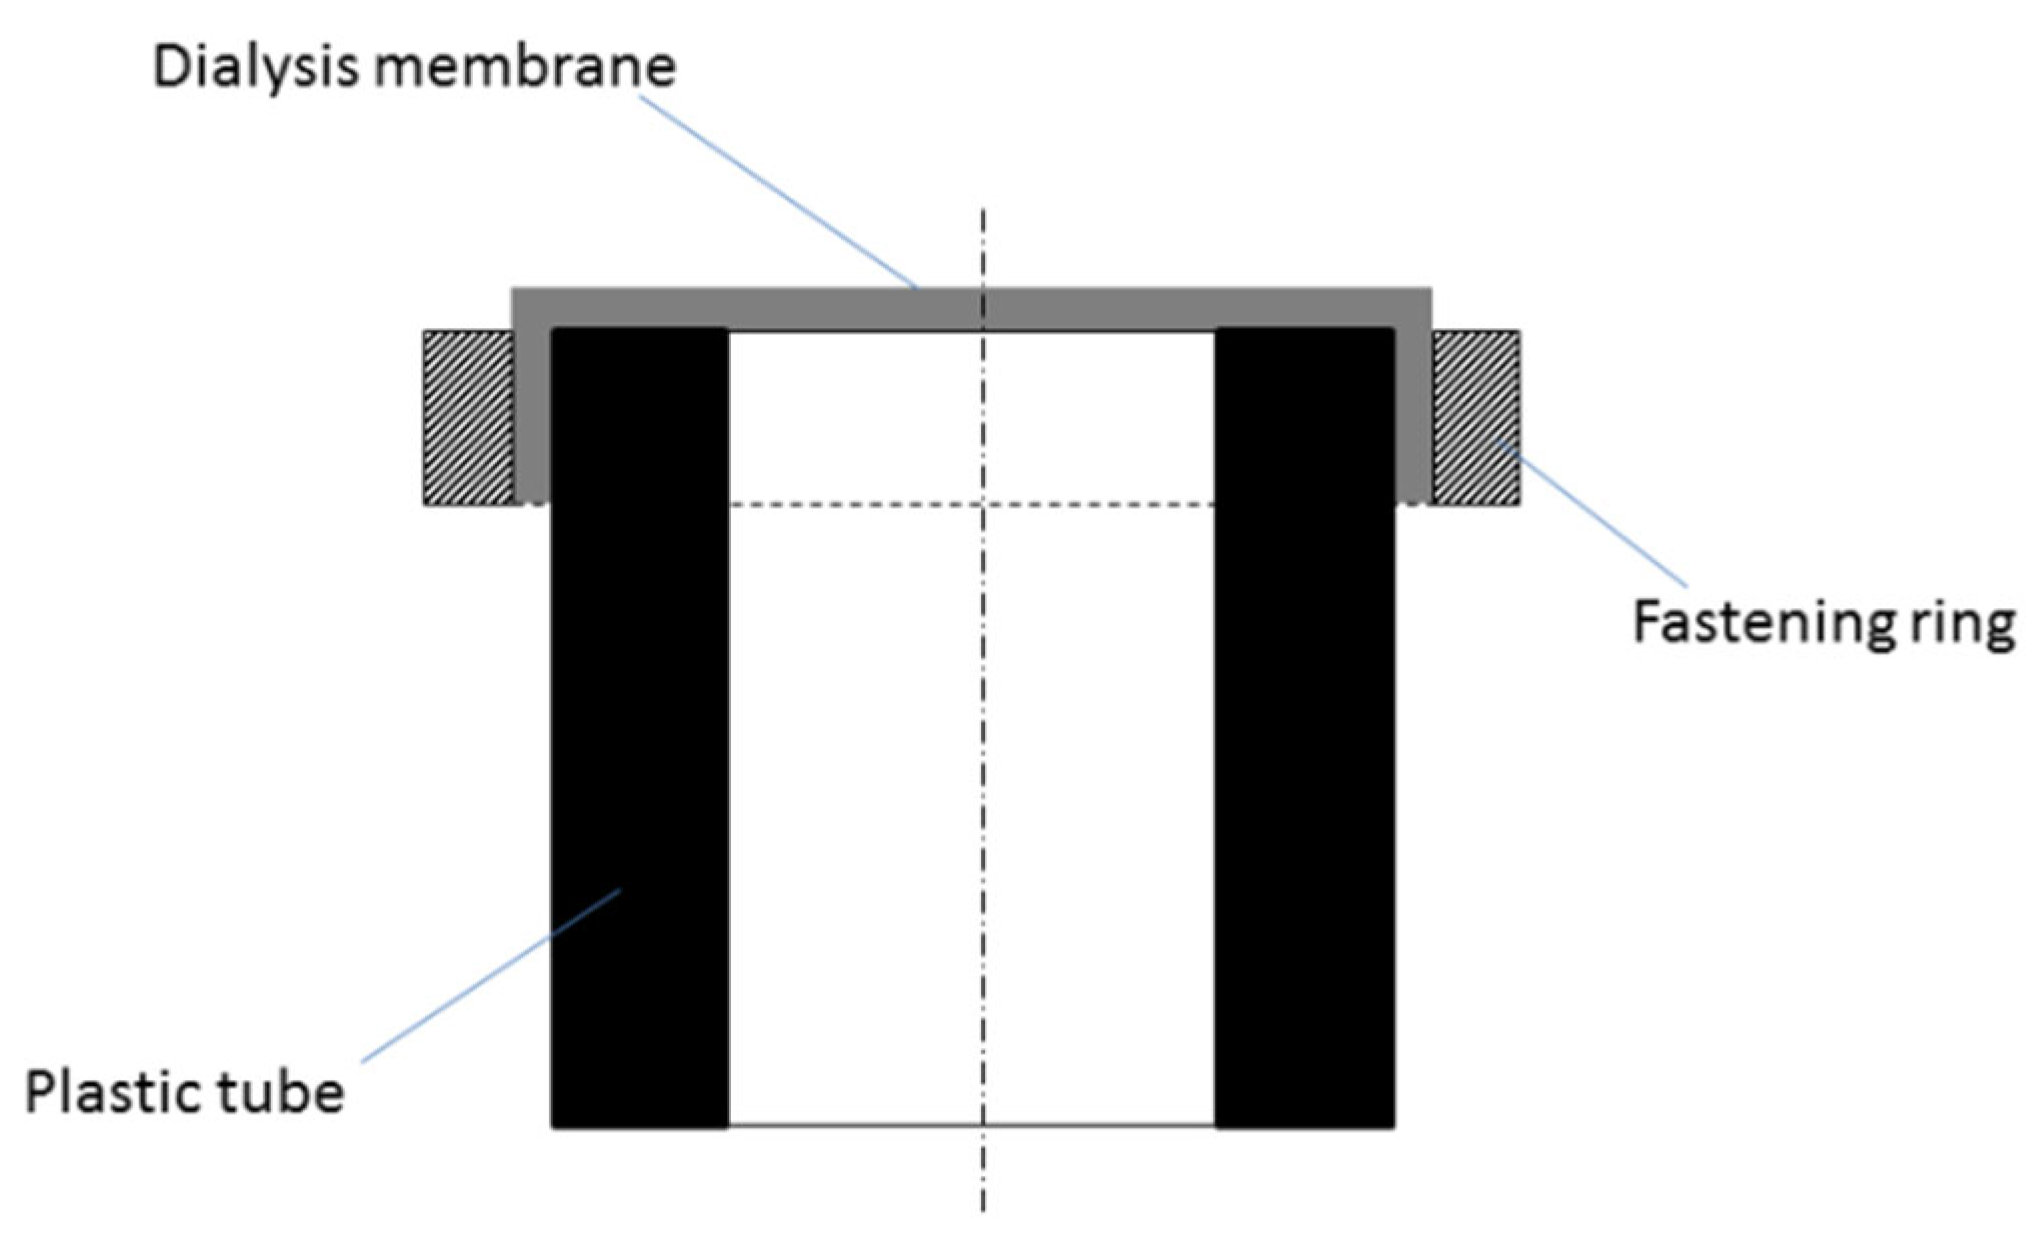
2.2. Membrane Device

Figure 1 shows a schematic diagram of the micro-volume dialysis device. It consisted of a piece of transparent PVC tube (2.8 mm inner diameter, 5 mm outer diameter and 5 mm length), over one of the open ends of which a piece of dialysis membrane was tightly held in place using a polypropylene fastening ring.

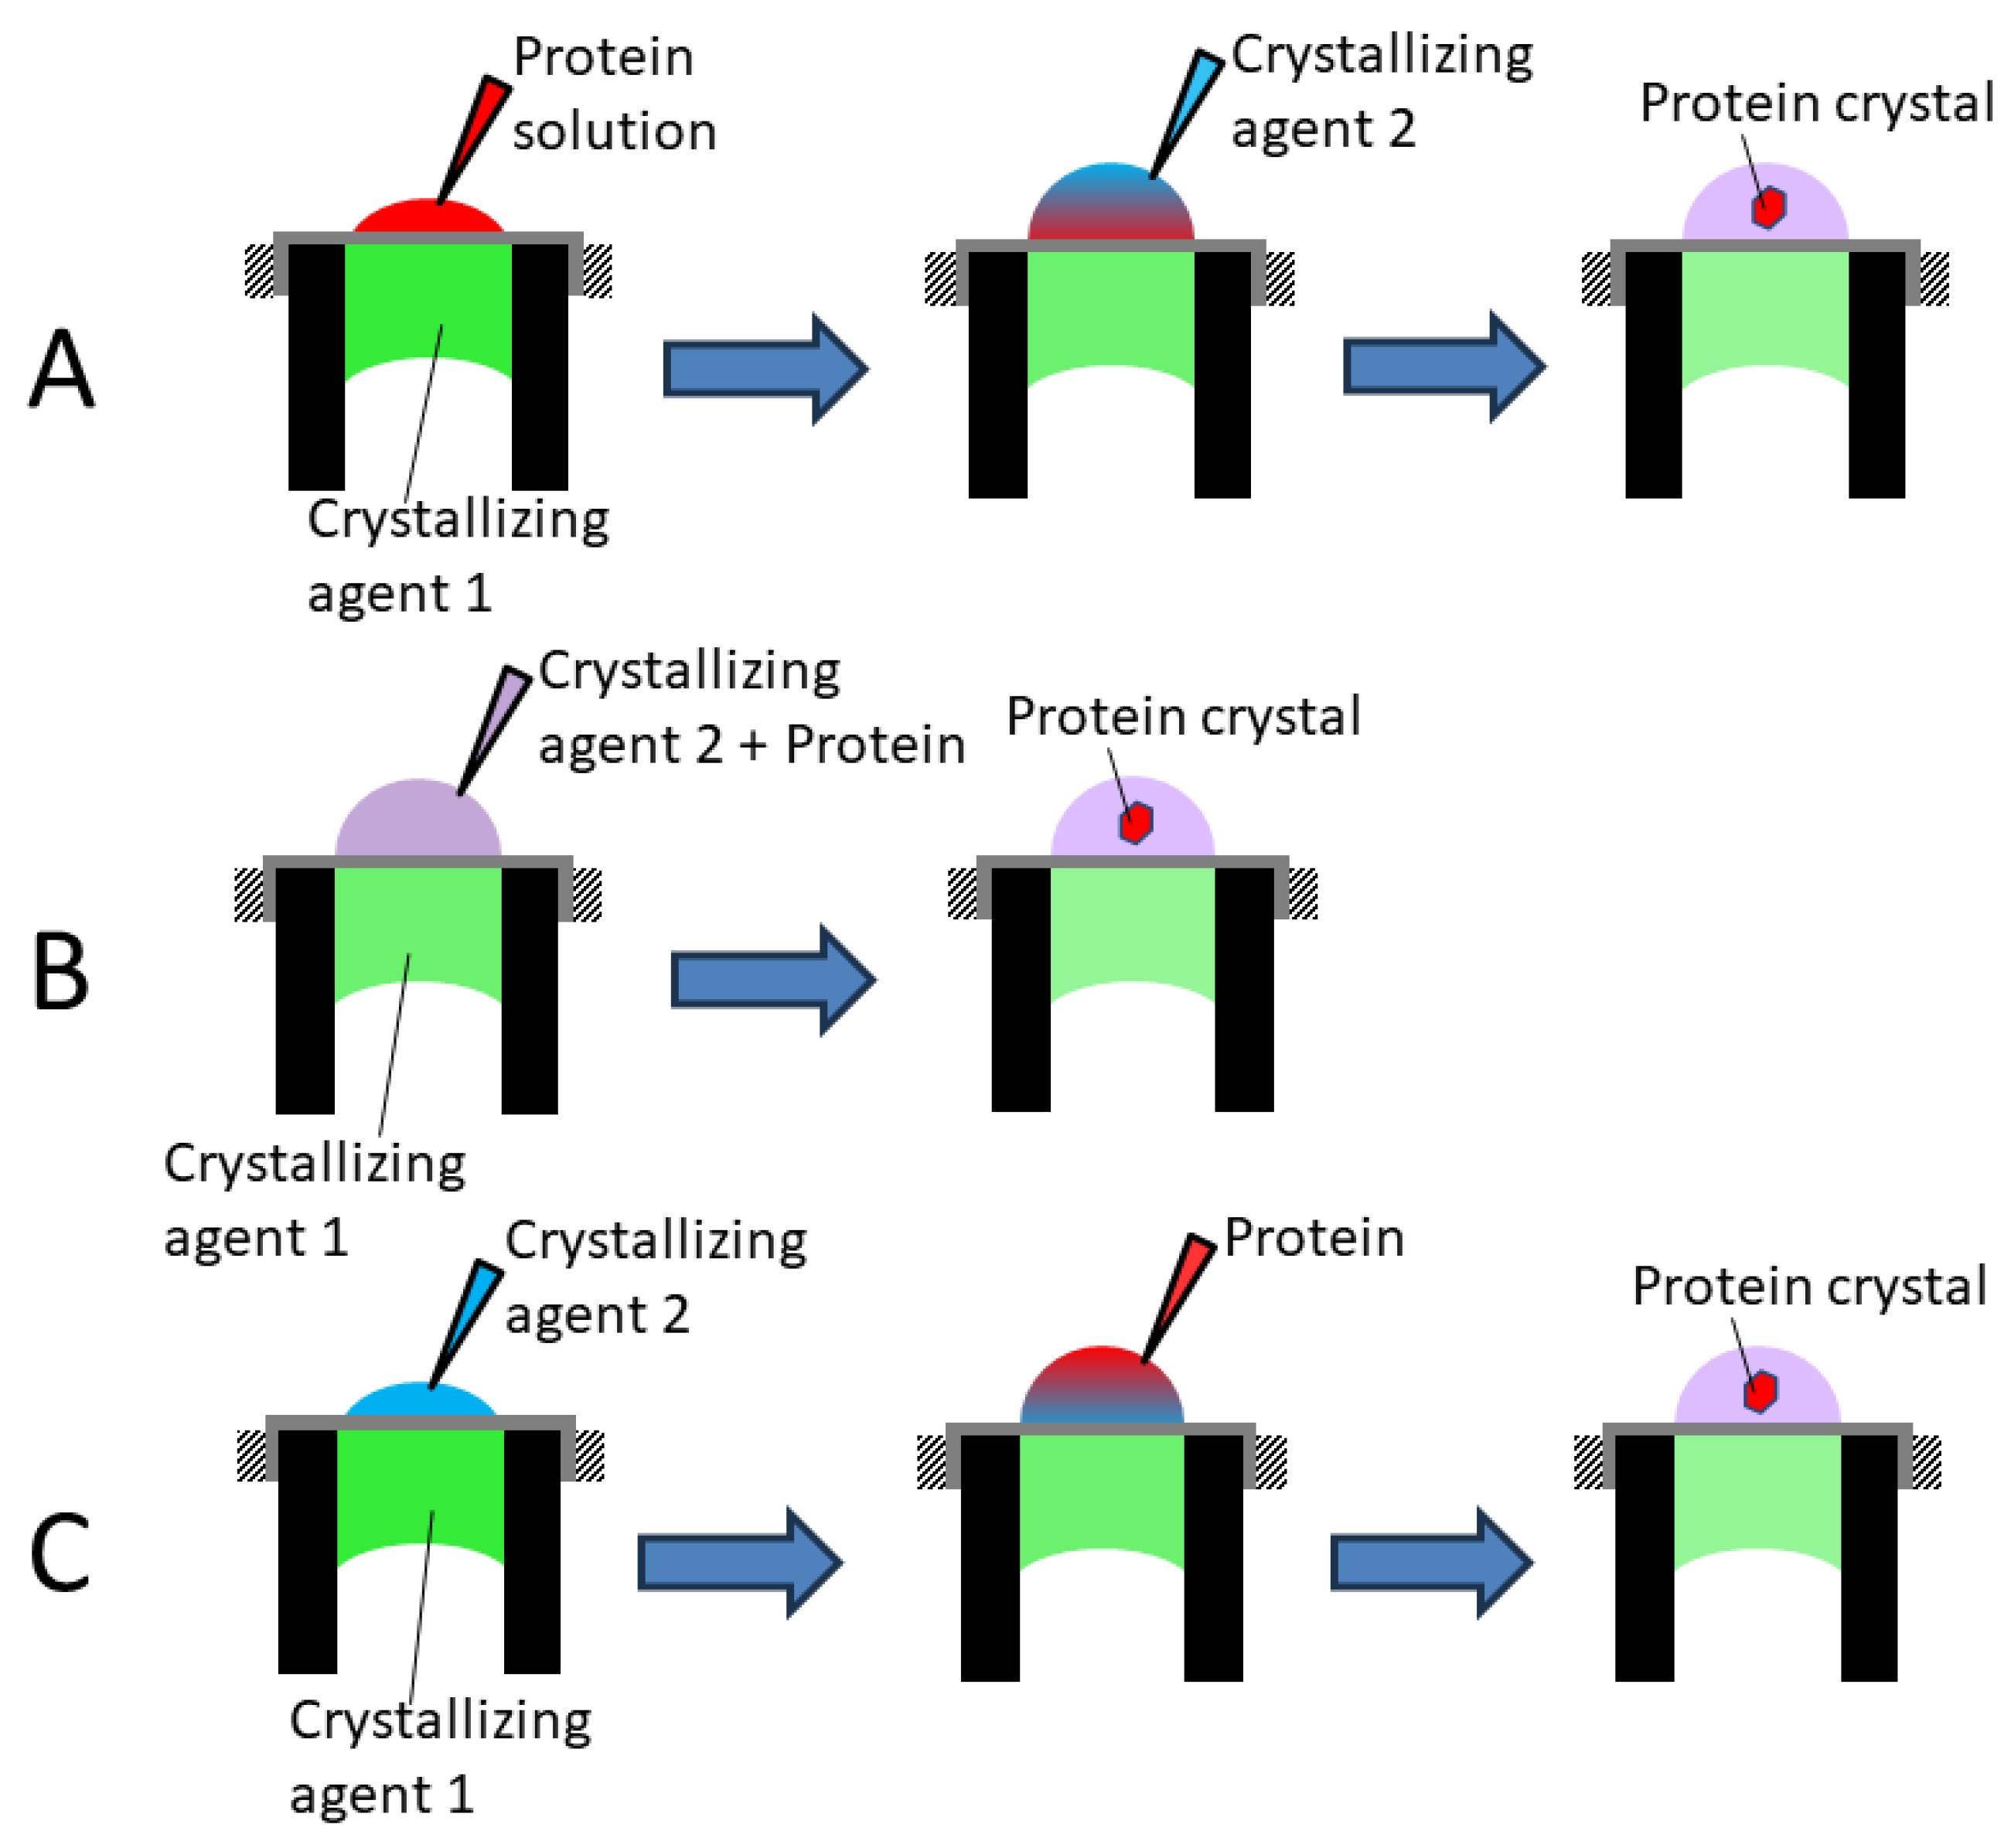
2.3. Lysozyme Crystallization

All crystallization experiments were carried out at room temperature, i.e., ~22 °C. Any solution or buffer stored in the refrigerator was equilibrated to room temperature before use. The sodium chloride and poly-ethylene glycol (PEG) solutions and the phosphate buffer used to prepare the protein solution were filtered through microfiltration membrane with a pore size of 0.22 μm. The lysozyme solution was centrifuged at 10,000 rpm for 15 min to remove particles. The dialysis membrane used was chosen such that sodium chloride could easily diffuse through, while PEG and lysozyme were largely retained. Preliminary experiments showed that the diffusion of PEG and lysozyme through the dialysis membrane was negligible. As a control experiment, all three components used for crystallization, i.e., protein, PEG and sodium chloride solutions, were mixed together, and a droplet of the mixture was placed on a glass slide and observed using a microscope. No crystallization was observed in this experiment. Figure 2 shows the main micro-volume crystallization protocol used in the current study (which will be referred to in the paper as protocol 1A). Sodium chloride solution (4 M, in water) was pipetted into the space below the dialysis membrane and was held in place within the tube, in contact with the bottom surface of the membrane, due to capillary action. A droplet of the lysozyme solution (50 mg/mL prepared in 20 mM sodium phosphate buffer, pH 6.5) was added on the top surface of the membrane, and observed using a light microscope (M5 Multi Phase 100, Swift, Carlsbad, CA, USA) as shown in Figure 3. A droplet of PEG solution (30% w/v, in water) was then gently layered over the protein droplet. The formation of lysozyme crystals could thereby be easily observed using the microscope. Images and video clips were obtained using the built-in digital camera. In protocols 1B and 1C, the sodium chloride solution was introduced below the membrane as described for protocol 1A. However, in protocol 1B, the protein and PEG solutions were pre-mixed, and a droplet of the resultant mixture was placed over the dialysis membrane. In protocol 1C, the order of addition of the protein and PEG solutions was reversed with respect to protocol 1A, i.e., PEG was added first. The volume of liquid on the two sides of the dialysis membrane could potentially change due to factors such as evaporation and osmotic flow. However, the duration of the crystallization experiments being small, these factors did not play any significant role.
Figure 4 shows the sequence of events in protocol 2 whereby lysozyme crystals were formed within the tube, i.e., below the membrane. The protein solution was first pipetted into the space below the membrane, and the PEG solution was gently layered over it. A droplet of sodium chloride solution was then added on top of the dialysis membrane.

3. Results and Discussions

Lysozyme was crystallized using protocol 1A with 20 μL of sodium chloride solution and 5 μL each of the protein and PEG solutions. The mass transport of sodium chloride took place through the dialysis membrane via pore diffusion while the transport of PEG took place via a combination of free-interface diffusion and fluid mixing. Despite attempts at gentle layering of the PEG solution over the protein solution, some degree of fluid mixing (convection) was unavoidable. Figure 5A,B show the images of tetragonal lysozyme crystals thus obtained at two different magnifications. These images were obtained 20 min after the start of the experiment, but the size of the larger crystals, which was less than 100 μm, did not change appreciably after 15 min. Figure 6A shows the lysozyme crystals obtained by adding 1 μL each of the lysozyme and PEG solutions on top of the membrane, the volume of sodium chloride solution in the tube below the membrane being kept fixed, i.e., 20 μL. These crystals were considerably smaller (less than 50 μm), with a large proportion of very small crystals. Figure 6B shows crystals obtained using 0.5 μL each of lysozyme and PEG solutions and 20 μL of sodium chloride solution. The crystal size decreased even further (~10 μm), but the sample under observation was more mono-dispersed.
In the above experiments, tiny specks indicative of forming crystals were observed over the membrane surface between 30 s and one minute. These in turn grew into clearly identifiable tetragonal lysozyme crystals in about 2 min. To track the initial growth of the crystals, images obtained during the first few minutes of experiments were analyzed. Figure 7A–F show frames obtained at 15, 30, 40, 90, 120 and 420 s respectively during micro-volume crystallization experiment carried out using 20 μL of sodium chloride solution and 5 μL each of the lysozyme and PEG solutions. The tiny specks (indicated by circles in Figure 7B) appeared 30 s after the start of the experiment. These became larger and could be clearly identified as lysozyme crystals at around 120 s. These results are quite significant in that such rapid formation of protein crystals and their direct observation via ordinary light microscopy has not been reported in the literature. Most papers on lysozyme crystallization report visible crystal formation within tens of minutes to several hours [9,15,16,17,18,30,31,34]. The rapid crystal formation using the micro-volume dialysis technique was due to the high degree of concentration heterogeneity in the droplet over the dialysis membrane, which resulted in extensive localized supersaturation. Supersaturated zones are thought to be a prime mover for nucleation and crystal growth [1,5,29,30,31,33,34]. This aspect has been explained in detail in a subsequent paragraph with the help of carefully designed control experiments.
Lysozyme crystals formed in the liquid droplet on top of the dialysis membrane continued to grow in size till about 15 min (see Figure 8A–F), after which the size of the larger crystals (~100 μm) did not increase appreciably. However, every now and then, new crystals were seen to form and these in turn grew in size. After 20–25 min, the crystals size distribution remained more or less unchanged, indicating exhaustion of protein molecules in the solution. Eventually, evaporation of water from the droplet resulted in formation of sodium chloride crystals.
In order to test the hypothesis that rapid crystal formation using protocol 1A was due to concentration inhomogeneity and the resultant localized supersaturation, an experiment was carried out using protocol 1B. A 20 μL quantity of lysozyme solution was mixed with 20 μL of PEG solution in a microfuge tube. The space below the membrane of a micro-volume dialysis device was filled with 20 μL of sodium chloride solution. A 10 μL droplet of the pre-mixed lysozyme-PEG solution was placed on top of the dialysis membrane. In terms of the overall quantity of material used, this experiment was therefore equivalent to that carried out using protocol 1A with 20 μL of sodium chloride solution and 5 μL each of the protein and PEG solutions. The main difference was with concentration heterogeneity, which was greater in protocol 1A. In the experiment carried out using protocol 1B, specks indicative of crystal formation were observed within around 4 to 6 min, while clearly identifiable lysozyme crystals were observed only after 7–15 min. Figure 9 shows crystals obtained after 20 min. The number of crystals was significantly lower, and these were considerably smaller in size than those obtained using protocol 1A (see Figure 5B and Figure 9 for comparison). Additionally, there was considerable variability in results obtained with protocol 1B, unlike with protocol 1A, which was highly reproducible. In some instances, no crystals could be obtained using protocol 1B, while crystals were consistently obtained in nearly the same length of time with protocol 1A. The above results clearly show that rapid lysozyme crystal formation with protocol 1A was a result of the high degree of controlled heterogeneity of the concentration of the different species involved in the process.
Figure 10 shows lysozyme crystals obtained after 20 min using protocol 1C (i.e., with the reverse order of PEG and protein addition) using 20 μL of sodium chloride solution and 5 μL each of PEG and protein solutions. The crystals were smaller than those obtained with protocol 1A but still considerably larger than those obtained using protocol 1B. Additionally, the tiny specks indicative of crystal formation could be observed in less than a minute, and clearly defined lysozyme crystals could be seen in 3–4 min. Once again, these results point to the role of concentration heterogeneity in rapid crystal formation. However, the difference in results obtained using protocols 1A and 1C also underline the importance of the relative initial location of the protein and PEG solutions in the droplet atop the surface of the dialysis membrane.
Crystallization experiments were carried out using protocol 2 by adding 5 μL each of protein and PEG solutions, respectively, below the dialysis membrane, followed by the addition of a 10 μL sodium chloride solution droplet on top of the membrane. Unlike with protocols 1A–C, the early phase of lysozyme crystallization was difficult to observe as the phenomenon was happening below the membrane. Even though the dialysis membrane was reasonably transparent, the images of the crystals obtained by “looking through” the membrane were considerably inferior. However, once large-enough crystals were formed, these could be clearly observed (see Figure 11A). After 20 min, the sodium chloride solution remaining on top of the membrane was blotted dry, and the membrane device was flipped over, i.e., with the membrane facing the bottom. The crystals formed in the solution within the tube could then be seen from the open end (see Figure 11B). A comparison of Figure 5 and Figure 11 clearly shows that protocol 1A was superior to protocol 2. The superiority was in terms of the crystallization process itself (i.e., size and number of crystals obtained), as well as in terms of the ability to observe the crystals being formed. Additionally, as mentioned earlier, the early phase of crystal formation could not be monitored. However, protocol 2 would be valuable for proteins that crystallize slowly since evaporation of water from the protein droplet could potentially become an issue with protocols 1A–C. With the protein crystallizing within the tube, loss of water due to evaporation would be considerably less severe. For very slowly crystallizing proteins, the open end of the tube could easily be sealed up with an adhesive tape or by using other means, and evaporation could thereby be minimized. Additionally, protocol 2 opens up the possibility for sequentially dosing the protein solution with multiple crystallizing agents through the membrane.
Figure 12 depicts the effects of additives on the nature and extent of lysozyme crystallization. Figure 12A–C show the lysozyme crystals formed by adding sodium thiosulphate, copper sulphate and the protein cytochrome C respectively as additives. The presence of sodium thiosulphate slowed down the crystallization process quite significantly, but the lysozyme crystals formed appeared regular, i.e., similar to those formed in the absence of sodium thiosulphate. The addition of copper sulphate sped up crystal formation but gave rise to irregularly shaped crystals. On the other hand, addition of cytochrome C led to severe inhibition of lysozyme crystal formation. Quite clearly, the effects of additives on crystal formation could be very easily studied using the proposed micro-volume dialysis method.
Future work will focus on using this micro-volume dialysis technique for crystallizing difficult-to-crystallize proteins. The device used in the current study is simple and inexpensive. It could easily be multiplexed in a plate format, with multiple membranes in different types of arrays. Moreover, the protocol used for micro-volume dialysis is very simple, merely involving a series of sample pipetting. Therefore, a multiplexed device, compatible with automated multi-well pipetting systems that are now widely available, could be easily used for high-throughput crystallization experiments. Additionally, as shown in the current study, the micro-volume dialysis method is suitable for very small sample volumes, the lower limit being determined by the pipetting capability, and perhaps evaporation.

4. Conclusions

The results discussed in the paper clearly demonstrate that lysozyme could be very rapidly crystallized using a simple micro-volume dialysis method. The device used was inexpensive to make and had a very simple design, and is potentially suitable for multiplexing. The growth of crystals could be easily monitored in real time. Formation of crystals could be observed as early as 30 s, and clearly defined tetragonal lysozyme crystals were obtained in 2 min. Concentration heterogeneity affected both the extent and speed of lysozyme crystallization. The relative initial location of lysozyme and PEG solutions also had a significant effect on crystallization. Depending on the specific requirement, a protein could be crystallized either on top of the dialysis membrane or below it, i.e., within the tube using the micro-volume dialysis method. The method is amenable to both miniaturization and automation and therefore suitable for high-speed, high-throughput screening.

Funding

This research was funded by The Natural Science and Engineering Research Council (NSERC) of Canada, Discovery Grant.

Data Availability Statement

Data will be available on reasonable request.

Acknowledgments

This work is supported by the Natural Science and Engineering Research Council (NSERC) of Canada.

Conflicts of Interest

The author declares no conflict of interest.

References

  1. Hoffman, I.D. Protein crystallization for structure-based drug design. In Structure-Based Drug Discovery; Humana Press: Totowa, NJ, USA, 2012; pp. 67–91. [Google Scholar]
  2. Fraser, J.S.; van den Bedem, B.H.; Samelson, A.J.; Lang, P.T.; Holton, J.M.; Echols, N.; Alber, T. Accessing protein conformational ensembles using room-temperature X-ray crystallography. Proc. Natl. Acad. Sci. USA 2011, 108, 16247–16252. [Google Scholar] [CrossRef] [PubMed]
  3. Jacobson, K.A.; Kenneth, A.; Costanzi, S. New insights for drug design from the X-ray crystallographic structures of G-protein-coupled receptors. Mol. Pharmacol. 2012, 82, 361–371. [Google Scholar] [CrossRef] [PubMed] [Green Version]
  4. McPherson, A. Introduction to protein crystallization. Methods 2004, 34, 254–265. [Google Scholar] [CrossRef] [PubMed] [Green Version]
  5. McPherson, A.; Gavira, J.A. Introduction to protein crystallization. Acta Crystallogr. Sect. F Struct. Biol. Commun. 2014, 70, 2–20. [Google Scholar] [CrossRef] [Green Version]
  6. Khurshid, S.; Saridakis, E.; Govada, L.; Chayen, N.E. Porous nucleating agents for protein crystallization. Nat. Protoc. 2014, 9, 1621–1633. [Google Scholar] [CrossRef]
  7. Garman, E.F. Developments in X-ray crystallographic structure determination of biological macromolecules. Science 2014, 343, 1102–1108. [Google Scholar] [CrossRef]
  8. McPherson, A. Crystallization of Biological Macromolecules; Cold Spring Harbor Laboratory Press: Cold Spring Harbor, NY, USA, 1999. [Google Scholar]
  9. Santarsiero, B.D.; Yegian, D.T.; Lee, C.C.; Spraggon, G.; Gu, J.; Scheibe, D.; Uber, D.C.; Cornell, E.W.; Nordmeyer, R.A.; Kolbe, W.F.; et al. An approach to rapid protein crystallization using nanodroplets. J. Appl. Crystallogr. 2002, 35, 278–281. [Google Scholar] [CrossRef]
  10. Stevens, R.C. High-throughput protein crystallization. Curr. Opin. Struct. Biol. 2000, 10, 558–563. [Google Scholar] [CrossRef]
  11. Chayen, N.E. High-throughput protein crystallization. Adv. Protein Chem. Struct. Biol. 2009, 77, 1–22. [Google Scholar]
  12. Zheng, B.; Roach, L.S.; Ismagilov, R.F. Screening of protein crystallization conditions on a microfluidic chip using nanoliter-size droplets. J. Am. Chem. Soc. 2003, 125, 11170–11171. [Google Scholar] [CrossRef] [Green Version]
  13. Leng, J.; Salmon, J.B. Microfluidic crystallization. Lab Chip 2009, 9, 24–34. [Google Scholar] [CrossRef] [PubMed]
  14. Dhouib, K.; Malek, C.K.; Pfleging, W.; Gauthier-Manuel, B.; Duffait, R.; Thuillier, G.; Ferrigno, R.; Jacquamet, L.; Ohana, J.; Ferrer, J.L.; et al. Microfluidic chips for the crystallization of biomacromolecules by counter-diffusion and on-chip crystal X-ray analysis. Lab Chip 2009, 9, 1412–1421. [Google Scholar] [CrossRef] [PubMed]
  15. Wang, L.; Sun, K.; Hu, X.; Li, G.; Jin, Q.; Zhao, J. A Centrifugal Microfluidic Device for Screening Protein Crystallization Conditions by Vapor Diffusion. Sens. Actuators B Chem. 2015, 219, 105–111. [Google Scholar] [CrossRef]
  16. Weber, P.; Pissis, C.; Navaza, R.; Mechaly, A.E.; Saul, F.; Alzari, P.M.; Haouz, A. High-throughput crystallization pipeline at the crystallography core facility of the institut Pasteur. Molecules 2019, 24, 4451. [Google Scholar] [CrossRef] [Green Version]
  17. Sutanto, F.; Shaabani, S.; Oerlemans, R.; Eris, D.; Patil, P.; Hadian, M.; Wang, M.; Sharpe, M.E.; Groves, M.R.; Dömling, A. Combining High-Throughput Synthesis and High-Throughput Protein Crystallography for Accelerated Hit Identification. Angew. Chem. 2021, 133, 18379–18387. [Google Scholar] [CrossRef]
  18. Blay, V.; Tolani, B.; Ho, S.P.; Arkin, M.R. High-throughput screening: Today’s biochemical and cell-based approaches. Drug Discov. Today 2020, 25, 1807–1821. [Google Scholar] [CrossRef]
  19. Hirata, K.; Yamashita, K.; Ueno, G.; Kawano, Y.; Hasegawa, K.; Kumasaka, T.; Yamamoto, M. ZOO: An automatic data-collection system for high-throughput structure analysis in protein microcrystallography. Acta Crystallogr. Sect. D Struct. Biol. 2019, 75, 138–150. [Google Scholar] [CrossRef] [Green Version]
  20. Kim, Y.; Jedrzejczak, R.; Maltseva, N.I.; Wilamowski, M.; Endres, M.; Godzik, A.; Michalska, M.; Joachimiak, A. Crystal structure of Nsp15 endoribonuclease NendoU from SARS-CoV-2. Protein Sci. 2020, 29, 1596–1605. [Google Scholar] [CrossRef]
  21. Tyler, A.R.; Ragbirsingh, R.; McMonagle, C.J.; Waddell, P.G.; Heaps, S.E.; Steed, J.W.; Thaw, P.; Hall, M.J.; Probert, M.R. Encapsulated nanodroplet crystallization of organic-soluble small molecules. Chem 2020, 6, 1755–1765. [Google Scholar] [CrossRef]
  22. Junius, N.; Jaho, S.; Sallaz-Damaz, Y.; Borel, F.; Salmon, J.B.; Budayova-Spano, M. A microfluidic device for both on-chip dialysis protein crystallization and in situ X-ray diffraction. Lab. Chip 2020, 20, 296–310. [Google Scholar] [CrossRef] [Green Version]
  23. He, J.; Zhou, J.; Dong, J.; Su, Z.; Huang, L. Revealing the effects of microwell sizes on the crystal growth kinetics of active pharmaceutical ingredients by deep learning. Chem. Eng. J. 2022, 428, 131986. [Google Scholar] [CrossRef]
  24. Yang, H.; Chen, W.; Peczulis, P.; Heng, J.Y.Y. Development and workflow of a continuous protein crystallization process: A case of lysozyme. Cryst. Growth Des. 2019, 19, 983–991. [Google Scholar] [CrossRef]
  25. Lieske, J.; Cerv, M.; Kreida, S.; Komadina, D.; Fischer, J.; Barthelmess, M.; Fischer, P. On-chip crystallization for serial crystallography experiments and on-chip ligand-binding studies. IUCrJ 2019, 6, 714–728. [Google Scholar] [CrossRef] [PubMed] [Green Version]
  26. Aherne, M.; Lyons, J.A.; Caffrey, M. A fast, simple and robust protocol for growing crystals in the lipidic cubic phase. J. Appl. Crystallogr. 2012, 45, 1330–1333. [Google Scholar] [CrossRef] [Green Version]
  27. Tanaka, S.; Ito, K.; Hayakawa, R.; Ataka, M. Size and number density of precrystalline aggregates in lysozyme crystallization process. J. Chem. Phys. 1999, 111, 10330–10337. [Google Scholar] [CrossRef]
  28. Yang, C.G.; Liu, Y.H.; Di, Y.D.; Xu, Z.R. Generation of two-dimensional concentration-gradient droplet arrays on a two-layer chip for screening of protein crystallization conditions. Microfluid. Nanofluidics 2015, 18, 493–501. [Google Scholar] [CrossRef]
  29. Hayashi, Y.; Maruyama, M.; Yoshimura, M.; Okada, S.; Yoshikawa, H.Y.; Sugiyama, S.; Adachi, H.; Matsumura, H.; Inoue, T.; Takano, K.; et al. Spiral growth can enhance both the normal growth rate and quality of tetragonal lysozyme crystals grown under a forced solution flow. Cryst. Growth Des. 2015, 15, 2137–2143. [Google Scholar] [CrossRef]
  30. Liu, Y.; Wang, X.; Ching, C.B. Toward further understanding of lysozyme crystallization: Phase diagram, protein–protein interaction, nucleation kinetics, and growth kinetics. Cryst. Growth Des. 2010, 10, 548–558. [Google Scholar] [CrossRef]
  31. Saikumar, M.V.; Glatz, C.E.; Larson, M.A. Lysozyme crystal growth and nucleation kinetics. J. Cryst. Growth 1998, 187, 277–288. [Google Scholar] [CrossRef]
  32. Ielasi, F.S.; Hirtz, M.; Sekula-Neuner, S.; Laue, T.; Fuchs, H.; Willaert, R.G. Dip-Pen Nanolithography-Assisted Protein Crystallization. J. Am. Chem. Soc. 2014, 137, 154–157. [Google Scholar] [CrossRef]
  33. Akella, S.V.; Mowitz, A.; Heymann, M.; Fraden, S. Emulsion-Based Technique To Measure Protein Crystal Nucleation Rates of Lysozyme. Cryst. Growth Des. 2014, 14, 4487–4509. [Google Scholar] [CrossRef]
  34. Neugebauer, P.; Khinast, J.G. Continuous Crystallization of Proteins in a Tubular Plug-Flow Crystallizer. Cryst. Growth Des. 2015, 15, 1089–1095. [Google Scholar] [CrossRef] [PubMed]
  35. Ghosh, R. An osmolyte-based micro-volume ultrafiltration technique. Lab. Chip 2014, 14, 4559–4566. [Google Scholar] [CrossRef] [PubMed]
  36. Görisch, H. Drop dialysis: Time course of salt and protein exchange. Anal. Biochem. 1988, 173, 393–398. [Google Scholar] [CrossRef]
Figure 1. Schematic diagram (not to scale) of micro-volume dialysis device.
Processes 11 02148 g001
Figure 2. Sequence of events in protocol 1A (A), 1B (B) and 1C (C) used for protein crystallization.
Processes 11 02148 g002
Figure 3. Figure showing micro-volume dialysis device on the stage of a light microscope.
Processes 11 02148 g003
Figure 4. Sequence of events in protocol 2 used for protein crystallization.
Processes 11 02148 g004
Figure 5. Lysozyme crystals obtained after 20 min using protocol 1A with 20 μL of sodium chloride solution and 5 μL each of the protein and PEG solutions. (A) Low magnification. (B) High magnification.
Processes 11 02148 g005
Figure 6. Lysozyme crystals obtained after 20 min using protocol 1A with (A) 20 μL of sodium chloride solution and 1 μL each of the protein and PEG solutions; (B) 20 μL of sodium chloride solution and 0.5 μL each of the protein and PEG solutions.
Processes 11 02148 g006
Figure 7. Images obtained during the first few minutes of lysozyme crystallization carried out using protocol 1A with 20 μL of sodium chloride solution and 5 μL each of the lysozyme and PEG solutions ((A) 15 s, (B) 30 s, (C) 40 s, (D) 90 s, (E) 120 s, (F) 420 s).
Processes 11 02148 g007
Figure 8. Images obtained between minutes 5 and 15 during the lysozyme crystallization experiment carried out using protocol 1A with 20 μL of sodium chloride solution and 5 μL each of the lysozyme and PEG solutions ((A) 5 min, (B) 7 min, (C) 9 min, (D) 11 min, (E) 13 min, (F) 15 min).
Processes 11 02148 g008
Figure 9. Lysozyme crystals obtained after 20 min using protocol 1B with 20 μL of sodium chloride solution and 10 μL of pre-mixed protein and PEG solution.
Processes 11 02148 g009
Figure 10. Lysozyme crystals obtained after 20 min using protocol 1C with 20 μL of sodium chloride solution and 5 μL each of the protein and PEG solutions.
Processes 11 02148 g010
Figure 11. Lysozyme crystals obtained after 20 min using protocol 2 with 5 μL each of the protein and PEG solutions and 10 μL of sodium chloride solution ((A) Image obtained through the membrane. (B) Image obtained from the open end of the device).
Processes 11 02148 g011
Figure 12. Effects of additives on lysozyme crystallization ((A) Sodium thiosulphate added; (B) Copper sulphate added; (C) cytochrome C added. In each case, 5 μL each of lysozyme and PEG solutions and 2 μL of additive solutions were added to the top on the membrane, and 10 μL of sodium chloride solution was added to the reservoir).
Processes 11 02148 g012
Disclaimer/Publisher’s Note: The statements, opinions and data contained in all publications are solely those of the individual author(s) and contributor(s) and not of MDPI and/or the editor(s). MDPI and/or the editor(s) disclaim responsibility for any injury to people or property resulting from any ideas, methods, instructions or products referred to in the content.

