Abstract
Weld shapes significantly impact nozzle safety, and a number of accidents have occurred due to nozzle cracking. In order to improve weld safety and reveal the effect of weld shape on the temperature field of nozzle flowmeters, this study established four types of welds, with ten different weld shapes. Through numerical calculation, the effect of the weld shape on the temperature field in the solid domain was systematically studied when the flowmeter was passed through high-temperature gas. The results show that the taper angle and taper opening of the weld metal had a certain effect on the temperature distribution of the flowmeter, while the distance between the weld metal and eight-slot nozzle and the bottom width of the weld metal had little effect on the temperature distribution. The type C weld shapes of type III and type IV led to a sizeable high-temperature area at the junction of the weld metal and eight-slot nozzle, and the maximum temperatures of monitoring path 2 reached 689.54 °C and 693.29 °C. This study explored the temperature field distribution law under different weld shapes and parameters, providing guidance and serving as a reference for later engineering applications, and it has some significance in improving the safety of nozzle flowmeter welds and pipelines.
1. Introduction
Nozzle flowmeters are widely used in industrial production. As the fluid flows through the nozzle, there is a static pressure difference between the upstream and downstream of the nozzle. Based on the static pressure difference, the nozzle flowmeter has the ability to detect the flow rate [1]. At present, many researchers [1,2,3,4,5,6,7,8,9,10,11,12,13,14,15,16,17,18,19,20] have studied the internal flows and external characteristics of various types of flowmeters under different conditions from different aspects, and some researchers [21,22,23,24,25] have designed more suitable new flowmeters because of the limitations of the operating environment and the shortcomings of existing flowmeters.
Lua et al. [2] studied the flow characteristics of a target fluid flowmeter based on jet oscillation through experiments and numerical simulations and determined the best position to place the sensor. Zhang et al. [1] numerically simulated the thermal effects of nozzle flowmeters at five different inner-wall temperatures. It was found that the thermal stress and thermal deformation value in the pressure taps and inlet and outlet areas increased with the increase in wall temperature. Tong et al. [3] calculated the fluid–solid coupling of thermal effects and flow fields of nozzle flowmeters at four different flows and five different inner-wall temperatures. The results showed that the heat transfer effect decreased with the increase in flow rate and inner-wall temperature. Tong et al. [4] calculated the thermal characteristics of a small-nozzle flowmeter to convey media at different temperatures based on the finite element method. The results showed obvious temperature stratification near the inner wall when transporting a high-temperature medium. The heat flow at the flowmeter’s inlet and outlet increased with the medium temperature increase. Huang et al. [5] conducted an experimental study on the discharge coefficient of a perforated orifice flowmeter under different orifice thicknesses, porosities, and hole distributions. Compared with standard orifice plates, it was found that perforated orifice flowmeters have larger discharge coefficients, smaller critical Reynolds numbers, and stronger anti-disturbance ability. Kolodzie et al. [6] studied the influence of structural parameters such as hole diameter, pitch, and thickness on an orifice flowmeter through experiments and explored the relationship between structural parameters and the discharge coefficient. Kim et al. [7] investigated the effect of cavitation and plate thickness on small-diameter-ratio orifice flowmeters. The results showed that cavitation within the range of test plate thickness and Reynolds number did not affect the discharge coefficient. Zhang et al. [8] studied the influence of velocity profiles on the propagation time of ultrasonic waves and proposed a theoretical correction factor to improve the measurement accuracy. The results showed that the proposed correction factors were in good agreement with the measured correction factors. Džemić [9] studied a turbine flowmeter’s acceleration and deceleration performance in a transitional flow state. The results showed that the turbine flowmeter had a good dynamic response in accelerated flow but a long response delay in decelerated flow. Guo et al. [10] studied the effect of viscosity on the performance of a turbine flowmeter through experiments and numerical simulations. They obtained the variation curves of the meter factor and linearity error and the three-dimensional internal flow field. The results showed that with the increase in viscosity, the average meter factor of the turbine flowmeter decreased, and the linearity error increased; meanwhile, the change in fluid viscosity also affected the pressure distribution of the rotor blades. Lee et al. [11] investigated the effect of density and Reynolds number on the performance of turbine flowmeters to provide a reference for instrument selection and performance prediction when measuring gases in other operating environments. Jepson et al. [12] investigated the effect of upstream velocity distribution on turbine flowmeter registration and proposed a theoretical model. Via experimental verification, the theoretical results were in good agreement with the experimental results. Enz [13] investigated the effect of asymmetric actuator and detector positions on the Coriolis flowmeter and measured phase shifts, and they found that both force and detector position asymmetries would lead to measurement errors. Shavrina et al. [14] numerically studied the Coriolis flowmeter under various models with different gas volume fractions and flow conditions and verified it with experimental results. The study showed that the gas distribution asymmetry increased with increasing gas volume fraction and decreasing mixing flow rate and that the error of the Coriolis flowmeter was mainly caused by the asymmetry of the gas distribution. Bobovnik et al. [15] conducted numerical simulations of a Coriolis flowmeter under different flow conditions. They investigated the effect of fully developed flow, asymmetry flow, and swirl flow on the flowmeter performance. The results showed that the fluid in the measuring tube was affected by vibration, and the rate of profile distortion caused by tube vibration was inversely proportional to the through-flow Reynolds number and increased with the increase in the tube diameter. Singh et al. [16] performed an experimental study on the performance characteristics of a V-cone flowmeter with different diameter ratios under different upstream water flow disturbance conditions. The study showed that the flow coefficients of the V-cone flowmeter were independent of the Reynolds number; the discharge coefficient was not affected when the generation of upstream water disturbance was far away, and the effect on the discharge coefficient was less when the upstream water disturbance was closer. Ifft et al. [17] studied the effect of pipe elbows on V-cone flowmeters and found that V-cone flowmeters are more sensitive to upstream elbows than typical orifice plate flowmeters. Singh et al. [18] investigated the effect of top angle and upstream swirl on the performance characteristics of cone flowmeters. It was found that the discharge coefficient decreased with increasing top angle, and the size of the upstream swirl minimally influenced the discharge coefficient. Zheng et al. [19] investigated the effect of transducers on ultrasonic flowmeters via numerical simulations and compared them with experiments. The results showed that the negative measurement error was related to the negative velocity generated by the protruding and recess positions, and the measurement error was smaller for the protruding transducer than for the cryptic one. Kang et al. [20] investigated the effect of ultrasonic noise produced by pressure control valves on ultrasonic gas flowmeters. It was found that with the increase in ultrasonic noise level, the ratio of the useful signal to the interfering signal of an ultrasonic flowmeter decreased near the pressure control valve. Chen et al. [21] proposed a new multipath ultrasonic gas flowmeter based on the transit-time technique, which can realize real-time and accurate flow detection. Leontidis et al. [22] designed an ultrasonic flowmeter for low-temperature conditions and experimentally verified it in stable and unstable flow conditions. The results showed that the flowmeter can accurately measure flow and fluctuation. Shaaban [23] proposed and optimized a novel constriction-type flowmeter. Compared with other flowmeters, the new flowmeter takes up less space and has less pressure loss. Oh et al. [24] proposed a new portable multi-nozzle flowmeter, which has the advantages of simple operation and accurate measurement. Chen et al. [25] designed a new ultrasonic gas flowmeter and proposed a new data-filtering algorithm combining the Kalman filtering algorithm and arithmetic average algorithm. The results showed that after data filtering, the system’s measurement accuracy was higher, and the comprehensive measurement performance was higher.
To sum up, literature has been published on various types of flowmeters for systematic studies, such as nozzle flowmeters [1,3,4,24], orifice flowmeters [5,6,7], turbine flowmeters [9,10,11,12], Coriolis flowmeters [13,14,15], V-cone flowmeters [16,17], and ultrasonic flowmeters [8,20,21,22,25].Through this research, researchers have revealed the internal flow characteristics and external characteristics of each flowmeter, improved the measurement accuracy of the flowmeter, and lifted the environmental restrictions on using flowmeters. However, it was found that the effect of different weld shapes on the temperature field within the solid domain of the nozzle flowmeter has yet to be studied. This study uses the numerical simulation method for a nozzle flowmeter to carry out numerical calculations to determine the effect of different weld shapes on the temperature field, hoping to master the distribution characteristics of the temperature field under different weld shapes to provide a reference for the safe and reliable design of a nozzle flowmeter.
2. Numerical Model and Method
2.1. Flowmeter Model
A nozzle flowmeter mainly consists of a front measuring tube, rear measuring tube, nozzle, and weld metal. The flowmeter structure is shown in Figure 1, and detailed geometric parameters have been reported by previous researchers [3]. The measuring tube is divided into front and rear measuring tubes, which are connected by the eight-slot nozzle and weld metal. The material of the front and rear measuring tubes is 12Cr1MoV, the material of the eight-slot nozzle is structural steel, and the material of the weld metal is tin. The detailed attributes are shown in Table 1.

Figure 1.
Overall structure [3]: (a) real products; (b) basic structure.

Table 1.
Material attributes [26].
2.2. Numerical Simulation Method
Three-dimensional modeling of the components of the nozzle flowmeter with the structure is shown in Figure 2a. ICEM 16.0 software was used to divide the meshes, all adopting well-adapted unstructured tetrahedral mesh and completed mesh independence verification [3]. The mesh numbers of the front measuring tube, rear measuring tube, eight-slot nozzle, and weld metal domain in the original structure of the flowmeter were 63,875, 63,872, 1,424,041 and 38,623, respectively, and the total mesh number was 1,590,411. The mesh division result is shown in Figure 2b. The numerical calculation of the nozzle flowmeter structure domain was completed using ANSYS Workbench 16.0, a finite element analysis software for solid fields.

Figure 2.
Solid structure and flow field calculation domain schematic: (a) flowmeter structure; (b) solid-field domain mesh.
2.3. Calculation Scheme
In this study, the measuring medium was 700 °C air medium; that is, the temperature of the inner wall was 700 °C. The flowmeter was in the normal temperature environment; that is, the outer wall was 22 °C. There were four kinds of weld shapes (I–IV) in the calculation model in this study, and each weld mechanism had three parameter combinations. The structural parameters of the welds are shown in Figure 3, Figure 4, Figure 5 and Figure 6.
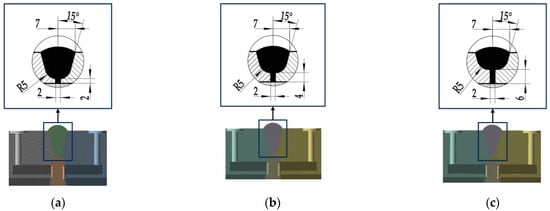
Figure 3.
Type I weld shape: (a) type a; (b) type b; (c) type c.
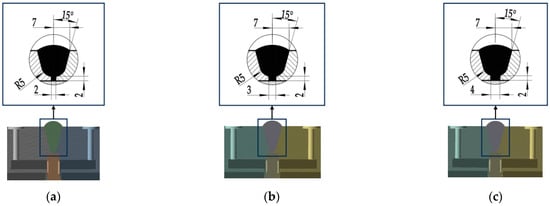
Figure 4.
Type II weld shape: (a) type a; (b) type b; (c) type c.
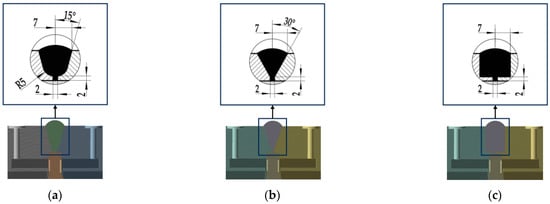
Figure 5.
Type III weld shape: (a) type a; (b) type b; (c) type c.
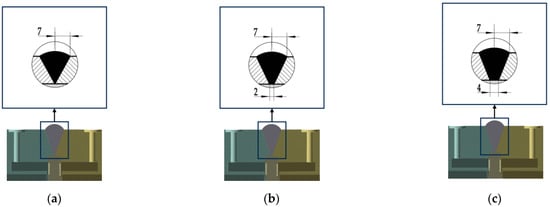
Figure 6.
Type IV weld shape: (a) type a; (b) type b; (c) type c.
3. Analysis of Results
3.1. Monitoring Temperature Field
Figure 7 shows the temperature field monitoring path schematic, where monitoring path 1 is from the upstream pressure, taking port A1, to the downstream pressure, taking port A2 along the axial direction, and monitoring path 2 is from inner wall surface B1, perpendicular to the axis to outer wall surface B2. The four points are located at the midpoints of their respective structures.
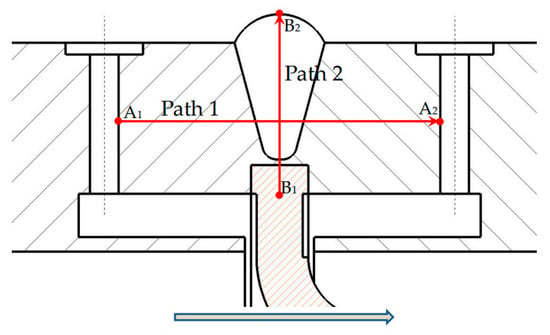
Figure 7.
Monitoring path schematic.
Figure 8a shows the temperature field distribution of monitoring path 1 under different type I weld shape parameters. Along the path from upstream to downstream, the temperatures decrease rapidly first and then rise slowly to a stable value, all reaching smaller stable values at 0.4–0.6 L. Moreover, the symmetric distribution feature is very obvious. Due to the different thermal conductivity, the weld metal tin plays a role in the temperature distribution. For a, b, and c, the smaller stable temperature values are 389 °C, 390.2 °C, and 391.64 °C, respectively. As the distance between the weld metal and the eight-slot nozzle increases, the small stable value of monitoring path 1 also increases slightly. The maximum amplitudes of path 1 (defined as the difference between the smaller stable value and the minimum value) are 23.44 °C, 24.55 °C, and 24.61 °C for the a, b, and c parameter cases, respectively. As seen, as the distance between the weld metal and the eight-slot nozzle increases, the amplitude of the maximum variation in monitoring path 1 rises slightly.
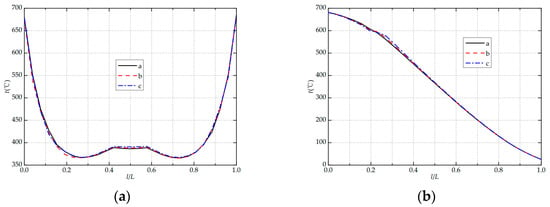
Figure 8.
Temperature field distribution of the monitoring paths of type I weld shape: (a) path 1; (b) path 2.
Figure 8b shows the temperature field distribution of monitoring path 2 under different parameters of type I weld shape. In the path from inside to outside, the temperature distribution shows a decreasing trend. The closer to the inner side, the higher the temperature; the closer to the outer side, the lower the temperature. Under the three parameters a, b, and c, the maximum values of monitoring path 2 are 681.45 °C, 680.97 °C, and 680.72 °C, respectively. With the increased distance between the weld metal and the eight-slot nozzle, the maximum value of monitoring path 2 shows a slight downward trend. Also, under the three-parameter scenarios, the maximum value of monitoring path 2 (defined as the difference between the maximum and minimum values) is 656.035 °C, 655.493 °C, and 655.293 °C, respectively. It can be seen that the maximum value of monitoring path 2 also presents a slight downward trend. For the type I weld shape, although the three types of welds show different shapes, their metal composition does not change significantly in the areas through which path 1 and path 2 pass. At the same position of path 1, its metal type hardly changes; at the same position of path 2, its metal type is the same. Therefore, the effect of type I weld shape on the temperature field of the nozzle flowmeter is very weak.
Figure 9a,b show the temperature field distribution along monitoring paths 1 and 2 under different type II weld shape parameters. Compared with the type I weld shape, the temperature distribution characteristics in the type II weld shape are similar and show a rapid decrease at first and then slowly rise. Under the three-parameter scenarios a, b, and c, the maximum value of monitoring path 1 is 389 °C, 388.9 °C and 388.7 °C, respectively. It can be seen that with the increase in the bottom width of the weld metal, the maximum value of monitoring path 1 also decreases slightly but has little overall change. Under the same three parameters a, b, and c, the maximum amplitude of path 1 is 23.44 °C, 23.03 °C and 22.47 °C, respectively. It can be seen that with the increase in the bottom width of the weld metal, the maximum variation amplitude of monitoring path 1 decreases slightly. In the path from inside to outside, the maximum temperature values on monitoring path 2 are 681.45 °C, 681.86 °C, and 681.77 °C, respectively. It can be seen that as the bottom width of the weld metal increases, the maximum value of its monitoring path 2 rises slightly but does not change much overall. Under the three-parameter conditions, the maximum values of monitoring path 2 are 656.035 °C, 656.539 °C and 656.314 °C, respectively. For the same reason as for the type I welds, the no change in the metal composition on the two paths is the root cause. Although the bottom width of the weld metal changes, it does not affect the metal composition in the area through which path 1 and 2 pass. Therefore, the type II weld shape has little effect on the temperature field of the nozzle flowmeter, and the effect of the type II weld shape is even lower than that of the type I weld shape.
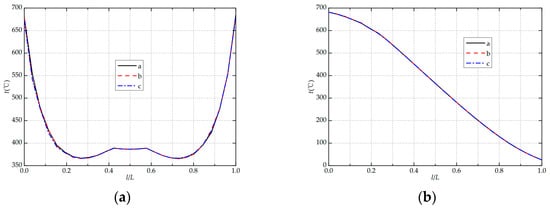
Figure 9.
Temperature field distribution of the monitoring paths of type II weld shape: (a) path 1; (b) path 2.
Figure 10a,b show the temperature field distribution on monitoring paths 1 and 2 under different type III weld shape parameters. It can be seen that the temperature field distribution characteristics are similar to the previous two kinds of weld shapes but also show certain differences. In the case of the type III weld shape in a, b, and c, the maximum peak value of monitoring path 1 at 0.4 L to 0.6 L is 389 °C, 397.45 °C, and 365.41 °C, respectively. It can be seen that the taper angle of the weld metal significantly influences the smaller stable temperature values for monitoring path 1, where the minimum value is found for the taper angle of 90°. Under a, b, and c, the maximum variation amplitude of monitoring path 1 is 23.44 °C, 30.51 °C, and 14.55 °C, respectively. As can be seen, the taper angle of the weld metal has a significant effect on the maximum variation amplitude of monitoring path 1, which is the smallest when the taper angle is 90°. In the case of a, b, and c, the maximum values of monitoring path 2 are 681.45 °C, 679.05 °C, and 689.54 °C, respectively, whose maximum temperature is at a taper angle of 90°. And the maximum values are 656.035 °C, 653.332 °C, and 664.858 °C. In general, the shape of the type III weld significantly affects the nozzle flowmeter’s temperature fielder. It was also found that the temperature variation curves of type a and type b coincide more on path 1 and path 2, while type c is very different from them. From type a to type b, the change is relatively slight. For the type c weld, the taper angle is 90°, which is the extreme case. Unlike the previous two (type I and type II), the variation in the taper angle causes a significant change in the metal composition on path 1. On path 1, the tin distribution of type a and type b differs, but the difference is small, while the tin distribution of type c differs much more than that of them. The change in taper angle also causes significant changes in the metal composition on both sides of path 2. The difference between the tin distribution areas of type a and type b is relatively small, while the amount of tin distribution on both sides of path 2 for type c is much larger than that of type a and type b. Therefore, the type III weld shape has a significant effect on the temperature field, and the difference is greatest for type c.
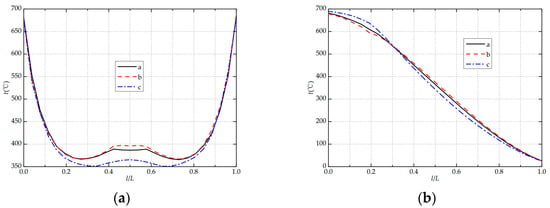
Figure 10.
Temperature field distribution of the monitoring paths of type III weld shape: (a) path 1; (b) path 2.
Figure 11a,b show the temperature field distribution on monitoring paths 1 and 2 under different type IV weld shape parameters. In general, the distribution characteristics of the temperature field are similar to those within the previous three kinds of weld shapes. From upstream to downstream, the temperature distribution decreases rapidly and then increases slowly. In the path from inside to outside, the temperature distribution shows a decreasing trend. In the case of a, b, and c, the minimum stable values on path 1 are 396.94 °C, 395.39 °C, and 405.14 °C, and the maximum variation amplitudes are 29.68 °C, 28.14 °C, and 35.19 °C, respectively. It can be seen that the taper opening of the weld metal has a certain influence on the maximum variation amplitude of monitoring path 1, and the maximum amplitude is when the taper opening is type c. Under the three types of conditions a, b, and c, the maximum temperature of monitoring path 2 is 678.72 °C, 679.12 °C, and 693.29 °C, and the maximum variation amplitude is 653.108 °C, 653.542 °C, and 667.658 °C. Obviously, the taper opening of the weld metal greatly influences the peak value of monitoring path 2, and the variation amplitude is the largest when the taper opening is type c. For the same reason as for type III welds, the change in the taper opening of the weld metal causes a change in the metal composition on path 1 and in the amount and shape of the tin distribution on both sides of path 2, which has an effect on the change in temperature variation on both paths.
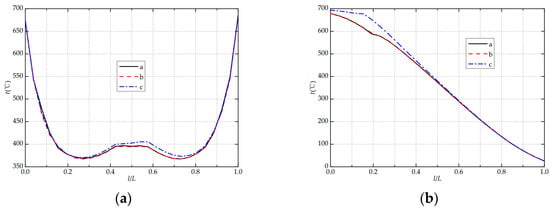
Figure 11.
Temperature field distribution of the monitoring paths of type IV weld shape: (a) path 1; (b) path 2.
3.2. Solid Temperature Field
Figure 12 and Figure 13 show the temperature field distribution in the cross-section of the nozzle flowmeter under the type I and type II weld shape, respectively. It can be seen that when the temperature of the outer wall remains constant at 22 °C, the temperature field distribution inside the nozzle flowmeter gradually generates heat transfer from the inner wall to the outer wall. The temperature field of the cross-section in all three types of nozzle flowmeters shows obvious stratification. When the inner-wall temperature of the nozzle flowmeter is 700 °C, the inner part of the nozzle flowmeter is mainly in a high-temperature state, and the low-temperature area on the outer wall is less. At the same time, the temperature distribution in the upstream and downstream pressure taking ports is more obvious. The cross-section temperature field distribution of the three types of nozzle flowmeters is similar, which indicates that the changes in various weld metal shapes have little influence on the temperature field distribution inside the nozzle flowmeter.

Figure 12.
Temperature field in middle section of type I weld shape (°C): (a) type a; (b) type b; (c) type c.

Figure 13.
Temperature field in middle section of type II weld shape (°C): (a) type a; (b) type b; (c) type c.
Figure 14 and Figure 15 show the temperature field distribution in the cross-section of the nozzle flowmeter under the type III and type IV weld shapes. In terms of the overall distribution, the temperature field is similar to the previous two (type I and type II). The temperature field distribution clouds of type a and b of III and IV weld shapes are much more similar, and a larger high-temperature region appears at the junction of the weld metal and the eight-slot nozzle in the case of type c. This indicates that the type c weld shapes of III and IV have some influence on the temperature field at the junction of the weld metal and the eight-slot nozzle.

Figure 14.
Temperature field in middle section of type III weld shape (°C ): (a) type a; (b) type b; (c) type c.

Figure 15.
Temperature field in middle section of type IV weld shape (°C ): (a) type a; (b) type b; (c) type c.
4. Conclusions
In this study, a variety of different weld shapes are proposed, and the effects of the distance between the weld metal and the eight-slot nozzle, the bottom width of weld metal, the taper angle, and the taper opening on the temperature field of the nozzle flowmeter are investigated via numerical simulation. The results show that:
i. Under different weld shapes and geometric parameters, the temperature distribution in the path from the upstream pressure taking port to the downstream pressure taking port decreases rapidly at first and then increases slowly. And the temperature distribution shows a decreasing trend along the path from the inner to the outer wall.
ii. The taper angle and taper opening of the weld metal (type III and IV) affect the temperature variation in the flow direction path, in which the type c shape has an effect on the temperature field at the junction of the weld metal and the eight-slot nozzle, resulting in a large high-temperature region easily appearing there.
iii. The distances between the weld metal and the eight-slot nozzle and the bottom width of the weld metal (type I and type II) have little influence on the temperature variation in the flow direction path and inside–out path.
This study obtains the temperature curves on the monitoring paths under different welds and explores the changing pattern in the temperature field of nozzle flowmeters. In terms of engineering applications, this study provides a reference for the optimization of welds, which has some significance in improving nozzle safety and pipeline safety. Considering the difficulty of processing and the distribution of the temperature field, the type a metal weld of type IV is more suitable for the installation of this type of nozzle flowmeter that was designed. In this study, the effect of different weld shapes on the temperature field has been investigated only when the metal material is tin; hence, the effect of different materials on the temperature field for different weld shapes will be investigated in future work.
Author Contributions
Y.Z. proposed the innovative idea; J.T. carried out the writing of the manuscript; Z.Z. checked the manuscript and revised it. All authors have read and agreed to the published version of the manuscript.
Funding
The research was financially supported by the “Pioneer” and “Leading Goose” R&D Program of Zhejiang (Grant No. 2022C03170), Science and Technology Project of Quzhou (Grant No. 2022K98).
Data Availability Statement
The data used to support the findings of this study are available from the corresponding author upon request.
Conflicts of Interest
The authors declare no potential conflict of interest with respect to the research, authorship, and/or publication of this article.
References
- Zhang, Y.L.; Tong, L.H.; Xiao, J.J.; Zhang, K.Y. Influence of wall temperature on thermal effect of nozzle flowmeter. Front. Heat Mass Transf. 2022, 18, 38. [Google Scholar]
- Lua, A.C.; Zheng, Z.S. Numerical simulations and experimental studies on a target fluidic flowmeter. Flow Meas. Instrum. 2003, 14, 43–49. [Google Scholar] [CrossRef]
- Tong, L.H.; Zheng, S.L.; Zhang, Y.L.; Zhao, Y.J.; Zhang, K.Y.; Li, J.F. Study on thermal effect of nozzle flowmeter based on fluid-solid coupling method. Shock Vib. 2021, 2021, 7448439. [Google Scholar] [CrossRef]
- Tong, L.H.; Zhang, Y.L.; Yu, T.H.; Luo, B.Y.; Li, J.F. Heat flow distribution characteristics of solid wall of nozzle flowmeter. Front. Heat Mass Transf. 2023, 20, 10. [Google Scholar]
- Huang, S.F.; Ma, T.Y.; Wang, D.; Lin, Z.H. Study on discharge coefficient of perforated orifices as a new kind of flowmeter. Exp. Therm. Fluid Sci. 2013, 46, 74–83. [Google Scholar] [CrossRef]
- Kolodzie, P.A., Jr.; Van Winkle, M. Discharge coefficients through perforated plates. AIChE J. 1957, 3, 305–312. [Google Scholar] [CrossRef]
- Kim, B.C.; Pak, B.C.; Cho, N.H.; Chi, D.S.; Choi, H.M.; Choi, Y.M.; Park, K.A. Effects of cavitation and plate thickness on small diameter ratio orifice meters. Flow Meas. Instrum. 1997, 8, 85–92. [Google Scholar] [CrossRef]
- Zhang, H.; Guo, C.; Lin, J. Effects of velocity profiles on measuring accuracy of transit-time ultrasonic flowmeter. Appl. Sci. 2019, 9, 1648. [Google Scholar] [CrossRef]
- Džemić, Z.; Širok, B.; Bizjan, B. Turbine flowmeter response to transitional flow regimes. Flow Meas. Instrum. 2018, 59, 18–22. [Google Scholar] [CrossRef]
- Guo, S.N.; Sun, L.J.; Zhang, T.; Yang, W.L.; Yang, Z. Analysis of viscosity effect on turbine flowmeter performance based on experiments and CFD simulations. Flow Meas. Instrum. 2013, 34, 42–52. [Google Scholar] [CrossRef]
- Lee, W.F.Z.; Evans, H.J. Density effect and Reynolds number effect on gas turbine flowmeters. J. Basic Eng. 1965, 87, 1043–1051. [Google Scholar] [CrossRef]
- Jepson, P.; Bean, P.G. Effect of upstream velocity profiles on turbine flowmeter registration. J. Mech. Eng. Sci. 1969, 11, 503–510. [Google Scholar] [CrossRef]
- Enz, S. Effect of asymmetric actuator and detector position on Coriolis flowmeter and measured phase shift. Flow Meas. Instrum. 2010, 21, 497–503. [Google Scholar] [CrossRef]
- Shavrina, E.; Zeng, Y.; Khoo, B.C.; Nguyen, V. The Investigation of Gas Distribution Asymmetry Effect on Coriolis Flowmeter Accuracy at Multiphase Metering. Sensors 2022, 22, 7739. [Google Scholar] [CrossRef]
- Bobovnik, G.; Kutin, J.; Bajsić, I. The effect of flow conditions on the sensitivity of the Coriolis flowmeter. Flow Meas. Instrum. 2004, 15, 69–76. [Google Scholar] [CrossRef]
- Singh, S.N.; Seshadri, V.; Singh, R.K.; Singh, R. Effect of upstream flow disturbances on the performance characteristics of a V-cone flowmeter. Flow Meas. Instrum. 2006, 17, 291–297. [Google Scholar] [CrossRef]
- Ifft, S.A.; Mikkelsen, E.D. Pipe elbow effects on the V-cone flowmeter. In Proceedings of the ASME Fluid Engeering Conference, Washington, DC, USA, 26–29 October 1992. [Google Scholar]
- Singh, R.K.; Singh, S.N.; Seshadri, V. Study on the effect of vertex angle and upstream swirl on the performance characteristics of cone flowmeter using CFD. Flow Meas. Instrum. 2009, 20, 69–74. [Google Scholar] [CrossRef]
- Zheng, D.D.; Zhang, P.Y.; Xu, T.S. Study of acoustic transducer protrusion and recess effects on ultrasonic flowmeter measurement by numerical simulation. Flow Meas. Instrum. 2011, 22, 488–493. [Google Scholar] [CrossRef]
- Kang, W.; Lee, S.H.; Lee, S.J.; Ha, Y.C.; Jung, S.S. Effect of ultrasonic noise generated by pressure control valves on ultrasonic gas flowmeters. Flow Meas. Instrum. 2018, 60, 95–104. [Google Scholar] [CrossRef]
- Chen, Q.; Li, W.H.; Wu, J.T. Realization of a multipath ultrasonic gas flowmeter based on transit-time technique. Ultrasonics 2014, 54, 285–290. [Google Scholar] [CrossRef]
- Leontidis, V.; Cuvier, C.; Caignaert, G.; Dupont, P.; Roussette, O.; Fammery, S.; Nivet, P.; Dazin, A. Experimental validation of an ultrasonic flowmeter for unsteady flows. Meas. Sci. Technol. 2018, 29, 045303. [Google Scholar] [CrossRef]
- Shaaban, S. Design and optimization of a novel flowmeter for liquid hydrogen. Int. J. Hydrogen Energy 2017, 42, 14621–14632. [Google Scholar] [CrossRef]
- Oh, S.T.; Kim, Y.I. Development of a portable, small-scale multi-nozzle flowmeter with exit pressure control. ASHRAE Trans. 2017, 123, 254. [Google Scholar]
- Chen, J.F.; Zhang, K.; Wang, L.Y.; Yang, M.Y. Design of a high precision ultrasonic gas flowmeter. Sensors 2020, 20, 4804. [Google Scholar] [CrossRef] [PubMed]
- Huang, Z.X. ANSYS Workbench Handbook 16.0; People Post Press: Beijing, China, 2016. [Google Scholar]
Disclaimer/Publisher’s Note: The statements, opinions and data contained in all publications are solely those of the individual author(s) and contributor(s) and not of MDPI and/or the editor(s). MDPI and/or the editor(s) disclaim responsibility for any injury to people or property resulting from any ideas, methods, instructions or products referred to in the content. |
© 2023 by the authors. Licensee MDPI, Basel, Switzerland. This article is an open access article distributed under the terms and conditions of the Creative Commons Attribution (CC BY) license (https://creativecommons.org/licenses/by/4.0/).
