Abstract
In order to improve the low efficiency and malfunction caused by the FWRV (four-way reversing valve) when the working mode of the heat pump air conditioning system changes in refrigeration and heating, it is of great significance to study the structure of the FWRV. In this paper, the control equation of the sliding block movement process is constructed to simulate the reversing process of the FWRV in fluid mechanics, and a detailed study is carried out from the sliding block speed, sliding block acceleration, sliding block force, refrigerant leakage, and other aspects. Some studies indicate that structural improvement in the slider could greatly enhance the working performance of the FWRV. Increasing the height of the slider not only improves the pressure relief ability of the FWRV and prevents the slider from being damaged by high-pressure gas impact but also reduces the leakage of refrigerant during the directional process; when reducing the length of the slider, although it improves the pressure relief capacity of the FWRV, it also increases the amount of refrigerant leakage. The research results provide a theoretical basis and direction for designers to improve the capability of the FWRV.
1. Introduction
With the continuous promotion of green and environmentally friendly travel methods and the pursuit of low travel costs, electric vehicles are increasingly favored by people. However, issues such as thermal runaways often lead to spontaneous combustion in electric vehicles. In order to meet the requirements of safe travel, heat pump air conditioning systems have become the preferred method of thermal management for electric vehicles. However, the usage of heat pump air conditioning will significantly reduce the range of electric vehicles. Therefore, finding an efficient heat pump air conditioning system has become a research hotspot for many scholars. Research has pointed out that a large proportion of the total energy loss of heat pump air conditioning systems is caused by throttling elements [1,2,3]. The COP (coefficient of performance) of the heat pump system is increased from 2.9 to 3.1 only by optimizing the control strategy of throttling components [4]. The pressure drop of the system is reduced by optimizing the control logic of the valve opening speed and the valve opening [5]. The compressor power will decrease by 7.17% if the corresponding valve opening is adjusted under different working conditions [6]. Under the same mass flow condition, the pressure drop and pump output pressure can be reduced by 5.51% and 4.38% by optimizing the valve [7]. Therefore, the study of throttling components is of great significance to reduce energy loss and improve the energy efficiency of heat pump air conditioning systems.
As one of the throttling components of the heat pump air conditioning system, the FWRV has been studied by many scholars for its impact on the heat pump air conditioning system. Some scholars have analyzed the impact of the reversing process of the FWRV on the heat pump air conditioning system. The results reveal that the FWRV may experience frost formation when working in low-temperature environments, requiring additional heat to heat and defrost it. Otherwise, low temperatures will cause the FWRV to fail to reverse [8]. However, the use of additional heat to defrost the FWRV will increase the reversing time by more than 36% and reduce the system’s working efficiency [9]. By optimizing the slider structure of the FWRV, the pressure on the slider is reduced from 4720 N to 3938 N, which makes the reversing process smoother and reduces the occurrence of reversing failure caused by friction [10]. In addition, by improving the vibration law and surface shape of the slider, the friction force suffered during the reversing process of the slider can also be significantly reduced, and the reversing failure of the FWRV can be reduced [11,12].
Some scholars have studied the impact of refrigerant leakage during the reversing process of the FWRV on the heat pump air conditioning system. The study showed that refrigerant leakage in the FWRV will lead to a 2.5% decrease in COP of the heat pump air conditioning system [13]. We compared and analyzed the impact of a normally operating FWRV and an FWRV with leakage issues on the compressor of the air conditioning system through experiments. The results showed that due to leakage, the power input of the compressor was 58.6% of the normal state, which seriously influenced the working performance of the heat pump unit [14]. The study also found that the presence of an FWRV resulted in an increase of 7.31% in the suction side pressure drop and 0.27% in the exhaust side pressure drop of the compressor, respectively [15].
Some scholars have also studied the impact of the heat transfer process between high–low pressure sides of the FWRV on the heat pump air conditioning system. The thermal losses on the suction side are most affected by the material property of the FWRV, followed by the connecting material property and valve seat [16]. FWRVs with different thermal conductivity materials have a significant impact on refrigeration systems [17,18]. Scholars analyzed the results of two materials with different thermal conductivity, stainless steel and copper, and pointed out that compared with copper materials, using stainless steel materials with low thermal conductivity can increase energy efficiency by at least 1% [19]. Research on the effect of heat conduction between the high–low pressure sides of the FWRV on the refrigeration system showed that heat conduction between high and low pressures can reduce the cooling capacity of the system by about 0.7% [20,21]. The losses caused by heat transfer account for about 60% of the total losses of air conditioning systems, and result in a 1–5% decrease in system cooling capacity [22,23]. The research analyzed the impact of FWRVs on refrigeration systems from three perspectives: heat capacity, COP, and energy. The research results showed that the presence of partitioning reduced them by 31.86%, 33.59%, and 22.59%, respectively [24].
From the above discussion, it can be found that existing literature mainly studies the impact of FWRV on the efficiency of heat pump air conditioning systems from the entire system level, or conducts simple research on FWRV through experimental methods without in-depth analysis of the reasons for the failure and refrigerant leakage of the FWRV during the reversing process. Therefore, this article constructs a motion control equation for the slider to conduct a theoretical analysis of the reversing process of the FWRV in order to study the main factors that affect the speed, force on the slider, and refrigerant leakage during the reversing process, providing a clear optimization direction for the four-way reversing valve to have a smoother reversing process and lower refrigerant leakage.
The detailed technical route is formulated and shown in Figure 1.
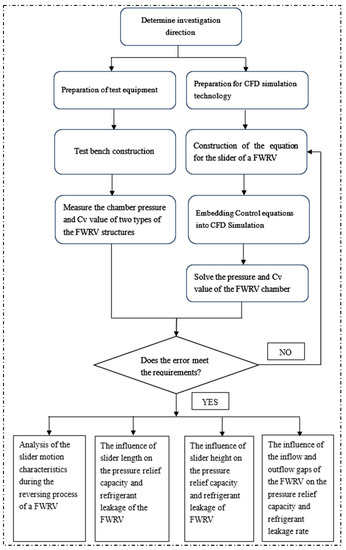
Figure 1.
Technical route.
2. Materials and Methods
2.1. Analysis of the Problem in the Reversing Process of the FWRV
As shown in Figure 2, the main structures of the FWRV in the heat pump air conditioning system include a capillary, pilot slide valve, valve chamber, piston, slider, valve seat, and bracket. By controlling the connectivity status of the D, C, S, and E pipes in the FWRV, the conversion between the cooling and heating states of the heat pump air conditioning system can be achieved. As shown in Figure 3, When the air conditioning is in a refrigeration state, the refrigerant in the indoor unit flows into the compressor through the E-S pipe of the FWRV. After the compressor is discharged, the refrigerant flows into the outdoor unit through the D-C pipe of the four-way valve. At this time, the E pipe and S pipe in the FWRV are connected, and the D pipe and C pipe are connected. When the air conditioner is in the heating state, the refrigerant in the external unit flows into the compressor by the C-S pipe, and the refrigerant discharged by the compressor flows into the interior unit through the D-E pipe. At this time, the C pipe and S pipe in the FWRV are connected, and the D pipe and E pipe are connected.
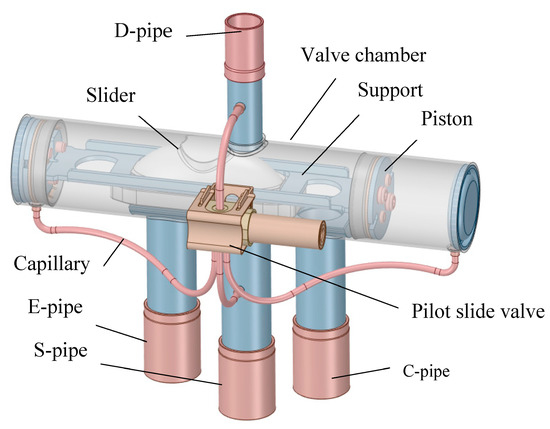
Figure 2.
Structure of the four-way reversing valve.
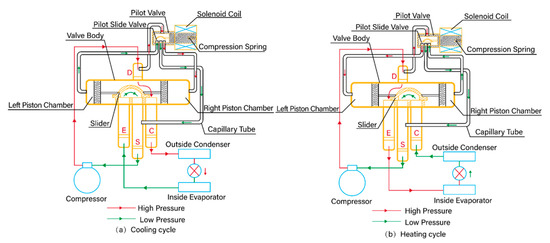
Figure 3.
Schematic diagram of the four-way reversing valve.
The change in the connection status of the D, C, S, and E pipes of the FWRV requires the driving force to drive the slider movement. Under experimental conditions, the procedure is as follows: block the C and E pipes, apply different pressures to the D and S pipes, and measure the flow coefficient Cv value (referred to as the middle flow coefficient) of the FWRV when the slider is in the middle position. The middle flow coefficient Cv value is generally within the range of 0.2–0.8 to ensure its normal directional change. If the Cv value is too high, there is a possibility of insufficient driving force during the reversing process of the FWRV, leading to reversing failure; if the Cv value is too low, the high-pressure gas in the FWRV cannot be discharged in a timely manner, resulting in insufficient pressure relief inside the valve chamber and damage to the slider. Obviously, the experimental method cannot deeply analyze the reasons for insufficient driving force or excessive leakage of the FWRV. Therefore, establishing the motion control equation for the reversing process of the FWRV is of great significance for studying and improving the performance of the FWRV.
In order to investigate the reversing process of the FWRV, this article establishes two types of sliders as shown in Figure 4, and the full details in terms of dimensions is shown in Table 1. For the convenience of description in the text, the FWRV model corresponding to slider I is referred to as Model I. The model corresponding to slider II is called Model II. Without affecting the calculation results, the FWRV was simplified to generate a high-quality mesh model. The simplified model is shown in Figure 5.

Figure 4.
Slider structure (Slider I on the left and Slider II on the right).

Table 1.
Dimensions and geometry configurations (mm).
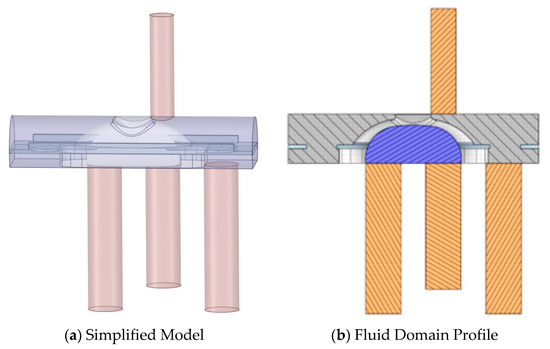
Figure 5.
Simplified model of the four-way reversing valve.
2.2. Materials and Methods
2.2.1. Establishment of Mathematical Model for the Motion Process of Sliders
The reversing process of an FWRV is relatively complex. To facilitate the establishment of a mathematical model, the following assumptions are made:
- The physical parameters of air do not change during reversing, that is, the density and viscosity are constant;
- During the reversing process, the pressure at the inlet and outlet of the FWRV is stable;
- Ignore the influence of ambient temperature on the four-way reversing valve.
- (1)
- Force balance equation of sliding
where PD is the inlet pressure of the D pipe, f is the friction coefficient of the capillary, v is the flow rate of fluid in the capillary, L is the length of the capillary, d is the diameter of the capillary, λ is the friction coefficient between the slider and the valve seat, FP is the pressure exerted on the slider, A1 is the cross-sectional area of the capillary, A2 is the cross-sectional area of the valve chamber, u is the fluid viscosity, ε is the absolute roughness, Re is the Reynolds number, and μ is the dynamic viscosity.- (2)
- Equation of slider motion
where m is the mass of moving parts such as the slider and bracket, w is the moving speed of the slider, t is the time, Ft is the propulsive force, and Ff is the frictional force.
At the starting time of movement t0 = 0 s, the slider is located on the left side of the FWRV, and its speed is 0 m/s; when the driving force of the slider is greater than the friction force, the slider starts to move; when the slider moves to the far right, the slider stops moving.
2.2.2. Establishment of Grid Model for Four-Way Reversing Valve
When processing CAD models, the FWRV is divided into the static area and moving area in the reversing process, and the static area includes the connecting pipe and the valve seat; the moving area includes the valve chamber, slider and support. In the process of reversing, the moving area of the FWRV is realized by combining the MRF model with expression, and the data transmission between the static area and the moving area is realized by the interface surface. During grid division, Model I will generate 2.1 million, 3.37 million, 4.23 million, 5.33 million, and 8.23 million grid models, respectively, for grid independence verification. It can be seen from Figure 6 that the flow at the middle position of the FWRV decreases gradually with the increase in the number of grids; when the number of grids exceeds 4 million, the maximum decrease in fluid flow with the increase in grid number is 0.2%. Therefore, when the grid number of the four-way reversing valve reaches more than 4 million, it is considered that the influence of the grid number on the simulation results can be ignored. Finally, when generating a mesh model, the grid parameters of the FWRV can be set as follows to meet the requirements. The global grid size is 1 mm. The slider surface and interface surface are densified with a grid size of 0.5 mm.
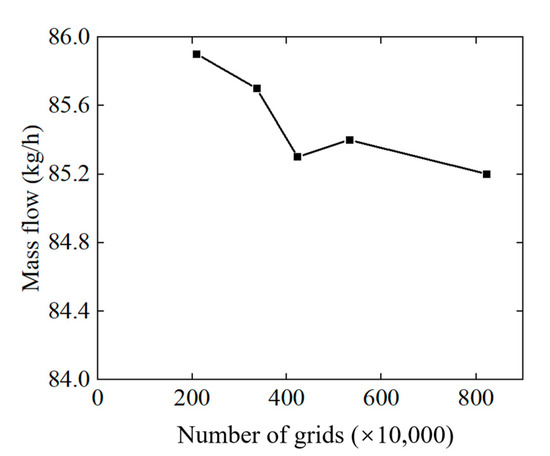
Figure 6.
Grid independence verification.
2.2.3. Parameter Settings for the Transient Solution Process of the Four-Way Reversing Valve
In the numerical solution process, the parameters are set as follows: the C pipe and the E pipe are blocked, the D pipe is the pressure inlet boundary, and the pressure value is 3.1 MPa; the S pipe is the boundary of the pressure outlet, and the pressure value is 0 MPa; since the Reynolds number of the fluid is far greater than 2000, the SST k-ω (Shear Pressure Transfer k-ω Model) turbulence model is selected as the turbulence model, and the pressure–velocity coupling algorithm is adopted for a transient solution; and the MRF (multi-frame of reference model) model is adopted for the moving process of the slider in the reversing process, and the speed change in the slider in the reversing process is realized by the expression method. At the beginning of the movement of the four-way reversing valve, the slider’s speed and force are in an unbalanced state. After the slider starts to move, the speed and force of the slider reach a balanced state, and the speed of the slider will not change anymore. At this time, the speed of the slider is the balance speed, and the time required to reach the balance speed is the balance time. In the simulation process, if the time step is set too small, the calculation cycle will be too long, and if the time step is set too large, the simulation process will not correctly reflect the change in the slider speed in the reversing process of the four-way reversing valve. Therefore, the balance time required for the slider to reach the balance speed is taken as the evaluation standard for time step independence verification. The time steps are calculated with 1 × 10⁻⁵ s, 5 × 10⁻⁵ s, 1 × 10⁻⁴ s, and 5 × 10⁻⁴ s, respectively, and the results are shown in Figure 7. It can be seen from the figure that when the time step is less than 5 × 10⁻⁵ s, the balance time required for the slider to reach the balance speed is less affected by the time step, and it maintains good convergence in the calculation process. Therefore, in the transient simulation calculation of an FWRV, the time step shall not exceed 5 × 10⁻⁵ s, and it is considered that the time step meets the calculation accuracy requirements. In the actual simulation, in order to give consideration to the convergence and time period of the numerical solution, when the slider moves to the middle area of reversing, the time step is set to 1 × 10⁻⁵ s to cope with the sharp change in the flow field and improve the convergence of the simulation calculation, and the time step in other moving areas is set to 5 × 10⁻⁵ s to reduce the calculation period.
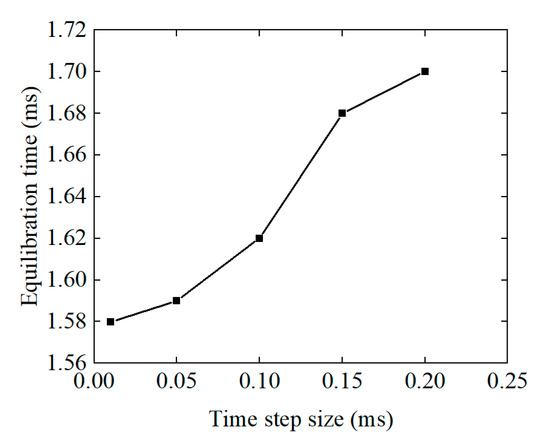
Figure 7.
Time step independence verification.
2.2.4. Model Experiment Validation
In order to verify the accuracy of the numerical simulation results, a flow and pressure test platform of the FWRV was built, as shown in Figure 8 and Figure 9. The schematic diagram of the test system is shown in Figure 7. The detailed parameters of core equipment are shown in Table 2, which include the instrumentation accuracy and range of the core test equipment. Under the action of the pressure stabilizing pump, the gas tank can output gas with continuous and stable pressure as the air source. Pressure sensor 1 and pressure sensor 2 monitor the pressure at the inlet and outlet of the gas tank and provide signals to the pressure stabilizing pump for operation. The flow in the test system is controlled by controlling the opening of regulating valve 1, and the flow in the system is monitored by flow sensor 1; under the action of the diverter, the flow path in the test system is divided into the tested branch and the auxiliary branch, and the flow and pressure in the tested branch are changed by controlling the flow regulator in the auxiliary branch; and flow sensor 2 monitors the flow in the tested branch, and pressure sensor 3 and pressure sensor 4, respectively, monitor the pressure of the D pipe and the valve chamber of the measured FWRV. During the test, the adjustment of flow, pressure, and other parameters is realized through the console shown in Figure 8.

Figure 8.
Test system diagram.

Figure 9.
Acquisition of the experimental platform of flow and pressure.

Table 2.
Experimental test instrument.
During the experiment, the slider is adjusted to the middle position of the reversing mechanism, and the pressure in the valve chamber and the flow in the FWRV are measured. Comparing the test results with the simulation results, as shown in Table 3, it can be seen that the maximum error between the simulation value and the experimental value is 12.03%, which is within the allowable error range of the project. Therefore, the simulation results can correctly reflect the changes in various parameters during the reversing process of the four-way reversing valve. To calculate the flow coefficient, Cv, substitute the measured data into Formula (9):
where Cv is the flow coefficient, q is the flow of a four-way reversing valve, ΔP is the pressure drop, ρ is the fluid density, and ρ0 is the density of water.

Table 3.
Comparison between numerical simulation results and test results.
2.2.5. Deviation and Uncertainty Analysis
The deviation between the simulation results and the test results may be caused by the following factors: when simplifying the FWRV model, local geometric features such as chamfer and small clearance are eliminated, which leads to the reduction in pressure loss in the FWRV; in the setting of the simulation boundary conditions, the pressure boundary is the total pressure and the gauge pressure in the test. When the fluid flows, part of the pressure in the total pressure is converted into kinetic energy, causing the simulation boundary value to be lower than the actual test value.
Besides the valve itself, there are some other uncertain factors in the test.
The refrigerant impurities may be an uncertain factor in the test. Filters are added to the air conditioning system to filter impurities and ensure the accuracy of the test.
The stability of the air source is a factor to affect the test results. The storage cylinder can be added before the air intake to avoid the distortion of experimental data caused by the instability of the air source.
The environmental temperature of the test room is an important factor in the process of testing. Both high and low temperatures affect the experimental data. The test should be conducted at a constant room temperature of 25 °C.
3. Discussion
3.1. Transient Characteristics Analysis of FWRV
3.1.1. The Variation in Velocity and Pressure Fields inside the Valve with the Motion Process
In order to intuitively observe and analyze the fluid flow field and pressure changes at different positions of the slider during the reversing process, the results of representative positions are selected for display (taking Model I as an example). Figure 10 and Figure 11 show the velocity distribution cloud diagram and pressure distribution cloud diagram of the FWRV, respectively. From Figure 10, it can be seen that when the displacement of the slider does not exceed 11.5 mm, the speed in the FWRV is almost 0, and there is no obvious flow phenomenon between the D pipe and the S pipe; when the displacement of the slider is 12 mm, there is a speed change at the right end of the slider (as shown by the arrow position in the figure); when the displacement of the slider is 14.5 mm, there is a significant velocity field distribution in the FWRV, and at this time, the flow capacity between the D tube and the S tube is the highest; when the slider displacement is 17.0 mm, the velocity distribution is only seen at the rear end of the slider; and when the slider displacement is 17.5 mm, the velocity in the FWRV is 0. Based on the changes in the velocity cloud map during the comprehensive reversing process, it can be seen that the velocity field between the valve chamber and the S tube changes more significantly, while the velocity field changes between the D tube and the S tube are relatively small. Therefore, during the reversing process, the four-way reversing valve only showed significant refrigerant leakage between 12 mm and 17 mm, rather than throughout the entire reversing process.

Figure 10.
Velocity nephogram of the four-way reversing valve.

Figure 11.
Pressure nephogram of the four-way reversing valve.
From Figure 11, it can be seen that when the displacement of the slider is less than 12.0 mm, the pressure inside the valve chamber of the FWRV is the same as that of the D-tube, and there is no significant change; when the displacement of the slider is 14.5 mm, there is a significant decrease in the pressure inside the valve chamber compared with the pressure inside the D tube; and when the displacement of the slider is greater than 17.0 mm, there is no significant change in the pressure inside the four-way reversing valve chamber and between the D-tube. Based on Figure 10, it can be seen that when the slider displacement is 12 mm, the fluid flow in the four-way reversing valve is relatively small and does not cause a significant decrease in the pressure inside the valve chamber.
3.1.2. The Variation in Pressure in the Valve Chamber with the Reversing Process
Figure 12 shows the variation in pressure in the cavity of an FWRV with displacement. From the figure, it can be seen that when the displacement of the slider is less than 12 mm, the pressure inside the valve chamber is independent of the slider position and remains unchanged; when the slider is within the range of 12–17 mm, the pressure inside the valve chamber first decreases and then rises; when the slider moves to the middle position of 14.5 mm, the pressure inside the valve chamber reaches a minimum value; and when the displacement of the slider is greater than 17 mm, the pressure inside the valve chamber increases to the initial value and begins to remain unchanged. This indicates that when the sliding block moves at a distance of 12–17 mm, the sliding block begins to act as an “upper blockage and lower leakage” to prevent the sliding block from being damaged by high-pressure fluid during the reversing process. From the figure, it can also be seen that the slider pressure relief capacity of Model I is greater than that of Model II. Therefore, reducing the gap between the slider boss and the valve chamber wall and the length of the slider can increase the pressure relief capacity of the slider, ensuring that the slider is not damaged by high-pressure fluid during the reversing process of the FWRV.
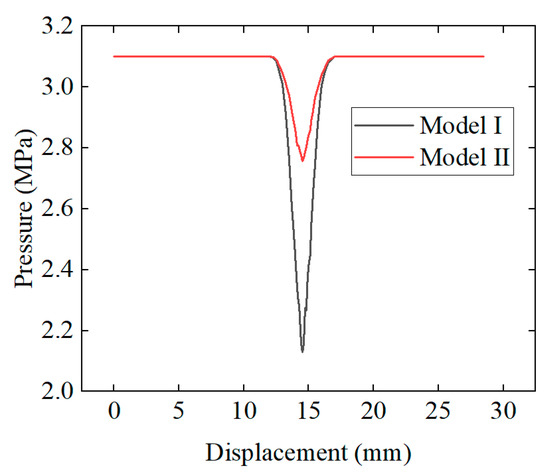
Figure 12.
Variation in pressure in the valve chamber with slider displacement.
3.1.3. Acceleration and Velocity Changes in Slider Movement
Figure 13 reflects the change in slider acceleration during the reversing process of the FWRV. From the figure, it can be seen that the acceleration of the slider undergoes a very short oscillation process at the beginning of the reversal, and then the acceleration stabilizes around 0. At this point, the slider reaches equilibrium speed. When the displacement of the slider is within the range of 12 mm–17 mm, the acceleration of the slider experiences severe oscillation. This is because during the reversing process, when the slider passes through the middle position of the reversing mechanism, the pressure inside the valve chamber suddenly drops, and the pressure and friction force on the slider decreases, resulting in an increase in slider acceleration and velocity, which in turn leads to an increase in fluid velocity and pressure loss in the capillary. In turn, it leads to a decrease in the thrust exerted on the slider, and the changes in thrust and friction cause the acceleration of the slider to oscillate. When the sliding distance exceeds 17 mm, the acceleration of the sliding block is maintained at around 0 again. From Figure 13, it can also be seen that when the slider passes through the middle position of the reversing direction, the degree of acceleration oscillation of different sliders varies. The maximum acceleration of the Model I slider can reach 900 m/s2, while the Model II slider has a maximum acceleration of 300 m/s2. This indicates that the slider acceleration is highly susceptible to the influence of its size parameters during the reversing process.
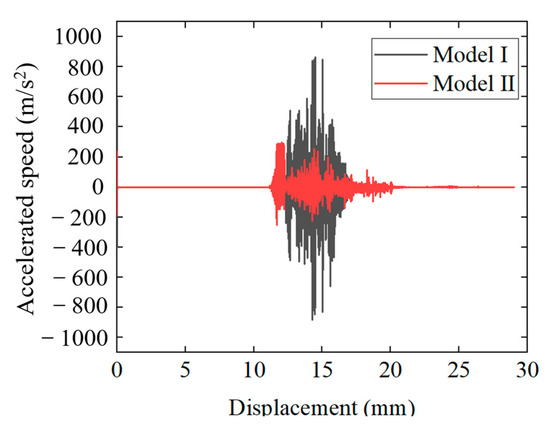
Figure 13.
Acceleration of the slider varies with position.
Figure 14 reflects the variation process of slider speed with displacement. From the figure, it can be seen that during the reversing process, when the slider passes through the middle range of 12–17 mm, the speed of the slider changes first and then decreases. When the displacement is 14.5 mm, the speed of the slider reaches its maximum value. From the figure, it can also be seen that the balance speed of the slider in Model II is 0.08 m/s, with a maximum value of 0.3 m/s; the slider balance speed of Model II is 0.06 m/s, with a maximum speed of 0.13 m/s. From the figure, it can also be seen that the balance speed of the slider is broken at both 12 mm and 17 mm, and within this range, the maximum increase in the speed of Model I is 2.7 times that of Model II. This indicates that the length and height of the slider do not affect the balance position of the four-way reversing valve, but have a significant impact on the speed of the slider.
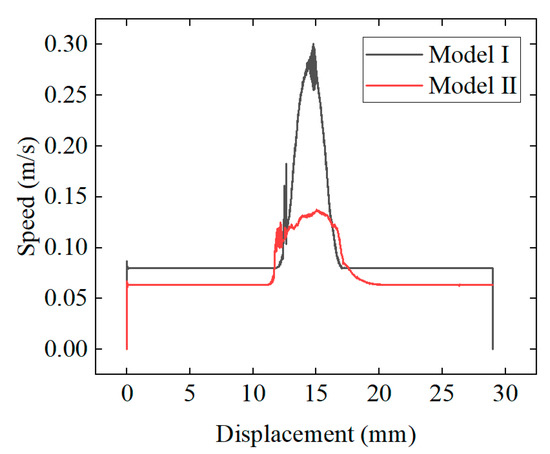
Figure 14.
Variation in the slider speed with displacement.
Figure 15 reflects the relationship between slider displacement and time. From the figure, it can be seen that during the reversing process, the displacement of the slider gradually increases with time, and the speed increase in the slider suddenly increases in the middle area. Based on Figure 14, it can be seen that this is due to the increase in slider speed. From the figure, it can also be seen that the time required for Model II to complete the commutation is 0.34 s, and the time required for Model II to complete the commutation is 0.44 s.
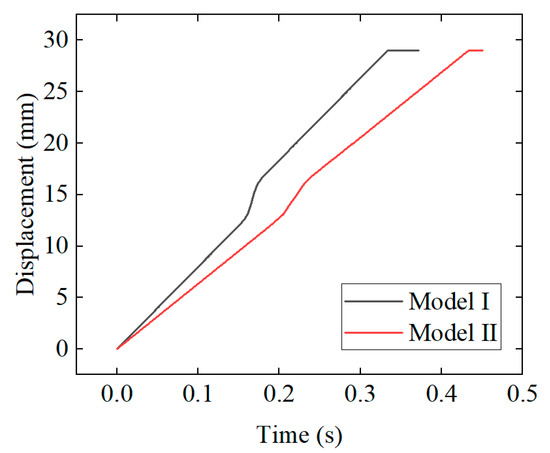
Figure 15.
Variation in the slider displacement with time.
3.1.4. Change in Leakage Amount with Reversing Process
Figure 16 shows the flow rate variation in the FWRV during the reversing process. From the figure, it can be seen that when the slider moves within the range of 12–17 mm, fluid begins to flow between the D and S pipes of the FWRV, and the flow reaches its maximum value when the slider is in the middle position of 14.5 mm. From the figure, it can also be seen that the maximum flow rate in Model I of the FWRV is 610 kg/h, and the maximum flow rate in Model II is 446 kg/h. In the actual reversing process of the refrigeration system, it is not desired to have a large flow rate between the D pipe and the S pipe, as this will increase the cross-flow phenomenon of the FWRV and reduce the refrigeration efficiency of the air conditioning system. Therefore, Model II is more optimal from the perspective of reducing the degree of crosstalk.
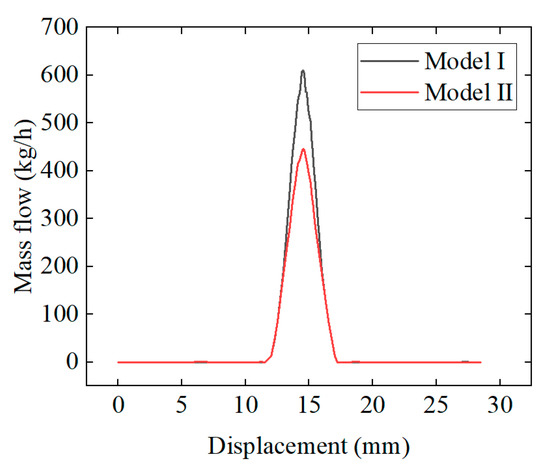
Figure 16.
Variation in flow with slider displacement.
3.1.5. Analysis of Leakage Capacity during Reversing Process
There are two positions in the FWRV that cause pressure drop during the reversing process, first between the D pipe and the valve chamber, and secondly between the valve chamber and the S pipe. For the convenience of description in the text, they are referred to as the inflow and outflow gaps, respectively. In order to analyze the impact of the inflow gap and outflow gap on the refrigerant leakage capacity during the reversing process of the FWRV, the inflow gap flow coefficient Cv1, outflow gap flow coefficient Cv2, and FWRV flow coefficient Cv0 were calculated, and a detailed analysis was conducted on the three factors.
From Figure 17, it can be seen that when the slider displacement is less than 12 mm or greater than 17 mm, the four-way reversing valve is in a non-flow state; when the displacement of the slider is between 12 mm and 17 mm in the middle range, Cv1 shows an instant increase followed by a small decrease, and then an instant change to 0. The variation pattern of Cv2 and Cv0 is first increasing and then decreasing, and a significant peak appears at 14.5 mm in the middle position of the commutation. This indicates that in the middle range of the reversing valve, the position of the slider has a small impact on the inflow clearance Cv1 of the four-way reversing valve, while it has a significant impact on the outflow clearance Cv2 and valve Cv0; meanwhile, the values of valve Cv0 and outlet clearance Cv2 are relatively close, indicating that outlet clearance has a decisive impact on valve Cv0. From the figure, it can also be seen that compared with Model I, Model II has an increase in Cv1 and a decrease in Cv2, while Valve Cv0 ultimately shows a decrease, once again proving that the outflow gap has a significant impact on Valve Cv0.
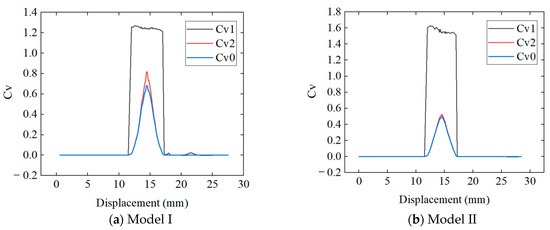
Figure 17.
Variation in the Cv value with slider displacement.
3.2. Analysis of the Slider Structure of an FWRV
In order to analyze the factors that affect the reversing process and pressure relief ability of the FWRV, the height and length of the slider was changed based on the two models for analysis.
3.2.1. The Influence of Slider Height and Length on Pressure Relief Capacity
We analyzed the impact of different slider heights on the pressure relief ability of the FWRV. From Figure 18, it can be seen that as the height of the slider increases, the pressure in the cavity of the FWRV gradually decreases, and the decrease shows an increasing trend as the height of the slider increases. The main reason for the decrease in pressure inside the valve chamber is the decrease in flow capacity into the gap, and at this time, the flow capacity of the FWRV itself is not significantly affected. Therefore, increasing the height of the slider can reduce the pressure in the valve chamber of the FWRV, without causing a significant change in the valve Cv0 value.
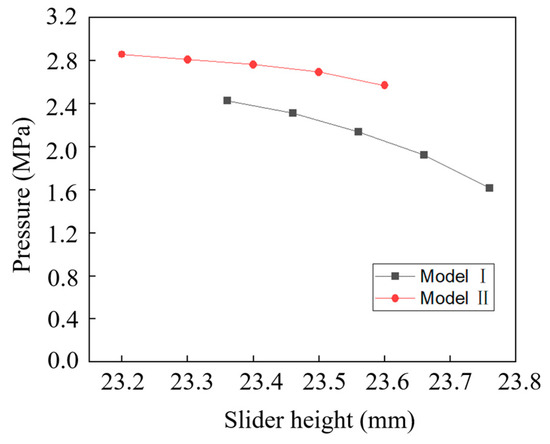
Figure 18.
Variation in pressure in the valve chamber with slider height.
We analyzed the impact of different slider lengths on the pressure relief capacity of the FWRV. From Figure 19, it can be seen that as the length of the slider decreases, the pressure inside the valve chamber of the FWRV gradually decreases and the decrease shows a decreasing trend. This is due to the increase in the flow capacity of the clearance of the FWRV, resulting in a decrease in the pressure inside the valve chamber. In practical refrigeration systems, increasing the flow capacity of the outflow gap will cause more high-temperature gas to flow to low-temperature gas in the four-way reversing valve, thereby affecting the efficiency of the heat pump air conditioning system. Therefore, reducing the length of the slider can reduce the pressure on the slider, but it will lead to a decrease in the efficiency of the heat pump air conditioning system.
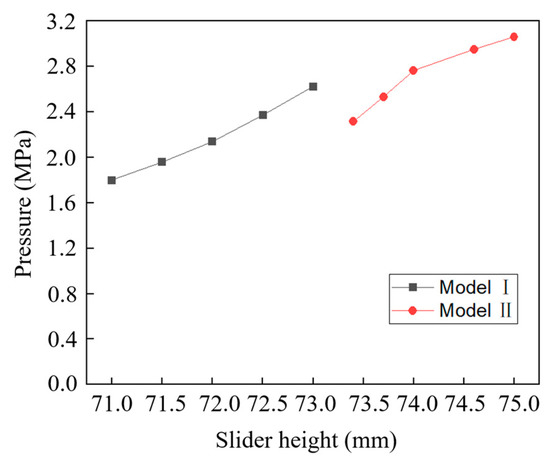
Figure 19.
Variation in pressure in the valve chamber with slider length.
3.2.2. The Influence of Slider Height and Length on Refrigerant Leakage Capacity
We analyzed the impact of different slider heights on the flow capacity of the FWRV. From Figure 20, it can be seen that in Model I, as the height of the slider increases, the outflow gap Cv2 of the FWRV hardly changes, while the valve Cv0 decreases slightly with the decrease in the inflow gap Cv1; in Model II, as the height of the slider increases, the valve Cv0 and outflow gap Cv2 in the FWRV hardly change, while the inflow gap Cv1 shows a significant downward trend. The increase in the height of the slider leads to a decrease in the inflow gap. Therefore, the change in the height of the slider has a greater impact on the Cv1 of the inflow gap, while it has a smaller impact on the outflow gap Cv2 and valve Cv0. From the figure, it can also be seen that there is an upper limit for valve Cv0. As the height of the slider decreases, the inflow gap Cv1 gradually increases, but the valve Cv0 value gradually approaches and is infinitely close to Cv2. This once again proves that the outflow gap plays a decisive role in the refrigerant leakage of the four-way reversing valve.
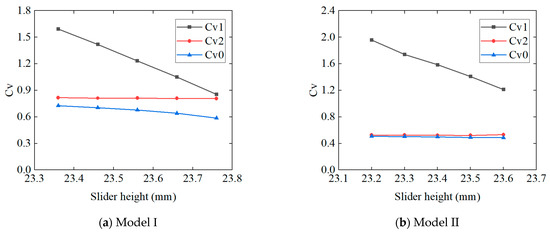
Figure 20.
Variation in the Cv value with slider height.
We analyzed the impact of different slider lengths on the flow capacity of the FWRV. From Figure 21, it can be seen that as the length of the slider increases, the inflow gap Cv1 value remains approximately unchanged, while the outflow gap Cv2 and valve Cv0 decrease simultaneously, and Cv2 and valve Cv0 gradually converge with the increase in the slider length. This indicates that the length of the slider has a significant impact on the FWRV Cv0, and when the slider length reaches a certain value, the outflow gap Cv2 value is equal to the valve Cv0 value. This also proves that the Cv0 value of the FWRV is greatly affected by the outflow gap, while the influence of the inflow gap is relatively small or even negligible.
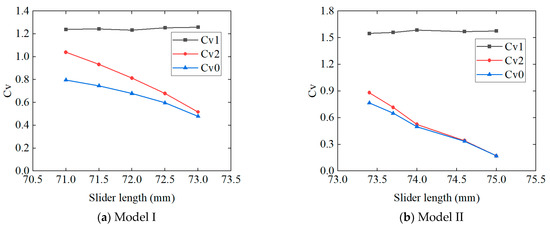
Figure 21.
Variation in the Cv value with slider length.
4. Conclusions
This article verifies the feasibility of using the CFD method to study the working performance of an FWRV through experiments and embeds the mathematical equation of its directional process into CFD calculation through user-defined means. This article analyzed the changes in force, pressure relief process, and the refrigerant leakage process of the slider during the reversing process, and analyzed in detail the effects of changes in slider height and length on them.
- Based on the analysis of the transient characteristics of the reversing process of the FWRV, it is shown that the flow field and pressure field in the valve chamber are extremely unstable when the slider is in the initial and intermediate positions during the reversing process of the four-way reversing valve, which can easily induce slider vibration and increase the probability of reversing failure.
- Based on the analysis of the impact of slider height on pressure relief capacity and refrigerant leakage capacity, it is shown that increasing the height of the slider is not only beneficial for improving the pressure relief capacity of the FWRV, protecting the slider from damage caused by high-pressure gas impact, and ensuring the smooth operation of the directional process, but it also reduces the leakage of refrigerant during the directional process, thereby improving the working efficiency of the heat pump air conditioning system.
- Based on the analysis of the relationship between the length of the slider and the pressure relief capacity and refrigerant leakage capacity, it is shown that reducing the length of the slider may improve the pressure relief capacity of the FWRV, but it will increase the leakage of refrigerant and thereby reduce the working efficiency of the heat pump air conditioning system.
- Overall, when designing the slider of the FWRV, the height and length of the slider should be increased as much as possible to improve its working performance.
Author Contributions
K.Z.: conceptualization, methodology, software, writing—original draft, writing—review and editing, investigation; D.W.: supervision, methodology, investigation, funding acquisition; Y.Y.: software, methodology; J.Z.: validation, investigation; Z.F.: supervision, project administration. J.L.: supervision, project administration; L.X.: validation, resources; Y.X.: validation, resources. All authors have read and agreed to the published version of the manuscript.
Funding
This work was supported by the National Natural Science Foundation of China (No. 51839010) and the key research and development project of Zhejiang Province, China (No. 2021C03133).
Conflicts of Interest
The authors declare that they have no known competing financial interests or personal relationships that could have appeared to influence the work reported in this paper.
Nomenclature
| PD | Inlet pressure of D pipe (MPa) |
| v | Flow velocity of fluid in capillaries (m/s) |
| L | Length of capillary (m) |
| d | Diameter of capillary (m) |
| Fp | Pressure exerted on the slider (N) |
| A1 | Cross-sectional area of the capillary (m2) |
| A2 | Cross-sectional area of the valve chamber (m2) |
| u | Fluid viscosity (Pa·s) |
| m | Mass of moving parts such as slider and bracket (kg) |
| w | Moving speed of slider (m/s) |
| t | Time (s) |
| Ft | Propulsive force (N) |
| Ff | Frictional force (N) |
| f | Friction coefficient of capillary |
| λ | Friction coefficient between the slider and the valve seat |
| Cv0 | Flow coefficients of the four-way reversing valve |
| Cv1 | Flow coefficients of the inflow gap |
| Cv2 | Flow coefficients of the outflow gap |
References
- Asim, T.; Oliveira, A.; Charlton, M.; Mishra, R. Improved Design of a Multi-Stage Continuous-Resistance Trim for minimum Energy Loss in Control Valves. Energy 2019, 174, 954–971. [Google Scholar] [CrossRef]
- Dong, X.; Wu, J.; Li, J.; Xu, X.; Su, H.; Shang, J.; Li, Q.; Gong, L. Impact of external heat transfer on the performance of a cold compressor used in superfluid helium system. Cryogenics 2020, 110, 103141. [Google Scholar] [CrossRef]
- Arpagaus, C.; Bless, F.; Schiffmann, J.; Bertsch, S.S. Multi-temperature heat pumps: A literature review. Int. J. Refrig. 2016, 69, 437–465. [Google Scholar] [CrossRef]
- Wallerand, A.S.; Kermani, M.; Kantor, I.; Maréchal, F. Optimal heat pump integration in industrial processes. Appl. Energy 2018, 219, 68–92. [Google Scholar] [CrossRef]
- Lin, Z.H.; Li, J.Y.; Jin, Z.J.; Qian, J.Y. Fluid dynamic analysis of liquefied natural gas flow through a cryogenic ball valve in liquefied natural gas receiving stations. Energy 2021, 226, 120376. [Google Scholar] [CrossRef]
- Chen, D.; Luo, Y.; Yuan, X. Refrigeration System Synthesis by Continuous Temperature Level Optimization Considering the Sub-Cooler Configuration. Comput. Chem. Eng. 2020, 141, 107031. [Google Scholar] [CrossRef]
- Zhang, X.; Xie, Y.; Han, J.; Wang, Y. Design of control valve with low energy consumption based on Isight platform. Energy 2022, 239, 122328. [Google Scholar] [CrossRef]
- Wang, Z.; Yang, H.; Chen, S. Study on the operating performance of cross hot-gas bypass defrosting system for air-to-water screw heat pumps. Appl. Therm. Eng. 2013, 59, 398–404. [Google Scholar] [CrossRef]
- Choi, H.J.; Kim, B.S.; Kang, D.; Kim, K.C. Defrosting method adopting dual hot gas bypass for an air-to-air heat pump. Appl. Energy 2011, 88, 4544–4555. [Google Scholar] [CrossRef]
- Wang, H.; Lai, Z.; Wu, D.; Zhang, K.; Zheng, M. Investigation of the friction-induced vibration of a novel four-way reversing valve using spectral kurtosis and number of peaks spectrum. Mech. Syst. Signal Process. 2022, 166, 108425. [Google Scholar] [CrossRef]
- Liu, W.; Ni, H.; Wang, P.; Zhao, B. Analytical investigation of the friction reduction performance of longitudinal vibration based on the modified elastoplastic contact model. Tribol. Int. 2020, 146, 106237. [Google Scholar] [CrossRef]
- Gutowski, P.; Leus, M. Computational model for friction force estimation in sliding motion at transverse tangential vibrations of elastic contact support. Tribol. Int. 2015, 90, 455–462. [Google Scholar] [CrossRef]
- Song, X. Study on Commutation Characteristics of Household Heat Pump Air Conditioner and Dynamic Characteristics of Refrigeration System; Shanghai Jiao Tong University: Shanghai, China, 1997. [Google Scholar]
- Dong, J.K.; Jiang, Y.Q.; Yao, Y.; Song, M.J. Experiment study on the influence of four-way reversing valve leakage on heat pump performance. J. Harbin Inst. Technol. 2011, 43, 80–83. [Google Scholar]
- Shang, P.J.; Dong, Y.J.; Yuan, X.L. Experimental Investigation on Four-way Reversing Valve. Refrig. Air Cond. Electr. Power Mach. 2006, 2, 7–10. [Google Scholar]
- Marks, R.T. The Effect of Different Materials on Heat Transfer of Reversing Valves. ASHRAE Trans. 1986, 92, 2B. [Google Scholar]
- Damasceno, G.; Lee, W.; White, L. Heat transfer pressure drop and leakage in reversing valves characterizing parameters. ASHRAE Trans. 1986, 92, 61–70. [Google Scholar]
- Damasceno, G.S.; Lee, W.T.; Rooke, S.P.; Goldschmidt, V.W. Performance of heat pump reversing valves and comparison through characterizing parameters. ASHRAE Trans. 1988, 94, 50–56. [Google Scholar]
- Chen, H.R.; Li, D.P.; He, C. Study on application of four-way valve on stainless steel. Electr. Appl. 2015, 12, 53–58. [Google Scholar]
- Chai, T.; Hu, H.T.; Ding, G.L. Energy-saving Effect of Using New Material in Reversing Valve. J. Refrig. 2011, 33, 49–53. [Google Scholar]
- Chai, T.; Hu, H.T.; Ding, G.L. Optimization Design of Reversing Valve Based on Heat Loss Analysis. Chin. J. Refrig. Technol. 2012, 32, 33–38. [Google Scholar]
- Young, D.J. Development of a northern climate residential air-source heat pump. ASHREA Trans. 1980, 86, 671–684. [Google Scholar]
- Hargraves, D.P. A refrigerant enthalpy method for measuring reversing valve heat transfer. ASHREA Trans. 1986, 95, 88–93. [Google Scholar]
- Deng, N.; Gao, J.; Cai, R.; Jing, X.; Zhang, Y.; Hao, R.; Li, M. Experimental investigation on matching a conventional water source heat pump with different refrigerants for supplying high temperature water. Appl. Therm. Eng. 2020, 166, 114668. [Google Scholar] [CrossRef]
Disclaimer/Publisher’s Note: The statements, opinions and data contained in all publications are solely those of the individual author(s) and contributor(s) and not of MDPI and/or the editor(s). MDPI and/or the editor(s) disclaim responsibility for any injury to people or property resulting from any ideas, methods, instructions or products referred to in the content. |
© 2023 by the authors. Licensee MDPI, Basel, Switzerland. This article is an open access article distributed under the terms and conditions of the Creative Commons Attribution (CC BY) license (https://creativecommons.org/licenses/by/4.0/).