1. Introduction
China is a country with an extremely complex geographic environment. The stability of unstable slopes is one of the hot spots in Chinese geological disaster prevention and control projects, involving many fields such as road engineering, bridge engineering, construction engineering, and water conservancy projects. With the continuous development of Chinese economic construction, many infrastructure projects have been vigorously implemented, especially in the mountainous areas of southwest China. In the southwest mountainous areas, there are many slope projects facing complex geological conditions. Slope instability can easily cause many casualties and property losses as well as great damage to the environment. Therefore, the effective treatment of unstable slopes is required. The primary task of slope treatment is to analyze the slope stability. Currently, with the rapid development of computer technology, the stability analysis of unstable slopes has been further studied.
Pal et al. [
1] used the discrete element method to numerically simulate the active landslide weak-zone on an urban main road. Based on the two-dimensional limit equilibrium method, Noroozi et al. [
2] developed a 3D key group method for a more intuitive stability analysis of fractured rock masses. Bonilla-Sierra et al. [
3] analyzed the structural and mechanical stability of a rock slope by combining photogrammetric techniques and numerical models coupled with discrete fracture networks with DEM. Salmi et al. [
4] used UDEC for numerical simulation combined with reverse analysis to predict the mechanical attribute of the rock slope. Tang et al. [
5] proposed a combined model of the finite element method (FEM) and discontinuous deformation analysis (DDA) to study the effects of the slope angles and prefabricated cracks. Yang et al. [
6] analyzed the slope failure and deformation mechanism and studied the slope stress failure path through a hydraulic mechanical coupling model. Dong et al. [
7] used 3DEC software to establish a three-dimensional numerical model for the stress, deformation, and stability analyses of excavated slopes. Huntley et al. [
8] revealed planar subsurface features by surface exposures, borehole logs, and geophysical profiles including tabular bedding and topographic unit contact. At the same time, discrete curve features were also revealed to explain the rotation-translational failure surface of the clay-rich layer in the sliding body. Raghuvanshi [
9] applied the one-way analysis-of-variance (ANOVA) method to study the relative influence and significance of control factors on the slope stability coefficients with potential planar failure modes. Raghuvanshi [
10] comprehensively elaborated the control parameters of the rock slope plane failure mode and stability analysis methods such as kinematics methods, empirical methods, limit equilibrium methods, probability methods, and numerical methods. Bastola et al. [
11] simulated the slope based on the LS-SRM modeling method, and the results showed that the slope model with planar structural surfaces had greater deformation and worse stability than the slope model with non-planar structural surfaces. Menegoni et al. [
12] verified the failure mechanism and volume prediction of slope instability by using digital outcrop models based on a remote piloted aerial system. Barvor et al. [
13] proposed the coupling effect between geometric parameters of the composite slope and the results of finite element stress analysis for the first time. Huang et al. [
14] developed a rock contour establishing algorithm to evaluate the impact of rock distribution on slope stability. Lazar et al. [
15] determined three types of factors affecting the flooding of open pits remaining void from quantitative and qualitative perspectives. Key factors in the process of residual interstitial flooding were analyzed and its contribution to reducing or increasing the flood duration and the stability reserves of different types of slopes was analyzed. Based on the established new method of coupling satellite radar interferometry with 2D finite element modeling, Lopez-Vinielles et al. [
16] performed slope stability analysis at the regional scale. Boubazine et al. [
17] applied a combination of geological and geotechnical data with geophysical deterministic methods to confirm the clayey nature of the terrain and determine the depth of the bedrock and shear surface. Gupta et al. [
18] used the graph method combined with rock microstructure analysis to analyze the stability of cutting slopes. Paliwal et al. [
19] coded artificial neural network algorithms and developed an Android application to instantly predict the stability of residual soil and the rock slope. Ngapouth et al. [
20] used a combination of geometric, kinematic, and seismic methods to analyze the stability of cut slopes affected by falling particles and block settlement. Kumar et al. [
21] used a multi-geophysical approach for site response analysis and adopted vulnerability analysis to identify the weak area of the surface.
Many slope geological problems and disasters are related to the saturated–unsaturated mechanical properties of rock and soil. Hashiba et al. [
22] conducted an alternate loading rate test on rock using uniaxial compression tests under different water saturation conditions. The experimental results showed that the strength of the rock increased with a decrease in water saturation, and under various water saturation conditions, the increase in rock strength with a tenfold increase in loading rate was almost constant. Rabat et al. [
23] showed that water would sharply reduce the strength of some sedimentary rocks and would increase the deformability. After water saturation, the rock mass had greater porosity, water absorption capacity, clay mineral content, and lower intergranular cementation, which led to a significant reduction in the mechanical properties of rock mass such as the unconfined compressive strength, Young’s modulus, and point load strength index. In addition, there was a significant correlation between the physical properties (density, porosity, P-wave velocity, and dynamic elastic parameters) and the above-mentioned mechanical properties under dry and saturated conditions. Huang et al. [
24] studied the effect of water saturation on the elastic modulus and peak strength. The water saturation had a significant impact on the UCS, TCS, BTS, PLS, and DSS of red sandstone. In addition, at low saturation, the mechanical strength decreased faster. The water saturation had almost no effect on the strain at the transition point. A small amount of water could significantly promote the water reduction effect of clay bearing sandstone. As the water content increases, physical softening and chemical erosion would become more severe. Gong et al. [
25] classified cohesive soil into three types: clay, silty clay, and silt. The statistical characteristics of the shear strength parameters in different water saturation regions were derived respectively. For these three soil types, the average cohesion decreased with the increase in water saturation, with silt being the highest and clay being the lowest. However, for the decrease rate of the average friction angle, clay was the highest and silt was the lowest. This indicates that the friction angle of clay is more sensitive to water saturation. Huang et al. [
26] found through the sandstone strength loss experiment that when the water saturation increased from 0 to 60%, the strength of clay-bearing sandstone underwent a significant loss, and then the rate of decrease slowed down significantly. The critical saturation value of most sandstones was between 60% and 80%, exceeding the critical saturation value, and the unconfined compressive strength loss caused by an increase in water saturation was very small. Sandstone with high porosity, large elastic modulus, and a large content of clay minerals had a smaller critical saturation value and was more sensitive to water. Ke et al. [
27] studied the failure mechanism of landslides under rainfall. Under continuous rainfall, rainwater seeped into the gravel soil, caused increased pressure, formed a transient saturation zone near the rock–soil interface, and led to a weakening of the strength parameters of the rock and soil and an intensification in the plastic deformation. The results indicate that the greater the rainfall intensity, the shorter the duration of rainfall required for the accelerated deformation of landslides.
Studies have found that during the stability analysis of an unstable slope, a single analysis method is not comprehensive and objective enough to ensure the authenticity of results due to the different geological conditions, influencing factors, and slope structures of each slope. Therefore, it is necessary to integrate multiple analysis methods, learn from each other’s strengths, and leverage the advantages of various methods to make the analytical results more effective. This study took an unstable slope as an example, used a combination mode of qualitative analysis, quantitative analysis, and prevention and control suggestions for comprehensive analysis, and weight and rainstorm were selected as the calculation conditions. Firstly, qualitative analysis was conducted using the geological investigation method, followed by the analysis of the stability, and sliding force of the unstable slope using the limit equilibrium method, followed by the sensitivity analysis of the shear strength. In the end, prevention and control suggestions for an unstable slope were proposed. The research method can more objectively analyze the stability of unstable slope deformation and more accurately calculate the shear strength and the sensitivity coefficient of the rock and soil mass. This study combined a variety of analytical methods, giving full play to the advantages of each method, and made up for their shortcomings, considering the accuracy of the calculation results and the economy of the engineering application. The research results have important guiding significance for the deformation process, stability analysis, and practical engineering control of unstable slopes.
3. Results
3.1. Geological Feature
3.1.1. Stratum Lithology and Structure
According to the field investigation and drilling, the exposed strata in the study area mainly included Quaternary Holocene eluvium and deluvium (Q4el+dl), colluvium and deluvium (Q4col+dl), and the Jurassic Middle Shaximiao Formation (J2s). The layer of Q4el+dl was composed of silty clay, presenting a yellowish-brown color, locally containing weathered rock fragments, breccia, and crushed stones, with a thickness of about 1~2 m. It was widely distributed on the slope surface. The layer of Q4col+dl was composed of silty clay mixed with block stones, with a diameter of about 0.1~0.5 m and a soil–rock ratio of about 6:4. The layer of J2s was composed of mudstone and sandstone. The mudstone was purplish-red and maroon-red, mainly composed of clay minerals, with an argillaceous structure and a medium-thick layered structure. The sandstone was yellow-gray and gray-white, mainly composed of feldspar, quartz, and muscovite, with a medium fine grain structure and thick layered structure. In addition, the drilling revealed a thickness of 0.5~3.7 m for the intense weathering layer.
The research area was in the west wing of the Liangping Syncline in Chongqing, with a gently inclined and monoclinic rock formation. The occurrence of the rock stratum was 113°∠23° with a flat surface and a general opening degree of 0.5~1 mm. It was a thick to medium-thick layered structure. According to the field investigation, there were mainly two sets of structural fractures developed in the investigation area: (1) 203~275°∠57~85°, with straight and smooth fracture surfaces, combined with general conditions and a slight opening space of 0.5~3 m; (2) 304~318°∠68~71°, the crack surface was straight and smooth, with general bonding and slightly tensioned, without filling, and with a space of 0.3~2 m.
3.1.2. Material Composition and Structure
According to the field investigation and drilling exposure during this exploration, the sliding mass could be roughly divided into upper lithology and lower lithology vertically from top to bottom. The upper lithology was mainly composed of residual slope silty clay, mixed with a small amount of sand and mudstone fragments, mainly distributed on the unstable slope surface, with a thickness of about 1~2 m. It locally contained a small amount of human engineering activity fill. The lower lithology was
J2s sandstone with a thickness of 3~13 m. The slope body was mainly composed of sandstone, sliding downward along the lower mudstone layer, and the potential sliding surface was a mudstone interlayer formed by sand–mudstone boundary layers. The sandstone in the upper part had good water permeability, while the mudstone in the lower part belonged to a relatively impermeable layer. The shallow groundwater was blocked by the mudstone layer during transportation, which enriched and softened the mudstone rock mass in the sand–mudstone contact zone, then it formed a local argillization interlayer. Its main component was clay, mixed with mudstone and gravel. The exploration revealed that the thickness of the sliding zone soil was 0.2~50 m. Exploration wells revealed that the potential sliding surface was generally in a straight-line shape, with unstable drilling and drilling failure occurring at ZK1, ZK2, and ZK5 to the sliding surface position. The rock core was basically empty or a small amount of sand and mudstone fragments mixed with cohesive soil (
Figure 5). At TJ2, it revealed that the sandstone–mudstone interface was sandwiched with about a 0.2 m thick argillization interlayer, which was chartreuse clay in a soft plastic shape. The sandstone-mudstone layers exposed in TJ1 were completely separated, and the layers were filled with clayey soil mixed with sandstone-mudstone gravels, with a thickness of about 0.5 m. The clayey soil was yellow and yellowish-brown, and the clay content accounted for 60~80%. It was soft plastic with obvious argillization. The crushed stones were mainly sandstone and siltstone fragments with a particle size of 0.5~4 cm. They were intensively squeezed and milled, mostly in subangular shape, and a few were rounded and arranged in a certain direction (
Figure 5). The underlying rock mass was the purplish-red mudstone of
J2s, with an argillaceous structure, weak weathering resistance, and the dip angle of the rock layer was about 23°.
3.1.3. Hydrogeological Condition
The terrain of the investigation area was a steep slope area, and no surface water bodies such as rivers were found. Based on the occurrence conditions, the groundwater was divided into bedrock fissure water and loose rock pore water. The upper part of the unstable slope was composed of silty clay mixed with block stones, with a small thickness and poor water storage capacity. Additionally, the terrain had a steep slope, which was conducive to the runoff and drainage of groundwater. The overall direction of groundwater runoff was from west to east, and it was discharged in low-lying areas. The lower bedrock fissure water was relatively impermeable to mudstone, and although the sandstone fissures were relatively developed, it was a permeable layer and did not have water bearing conditions. Groundwater seeped through the sandstone pores and fractures, and quickly discharged toward the lower slopes after gathering at the sandstone–mudstone interface, which was also not conducive to the enrichment of groundwater. According to the ground investigations, the groundwater in unstable slope areas was mainly bedrock fissure water, with a good drainage system and the rapid dissipation of groundwater. However, during the rainy season, the water volume can suddenly increase, which is greatly affected by seasonal factors.
According to the simple hydrogeological observations of 11 boreholes, most of them experienced water leakage during drilling. After draining the circulating water inside the boreholes, the observations inside the boreholes were all dry. In the exploration well located under the steep cliff at the front edge of the unstable slope, there was groundwater seepage near the sandstone–mudstone interface. This indicates that in the upper part of the steep cliff, groundwater was easily discharged and dissipated downward through the sandstone–mudstone interface and the internal fractures of the sandstone. The terrain below the steep cliff slowed down, and the burial depth of the mudstone gradually increased. Groundwater in the sandstone was difficult to discharge, because there could be a relatively stable groundwater level. Rock masses around the groundwater level were highly susceptible to softening under the action of groundwater, especially when the sandstone–mudstone interface is prone to the formation of an argillization interlayer. During the ZK2 drilling process, it was found that the drilling circulating water flowed out from the foot of the steep cliff (
Figure 6) with a large amount of water, which indicated that the groundwater in the unstable slope areas had poor storage conditions and rapid dissipation. It also indicates that the bedding plane fractures and structural fractures of unstable slopes are very interconnected.
In summary, according to the on-site geological investigation, the geological environment in the study area is relatively complex.
3.2. Macroscopic Analysis of Unstable Slope Deformation
3.2.1. Deformation and Failure Characteristics of Unstable Slope
As above, according to the field investigation and drilling, at present, deformation signs of an unstable slope were mainly concentrated in the southern area of the rear edge of the slope, and the phenomenon of ground and house settlement and cracking was obvious. The width of the ground tensile crack was 1~30 cm, with a visible depth of 3~30 mm, and an extension of 3~12 m. Both cracks were staggered, and the extension direction of the cracks was generally consistent, forming the trailing edge of the unstable slope (
Table 1). Unloading cracks could be seen at the top of the sandstone steep cliff at the front edge of the unstable slope, and the rock mass of the steep cliff could be partially broken or even collapsed at the front edge of the slope (
Figure 7). The deformation mechanism of the unstable slope was a push type [
34].
3.2.2. Influencing Factors of Unstable Slope Deformation
The formation and development of an unstable slope can be divided into internal factors and external factors [
35,
36], mainly including the slope material composition, tectonics and topographic characteristics, rainstorm, groundwater, and surface water, and human engineering activities. Among them, the material composition and terrain characteristics of the slope are the internal factors of slope instability, while rainfall, groundwater and surface water, and human engineering activities are external factors of slope instability.
The unstable slope is a typical double layered structure composed of an upper hard rock and lower soft rock foundation. The upper rock mass is sandstone, with a medium-grained structure, which has good permeability, high strength, and is not easily weathered. The potential sliding bed in the lower part is mudstone, and according to the drilling and exploration wells, the interface between the sand and mudstone is poorly combined, with pores and mudstone interlayers. After manual excavation in the middle of the slope, a stepped bedding sandstone steep slope was formed. Based on the drilling and well exploration results, it was revealed that the mudstone at the bottom of the steep slope was buried shallower, with some parts even less than 50 cm. In addition, the central part was cut into blocks by tectonic fractures, especially fracture No. (2) 304~318°∠68~71° with good connectivity. The steep cliff surface at the front edge of the unstable slope was that fracture surface. According to historical records, the original quarry used blasting excavation for quarrying, which naturally formed the steep cliff surface after blasting. Unloading cracks that appeared at the top of the steep cliff were mostly caused by the development of that crack. During the drilling process, ZK2 was extremely unstable after drilling to 1.6~4.2 m and 5~5.1 m, with multiple occurrences of drilling failures. Subsequently, through borehole photography, it was found that there were large holes in the hole, indicating that the borehole had penetrated open fractures (
Figure 8).
Impacts of the special structural characteristics of the unstable slope on sliding masses were mainly in the following three aspects. (1) The strong gravity unloading effect of the high-steep slope caused the opening and connection of structural cracks in the rock mass at the top of the slope, formed tensile cracks at the top of the slope, and became a channel for surface water infiltration. (2) High-steep slope provided significant potential energy to the sliding mass. If sliding mass occurs, it would a generate an extremely strong destructive force during downward movement. (3) Fracture cutting caused the rock mass to appear blockily. If the slope slides, the sliding mass is easily decomposed into many blocks during its movement, and its large potential energy leads to a wider threat range of the slope.
The effect of water was the main triggering factor for the deformation of unstable slopes [
37,
38]. According to local historical records, when the crack first formed in 1998, the sound of water flowing from the bottom of the crack could be heard. This indicates that in the early stage of crack formation, there had been displacement and the formation of pores at the sandstone–mudstone interface. Although many surface cracks had been filled in the later stage, the sandstone had good permeability, and surface water seeped through some cracks and the sandstone pore fractures. When encountering relatively impermeable mudstone, it accumulated at the sandstone–mudstone interface, continuously softening the mudstone rock mass, and continuously reducing the shear strength of the structural plane. According to the investigation, most of the deformation of unstable slope occurred after the rainstorm or rainy season, or significantly expanded after rainstorm. This indicates that rainfall has been the main triggering factor for deformation in recent years.
The main human engineering activities on the unstable slope were sandstone mining on the front edge of the slope in 1998 and the excavation of two railway tunnels. Sandstone mining formed high-steep slopes, caused local weak layers to be exposed, and created sliding space for rock masses. Under the action of gravity unloading, unloading cracks formed at the top of the slope or structural cracks widened and lengthened, which was beneficial for the recharge, runoff, and discharge of groundwater. After the cessation of sandstone mining, the trend in crack growth was relatively slow. After the tunnel construction, due to the use of blasting, there was a strong sense of vibration on the slope surface, and the trend of crack growth significantly accelerated. After the construction was completed, it returned to a slower level. In 2013, the second railway tunnel began construction, and the trend in the crack growth accelerated again. At the same time, new cracks appeared in the middle of the trailing edge, causing a certain pool of water to leak out overnight. Thereout, it can be concluded that the vibration of the railway tunnel construction blasting damaged the integrity of the rock mass to some extent, reduced the degree of bonding of the rock mass structural planes, and intensified the deformation of the unstable slope.
3.3. Limit Equilibrium Analysis of Unstable Slope Stability
In the evaluation of slope stability, it is usually necessary to assume the shape and position of the most dangerous sliding surface (i.e., the critical sliding surface) to find the minimum safety factor of the slope. Whether the failure is caused by static force or seismic force, the sliding surface is an arbitrary shape, in particular, a slope with complex shape and variable material properties, the greater the difference between the shape of the critical sliding surface and the arc. The limit equilibrium method evaluates the stability of the slope by analyzing the stress state of the slope under various failure modes and the relationship between the anti-sliding force and sliding force on the slope [
39]. Based on the Moore–Coulomb shear strength theory, this method divides the slope into several vertical soil strips, establishes the equilibrium equation of the forces acting on these vertical soil strips, and solves the safety factor.
The unstable slope was in the seismic fortification intensity VI area. Without considering the seismic load, the upper part of the slope body of the first, second, and third sections had a highway that considered the vehicle load of 20 kN/m, and the prevention and control engineering grade was intended to be level 3. We combined the investigation standard of geological disaster prevention and control engineering (DB50/T 143-2018) to value the stability safety factor of the unstable slope as . In this study, weight and rainstorm were selected as the calculation conditions.
The main calculation parameters for the stability check of the unstable slope were divided into physical attribute parameters and shear strength parameters. The physical attribute parameter was mainly the weight of the sliding mass, while the shear strength parameters were mainly the cohesion and internal friction angle of the potential sliding zone soil.
(1) Physical attribute parameters.
Based on the laboratory test results of the sandstone, the sliding mass weight was determined as the calculated weight parameter based on the average value of the tests. The natural weight was 24.1 kN/m3, and the saturated weight was 24.5 kN/m3.
(2) Shear strength parameters of the potential sliding zone soil.
The rationality of selecting the calculation parameters is the key to evaluating the stability of an unstable slope, among which the value of the shear strength index of the sliding zone soil is particularly important. This study used laboratory tests and a field large shear test to calculate the value.
Comprehensive value of the laboratory test. The statistical results of the laboratory test on the sliding soil samples in the drilling and exploration wells are shown in
Table 2. Based on the current state of the unstable slope, the peak value of the laboratory test was taken. That is, under the natural state:
= 30.1 kPa,
= 11.1°; under the saturated state:
= 19.9 kPa,
= 8.5°.
Field large shear test. This was conducted at the potential sliding surface, and the test result showed that the saturated value of the shear strength value was = 35.7 kPa, = 14.8°.
Comprehensive value. Based on above parameters and the actual situation on site, the shear strength value of the sliding zone soil for this calculation was based on the large shear test, combined with the laboratory test, to determine comprehensively according to the weight of each value. In the weak-deformation zone, the value of the field large shear test was directly taken. As the TJ1 sliding zone soil was sampled for the laboratory test and the soil sample contained many crushed stones, the test was conducted after remolding the soil sample, so the statistical value was relatively small. Therefore, the weight of the strong-deformation zone for the large shear test was 0.8, and the weight of laboratory test was 0.2. The calculation results are shown in
Table 3. That is, the weak-deformation zone is
= 35.7 kPa,
= 14.8° and the strong-deformation zone is
= 32.54 kPa,
= 13.54°.
According to the
Technical Code for Building Slope Engineering, the unstable slope stability state can be divided into four types. Stable:
,
is the safety factor of the anti-sliding stability; basically-stable:
; unstable:
; instable:
. According to the calculation results for each section, the stability states and residual sliding thrust of each model for the unstable slope were respectively obtained, as shown in
Table 4.
Through the field investigation and above stability calculation results, combined with the macroscopic deformation characterization of the unstable slope, it could be seen that the strong-deformation zone of the unstable slope was at an unstable state under the rainstorm. The weak-deformation zone was at a stable state under the rainstorm. The lower step of the unstable slope front was stable under the natural and saturated states.
3.4. Analysis on Sensitive Factors of Unstable Slope Stability
In slope stability evaluation, the shear strength index of the sliding surface (potential sliding surface) is the most important index for the unstable slope, and a change in this index plays a fundamental role in the change in the stability coefficient. However, shear strength often has spatiotemporal variability, so sensitivity analysis of the shear strength parameters is required [
40,
41]. In order to analyze the sensitivity of the cohesion and internal friction angle of the sliding mass to the landslide safety factor, the average value of the cohesion and internal friction angle was selected as the reference value, the calculated safety factor value was taken as the reference value, and then the change in safety factor with the change in the cohesion and internal friction angle was calculated, respectively. According to the geotechnical mechanical test results and the field large shear test indicators, the range of saturated shear strength parameters was as follows:
= 27~39 kPa,
= 6~16°. Therefore, the average value of cohesion and internal friction angle was,
= 33 kPa,
= 11°, and Model 3 was selected for the sensitivity analysis of the unstable slope. The calculation results are shown in
Table 5. It can be seen from the table that when the cohesion and internal friction angle had larger values, the sensitivity of the cohesion to the safety factor was less than the sensitivity of the internal friction angle to the safety factor. When the two parameters had a smaller value, the sensitivity of the cohesion and the sensitivity of the internal friction angle to the safety factor tended to be the same, and the difference in the impact of cohesion and the internal friction angle to the safety factor was not obvious. Therefore, the sensitivity coefficient of the
-value was 0.64, and the sensitivity coefficient of the
-value was 0.58.
3.5. Comprehensive Stability Evaluation of Unstable Slope
In conclusion, the macroscopic qualitative analysis of the unstable slope was that the weak-deformation zone was stable and basically-stable under the natural state, and was basically-stable under rainstorm. The strong-deformation zone was basically-stable under the natural state, and was unstable under rainstorm. There was a great sliding possibility under rainstorm or continuous rainfall. The quantitative calculation results were as follows: the strong-deformation zone was unstable under rainstorm, and the weak-deformation zone was stable under rainstorm. Therefore, according to the macroscopic qualitative analysis and quantitative calculation, the stability of the unstable slope was comprehensively evaluated as follows: the strong-deformation zone of the unstable slope was basically-stable under the natural state and unstable under rainstorm; the weak-deformation zone of the unstable slope was stable under the natural state and basically-stable under rainstorm.
4. Discussion
4.1. Formation Mechanism and Deformation Failure Mode of Unstable Slope
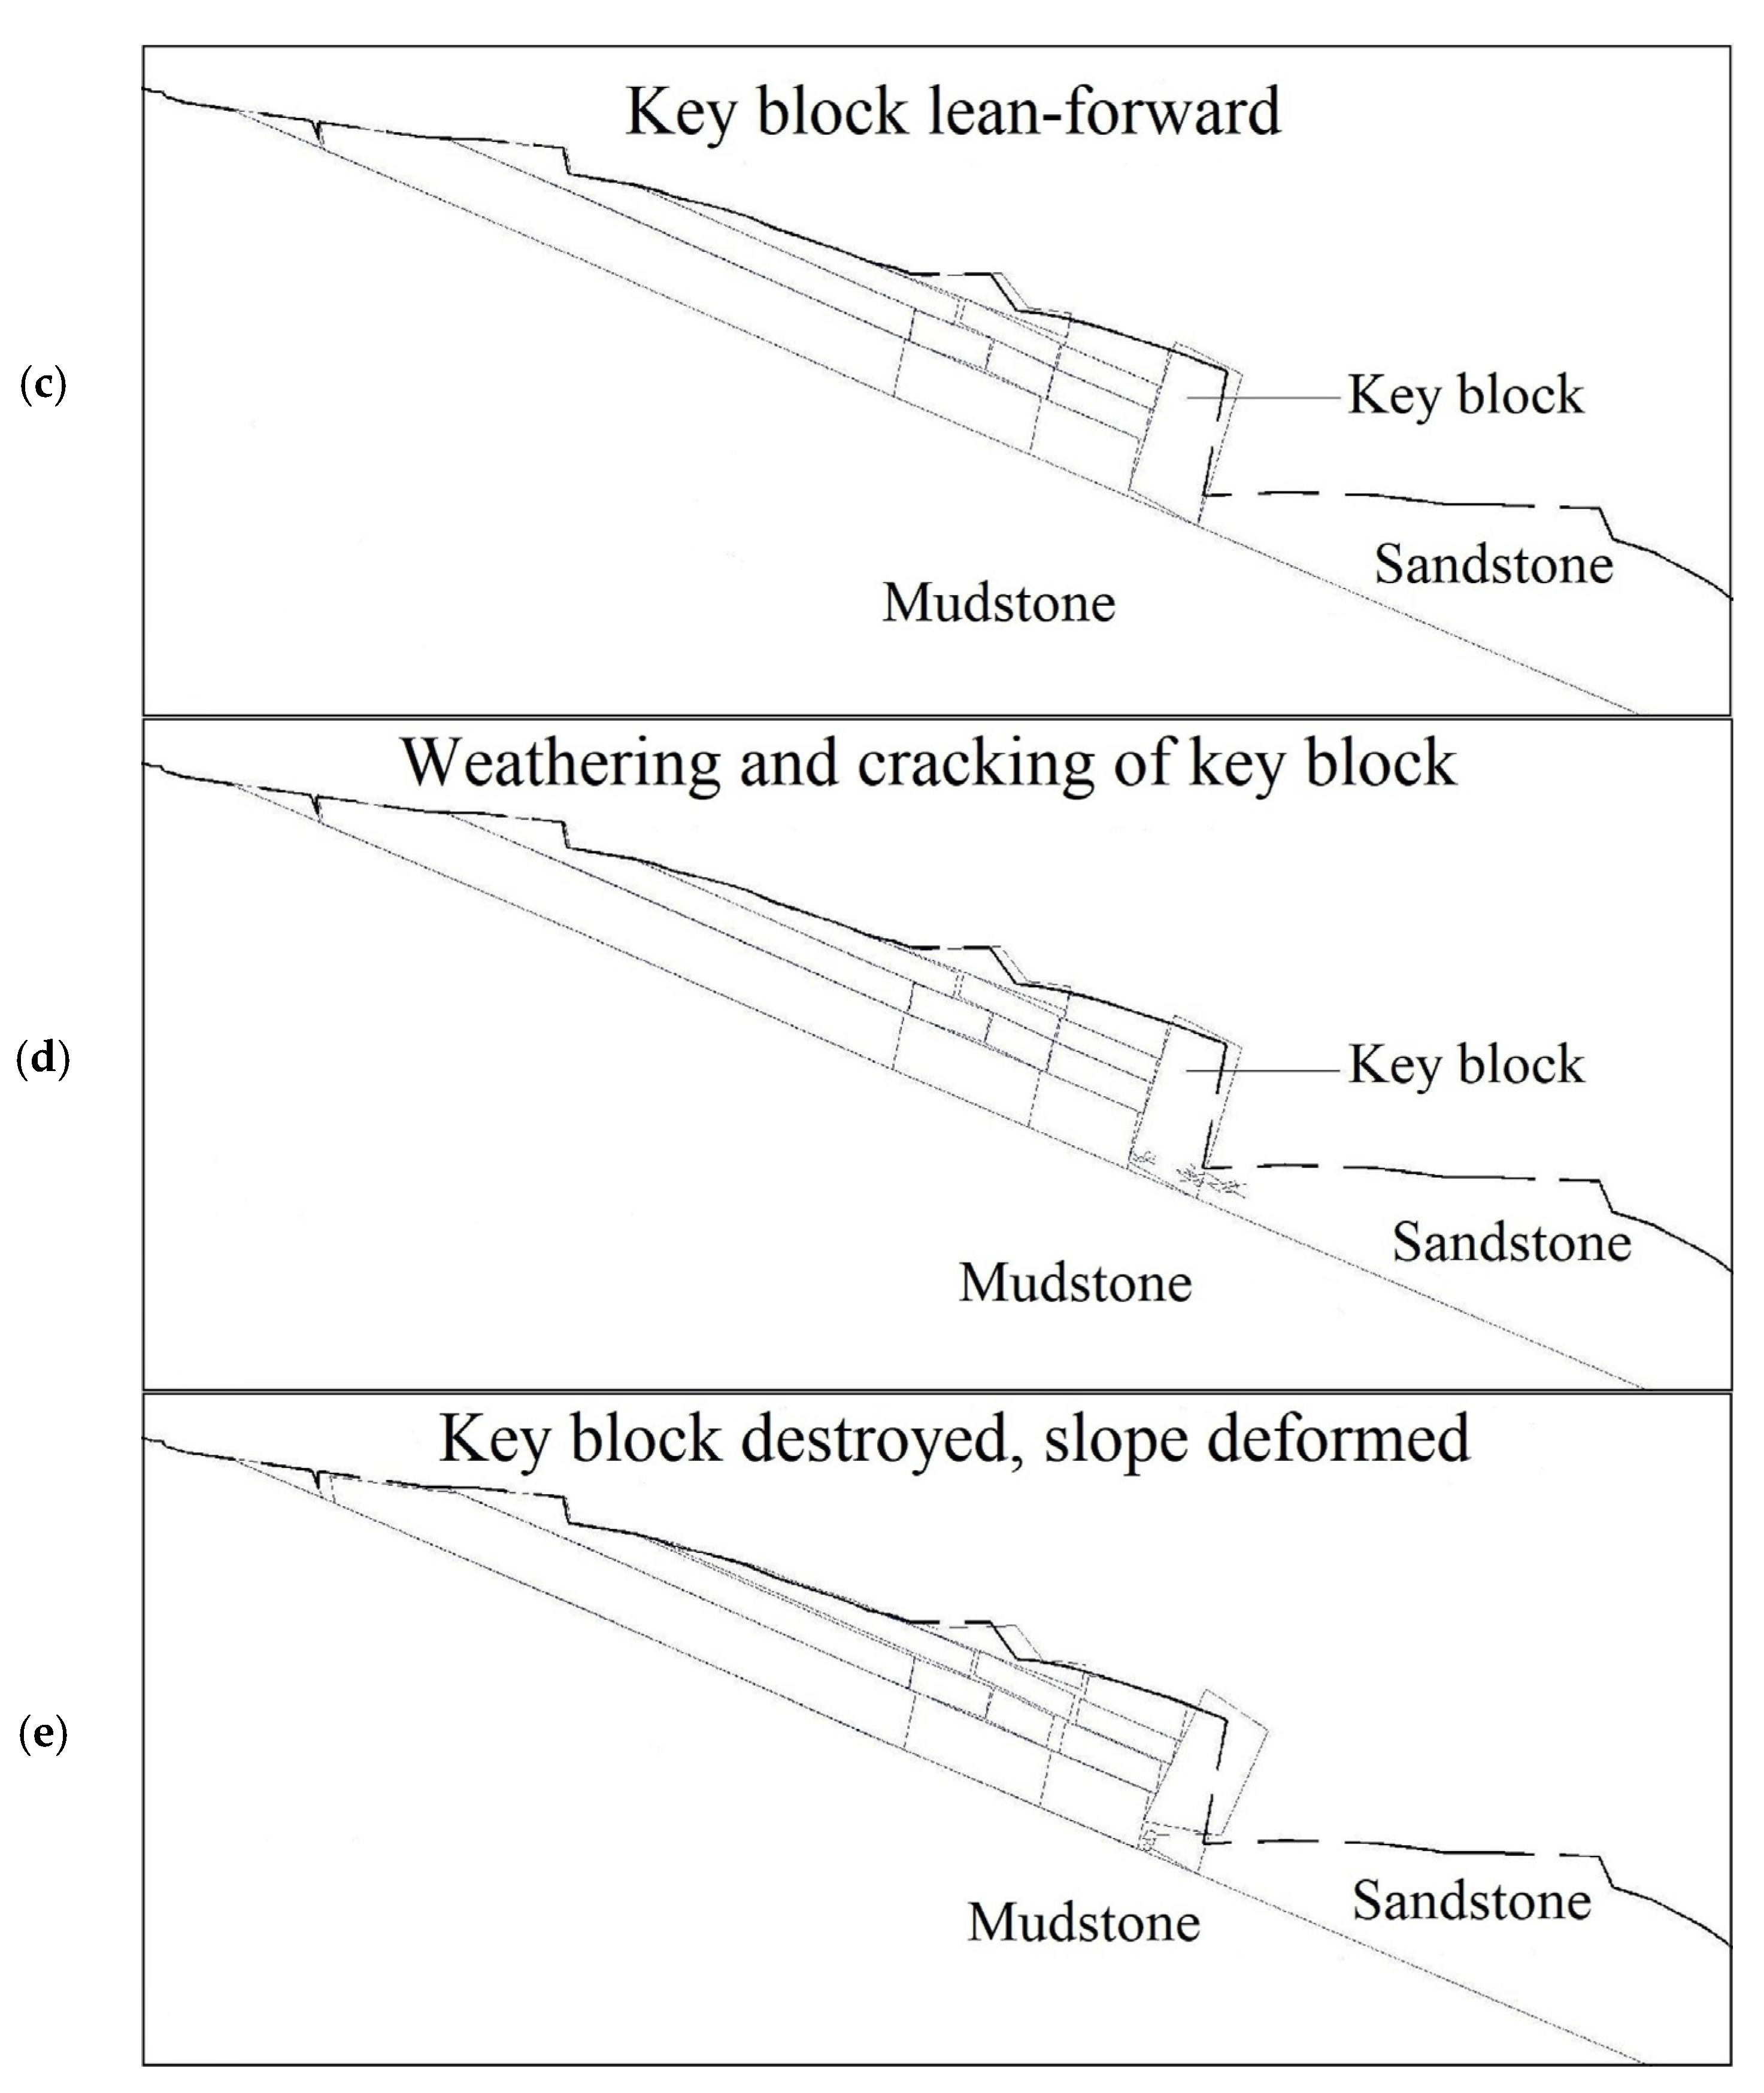
The inclined rock mass at the front edge of the unstable slope was the key block for the deformation (
Figure 9). After sandstone mining, the rock mass on the surface of the steep cliff lost its upper support and was cut into blocks under the action of crack expansion. These rock masses gradually leaned forward under the sliding force of the trailing edge slope, supported by the unconnected sandstone rock masses at the foot of the steep cliff, and the unstable slope was in a basically-stable state. Therefore, the key blocks became the determining factor for the instability of the slope. Under the influence of weathering and the compression of stresses on both sides, the strength of the rock mass gradually decreased and the key blocks were finally completely cut off. The unstable slope lost the support of key blocks, the stress was suddenly released, and it formed a huge initial velocity. Below the front edge of the unstable slope was the original slope, with a slope of about 20 degrees. The sliding mass was prone to long-distance sliding and had a wide range of damage.
Based on the geological feature investigation and the stability analysis of the unstable slope combined with the current situation of on-site geographical environment, this study deduced the historical formation process of the unstable slope (
Figure 10).
4.2. Stability Judgment of Unstable Slope
The formation of a steep cliff by the artificial mining of sandstone was the main cause of unstable slope deformation. According to on-site investigation, most of the sandstone mining did not cut through the sandstone, and only the southern part of the steep cliff at the front edge of the slope experienced severe deformation, which was cut through the sandstone and back-filled. As most areas of the pre-cliff did not cut through the sandstone, the local overhanging mass did not cause overall deformation of the unstable slope. However, sandstone mining adopted blasting construction, and due to the impact of blasting vibration, the opening degree and continuity of the original structural cracks in the rock mass increased. Due to their mutual cutting effect, the rock mass at the front edge of the unstable slope separated in blocks, and the local rock mass tilted forward under the sliding force of the rear rock mass. Due to the obstruction of the front cutting through the rock mass and back-filling with rock and soil, the rock mass had not completely collapsed, but a wide crack had formed at the back of the rock mass, becoming the displacement space for the rear rock mass. Thus, cracks in the rear rock mass gradually opened and connected, becoming a channel for the infiltration of surface water. After the infiltration of surface water, it was blocked by the relatively impermeable layer of mudstone, which gathered at the interface of the sandstone and mudstone, and it became a promoting factor for the deformation of the unstable slope.
The action of groundwater was the main triggering factor for slope deformation. On the one hand, due to the unique structure of the unstable slope, the sandstone rock mass underwent crack expansion and enhanced permeability under the influence of human engineering activities. Groundwater seeped down to the mudstone interface, while the mudstone layer was steep, and the unstable slope had good drainage conditions at the front edge. Groundwater quickly flowed toward the front edge drainage outlet. Under the long-term action of that process, the contact surface between the sand and mudstone was continuously softened. According to the drilling and exploration wells, holes were partially hollowed out and a large amount of mud was mixed to form weak interlayers, greatly reducing the shear strength of the sandstone–mudstone interface. On the other hand, due to the formation of muddy weak interlayers at the sandstone–mudstone interface, under the long-term continuous rainfall, the shear strength of the cohesive soil in the weak interlayers decreased again after being saturated with water, and the sliding force of the unstable slope would greatly increase.
According to the field investigation and the above research results, currently, the deformation of the unstable slope is mainly distributed at the rear edge of the slope. The main manifestations are as follows. Many tension cracks and dislocation phenomena have appeared at the rear edge of unstable slope as well as cracks in the building walls and foundation displacements on the slope. In addition, the sandstone scarp rock mass at the front edge of the unstable slope has cracked, deformed, and partially tilted forward. The overall extension direction of cracks was mostly 30~40°, and the cracks were mostly linear and polygonal, with cracks basically penetrating. Macroscopic observation showed that the unstable slope was generally stable and basically-stable under the natural state, and basically-stable and unstable under rainstorm. According to the failure mode analysis of the unstable slope, the steep below the front edge of the north side of the unstable slope has the possibility of sliding failure, which is stable and basically-stable in the natural state, and basically-stable and unstable under rainstorm.
The unstable slope has obvious signs of deformation, and calculation results showed that it was in an unstable state under rainstorm. As the key block at the front edge of the slope is the key anti-slip point of the unstable slope, its failure modes determine that the sliding failures are sudden and have the possibility of remote destruction. It seriously threatens the safety of residents on unstable slope and roads near the front edge of the slope. Therefore, timely and effective treatment on the unstable slope is extremely urgent.
4.3. Suggestions for Prevention and Control of Unstable Slope
4.3.1. Engineering Scheme Suggestions
Based on the above comprehensive analysis, there is a great possibility of sliding and shearing out of the unstable slope under rainstorm or continuous rainfall. Therefore, the study suggests setting up retaining engineering at the front edge of the unstable slope adjacent to the sandstone cliff by using a pile-anchor system for retaining [
42,
43], and combining the actual situation with surface water interception and drainage measures and displacement monitoring.
Retaining engineering. Gravity retaining walls were mainly used to support the second level steep slopes from the third, fourth, and fifth sections (
Figure 11).
Surface water interception and drainage: This mainly involves building interception ditches at the rear edge of unstable slopes to prevent surface water from entering the sliding body. At the same time, vertical drainage ditches are built inside the sliding body to drain rainfall, surface water, and groundwater inside the sliding body.
Monitoring: To conduct displacement monitoring on the unstable slope.
Surface water interception and drainage: This mainly refers to interception ditches at the rear edge of the unstable slope to prevent surface water from entering the sliding body, and vertical drainage ditches in the sliding body to drain rainfall, surface water, and groundwater.
Monitoring: Monitoring the displacement of the unstable slope.
4.3.2. Engineering Parameter Suggestions
(1) For potential sliding zone soil. The value of the strong-deformation zone under the saturated state was = 32.54 kPa, = 13.54°. The value of the weak-deformation zone under the saturated state was = 35.7 kPa, = 14.8°.
(2) For sandstone weight: This was 24.1 kN/m3 under the natural state and 24.5 kN/m3 under the saturated state. The standard value of the sandstone shear strength under the natural state was = 2025 kPa, = 37.7°; under the saturated state = 1417 kPa, = 26.4°.
(3) For mudstone: The natural weight value was 25.7 kN/m3. The value of the natural compressive strength was 9.05 MPa. The value of the saturated compressive strength was 5.75 MPa. The shear strength value was = 2450 kPa, = 35.05°. The tensile strength value was 420 kPa. The horizontal resistance coefficient was 100 MN/m4. The characteristic value of the foundation bearing capacity was 2986 kPa. The characteristic value of the bonding strength was 220 kPa. The base friction coefficient was 0.40.
5. Conclusions
This study conducted a detailed geological investigation of an unstable slope, analyzed the geological environmental conditions of the slope, and divided the slope into the strong-deformation zone and weak-deformation zone. Macroscopic qualitative analysis and quantitative calculation were used to comprehensively analyze the slope stability. According to the field data and the limit equilibrium method, the strong-deformation zone of the slope was basically-stable under the natural state and unstable under rainstorm while the weak-deformation zone of the slope was stable under the natural state and basically-stable under rainstorm.
This study analyzed the formation mechanism and deformation failure mode of the unstable slope. The artificial exploitation of sandstone to form steep cliffs was the main cause of slope deformation, while the action of groundwater was the main triggering factor of slope deformation. The failure mode of the unstable slope lies in the key block at the front edge of the slope, which acts as a barrier, to slide, being sheared, or fractured by the sliding force at the back edge. Slope sliding failure had the characteristics of suddenness, fast sliding speed, and wide impact range. Based on the current situation of the unstable slope, the historical formation process of the slope was inferred.
Based on the comparison of the development time between the railway tunnel construction and signs of unstable slope deformation, it was determined that the railway tunnel blasting construction had a significant impact on the stability of the unstable slope. The calculation results showed that the unstable slope could very easily slide during the rainstorm period, threatening the safety of the lives and properties of the residents around the unstable slope and road traffic safety. For this unstable slope, we propose prevention and control measures and parameter suggestions. The study results provide an important theoretical basis for the further effective treatment of this slope and other similar slopes.
In this study, multiple analysis methods were used to carry out a comprehensive analysis. This comprehensive analysis method can give full play to the advantages of each method and make up for their shortcomings. The stability analysis of unstable slope deformation can be conducted more objectively, and the shear strength and sensitivity coefficient of the rock and soil mass can be calculated more accurately. The calculation conditions, weight and rainstorm, can help to balance the accuracy of the calculation results and the economy of the engineering application. The research results have important guiding significance for the deformation process, stability analysis, and practical engineering in the prevention and control of unstable slopes.


