Article

Application of High-Intensity Ultrasound on Acerola (Malpighia emarginata) Juice Supplemented with Fructooligosaccharides and Its Effects on Vitamins, Phenolics, Carotenoids, and Antioxidant Capacity

by
Fabiano A. N. Fernandes
1,
Valéria O. Santos
1,
Wesley F. Gomes
2 and
Sueli Rodrigues
3,*
1
Chemical Engineering Department, Federal University of Ceara, Campus do Pici, Bloco 709, Fortaleza 60440-900, Brazil
2
Department of Chemistry, Federal University of Sergipe, Av. Marechal Rondon s/n, São Cristóvão 49100-000, Brazil
3
Food Engineering Department, Federal University of Ceara, Campus do Pici, Bloco 858, Fortaleza 60440-900, Brazil
*
Author to whom correspondence should be addressed.
Processes 2023, 11(8), 2243; https://doi.org/10.3390/pr11082243
Submission received: 29 June 2023 / Revised: 19 July 2023 / Accepted: 25 July 2023 / Published: 26 July 2023

Abstract

:
Acerola is considered a superfruit, rich in vitamin C, phenolics, and carotenoids, and having a high antioxidant capacity. However, it is poor in oligosaccharides. Ultrasound technology can improve the bioavailability of several bioactive compounds, improving the nutritional content of several fruit juices. This work evaluated the use of ultrasound processing on acerola juice supplemented with fructooligosaccharides (FOS; 1% w/w) and its effects on the availability of vitamins, carotenoids, and phenolic content. The antioxidant capacity of the juice was correlated with its bioactive contents. The study evaluated the effects of important sonication parameters, such as ultrasonic power density, processing time, and processing temperature. The application of ultrasound was efficient in increasing the availability of some vitamins. As a result, ultrasound application increased the availability of vitamins B1, B3, B5, C, carotenoids, and phenolic compounds. This improvement increased the antioxidant activity of the FOS-enriched acerola juice.

1. Introduction

Functional foods are a growing market, with many products being developed by the industry. Functional foods provide health benefits beyond basic nutrition and can be designed to improve one or many functions of the body. These products can help prevent chronic diseases, such as heart disease, cancer, and diabetes; they can improve gut health, reduce the risk of digestive problems, and improve cognitive functions, reducing the risk of age-related cognitive decline; and they have several other health-related benefits [1,2].
Fructooligosaccharides (FOS) are among the many prebiotic oligosaccharides available in the market. These oligosaccharides consist of a chain of fructose molecules with a glucose molecule at the end of the chain [3]. These prebiotic oligosaccharides are not digested by the human body but function as a food source for beneficial bacteria in the human gut. After ingestion, these oligosaccharides can promote the growth of beneficial bacteria, improving gut health and reducing the risk of digestive problems, and boosting immune function. Some prebiotic oligosaccharides can also enhance the absorption of minerals and may have anti-inflammatory effects [4,5].
Acerola (Malpighia emarginata) is a berry that grows in the tropical regions of South America and the Caribbean. Acerola is a significant source of vitamin C and a good source of vitamin A and contains vitamins B1, B2, B3, B5, and E in lesser amounts [6]. Its content of vitamin C (>10 g/kg of fruit) is much higher than most citrus fruits; thus, it has been labeled by the market as a superfruit. Besides vitamins, acerola is rich in several antioxidants, such as anthocyanins, flavonoids, and carotenoids [6]. However, acerola is poor in oligosaccharides.
The food, cosmetic, and pharmaceutical industries use acerola due to its bioactive compounds. In the food industry, acerola is mainly used to produce juices, smoothies, sweets, and jams and as a natural food coloring ingredient. Thermal pasteurization may ensure the safety of acerola products but negatively affects their nutritional quality, mainly vitamin C and pigments [7,8,9]. To avoid thermal degradation, non-thermal processes should be preferred when treating acerola products.
Ultrasound processing is among the many non-thermal processes available for the food industry. The ultrasonic treatment is effective against microorganism spoilage and undesired enzymatic effects [10,11,12,13,14] and has the benefit of preserving or improving the nutritional quality of several fruit juices [15,16,17,18].
The effects of sonication on vitamin C, carotenoids, phenolics, and other antioxidants have been addressed for many juices, such as beetroot [15], fig [16], strawberry [17], kutkura [18], melon [19], pineapple [20], grape [21], and several other fruit juices. Reports on the ultrasonic treatment of fruit juices show divergent results regarding the effects of this technology. While some studies report that sonication decreased the concentration of bioactive contents [15,18,22,23], others report significant improvements in the same bioactive compounds [24,25]. Many ultrasonic processes on fruit products show a tendency to initially increase the concentration of bioactive compounds followed by a decrease after long periods of sonication. The tendency is usually related to an initial release of membrane or apoenzyme bond compound followed by degradation of these compounds by reactive oxygen species produced during sonication [26,27,28]. Thus, ultrasonic treatments must be optimized to avoid overexposure to reactive oxygen species that may compromise the treated product. Sonication, when optimized, can improve the antioxidant contents in juices. The effects of ultrasound on A, D, E, K, and B-complex vitamins have yet to be discovered, since very few works have been conducted on this subject. In previous work with the sonication of acerola juice conducted by our group, we showed that under some optimal conditions, it was possible to slightly improve the content of vitamins A, B3, B5, and C; however, under sub-optimal conditions, a significant decrease in vitamins was observed [29].
Fructooligosaccharides depolymerize when subjected to sonication because they react with hydroxyl radicals [30]. Therefore, FOS may act as a radical scavenger and may offer a protective effect against natural radical scavengers, such as phenolics, carotenoids, vitamin C, and other bioactive compounds. This work applied ultrasound processing to acerola juice with added commercial fructooligosaccharides under the conditions usually used for juice preservation. The influence of ultrasound application on vitamins A, B1, B2, B3, B5, B6, C, and E and the impact on the antioxidant capacity, total phenolics, and carotenoids were evaluated. Furthermore, the action of FOS as a radical scavenger was assessed.

2. Materials and Methods

2.1. Preparation of Samples

Acerola (Malpighia emarginata) was obtained from a local producer (Fortaleza, Brazil) as frozen pulp. The pulp was produced by pressing the seedless berries and freezing the pressed pulp. The fructooligosaccharide (FOS) was obtained from Siba Ingredientes (Biofis FOS, São Paulo, Brazil). The acerola pulp was mixed with distilled water (1:1 v/v) to produce the acerola juice. The juice was then supplemented with FOS (1% w/w), which was dissolved into the juice.

2.2. Ultrasound Processing

The ultrasonic treatment was conducted using a probe ultrasound (18 kHz, Unique model USD500, Piracicaba, Brazil). An experimental design was developed to evaluate the effects of ultrasonic power density (1000, 3000, and 5000 W/L), temperature (10, 25, and 40 °C), and processing time (2.5, 5, 10, and 15 min). Sonication occurred in a jacketed beaker containing 100 mL of FOS-enriched acerola juice. Temperature control was attained by continuous water flow through the jacket of the beaker. All experiments were carried out in triplicate.

2.3. Determination of Vitamins

Vitamins A, B1, B2, B3, B5, and E content were determined according to the procedures described by Rizzolo and Polesello [31] and Jedlick and Kilmes [32]. A full description of the extraction procedure, measurements, and validation can be found in [33] and was not reproduced herein due to auto-plagiarism policy concerns. Vitamin C content was measured by the oxalate method described by Selimovic et al. [34]. All analyses were carried out in triplicate. The results were expressed as vitamin gain/loss using the untreated juice as a reference, as presented in Equation (1).
R A = A   S A   R e f × 100
where AS is the absorbance of the sample, ARef is the absorbance of the reference (untreated juice), and RA is the relative amount (%)

2.4. Total Phenolics, Total Carotenoid Content, and Antioxidant Capacity

Total phenolic content was measured by the Folin–Ciocalteu method described by Sánchez et al. [35]. The antioxidant capacity was measured by the ABTS and FRAP methods described by Re et al. [36] and Benzie et al. [37]. The total carotenoid content was measured by the method described by Rodriguez-Amaya [38]. All analyses were carried out in triplicate.

2.5. FOS Concentration and Degree of Polymerization

FOS was characterized by Thin Layer Chromatography (TLC) following the method proposed by Shiomi et al. [39] and fully described in Almeida et al. [40].

2.6. Hydrogen Peroxide Concentration

The reactive oxygen species concentration was determined as hydrogen peroxide equivalent because hydrogen peroxide is the main reactive oxygen species produced in ultrasound processing of aqueous solutions, including fruit juices. The concentration of hydrogen peroxide was determined using the iodine method described by Ovenston and Rees [41]. All measurements were carried out in triplicate.

2.7. Statistical Analysis

Multifactorial ANOVA was applied to statistically evaluate the results, and the LSD (least significance difference) intervals were calculated at p < 0.05.

3. Results and Discussion

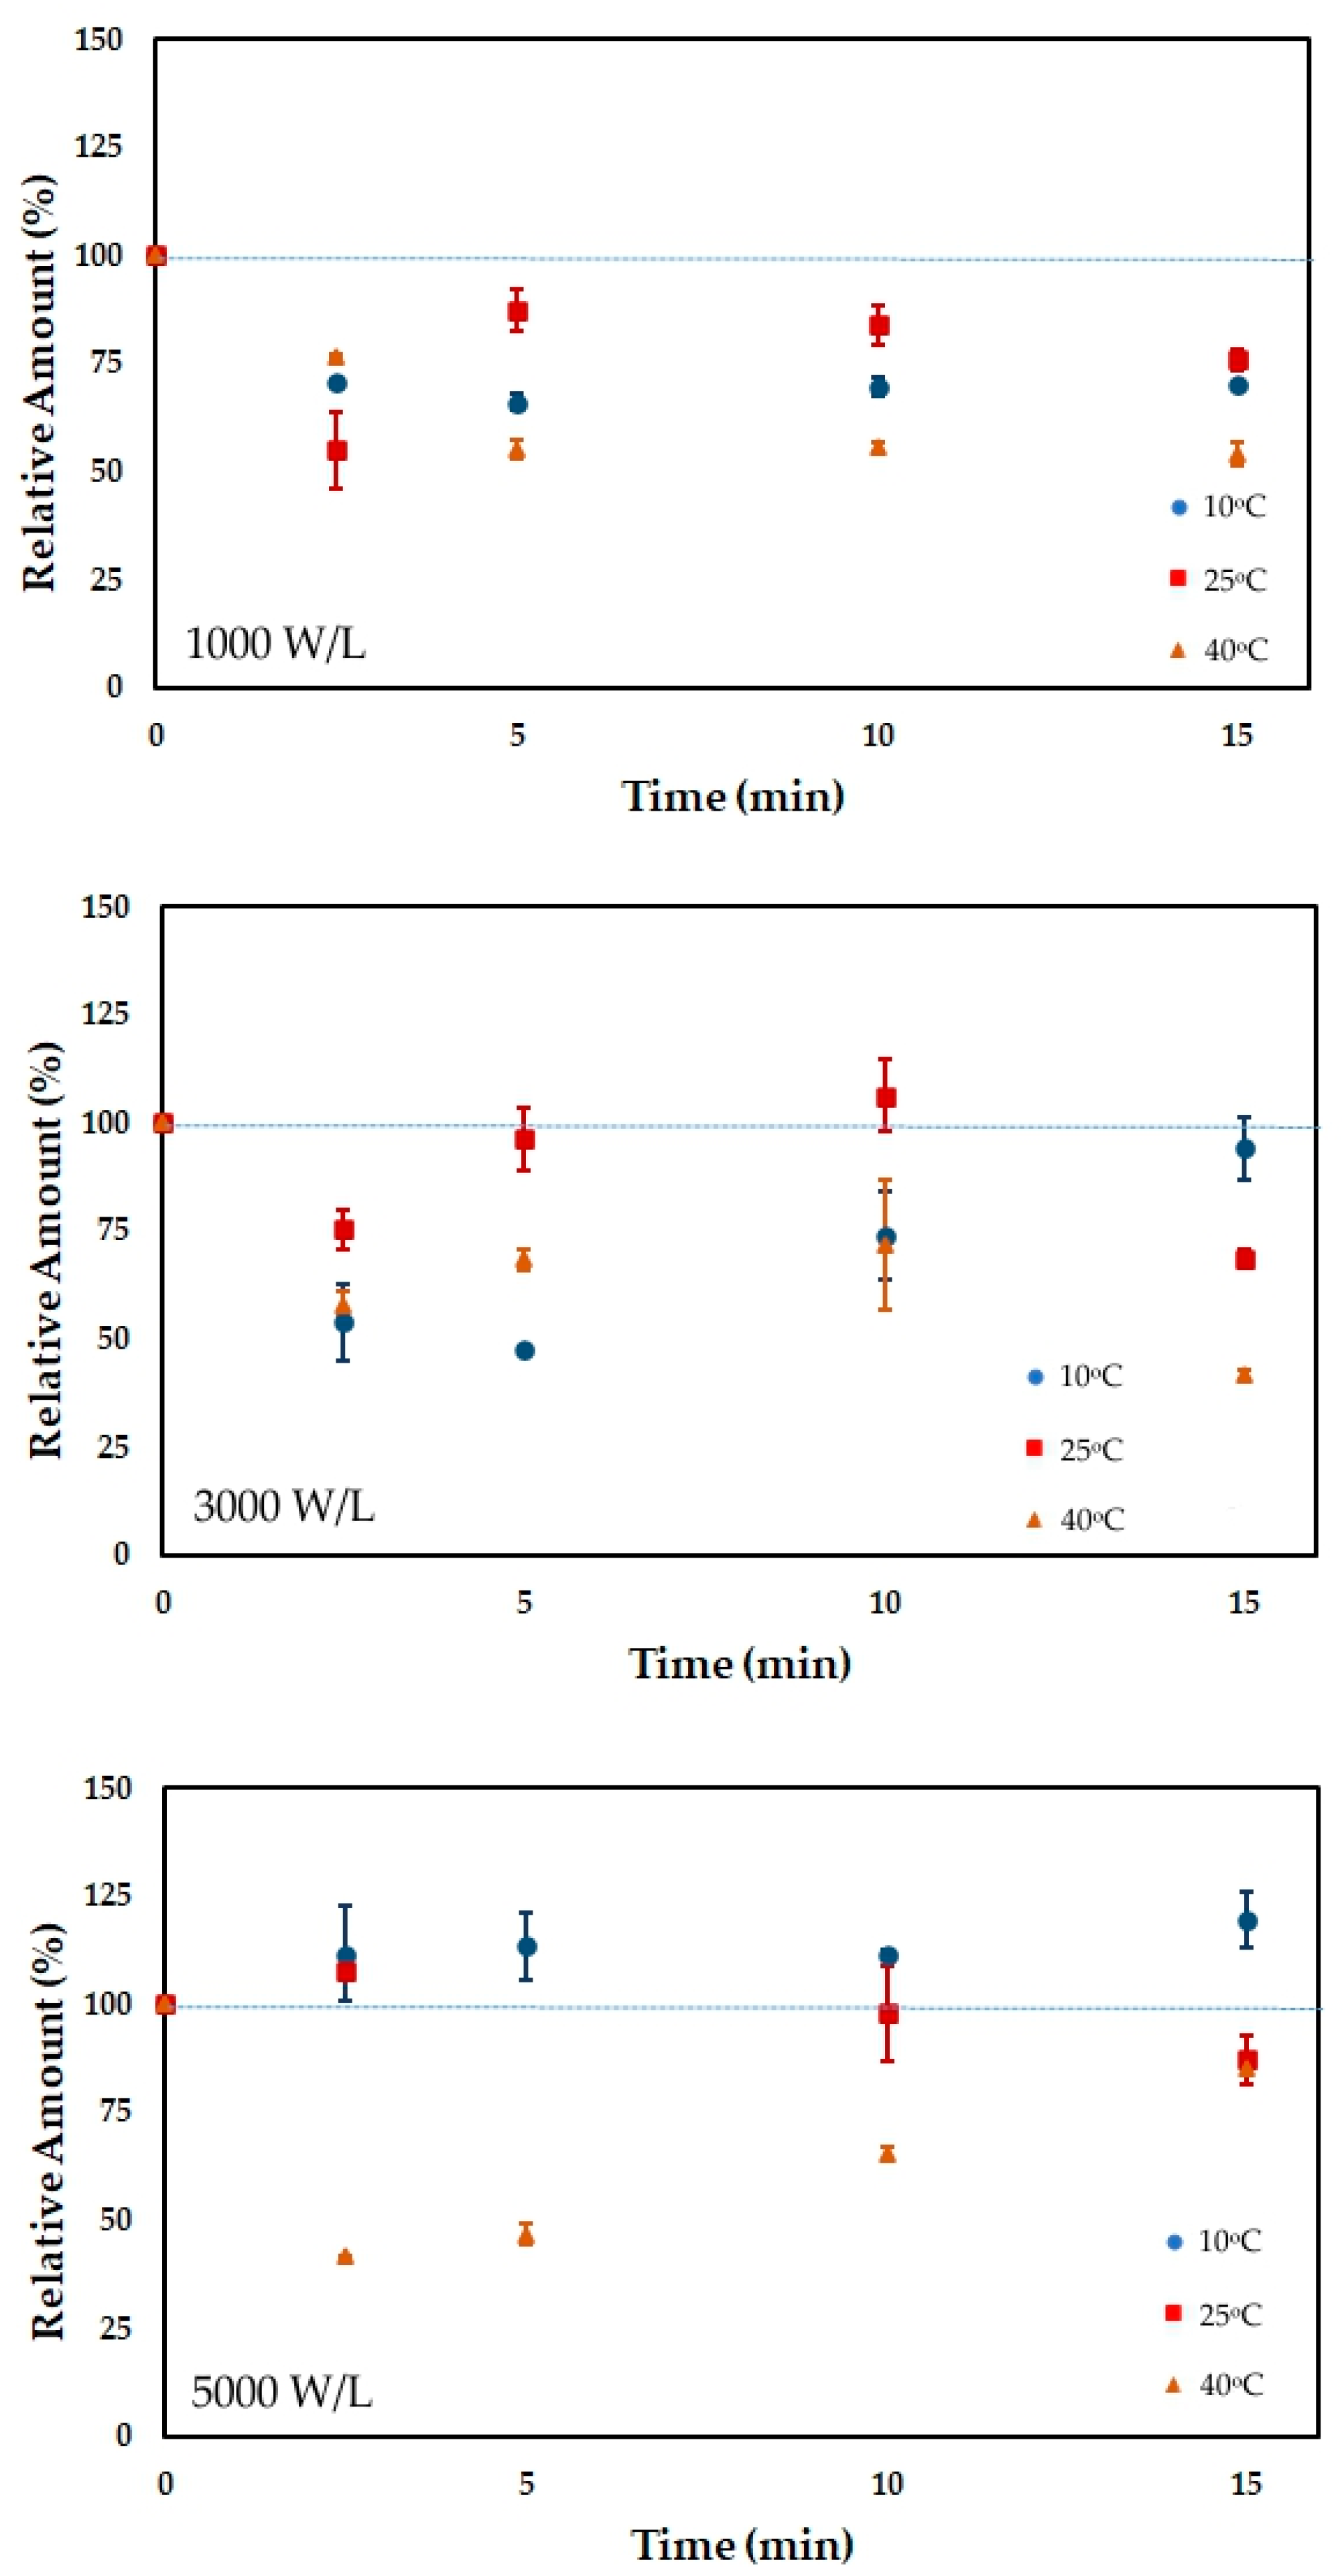
3.1. Vitamins Content

The relative amount of vitamin B1 after ultrasound processing is presented in Figure 1. Sonication increased vitamin B1 content in the first 10 min of processing. The increase may be related to converting the phosphorylated form to the free form of vitamin B1, which the analytical method detects [42]. After 10 min of processing at 5000 W/L, the vitamin content decreased due to a probable degradation induced by the hydroxyl radicals produced during sonication. Lower power densities (1000 and 3000 W/L) did not degrade the vitamin B1 in FOS-enriched acerola juice, which increased between 19 and 34% relative to the untreated juice. FOS showed a protective effect on vitamin B1 since an increase in its content was observed herein, whereas in a previous work without FOS addition vitamin B1 showed a significant loss during sonication [29]. The processing temperature did not significantly affect (p < 0.05) the retention of vitamin B1.
Figure 2 presents the relative amount of vitamin B3 (niacin) in the sonicated FOS-enriched acerola juice. The trend observed with vitamin B3 was similar to that observed for vitamin B1. The contents of vitamin B3 increased during the first 10 min of sonication and then decreased. Sonication had probably broken the chemical bond between vitamin B3 and nucleotides, making it more biologically available. This result is interesting because approximately 70% of vitamin B3 is biologically unavailable in raw food [43,44]. After 10 min, the free radicals produced during sonication may have reacted with the vitamin decomposing it. As with vitamin B1, the processing temperature did not significantly affect (p < 0.05) the retention of niacin. Again, FOS had a protective effect towards the degradation of the vitamin since an increase in its content was observed herein, whereas in a previous work without FOS addition vitamin B3 showed a significant loss (>40%) during sonication [29].
An increase in vitamin B5 was significant only when sonication was carried out at 10 °C (p < 0.05), while higher temperatures did not change its content (Figure 3). In fruits, vitamin B5 (pantothenic acid) exists mainly in its free form [45]. However, a small fraction of vitamin B5 is still bonded to membranes or apoenzymes. Cavitation power increases at low temperatures and can break the bond between vitamin B5 and membranes, slightly increasing the concentration of its free form in the juice. Sonication increased the amount of vitamin B5 at low temperatures but did not degrade it at higher temperatures. Vitamin B5 is less sensitive to hydroxyl radicals produced during sonication since the main point of the reaction is with its secondary amine, which has been shown to be more stable. At low ultrasonic power densities (3000 W/L), an increase in vitamin B5 (5 to 10%) was observed in the first 10 min, independent of temperature. Vitamin B5 has good stability in food, but its loss during processing has been reported for legumes, cereals, beef [42], acerola juice [29], and apples [46]. FOS enrichment has protected vitamin B5 from degradation since early studies showed a significant degradation of vitamin B5 in acerola juice (>40%) [29].
Figure 4 shows the effect of sonication on the relative content of vitamin A in FOS-enriched acerola juice. Despite a fast release in the first 5 min, the oxidation of vitamin A occurred rapidly and was intense. The oxidation of vitamin A by hydroxyl radicals was greater (>93%) at lower temperatures (10 °C) because cavitation and the formation of hydroxyl radicals are more intense under this condition. The hydroxyl radicals were monitored and determined based on hydrogen peroxide equivalents. Table 1 presents the concentration of hydrogen peroxide produced by sonication during the acerola juice processing. The acerola juice already contained 197 μmol/L of hydrogen peroxide, which increased significantly during processing (p < 0.05).
The vitamin A molecule presents several carbon–carbon double bonds that are susceptible to hydrogen peroxide and hydroxyl radicals that may epoxidize the carbon–carbon double bonds and scission occurs in the molecule at the epoxy group. Even at higher temperatures (40 °C), where cavitation is less severe and less hydrogen peroxide is produced, the oxidation of vitamin A reached 55%.
Acerola has very little vitamin E (0.02 mg/mL), which was degraded during sonication. No detection of vitamin E was attained on the sonicated samples. The radical scavenging behavior of vitamin E contributes to its degradation since sonication induces the production of free radicals in the juice, which reacts very rapidly with vitamin E. The addition of FOS did not protect the juice against the degradation of liposoluble vitamins (A and E) by sonication. Both vitamins presented high losses, as with non-enriched acerola juice [29]. However, a positive effect of FOS on liposoluble vitamins was not expected since FOS is water soluble.
The amount of vitamin C in the FOS-enriched acerola juice increased with ultrasound application (Figure 5). Acerola is a fruit rich in vitamin C, being a significant source of this vitamin. Acerola contains both ascorbic acid and dehydroascorbic acid. The increase in vitamin C is linked with the conversion of dehydroascorbic acid to ascorbic acid. It is still unknown if this conversion is due to the dehydroascorbate enzyme’s activation or the dehydroascorbic acid’s chemical reaction with the reactive oxygen species produced during sonication [47]. Vitamin C content increased in the first 5 min of sonication. After this period, vitamin C started to degrade; however, after 15 min of sonication, the amount of vitamin C in the juice was at least 20% higher (40 °C, 3000 W/L) than the initial content. Lower ultrasonic power density (1000 W/L) and temperature (10 °C) resulted in higher amounts of vitamin C. Temperature has negatively affected the vitamin C content due to the thermal degradation of this compound. Vitamin C was probably protected by the higher scavenging power of vitamin E, which degraded significantly during sonication [48,49]. Furthermore, the added FOS may have contributed to the higher retention of vitamin C, as occurred with the other water-soluble vitamins.

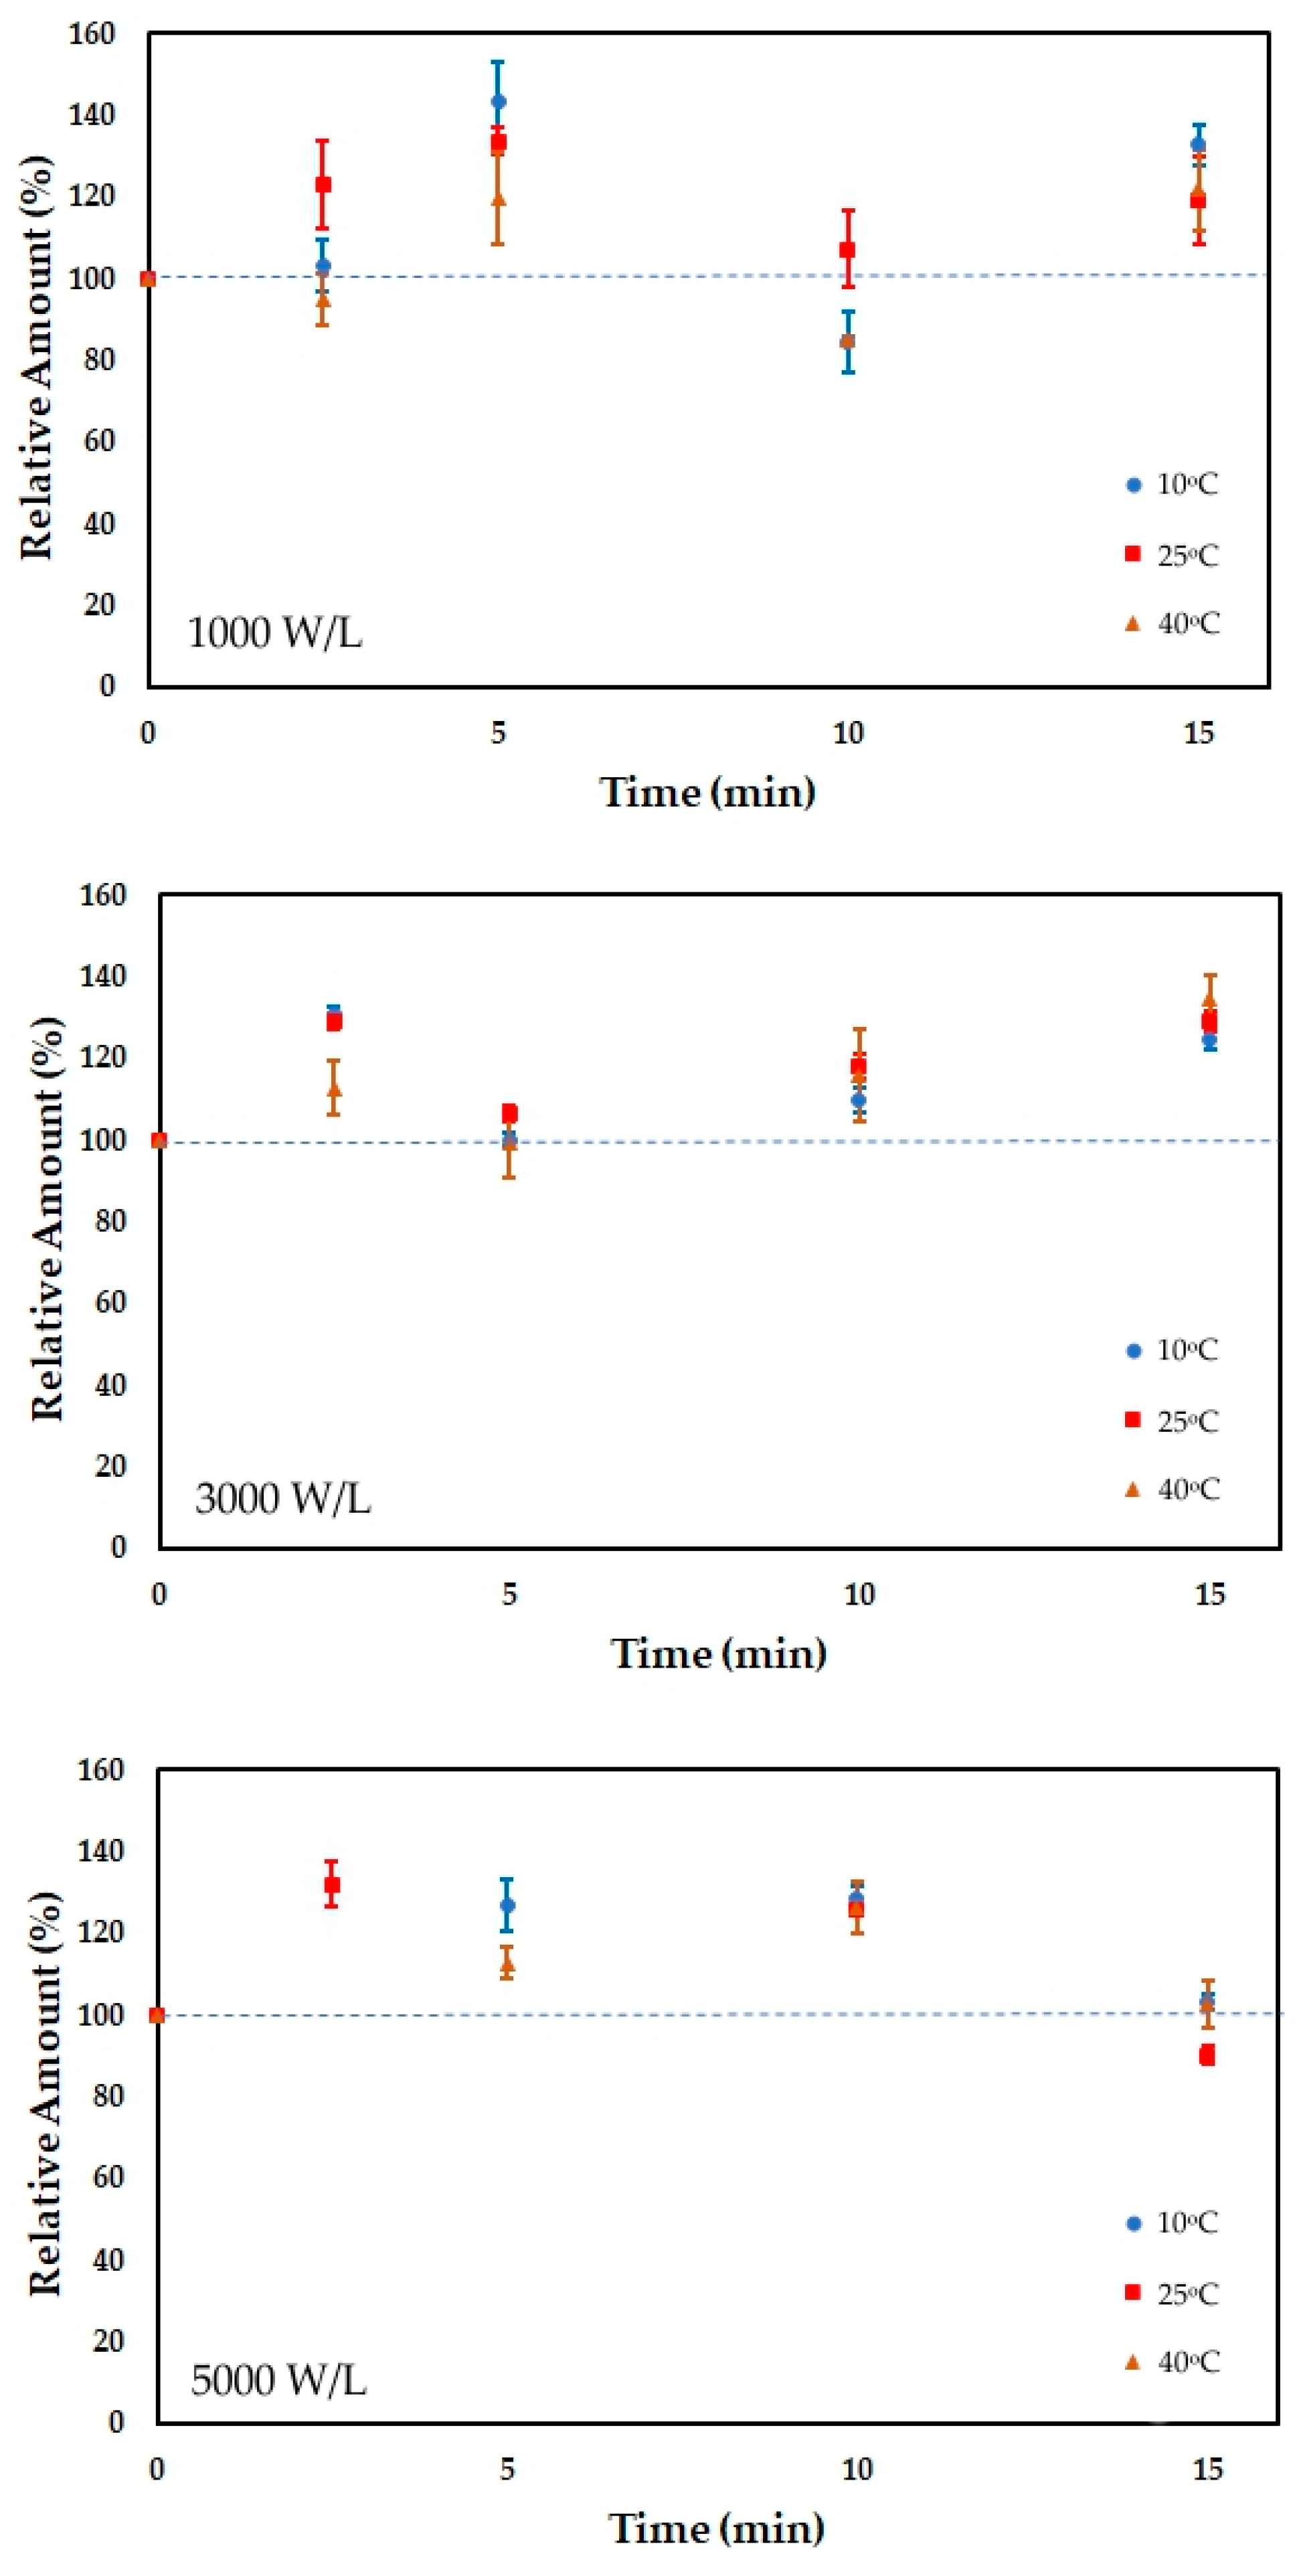
3.2. Total Phenolic Content

The total phenolic content in the FOS-enriched acerola juice was very dependent on the processing temperature (Figure 6). Compared to the untreated juice, the total phenolic content tended to increase (19%) at low temperatures (10 °C) and high ultrasound power density (5000 W/L) but decreased at lower ultrasound power densities (≤3000 W/L), retaining between 70 and 94% of its initial phenolic content. The total phenolic content observed at 10 °C and 5000 W/L was statistically different from the control values (p < 0.05). However, the increase in total phenolic content was observed at 25 °C and 3000, and at 25 °C and 5000 W/L was similar to the control (p < 0.05).
Thermal degradation was more severe at higher temperatures (≥25 °C), with phenolic retention ranging from 41 to 87%. The degradation of phenolic compounds was probably related to thermal degradation and the reaction of these compounds with the free radicals produced during sonication. The slight increase of phenolics observed at 10 °C and 5000 W/L may be related to the release of phenolics from the pulp cell tissue, which requires more energy and is a slow process.
Adding FOS did not change the overall trends observed for total phenolics in the sonicated acerola juice. In previous work, sonicated acerola juice presented a slight decrease in phenolic content, retaining between 70 to 91% of its initial phenolic content [29] under similar operating conditions.
The retention of phenolic compounds after sonication strongly depends on the food matrix. For instance, the sonication of cantaloupe melon juice also decreased the amount of phenolics in the juice, reducing the initial content by 15 to 36% [19]. A different effect was attained for the sonication of pineapple juice, which increased the phenolic content by 10 to 30% [20].

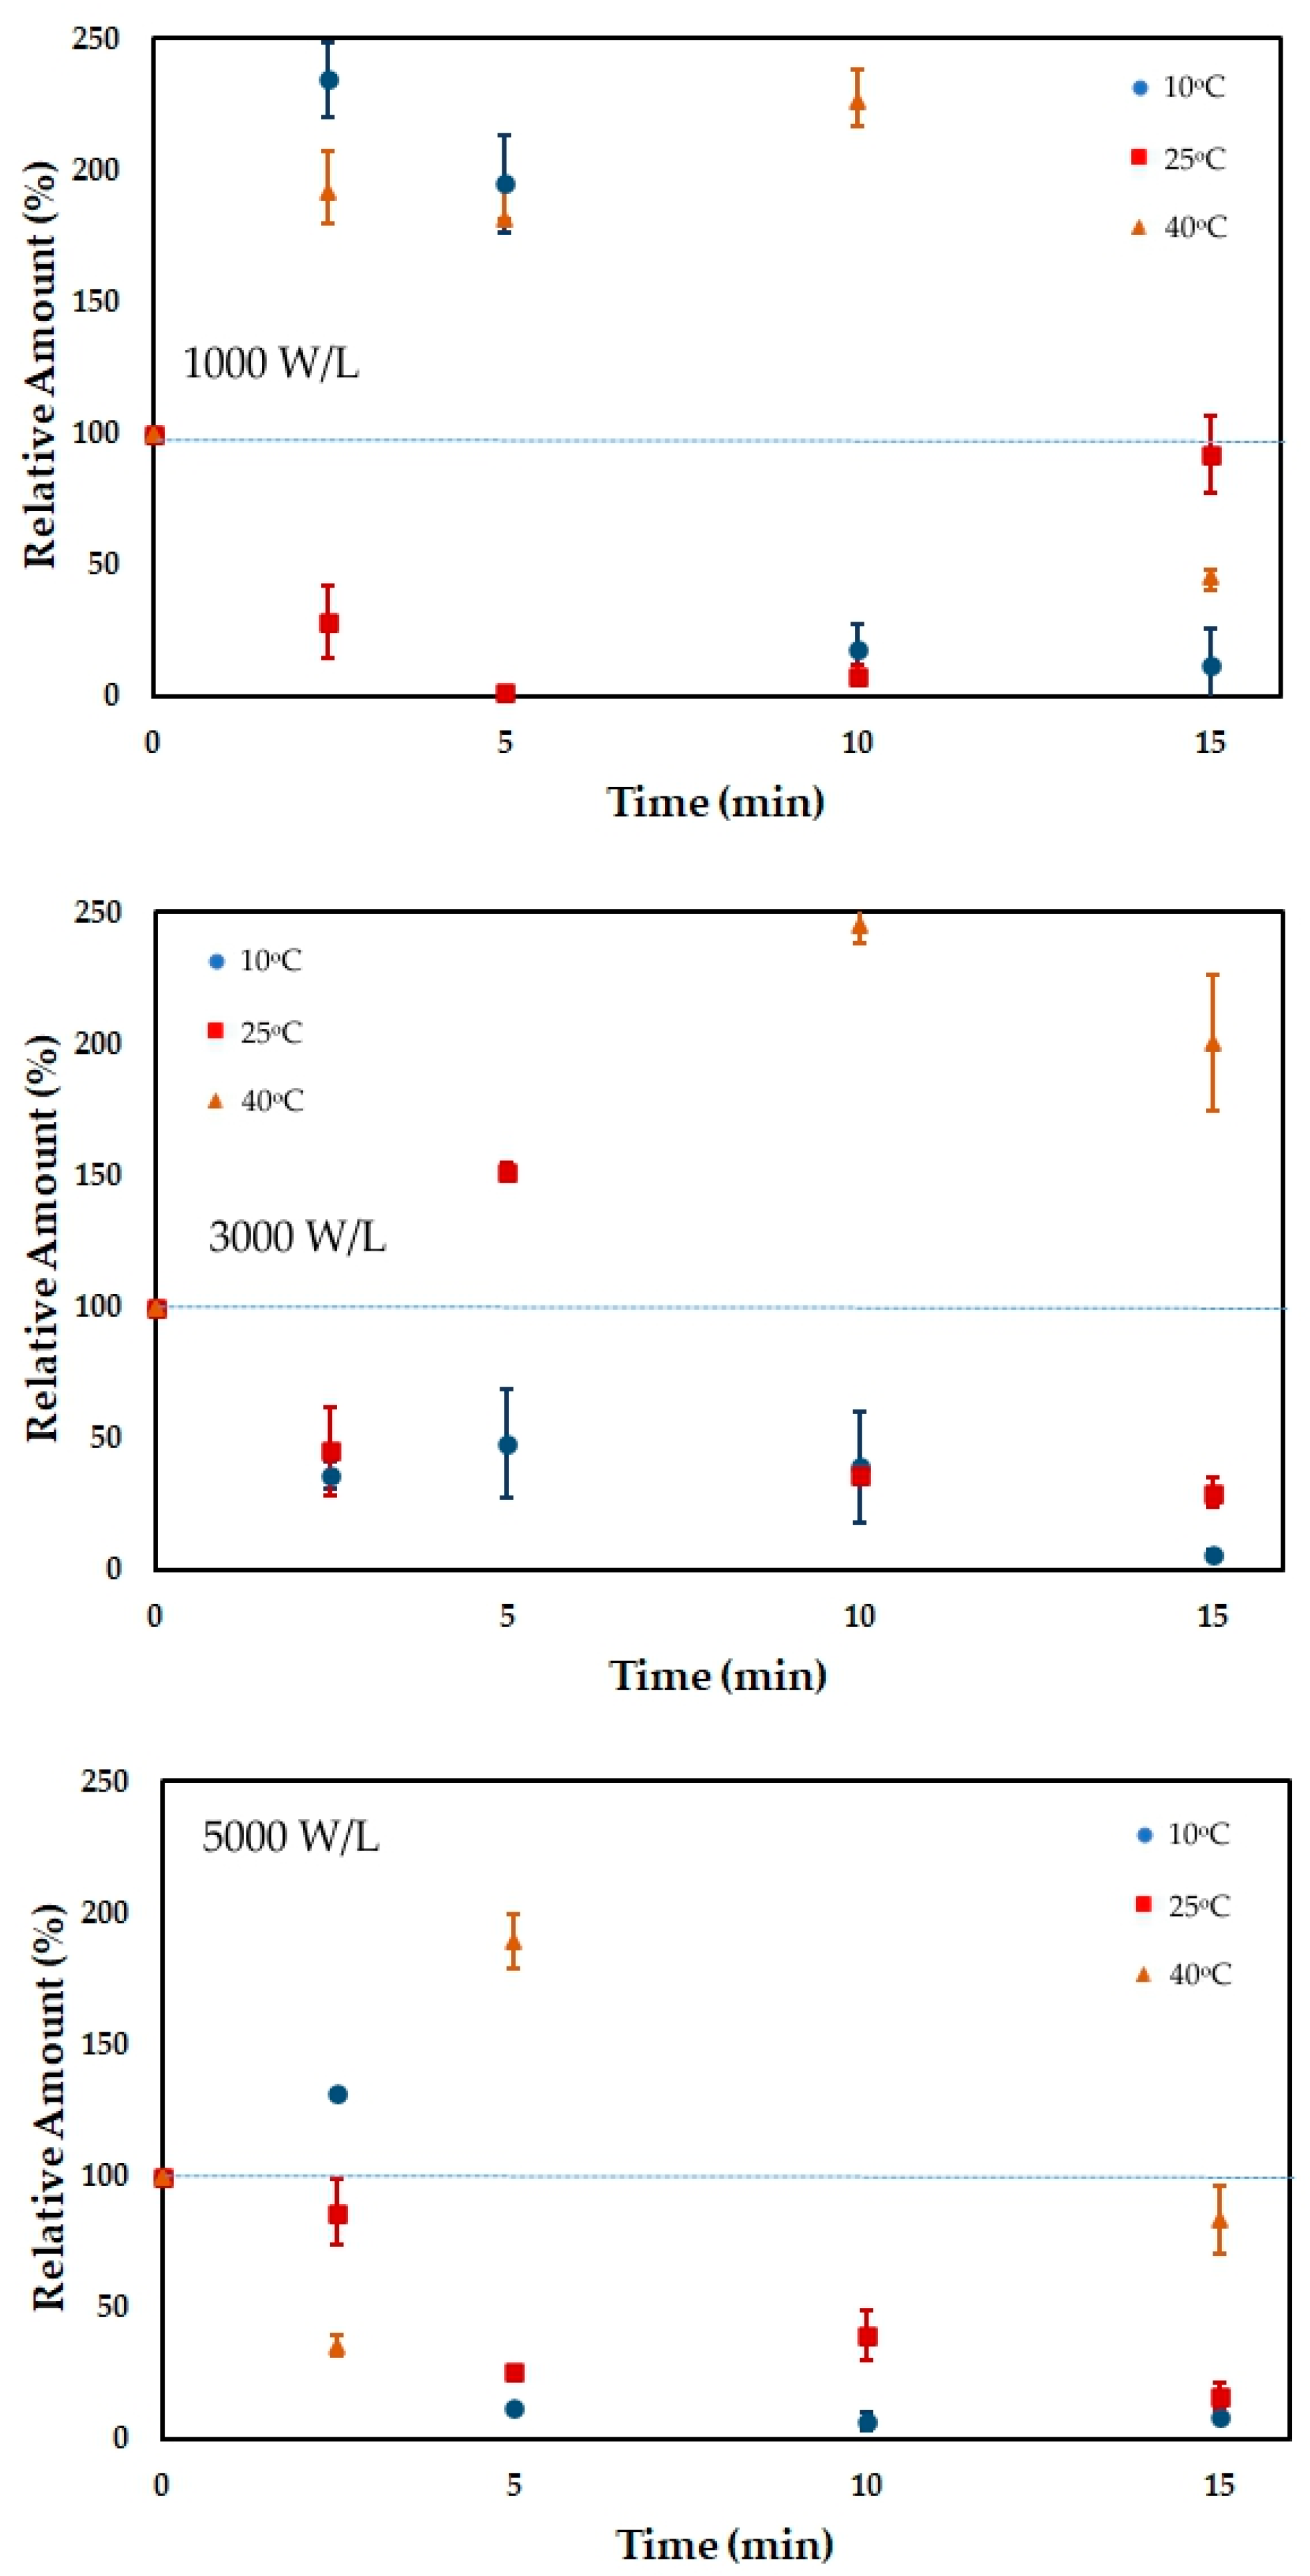
3.3. Total Carotenoid Content

The carotenoid content in the FOS-enriched acerola juice tended to increase, especially in the first 5 min of sonication (Figure 7). The increase in carotenoid content is mainly related to the extraction of carotenoids from the liposoluble cell membranes. After the first 5 min, the carotenoid content decreased due to chemical degradation, but its content always stayed higher than the carotenoid content of the untreated juice. This chemical degradation is related to the radical scavenging behavior of carotenoids that react with the reactive oxygen species, mainly hydroxyl radical, produced during sonication [50]. The oxidation of carotenoids occurs through the free radical chain reaction followed by autooxidation. The reaction is initiated by free radicals, such as hydroxyl radicals, produced during sonication. The hydroxyl radicals directly react with the carotenoids, forming a carotenoid-derived radical that further reacts with other carotenoids, hydroxyl radicals, oxygen, and other carotenoid-derived radicals [51].
Operation at higher ultrasound power densities resulted in lower amounts of carotenoids due to the higher amounts of reactive oxygen species in the medium. The highest concentrations of hydrogen peroxide were attained at 25 °C, which also corresponds to the lowest concentrations of carotenoids in the FOS-enriched acerola juice.
At higher temperatures (≥25 °C), a higher increase in carotenoid content was observed despite carotenoids having low thermal stability [48,52]. The higher carotenoid content may be related to the lower cavitation efficiency at higher temperatures. Under this condition, the sponge effect of ultrasound may play a significant role in extracting carotenoids from the liposoluble membrane while not producing excessive reactive oxygen radicals that would tend to be scavenged by the extracted carotenoids.
The high retention of carotenoids by the FOS-enriched acerola juice is essential to maintain a high antioxidant capacity and preserve the color of the reddish juice marked by the presence of carotenoids.

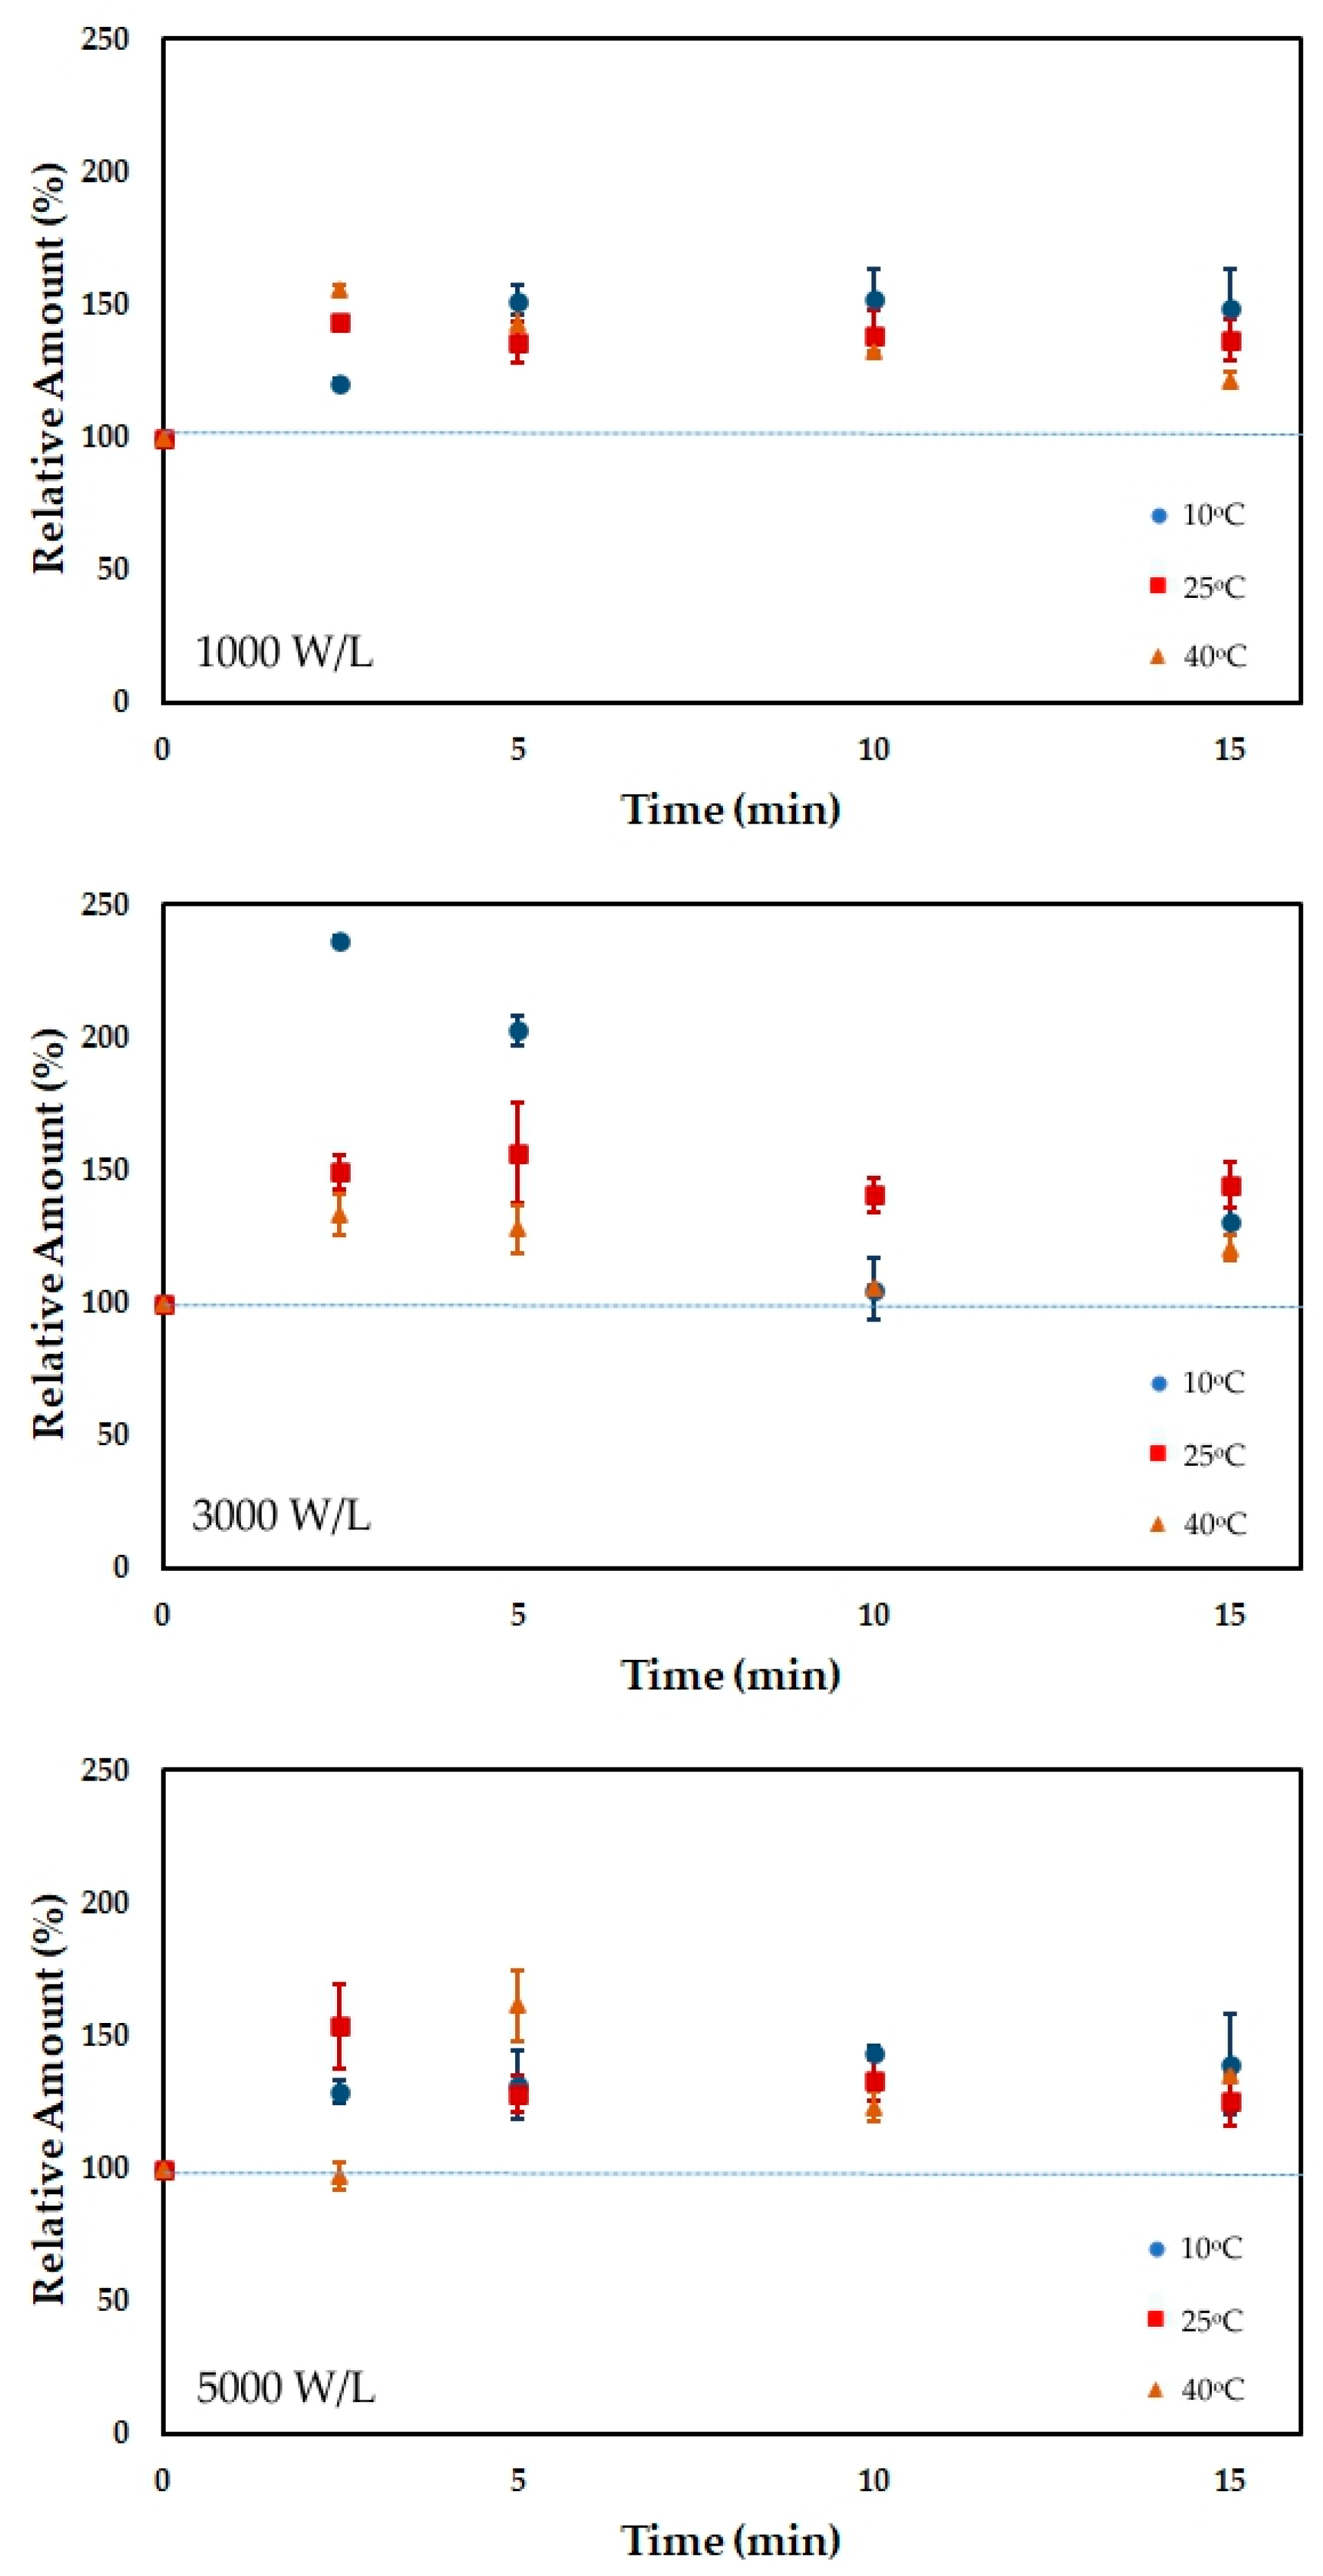
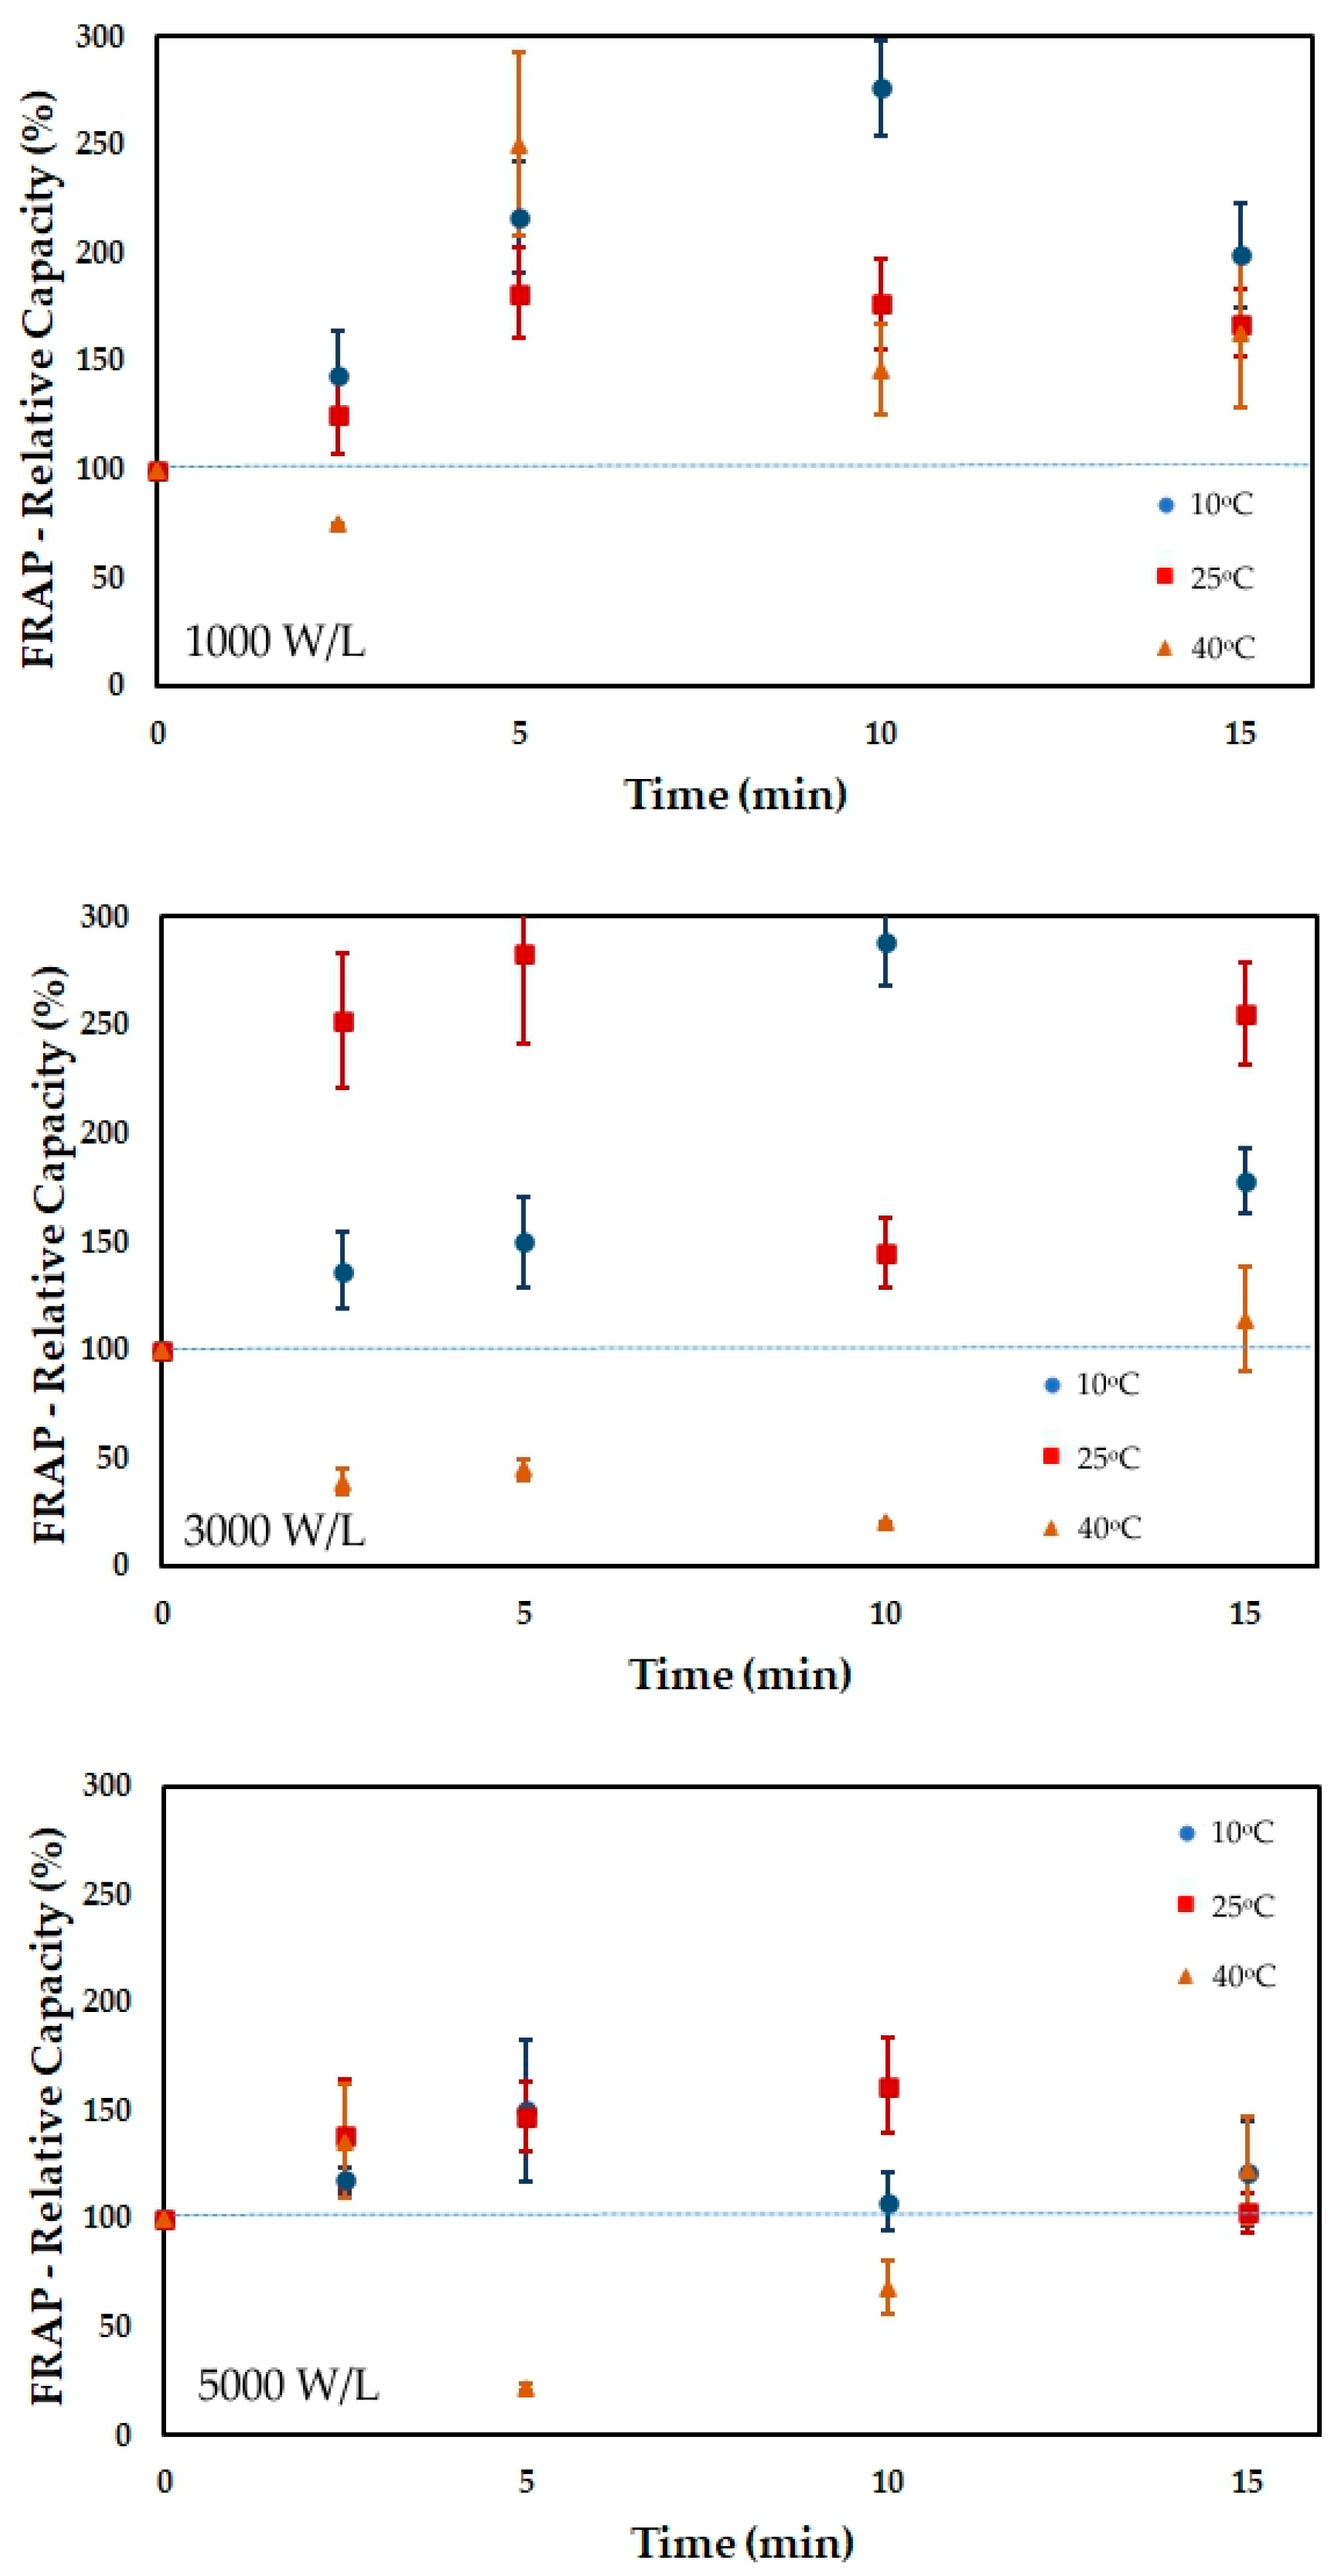
3.4. Antioxidant Capacity

Antioxidant capacity was measured using FRAP and ABTS methods (Figure 8 and Figure 9). Two slightly different behaviors were attained, with FRAP showing a profile resembling the phenolic content profile. The difference between the methods can be attributed to the type of the target molecules measured by each method since acerola contains carotenoids, phenolics, vitamin C, and vitamin E that contribute differently towards the results of each antioxidant capacity method.
Overall, the antioxidant capacity of the FOS-enriched acerola juice depended on the processing time, temperature, and ultrasonic power density, with the most important variable being the temperature (p < 0.05). Sonicating at 25 °C for 5 to 10 min increased antioxidant capacity. Prolonged exposure to ultrasound tended to reduce the antioxidant capacity due to the reduction in the concentration of phenolics, vitamin C, and carotenoids. The optimal temperature found at 25 °C can be attributed to the low temperature, avoiding thermal degradation and mild cavitation effects. At 10 °C, the higher impact cavitation tended to degrade antioxidant compounds, reducing their concentration and, consequently, the antioxidant capacity, whereas at 40 °C the higher temperature also managed to increase the degradation rate of the antioxidant compounds due to thermal degradation.

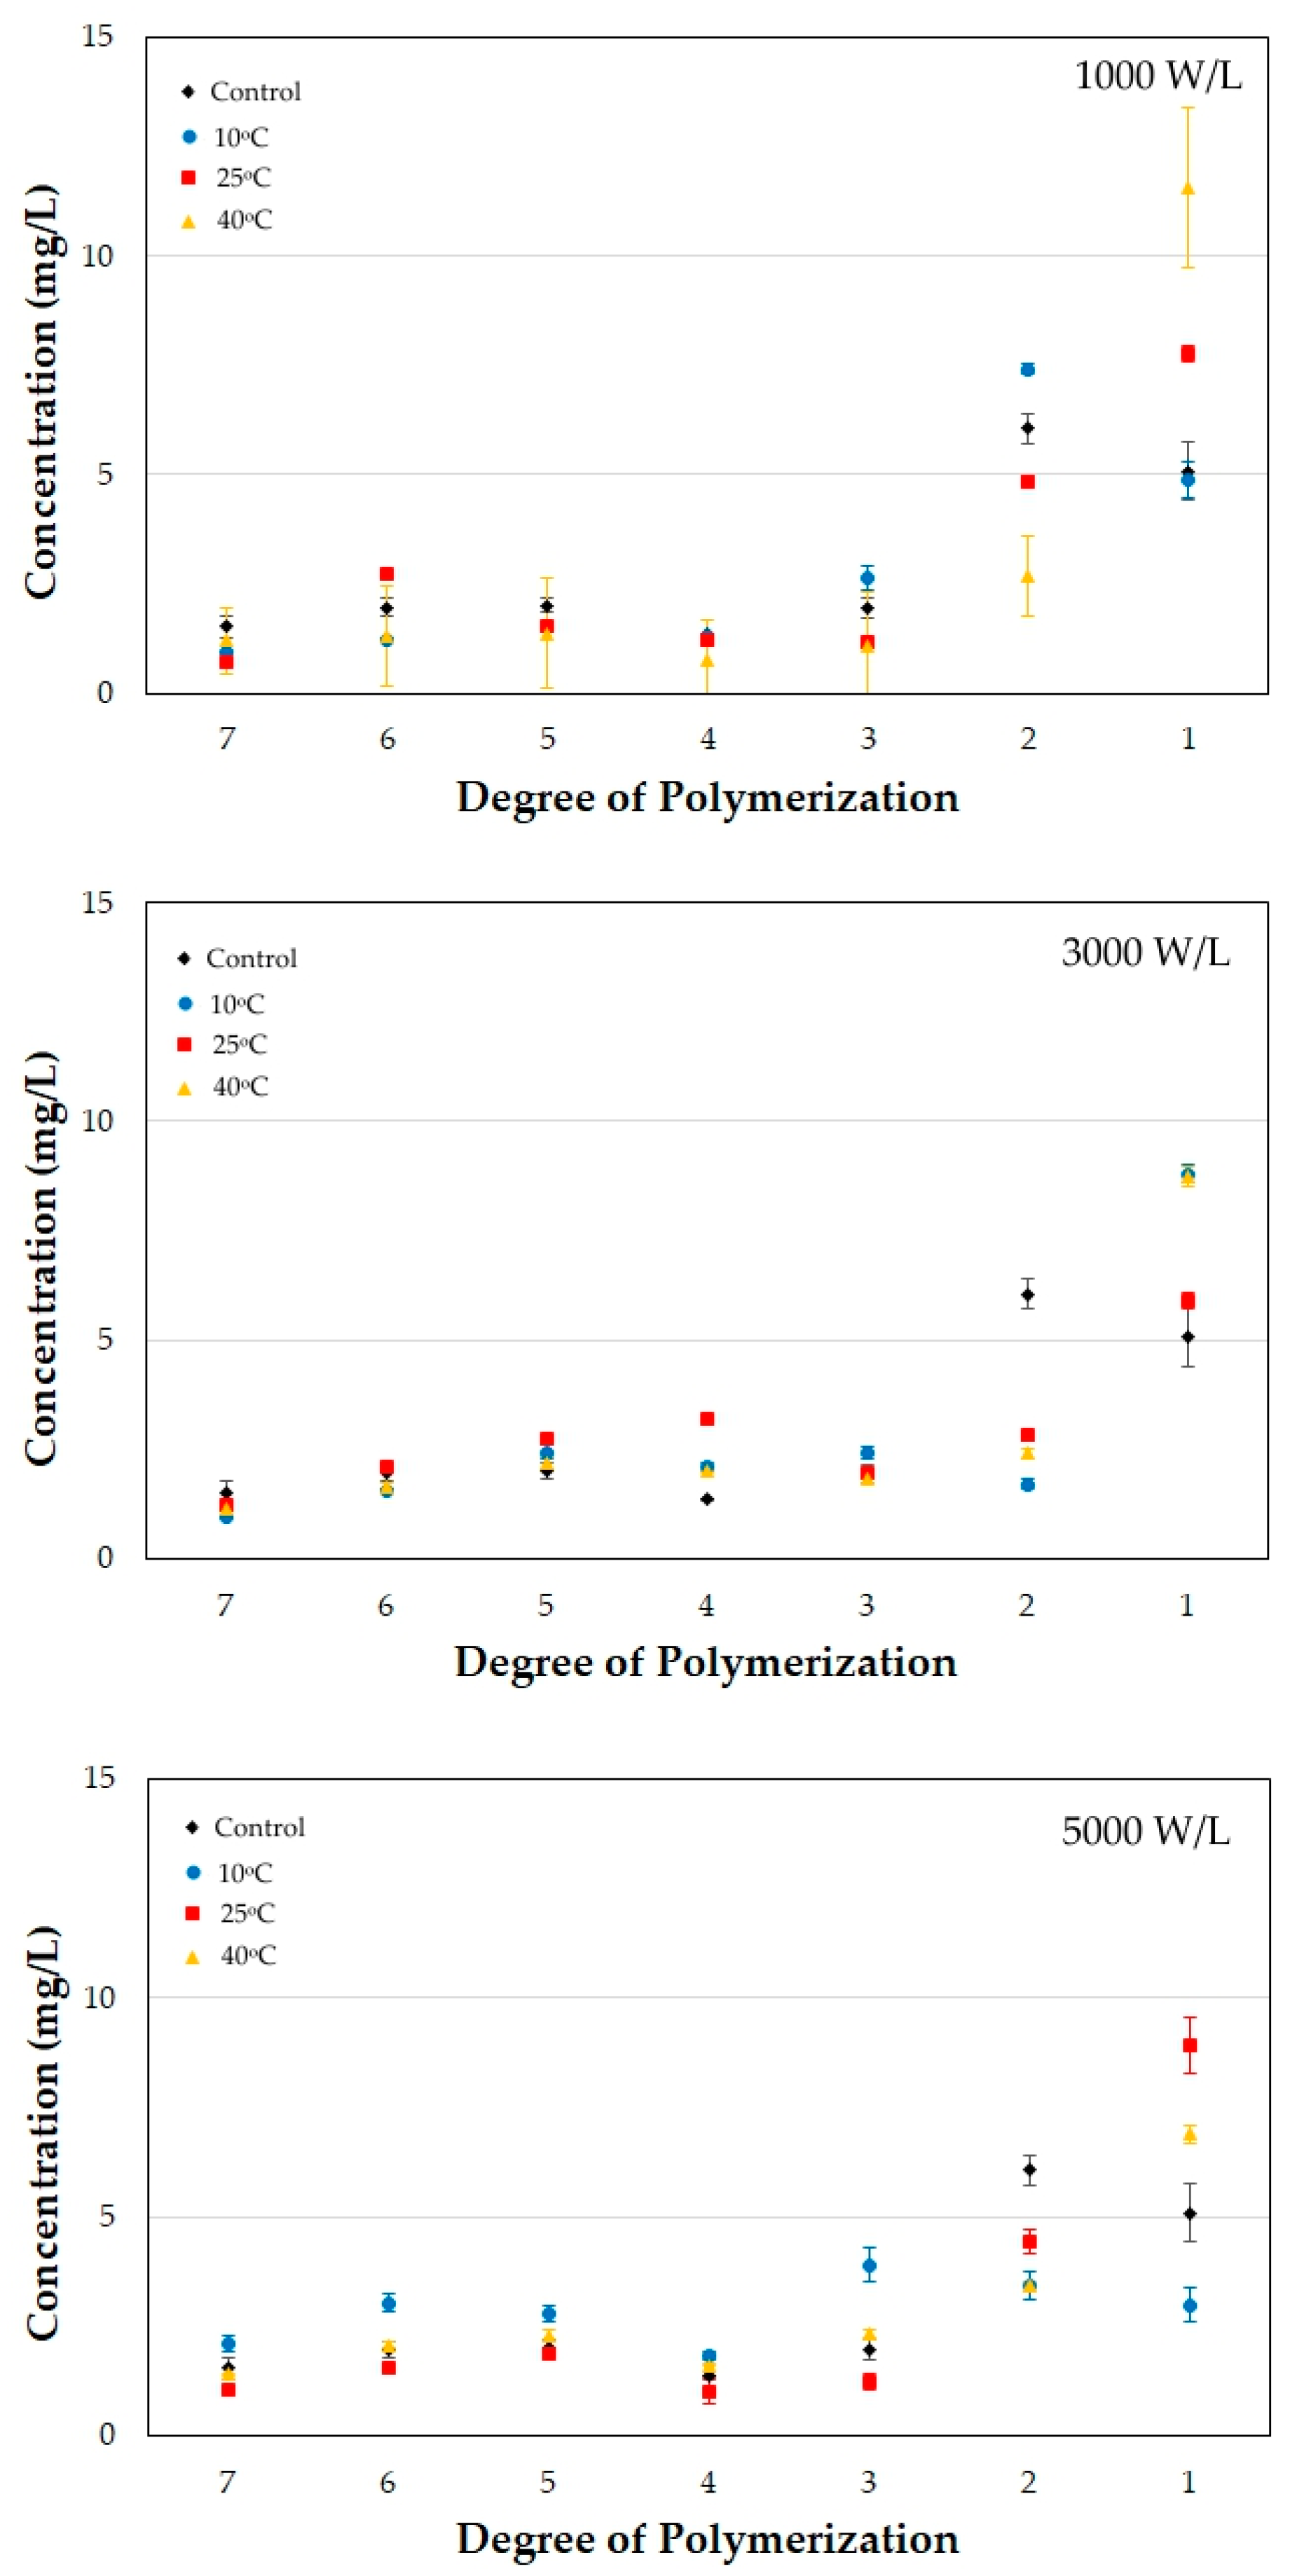
3.5. Changes in the Fructooligosaccharide Degree of Polymerization

The effect of the ultrasonic treatment on the fructooligosaccharides was evaluated to understand the changes caused by sonication in the FOS profile. The FOS-enriched acerola juice contained 5.08 g/L of monosaccharides (fructose + glucose), 6.06 g/L of sucrose, 1.96 g/L of kestose (degree of polymerization = 3), 1.38 g/L of nystose (DP = 4), 2.02 g/L of DP = 5 oligosaccharide, 1.97 g/L of DP = 6 oligosaccharides, and 1.53 g/L of DP = 7 oligosaccharide.
Sonication decreased the concentration of oligosaccharides with a higher degree of polymerization, with a consequent increase in the concentration of mono, disaccharides, and kestose (Figure 10). Mass balance analysis of the oligosaccharides evidenced that depolymerization of the oligosaccharides occurred.
The depolymerization rate increased with temperature, processing time, and ultrasound power density. At 10 and 25 °C, a significant decrease in oligosaccharides with degrees of polymerization of 5, 6, and 7 was observed. At 40 °C, the decrease affected all the oligosaccharides, and only the concentration of monosaccharides increased. Analysis of the FOS profile along the processing time evidenced that the depolymerization probably occurred always at the end of the oligosaccharide chain, producing monosaccharides. The ultrasound power density did not significantly change (p > 0.05) the depolymerization rate.
The highest decrease in longer oligosaccharides (DP 6 and 7) occurred at 25 °C, at the same temperature and conditions in which the antioxidant capacity, total phenolics, and vitamin C were higher. Thus, there was a correlation between FOS, antioxidant capacity, and concentration of the main bioactive compounds. The antioxidant capacity and the concentration of bioactive compounds were higher under processing conditions that showed high depolymerization, especially at 10 and 25 °C. As such, FOS has a protective role in several bioactive compounds. The correlation was somewhat weaker at 40 °C, where thermal degradation has a higher contribution, and FOS and bioactive compounds are more intensely degraded.

4. Conclusions

Sonication increased the availability of vitamins B1, B3, B5, and C, extracting or releasing these vitamins from the membrane and apoenzyme bond. The concentrations of phenolics and carotenoids also increased under most operating conditions. The increase in vitamin C, phenolics, and carotenoids influenced the increase in antioxidant capacity of the FOS-enriched acerola juice. The temperature, processing time, and ultrasound power density influenced the process. Temperature was shown to be the most significant process variable.
Ultrasound processing requires optimization to improve the concentration of bioactive compounds and to avoid excessive exposure to cavitation and the hydroxyl radicals produced during sonication that may result in the degradation of bioactive compounds. Optimum operating conditions depend on choices that have to be made to favor a major or group of bioactive compounds of interest. As acerola juice is rich in vitamin C, optimal conditions for sonication can be defined as 3000 W/L, 25 °C, and 5 min, to produce a juice with maximal vitamin C content.
Adding FOS enriched the oligosaccharide-poor juice and offered a protective effect against the degradation of bioactive compounds. Although the concentration of oligosaccharides with a high degree of polymerization decreased with the ultrasonic treatment, the treated juice still retained more than 65% of the initial FOS with degrees of polymerization of 5, 6, and 7.

Author Contributions

Conceptualization, F.A.N.F.; methodology, S.R. and W.F.G.; formal analysis, S.R. and F.A.N.F.; investigation, V.O.S. and W.F.G.; writing—original draft preparation, F.A.N.F.; writing—review and editing, S.R. and F.A.N.F.; supervision, F.A.N.F. All authors have read and agreed to the published version of the manuscript.

Funding

This work was supported by Conselho Nacional de Desenvolvimento Científico e Tecnológico (CNPq) and Coordenação de Aperfeiçoamento de Pessoal de Nível Superior (CAPES).

Data Availability Statement

Data are available on request.

Conflicts of Interest

The authors declare no conflict of interest.

References

  1. Liu, Y.; Zhang, S.; Tang, L.; Zhang, M.; Wang, P.; Sun, X.; Shang, L.; Wang, Q.; Zhao, Y.; Meng, D.; et al. Analysis of the Effects of Rosa Roxburghii Tratt Fruit Polyphenols on Immune Function in Mice through Gut Microbiota and Metabolomics: An in Vivo Preclinical Trial Study. J. Funct. Foods 2023, 102, 105464. [Google Scholar] [CrossRef]
  2. Stojanovska, L.; Ali, H.I.; Kamal-Eldin, A.; Souka, U.; Al Dhaheri, A.S.; Cheikh Ismail, L.; Hilary, S. Soluble and Insoluble Dietary Fibre in Date Fruit Varieties: An Evaluation of Methods and Their Implications for Human Health. Foods 2023, 12, 1231. [Google Scholar] [CrossRef] [PubMed]
  3. Duan, K.J.; Chen, J.S.; Sheu, D.C. Kinetic Studies and Mathematical Model for Enzymatic Production of Fructooligosaccharides from Sucrose. Enzyme Microb. Technol. 1994, 16, 334–339. [Google Scholar] [CrossRef]
  4. Tan, D.; Chen, W.; Yang, Z.; Rong, M.; Huang, R.; Wu, X.; Bai, W.; Tian, L. Enzymatic Synthesis of Propionyl-Fructooligosaccharides and Their Evaluation as a Gut Microbiota Modulator. Food Hydrocoll. 2023, 142, 108782. [Google Scholar] [CrossRef]
  5. Roberfroid, M.B. Health Benefits of Non-Digestible Oligosaccharides. In Dietary Fiber in Health and Disease. Advances in Experimental Medicine and Biology; Kritchevsky, D., Bonfield, C., Eds.; Springer: Boston, MA, USA, 1997; Volume 427, pp. 211–219. [Google Scholar]
  6. USDA. USDA National Nutrient Database for Standard Reference; Release 28; U.S. Department of Agriculture: Washington, DC, USA, 2015.
  7. Silva, N.L.; Crispim, J.M.S.; Vieira, R.P. Kinetic and Thermodynamic Analysis of Anthocyanin Thermal Degradation in Acerola (Malpighia Emarginata D.C.) Pulp. J. Food Process. Preserv. 2017, 41, e13053. [Google Scholar] [CrossRef]
  8. Wurlitzer, N.J.; Dionísio, A.P.; Lima, J.R.; dos Santos Garruti, D.; da Silva Araújo, I.M.; da Rocha, R.F.J.; Maia, J.L. Tropical Fruit Juice: Effect of Thermal Treatment and Storage Time on Sensory and Functional Properties. J. Food Sci. Technol. 2019, 56, 5184–5193. [Google Scholar] [CrossRef]
  9. Alves Filho, E.G.; Silva, L.M.A.; de Brito, E.S.; Wurlitzer, N.J.; Fernandes, F.A.N.; Rabelo, M.C.; Fonteles, T.V.; Rodrigues, S. Evaluation of Thermal and Non-Thermal Processing Effect on Non-Prebiotic and Prebiotic Acerola Juices Using1H QNMR and GC–MS Coupled to Chemometrics. Food Chem. 2018, 265, 23–31. [Google Scholar] [CrossRef] [Green Version]
  10. Piyasena, P.; Mohareb, E.; McKellar, R.C. Inactivation of Microbes Using Ultrasound: A Review. Int. J. Food Microbiol. 2003, 87, 207–216. [Google Scholar] [CrossRef]
  11. Gamboa-Santos, J.; Montilla, A.; Soria, A.C.; Villamiel, M. Effects of Conventional and Ultrasound Blanching on Enzyme Inactivation and Carbohydrate Content of Carrots. Eur. Food Res. Technol. 2012, 234, 1071–1079. [Google Scholar] [CrossRef] [Green Version]
  12. Jang, J.-H.; Moon, K.-D. Inhibition of Polyphenol Oxidase and Peroxidase Activities on Fresh-Cut Apple by Simultaneous Treatment of Ultrasound and Ascorbic Acid. Food Chem. 2011, 124, 444–449. [Google Scholar] [CrossRef]
  13. Lee, H.; Zhou, B.; Feng, H.; Martin, S.E. Effect of PH on Inactivation of Escherichia Coli K12 by Sonication, Manosonication, Thermosonication, and Manothermosonication. J. Food Sci. 2009, 74, 191–198. [Google Scholar] [CrossRef]
  14. Ekonomou, S.I.; Boziaris, I.S. Non-Thermal Methods for Ensuring the Microbiological Quality and Safety of Seafood. Appl. Sci. 2021, 11, 833. [Google Scholar] [CrossRef]
  15. Jat, K.; Jayachandran, L.E.; Rao, P.S. Impact of Temperature Assisted Ultrasonication on the Quality Attributes of Beetroot (Beta vulgaris L.) Juice. J. Food Process. Eng. 2023, 2023, e14329. [Google Scholar] [CrossRef]
  16. Cruz, J.M.d.A.; Ramos, A.S.; Corrêa, R.F.; Sanches, E.A.; Campelo, P.H.; Kinupp, V.F.; Bezerra, J.d.A. Thermal Treatment and High-Intensity Ultrasound Processing to Evaluate the Chemical Profile and Antioxidant Activity of Amazon Fig Juices. Processes 2023, 11, 408. [Google Scholar] [CrossRef]
  17. Radziejewska-Kubzdela, E. Effect of Ultrasonic, Thermal and Enzymatic Treatment of Mash on Yield and Content of Bioactive Compounds in Strawberry Juice. Appl. Sci. 2023, 13, 4268. [Google Scholar] [CrossRef]
  18. Kesavan, R.K.; Gogoi, S.; Nayak, P.K. Influence of Thermosonication and Pasteurization on the Quality Attributes of Kutkura (Meyna spinosa) Juice. Appl. Food Res. 2023, 3, 100268. [Google Scholar] [CrossRef]
  19. Fonteles, T.V.; Costa, M.G.M.; de Jesus, A.L.T.; Miranda, M.R.A.; Fernandes, F.A.N.; Rodrigues, S. Power Ultrasound Processing of Cantaloupe Melon Juice: Effects on Quality Parameters. Food Res. Int. 2012, 48, 41–48. [Google Scholar] [CrossRef]
  20. Costa, M.G.M.; Fonteles, T.V.; Jesus, A.L.T.; Almeida, F.D.L.; Miranda, M.R.A.; Fernandes, F.A.N.; Rodrigues, S. High-Intensity Ultrasound Processing of Pineapple Juice. Food Bioproc. Technol. 2011, 6, 997–1006. [Google Scholar] [CrossRef]
  21. Tiwari, B.K.; Patras, A.; Brunton, N.; Cullen, P.J.; O’Donnell, C.P. Effect of Ultrasound Processing on Anthocyanins and Color or Red Grape Juice. Ultrason. Sonochem. 2010, 17, 598–604. [Google Scholar] [CrossRef]
  22. Shaik, L.; Chakraborty, S. Ultrasound Processing of Sweet Lime Juice: Effect of Matrix PH on Microbial Inactivation, Enzyme Stability, and Bioactive Retention. J. Food Process. Eng. 2023, 46, 14231. [Google Scholar] [CrossRef]
  23. Kalsi, B.S.; Singh, S.; Alam, M.S. Influence of Ultrasound Processing on the Quality of Guava Juice. J. Food Process. Eng. 2023, 46, 14163. [Google Scholar] [CrossRef]
  24. Cheng, L.; Soh, C.; Liew, S.; Teh, F. Effects of Sonication and Carbonation on Guava Juice Quality. Food Chem. 2007, 104, 1396–1401. [Google Scholar] [CrossRef]
  25. Tiwari, B.K.; Muthukumarappan, K.; O’Donnell, C.P.; Cullen, P.J. Effects of Sonication on the Kinetics of Orange Juice Quality Parameters. J. Agric. Food Chem. 2008, 56, 2423–2428. [Google Scholar] [CrossRef] [PubMed]
  26. Fernandes, F.A.N.; Rodrigues, S. Ultrasound Applications in Minimal Processing. Stewart Postharvest Rev. 2009, 5, 1–7. [Google Scholar] [CrossRef]
  27. Fernandes, F.A.N.; Rodrigues, S. Application of Ultrasound and Ultrasound-Assisted Osmotic Dehydration in Drying of Fruits. Dry. Technol. 2008, 26, 1509–1516. [Google Scholar] [CrossRef]
  28. Fernandes, F.A.N.; Rodrigues, S. Ultrasound Applications in Drying of Fruits from a Sustainable Development Goals Perspective. Ultrason. Sonochem. 2023, 96, 106430. [Google Scholar] [CrossRef]
  29. Santos, V.; Rodrigues, S.; Fernandes, F. Improvements on the Stability and Vitamin Content of Acerola Juice Obtained by Ultrasonic Processing. Foods 2018, 7, 68. [Google Scholar] [CrossRef] [Green Version]
  30. Alves Filho, E.G.; Cullen, P.J.; Frias, J.M.; Bourke, P.; Tiwari, B.K.; Brito, E.S.; Rodrigues, S.; Fernandes, F.A.N. Evaluation of Plasma, High-Pressure and Ultrasound Processing on the Stability of Fructooligosaccharides. Int. J. Food Sci. Technol. 2016, 51, 2034–2040. [Google Scholar] [CrossRef]
  31. Rizzolo, A.; Polesello, S. Chromatographic Determination of Vitamins in Foods. J. Chromatogr. 1992, 624, 103–152. [Google Scholar] [CrossRef]
  32. Jedlicka, A.; Klimes, J. Determination of Water- and Fat-Soluble Vitamins in Different Matrices Using High-Performance Liquid Chromatography. Chem. Pap. 2005, 59, 202–222. [Google Scholar] [CrossRef]
  33. Fernandes, F.A.N.; Santos, V.O.; Rodrigues, S. Effects of Glow Plasma Technology on Some Bioactive Compounds of Acerola Juice. Food Res. Int. 2019, 115, 16–22. [Google Scholar] [CrossRef]
  34. Selimović, A.; Salkić, M.; Selimović, A. Direct Spectrophotometric Determination of L-Ascorbic Acid in Pharmaceutical Preparations Using Sodium Oxalate as a Stabilizer. Int. J. Basic Appl. Sci. 2011, 11, 106–109. [Google Scholar]
  35. Sánchez-Rangel, J.C.; Benavides, J.; Heredia, J.B.; Cisneros-Zevallos, L.; Jacobo-Velázquez, D.A. The Folin–Ciocalteu Assay Revisited: Improvement of Its Specificity for Total Phenolic Content Determination. Anal. Methods 2013, 5, 5990–5999. [Google Scholar] [CrossRef]
  36. Re, R.; Pellegrini, N.; Proteggente, A.; Pannala, A.; Yang, M.; Rice-Evans, C. Antioxidant Activity Applying an Improved ABTS Radical Cation Decolorization Assay. Free Radic. Biol. Med. 1999, 26, 1231–1237. [Google Scholar] [CrossRef] [PubMed]
  37. Benzie, I.F.F.; Strain, J.J. The Ferric Reducing Ability of Plasma (FRAP) as a Measure of “Antioxidant Power”: The FRAP Assay. Anal. Biochem. 1996, 239, 70–76. [Google Scholar] [CrossRef] [Green Version]
  38. Rodriguez-Amaya, D. A Guide to Carotenoids Analysis in Food; International Life Sciences Institute Press: Washington, DC, USA, 2001. [Google Scholar]
  39. Shiomi, N.; Onodera, S.; Sakai, H. Fructo-Oligosaccharide Content and Fructosyltransferase Activity during Growth of Onion Bulbs. New Phytol. 1997, 136, 105–113. [Google Scholar] [CrossRef]
  40. Almeida, F.D.L.; Gomes, W.F.; Cavalcante, R.S.; Tiwari, B.K.; Cullen, P.J.; Frias, J.M.; Bourke, P.; Fernandes, F.A.N.; Rodrigues, S. Fructooligosaccharides Integrity after Atmospheric Cold Plasma and High-Pressure Processing of a Functional Orange Juice. Food Res. Int. 2017, 102, 282–290. [Google Scholar] [CrossRef] [PubMed]
  41. Ovenston, T.C.J.; Rees, W.T. The Spectrophotometric Determination of Small Amounts of Hydrogen Peroxide in Aqueous Solutions. Analyst 1950, 75, 204–208. [Google Scholar] [CrossRef]
  42. Ball, G.F.M. Vitamins in Foods: Analysis, Bioavailability, and Stability; CRC Press: Boca Raton, FL, USA, 2006. [Google Scholar]
  43. Ghosh, H.P.; Sarkar, P.K.; Guha, B.C. Distribution of the Bound Form of Nicotinic Acid in Natural Materials. J. Nutr. 1963, 79, 451–453. [Google Scholar] [CrossRef] [PubMed]
  44. Wall, J.S.; Carpenter, K.J. Variation in Availability of Niacin in Grain Products. Food Technol. 1988, 42, 198–204. [Google Scholar]
  45. Plesovsky-Vig, N. Pantothenic Acid. In Modern Nutrition in Health and Disease; Shils, M.E., Olson, J.A., Shike, M., Ross, A.C., Eds.; Lippincott Williams and Wilkins: Philadelphia, PA, USA, 1999; p. 423. [Google Scholar]
  46. Fernandes, F.A.N.; Rodrigues, S.; Cárcel, J.A.; García-Pérez, J.V. Ultrasound-Assisted Air-Drying of Apple (Malus domestica L.) and Its Effects on the Vitamin of the Dried Product. Food Bioproc. Technol. 2015, 8, 1503–1511. [Google Scholar] [CrossRef]
  47. Fernandes, F.A.N.; Rodrigues, S. Cold Plasma Processing on Fruits and Fruit Juices: A Review on the Effects of Plasma on Nutritional Quality. Processes 2021, 9, 2098. [Google Scholar] [CrossRef]
  48. Di Mascio, P.; Kaiser, S.; Sies, H. Lycopene as the Most Efficient Biological Carotenoid Singlet Oxygen Quencher. Arch. Biochem. Biophys. 1989, 274, 532–538. [Google Scholar] [CrossRef] [PubMed]
  49. Fernandes, F.A.N.; Oliveira, V.S.; Gomes, W.F.; Rodrigues, S. Degradation Kinetics of Vitamin E during Ultrasound Application and the Adjustment in Avocado Puree by Tocopherol Acetate Addition. LWT Food Sci. Technol. 2016, 69, 342–347. [Google Scholar] [CrossRef]
  50. Mason, T.J. Power Ultrasound in Food Processing—The Way Forward. In Ultrasounds in Food Processing; Povey, M.J.W., Mason, T.J., Eds.; Blackie Academic and Professional: Glasgow, UK, 1998. [Google Scholar]
  51. Ozhogina, O.A.; Kasaikina, O.T. B-Carotene as an Interceptor of Free Radicals. Free Radic. Biol. Med. 1995, 19, 575–581. [Google Scholar] [CrossRef] [PubMed]
  52. Jomova, K.; Valko, M. Health Protective Effects of Carotenoids and Their Interactions with Other Biological Antioxidants. Eur. J. Med. Chem. 2013, 70, 102–110. [Google Scholar] [CrossRef]
Figure 1. Relative amount of vitamin B1 in the FOS-enriched acerola juice subjected to ultrasound processing at 1000, 3000, and 5000 W/L. The relative amount of 100% corresponded to 0.08 mg/100 mL of vitamin B1 (dashed blue line). Number of replicates = 3.
Processes 11 02243 g001
Figure 2. Relative amount of vitamin B3 in the FOS-enriched acerola juice subjected to ultrasound processing at 1000, 3000, and 5000 W/L. The relative amount of 100% corresponded to 0.40 mg/100 mL of vitamin B3 (dashed blue line). Number of replicates = 3.
Processes 11 02243 g002
Figure 3. Relative amount of vitamin B5 in the FOS-enriched acerola juice subjected to ultrasound processing at 1000, 3000, and 5000 W/L. The relative amount of 100% corresponded to 0.031 mg/100 mL of vitamin B5 (dashed blue line). Number of replicates = 3.
Processes 11 02243 g003
Figure 4. Relative amount of vitamin A in the FOS-enriched acerola juice subjected to ultrasound processing at 1000, 3000, and 5000 W/L. The relative amount of 100% corresponded to 760 UI/100 mL of vitamin A (blue dashed line). Number of replicates = 3.
Processes 11 02243 g004
Figure 5. Relative amount of vitamin C in the FOS-enriched acerola juice subjected to ultrasound processing at 1000, 3000, and 5000 W/L. The relative amount of 100% corresponded to 1760 mg/100 mL of vitamin C (blue dashed line). Number of replicates = 3.
Processes 11 02243 g005
Figure 6. Relative amount of total phenolic content in the FOS-enriched acerola juice subjected to ultrasound processing at 1000, 3000, and 5000 W/L in relation to the fresh, unprocessed juice. (Relative total phenolic content = 100% represented by the blue dashed line). Number of replicates = 3.
Processes 11 02243 g006
Figure 7. Relative amount of carotenoids in the FOS-enriched acerola juice subjected to ultrasound processing at 10, 25, and 40 °C in relation to the fresh, unprocessed juice. (Relative carotenoid content = 100% represented by the blue dashed line). Number of replicates = 3.
Processes 11 02243 g007
Figure 8. Relative antioxidant capacity by the FRAP method in the FOS-enriched acerola juice subjected to ultrasound processing at 1000, 3000, and 5000 W/L in relation to the fresh, unprocessed juice. (Relative antioxidant capacity = 100% represented by the blue dashed line). Number of replicates = 3.
Processes 11 02243 g008
Figure 9. Relative antioxidant capacity by the ABTS method in the FOS-enriched acerola juice subjected to ultrasound processing at 1000, 3000, and 5000 W/L in relation to the fresh, unprocessed juice. (Relative antioxidant capacity = 100% represented by the blue dashed line). Number of replicates = 3.
Processes 11 02243 g009
Figure 10. Concentration of FOS on the FOS-enriched acerola juice subjected to ultrasound processing at 1000, 3000, and 5000 W/L. The sugars with a degree of polymerization = 1 refer to fructose + glucose. Number of replicates = 3.
Processes 11 02243 g010
Table 1. Concentration of hydrogen peroxide (μmol/L) in FOS-enriched acerola juice subjected to ultrasound processing at 10, 25, and 40 °C. Number of replicates = 3.
Time10 °C10 °C10 °C25 °C25 °C25 °C40 °C40 °C40 °C
(min)1000 W/L3000 W/L5000 W/L1000 W/L3000 W/L5000 W/L1000 W/L3000 W/L5000 W/L
0197 ± 20197 ± 20197 ± 20197 ± 20197 ± 20197 ± 20197 ± 20197 ± 20197 ± 20
2, 5262 ± 21221 ± 30313 ± 6375 ± 9377 ± 5348 ± 10241 ± 15248 ± 35300 ± 4
5347 ± 20199 ± 6331 ± 5360 ± 10372 ± 2315 ± 8213 ± 10242 ± 10287 ± 3
10299 ± 5213 ± 6331 ± 6428 ± 7355 ± 6347 ± 7277 ± 25304 ± 25301 ± 9
15333 ± 2239 ± 25340 ± 5437 ± 2384 ± 2357 ± 9233 ± 8303 ± 9294 ± 10
Disclaimer/Publisher’s Note: The statements, opinions and data contained in all publications are solely those of the individual author(s) and contributor(s) and not of MDPI and/or the editor(s). MDPI and/or the editor(s) disclaim responsibility for any injury to people or property resulting from any ideas, methods, instructions or products referred to in the content.

