Article

Improving the Accuracy of Silicon Transfer Prediction in Submerged Arc Welding: A Multi-Reaction-Zone Analysis

1
School of Mechanical and Electrical Engineering, Suqian University, Suqian 223800, China
2
School of Metallurgy, Northeastern University, Shenyang 110819, China
3
Department of Science and Technology, Suqian University, Suqian 223800, China
*
Authors to whom correspondence should be addressed.
These authors contributed equally to this work.
Processes 2023, 11(8), 2285; https://doi.org/10.3390/pr11082285
Submission received: 15 June 2023 / Revised: 12 July 2023 / Accepted: 27 July 2023 / Published: 29 July 2023
(This article belongs to the Section Materials Processes)

Abstract

:
This study aims to predict and evaluate the transfer behavior of silicon employing SiO2-bearing fluxes during submerged arc welding. Unlike previous studies that only focused on chemical reactions in the weld pool zone, this research investigates the elemental behavior of silicon subjected to essential reaction zones in a submerged arc welding process. The proposed method is compared with the traditional thermodynamic equilibrium models, enhancing the understanding of silicon transfer behavior in the submerged arc welding process. It is demonstrated that relying solely on thermodynamics within the weld pool zone is inadequate for accurately predicting the extent of silicon transfer level since the loss of silicon during the droplet zone and the improvement in oxygen content in the molten droplet are not considered, resulting in an overestimation of the ΔSi level. Finally, the limitations of the traditional elemental transfer quantification method and corresponding corrective suggestions are proposed.

1. Introduction

The submerged arc welding (SAW) technique is particularly effective in welding for thick steel plates due to its exceptional reliability and high deposition rate [1]. The arc plasma and weld pool in the SAW process are concealed by a layer flux and slag, rendering them invisible. SAW is a complex metallurgical process with temperatures exceeding 1900 °C, which facilitates chemical reactions among various phases, such as arc plasma, flux/slag, and liquid metal [2]. These interactions lead to changes in the weld metal (WM) composition, which in turn affect the mechanical properties [3].
Silicon (Si) is an essential element that significantly impacts the mechanical properties of the weldment, particularly in terms of the strength and toughness. It is widely acknowledged that excessive Si content in the WM should be avoided as it can result in reduced elongation and toughness [4]. Consequently, it is essential to predict the Si content in submerged arc-welded metal accurately and select appropriate fluxes to achieve the weldment of desired quality [5].
The temperature achieved in the SAW process is typically above 1900 °C [6,7]. Generally, attaining equilibrium is inherently arduous during SAW due to factors such as high temperature gradients, the coexistence of various phases, and the substantial energy transferred from the arc plasma [8]. Nonetheless, despite these deviations, it remains viable to apply equilibrium principles to place constraints on the chemical mechanisms and interactions within the SAW process [9,10]. This is achieved by postulating that local equilibrium can be realized due to the high temperatures and surface-to-volume ratios implicated [8,11]. Consequently, although the overall equilibrium may remain elusive in the SAW process, the employment of local equilibrium principles can yield valuable information pertaining to the chemical mechanisms, thereby facilitating the optimization of the SAW process [12,13].
Based on the scientific hypotheses mentioned above, equilibrium models have been developed to predict the Si content in the submerged arc-welded metal. Considering the chemical reaction governing the Si transfer at the slag–metal interface, which is shown by Reaction (1), Chai et al. [4,9,10] proposed a slag–metal equilibrium model for estimating the Si content in the submerged arc-welded metal. The novelty of this model lies in its ability to estimate the oxygen (O) content based on the flux basicity index (BI), which is an empirical index used to estimate the O content of submerged arc-welded metal [14]. Subsequently, the Si content in the WM ([pct Si]) is estimated from the equilibrium constant of Reaction (1) with the activity of SiO2SiO2) in the initial flux, as shown by Equation (2) [4,9,10].
  ( SiO 2 ) = [ Si ] + 2 [ O ]
[ pct   Si ] = α SiO 2 73 . 6 [ pct   O ] 2
However, the accuracy of the slag–metal equilibrium model in predicting the WM Si content is limited, mainly because the basis for the BI formula is empirical in nature and does not account for the actual WM O content [5,15]. As is well-known, the SAW process enables significant gas formation, which exerts a significant impact on the transfer behavior of Si, especially in terms of Reactions (3) and (4) [16].
( SiO 2 ) = SiO ( g ) + 1 2 O 2 ( g )
2 ( CaF 2 ) + ( SiO 2 ) = 2 ( CaO ) + SiF 4 ( g )
Chai et al. [16] and Lau et al. [7] both concluded that the primary source of O in the SAW process is the O2 generated by the decomposition of oxides inside the arc cavity, such as Reaction (3). Tuliani et al. [17] suggested that the impact of Reaction (4) on the transfer of Si should also be considered. However, due to the extremely high temperature characteristics of the SAW, it was not possible to perform thermodynamic equilibrium calculations involving gas species under the technological conditions in the early stages of the research [18]. In recent years, the development of Calphad technology has enabled researchers to perform thermodynamic calculations on metallurgical systems with extremely high temperatures [19,20]. The Calphad approach, which stands for “computer coupling of phase diagrams and thermochemistry,” utilizes thermodynamic models to predict the characteristics of material systems with greater accuracy [19]. Although direct measurement of thermodynamic data is impossible during SAW due to temperatures exceeding 1900 °C, the thermodynamic models used in the Calphad approach have proven reliable in obtaining thermodynamic data above this temperature range [19,21]. Based on the gas–slag–metal interface model in SAW, the gas–slag–metal equilibrium model has been updated from the slag–metal equilibrium model [18]. The gas–slag–metal equilibrium model has demonstrated higher accuracy in predicting Si content compared to the slag–metal equilibrium model [5].
However, even with the use of thermodynamic equilibrium methods to analyze chemical reactions and estimate the Si content during SAW, there remains a significant margin of error [5]. The reason for this is that SAW consists of multiple reaction zones rather than solely focusing on the weld pool reaction zone, as emphasized by equilibrium models [12,13]. It is well-known that Si is a basic dioxide in the weld pool, and the transfer behavior is largely dictated by the O content in the metal [4]. Furthermore, the evaporation and redistribution of Si within the SAW process are not considered since the equilibrium models set nominal compositions as the initial compositional input [1].
To address such issues, the present study has been undertaken to evaluate the transfer behavior of Si in SiO2-bearing fluxes considering all essential chemical reaction zones in SAW. Unlike previous studies that only considered chemical reactions in the weld pool zone, this research will investigate and discuss the elemental behavior of Si in essential reaction zones subject to the SAW process. This method was then compared with the traditional thermodynamic equilibrium models, further enhancing the understanding of the transfer behavior of Si in the SAW process. Then, the shortcomings of the conventional method for quantifying elemental transfer are examined, and recommendations for improvement are put forward.

2. Materials and Methods

2.1. Materials Preparation and Welding Experiment

The CaF2–SiO2 system flux was chosen as the subject of this study based on the fact that SiO2 is the primary oxide, which eliminates the potential impact of other oxides on the transfer behavior of elements [22]. The flux formulation is set according to our previous study [22].
The reagent-grade powders were dry-mixed for each agglomerated flux recipe. Subsequently, the powders were bound together using a sodium silicate solution, which is a glue-like material. A minute quantity of Na2O is introduced for the purpose of enhancing the stability of the arc. After bonding, the mixtures were pelletized and subjected to drying in a muffle furnace at 973 K for 3 h. Finally, the mixtures were fragmented and screened to obtain particle sizes ranging from 14 to 100 mesh.
The base metal (BM) chosen for the experiment was Q345A, a typical low-alloy-grade steel (Tensile Strength: 490 to 550 MPa, Elongation: 24 to 31%). The welding process used was bead-on-plate double-electrodes single-pass SAW, carried out using the Lincoln Electric Power Wave AC/DC 1000 SD machine from Lincoln Electric in Cleveland, OH, USA. Two different heat inputs were employed: 60 kJ/cm (with DC-850 A/32 V for electrode forward and AC-625 A/36 V for electrode backward, at a speed of 500 mm/min) and 20 kJ/cm (with DC-436 A/30 V at a speed of 393 mm/min) [22]. To determine the compositions of metallic elements (Si and Mn), inductively coupled plasma optical emission spectrometry (ICP-OES) was utilized. The ICP-OES equipment used was from Perkin Elmer in Waltham, MA, USA. Additionally, the LECO analyzer was employed to determine the oxygen (O) contents [22]. More detailed experimental procedures and compositional analysis are stated in our previous literature [22]. The compositions of fluxes, BM, and electrode have been summarized in Table 1 and Table 2 [22].

2.2. Elemental Transfer Calculation

In previous studies, a Δ value is utilized to quantify the extent of elemental transfer during SAW process, with a positive value indicating a gain of element in the WM from the flux and a negative value indicating a loss of element from the WM to the flux [18]. However, such quantification method only considers the elemental transfer behavior in the weld pool zone. Typically, the SAW process can be divided into three zones: the droplet zone, weld pool zone, and solidification zone [12,13]. Since there can be variations in the metal composition at different stages of the SAW process, as shown by Figure 1, it is essential to consider all aspects of the process to ensure precise quantification [23,24].
Different from previous studies, ΔD and Δw are employed to quantify the transfer level within the droplet and weld pool zones in this study. For a particular element, values of ΔD and Δw are calculated from Equations (5) and (6), where ΔD presents the level of elemental transfer in the droplet zone, MD presents the content in the droplet, ΔW presents the level of elemental transfer in the weld pool zone, MW presents the content in the WM, MN presents the nominal composition. Equation (7) is then used to calculate the MN value, which is obtained by incorporating the measured compositions of the BM (MBM) and the electrode (MEL), along with the dilution value of the BM (d) [18]. The elemental transfer behaviors, as assessed by the gas–slag–metal equilibrium model, have been previously documented [22].
Δ D =   M D   M N
Δ W =   M W   M D
M N = M BM × d + M EL × ( 1 d )

3. Thermodynamic Modeling and Simulation

The previous study provided a detailed report on the modeling and quantification of chemical reactions, specifically focusing on those occurring within the weld pool zone [23,24,25]. This study, on the other hand, focuses on evaluating the transfer behaviors within both the droplet zone and weld pool zone, aiming to understand the transfer mechanisms in these specific regions. Figure 2 depicts the overall modeling procedure, where white represents modeling tools, yellow represents the employed databases, red represents simulated chemical reactions, and green represents quantification of elemental transfer behavior. The star and dashed lines mean the databases employed for the Equilib Module. The simulation results will be provided in this part.

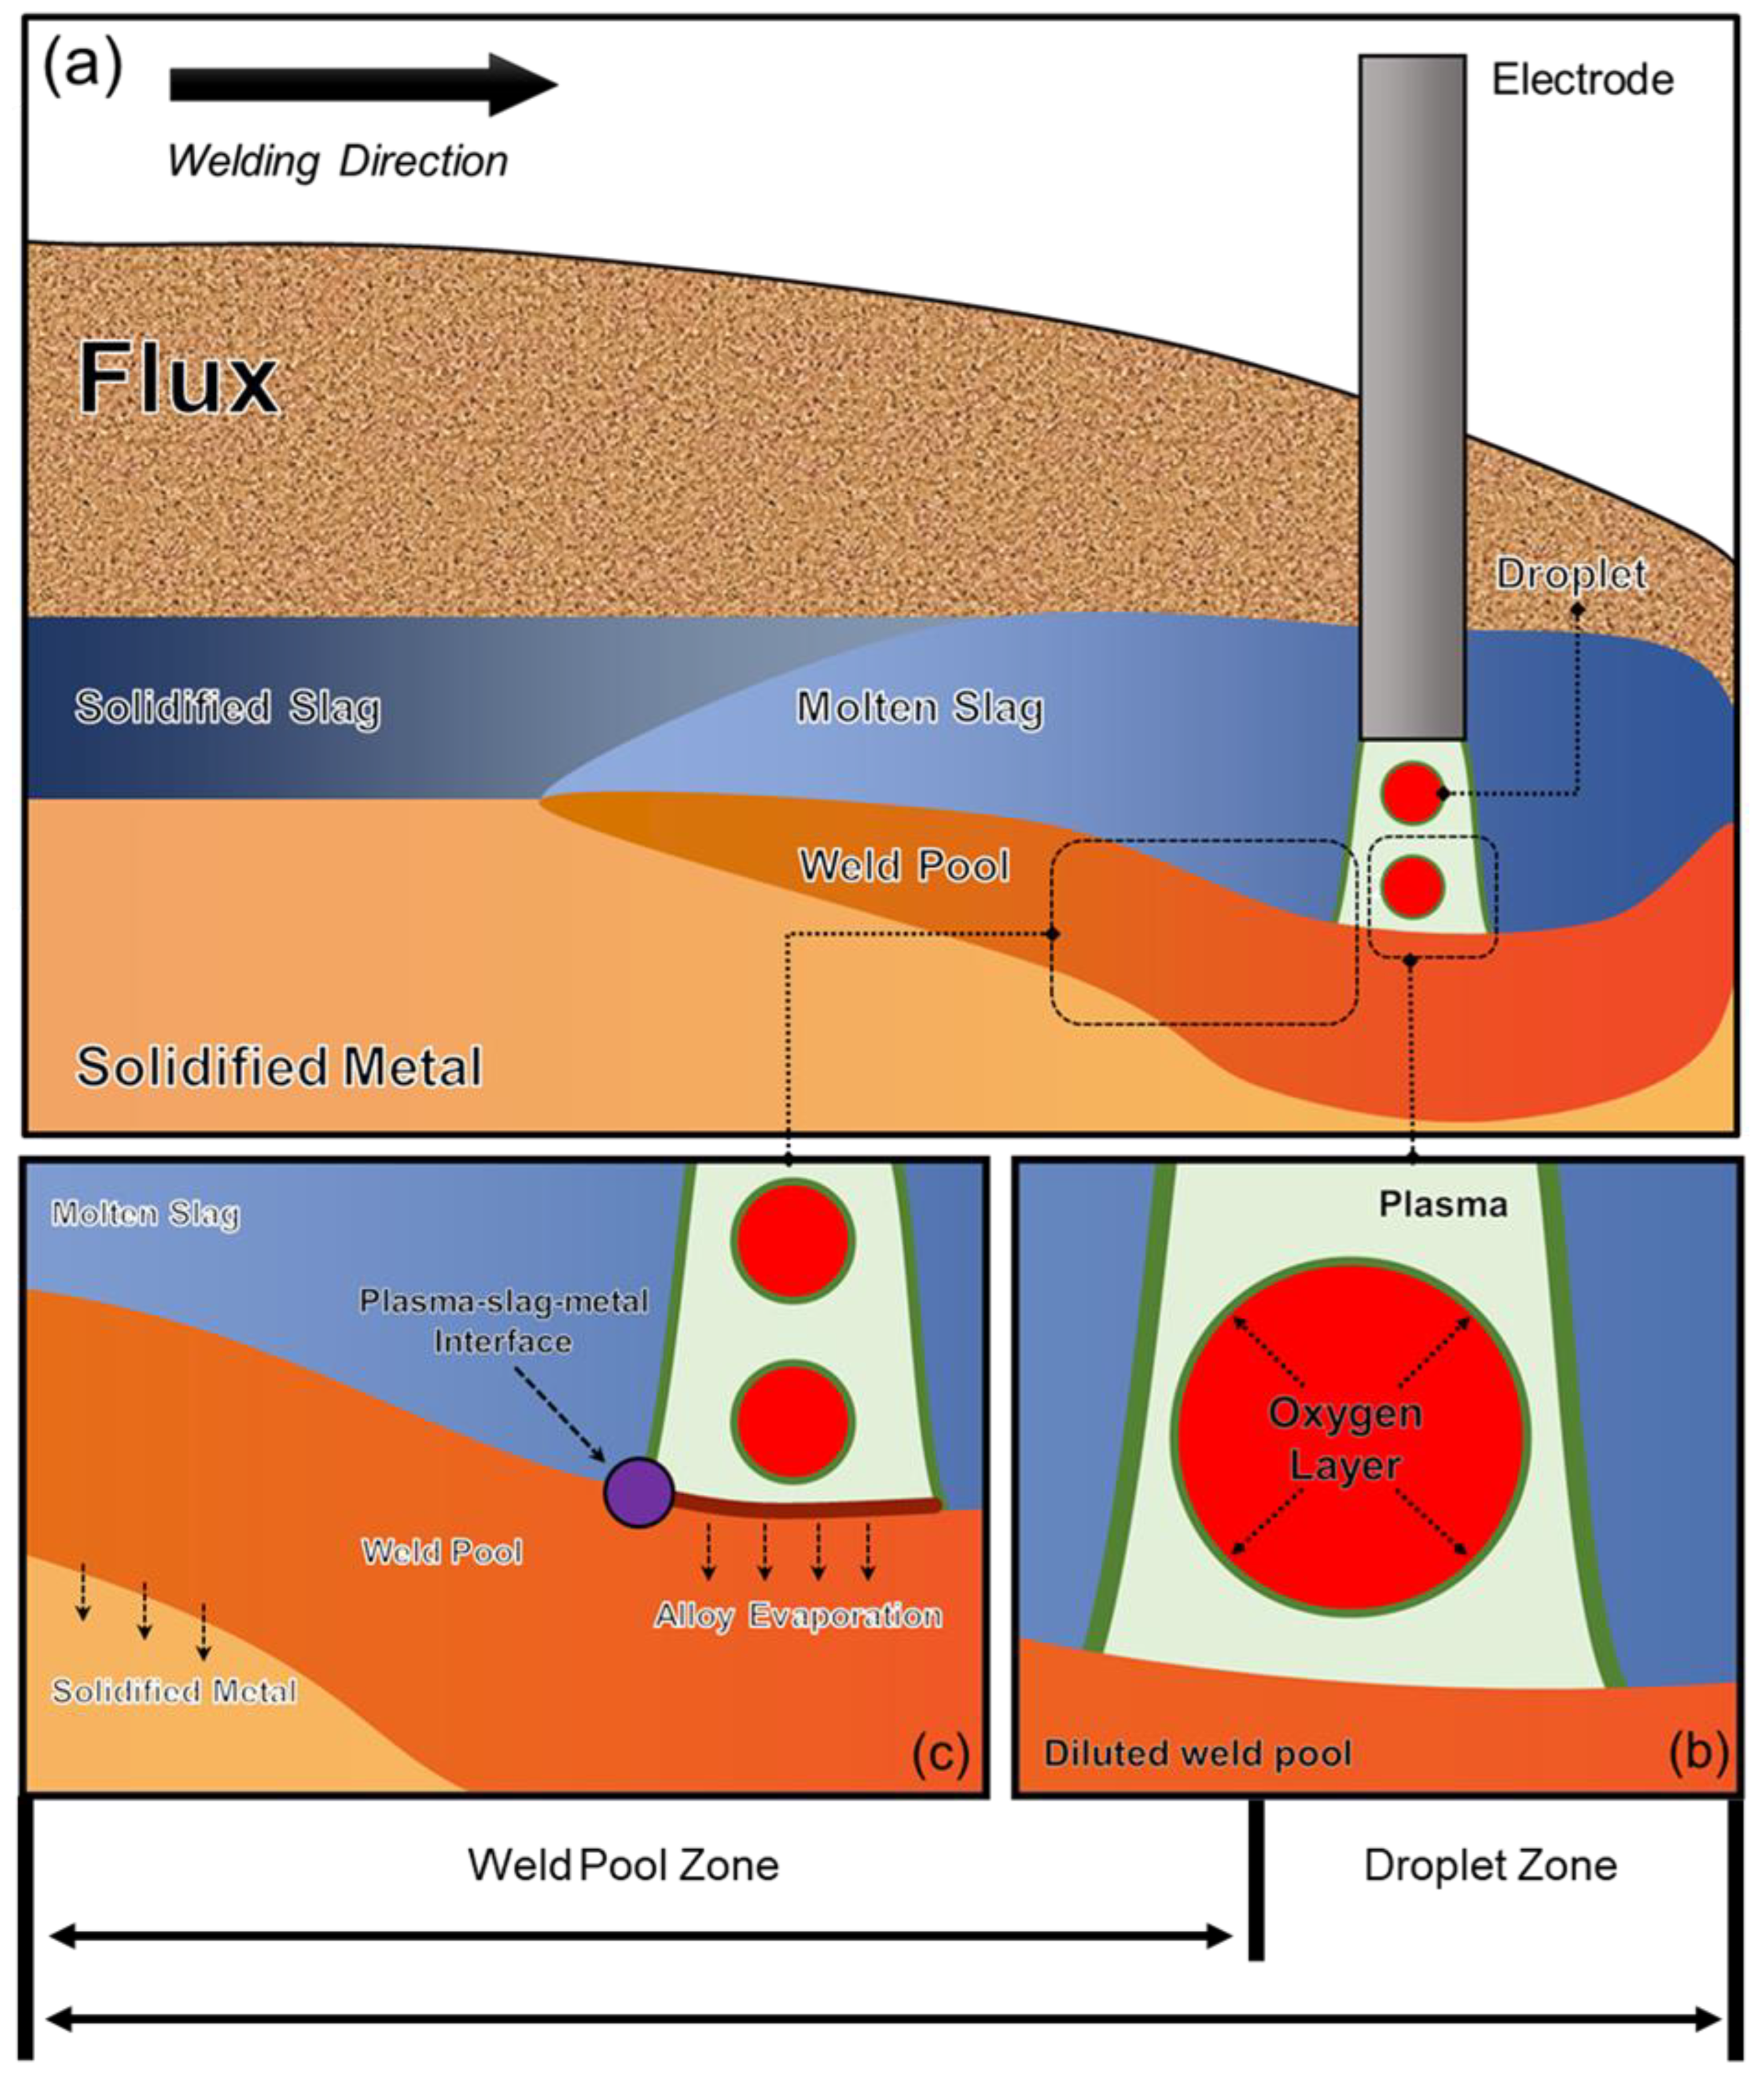
3.1. Droplet Reactions

As demonstrated in previous research, relying solely on the analysis of chemical reactions within the weld pool zones is inadequate for evaluating transfer behaviors in the overall SAW process. Traditional equilibrium models, in particular, overlook two essential factors [13]:
  • Significant improvement in O content in the droplet.
  • Potential loss of alloy elements induced by the arc plasma.
During droplet reactions, the molten droplet separates from the end of the electrode. Due to the high temperature inside the arc cavity, the oxide in the flux decomposes, releasing O2 and significantly increasing the O content in the molten droplet [1]. Based on the initial experiments, it was determined that there was minimal transfer of alloy elements in this region [23,24]. Such a hypothesis suggests that the presence of an active O layer on the droplet hinders the transfer of alloying elements towards the metal–plasma interface, which is depicted by the green line surrounding the droplet in Figure 1b [12,13,23,24,25]. The nominal compositions for each WM have been calculated and provided elsewhere [22].
The Equilib module is employed for modeling purposes [13]:
  • The FToxid, Fstel, and FactPS databases were selected for utilization. The solution phases of ASlag-liq all oxides, S (FToxid-SLAGH), and LIQUID (FStel-Liqu) were opted for simulating the molten slag and steel phases.
  • The equilibrium temperature for the SAW process was designated as 2500 °C, which corresponds to the temperature of the arc plasma. The input metal chemistries were derived from the BM compositions.
  • In order to predict the O concentration in the droplet, an equilibrium calculation was performed using iron (Fe) and O as the input metal constituents. The PO2 value provided in Table 3 was utilized in this calculation. Table 3 summarizes the simulated PO2 and O concentrations in the droplet obtained as the output.
For the arc welding of steel, it is well-known that the metal evaporation regarding Si and Mn is induced by the arc plasma. Multiple studies have indicated that relying solely on thermodynamics is inadequate for accurately predicting the extent of alloy evaporation occurring in this region. Recently, Zhu et al. [26] proposed models utilizing the Langmuir Equation to forecast the evaporation-induced Si and Mn loss at the plasma–metal interface during arc welding in C-based steel. The researchers found a strong correlation between the levels of Si and Mn and the actual data, as evidenced by Equations (8) and (9) [13,26]. In these equations, η denotes the mass percentage, while M represents the compositions of Si and Mn after the dilution of the weld pool by the droplet.
η Si = 38.55 0.33 M Mn 0.58 M Si
η Mn = 49.04 0.23 M Mn 0.49 M Si
As such, this model is employed to simulate the evaporation level of Si and Mn before the weld pool is submerged by the molten slag (the plasma–slag–metal interface is established). Considering the dilution effect, the compositions before the gas–slag–metal thermodynamic equilibrium is established are calculated, with results provided in Table 4.

3.2. Weld Pool Reactions

After the weld pool is submerged by the molten slag, the local attained gas–slag–metal thermodynamic equilibrium is established [18]. The chemical reactions within this zone have been discussed in previous studies [5,20]. Then, the cooling and solidification of the hot metal lead to a decrease in Si content near the slag–metal interface as the oxides become more stable at lower temperatures [23,24,25]. However, since the Si content mainly represents the bulk composition of the WM, such loss is disregarded in the modeling process, as previously stated [27].
For modeling purposes, the Equilib module is employed [13]:
  • The Equilib module is employed to conduct the modeling regarding the weld pool zone reactions.
  • To simulate the molten slag and steel phases, the FToxid, Fstel, and FactPS databases were utilized. The selected solution phases included ASlag-liq for all oxides, S (FToxid-SLAGH), and LIQUID (FStel-Liqu).
  • The input metal compositions were determined based on the data provided in Table 4, while the flux compositions were set as the information presented in Table 1.
  • A modeling temperature of 2000 °C was established.

3.3. Quantification of Elemental Transfer

In previous work, only the elemental transfer behaviors within the weld pool zone have been considered, the level of which has been elucidated elsewhere [22]. Herein, the level of elemental transfer is quantified subject to both the zones of the drop and weld pool via the approach provided in Section 2.2.
In order to differentiate it from the previous quantification approach (ΔE: the transfer behavior evaluated by the equilibrium model), the present study employs ΔT (T means total) as a means of aggregating quantification. The details of quantification data are summarized in Table 5 and Table 6 [22].

4. Results and Discussion

In this section, an investigation will be carried out into the transfer mechanisms of Si and O. Unlike prior studies, a comprehensive examination will be conducted on the transfer behavior of these elements within the distinct regions of the welding process: the droplet reaction zone and the weld pool reaction zone [2,3,28]. The primary objective is to elucidate the underlying transfer mechanisms governing Si and O. Additionally, an analysis will be performed to juxtapose the transfer quantities of Si and O with those predicted by the equilibrium model.

4.1. Transfer Behavior of Si

In Figure 3, the quantified elemental behavior of Si has been depicted. Figure 3a corresponds to the ΔSi value obtained in the present study, whereas Figure 3b represents the ΔSi value evaluated using the traditional equilibrium model [22].
Based on the analysis of Figure 3a, it is observed that the Si content decreases within the droplet reaction zone, while, in the weld pool reaction zone, Si undergoes a transfer from the slag to the WM. However, it is noteworthy that, when employing the thermodynamic equilibrium model for simulation, the Si transfer is not observed within the droplet reaction zone. Instead, the model predicts that Si only transfers from the slag to the WM in the weld pool zone, as depicted in Figure 3b.
Although the mechanism is not yet clear, numerous research findings indicate that the evaporation of Si occurs in the droplet reaction zone [1]. However, this aspect is not considered in the equilibrium models [18]. Therefore, it is necessary to incorporate the loss of Si in the droplet reaction zone in order to accurately characterize its transfer behavior of Si during SAW.

4.2. Transfer Behavior of O

In SAW, O is considered an essential factor in determining the mechanical properties of the post-weld metal, particularly its strength and toughness [29]. It is widely accepted that the flux used in SAW acts as the primary source of O [14]. This is attributed to the decomposition of oxides present in the flux when exposed to the high-temperature arc plasma, leading to the release of O2 [6,7]. Consequently, the O content in the molten droplets increases, contributing to the overall composition and properties of the weld.
In earlier experiments, the basicity index model was used to evaluate the flux O potential [28]. By assessing the basicity index value, fluxes can be categorized into three primary groups: acidic flux, neutral flux, and basic flux [3]. It is generally observed that the flux O potential (the level of O concertation in the final submerged arc-welded metal) decreases as the basicity index value increases until it reaches a steady state [7].
In the subsequent study, Lau et al. [6,7] conducted a systematic analysis of the changes in O content during the SAW process. Despite the limited advancement in thermodynamics at that time, Lau et al. [6,7] proposed that the flux primarily supplies O to the molten droplet reaction zone. Moreover, they suggested that reduction reactions of oxygen are highly probable to occur in the corresponding weld pool reaction zone.
Figure 4 illustrates the transfer behavior of the O element. More specifically, Figure 4a presents the transfer values of O, which were quantified using the methodology applied in this study. Conversely, Figure 4b illustrates the transfer values of O quantified by the thermodynamic equilibrium model. As shown in Figure 4a, there is a significant uptake of O within the droplet zone, with levels exceeding 1000 ppm. This finding is consistent with previous studies [6,7,23,24]. However, Figure 4b presents a completely different trend, indicating that the O content within the metal in the droplet zone remains constant, while there is an increase in the molten pool zone. This is entirely inconsistent with the experimental results. Therefore, it can be inferred that the method proposed in this study provides a more accurate description of the variation trend in O content during the SAW process compared to the thermodynamic equilibrium model.
Figure 4 is presented to clarify the assumptions made by Chai et al. [16], Lau et al. [6,7], and Indacochea et al. [8] regarding the relationship between PO2 and O content during SAW.
  • Chai et al. [16] conducted a study where they designed CaF2-based binary fluxes and measured the O content in the weld metal (WM). Their findings revealed that even stable oxides have the tendency to decompose, resulting in the release of O2 and subsequently increasing the O content in the submerged arc-welded metal.
  • Lau et al. [6,7] proposed that the level of flux decomposition, which corresponds to the level of PO2 in the arc cavity, should be considered as the primary source of O in submerged arc-welded metal.
  • Indacochea et al. [8] made an assumption that the equilibrium PO2 in the arc plasma regulates the extent to which the flux can chemically enhance the O level in submerged arc-welded metal.
As illustrated in Figure 5a,b, in both the droplet and weld pool zones, the O content in the metal typically rises as the equilibrium partial pressure of O2 increases. These findings are fully consistent with the three scientific hypotheses mentioned above.

4.3. Predicted ΔSi vs. Real ΔSi

In this section, an analysis and comparison will be conducted between the predicted ΔSi and the measured ΔSi, along with an examination of the associated errors. Figure 6 presents the predicted values of ΔSi. The black pentagon star represents ΔSi evaluated by a traditional thermodynamic equilibrium model, while the two red pentagon stars represent ΔSi evaluated by the method proposed in this framework.
Through the observation of Figure 6, it can be discerned that the black pentagon is closer to the black diagonal line in comparison to the red pentagon. This suggests that traditional thermodynamic equilibrium models may have overestimated the value of ΔSi. According to Equation (2), the value of ΔSi can be evaluated by Equation (10), where [pct Si]N represents the nominal manganese content, αSiO2 represents SiO2 activity, and [pct O] represents predicted O concentration in metal.
Δ Si = α SiO 2 73 . 6 [ pct   O ] 2 [ pct   Si ] N
Considering the same fluxes employed, it is assumed that the change in ΔSi is affected by the values of [pct Si]N and [pct O]. As shown in Figure 3, equilibrium models ignore the loss of Si during the droplet zone in the arc cavity, resulting in an overestimation of the [pct Si]N level. Additionally, the traditional equilibrium models fail to account for the improvement in oxygen content in the molten droplet, leading to an underestimation of the [pct O] level. Based on the above two factors, ΔSi is overestimated by the thermodynamic equilibrium models.
Therefore, the present study introduces a more comprehensive approach to predicting the transfer behavior of Si in welding. By separately considering the droplet zone and the weld pool zone, the study takes into account the effects of arc-plasma-induced Si evaporation and Si oxidation by O in the droplet. This approach goes beyond traditional quantitative methods that solely rely on ΔSi value and consider only chemical reactions in the weld pool zone. Consequently, the study offers a novel and more accurate prediction method for understanding the control effect of flux on the Si content in weld metal. As such, the novelty of the present study lies in the fact that:
  • In this study, a new approach was suggested for predicting the Si content and Si transfer behavior in SAW when using SiO2-bearing fluxes. By comparing the prediction results with those obtained from the traditional equilibrium model, it was found that solely considering the chemical interactions within the weld pool zone is inadequate for assessing the overall Si transfer behavior in the SAW process.
  • The ΔSi value plays a crucial role in determining the compatibility of base metal (BM), electrode, and flux. It governs the extent to which the flux can chemically impact the Si content in SAW. Nevertheless, conventional SAW engineering and scientific research solely focus on the changes in Si content caused by the nominal Si content and the chemical reaction within the weld pool zone, resulting in notable inaccuracies. Hence, this study offers a novel quantitative perspective on elemental transfer in SAW engineering and scientific research.

5. Conclusions

In summary, this investigation evaluates the transfer behavior of Si (and O) in the SAW process and compares it with predictions created by thermodynamic equilibrium models. The results of this research indicate that relying solely on thermodynamics within the weld pool area is insufficient for accurately predicting the extent of Si transfer.
Key conclusions drawn from the study are as follows:
  • The thermodynamic equilibrium models do not account for the loss of Si during the droplet zone and the enhancement of O content in the molten droplet. As a result, these models tend to overestimate the level of Si transfer (ΔSi).
  • The study provides a more precise depiction of the trend in Si and O transfer behavior during the SAW process, surpassing the accuracy of the thermodynamic equilibrium model.
  • Traditional quantitative methods for predicting ΔSi values may lead to errors due to their focus solely on chemical reactions in the weld pool zone. However, considering the physical and chemical phenomena of submerged arc welding, it is crucial to separately consider the droplet zone and the weld pool zone to achieve more accurate predictions of Si transfer behavior, particularly regarding Si evaporation induced by arc plasma and Si oxidation by O in the droplet.
In order to further improve the prediction accuracy of the model, the following issues need to be addressed and considered in further work.
  • Physical interactions can also affect Si content, especially the physical involvement of inclusions.
  • The reduction of Si at the slag–metal interface due to the oxides becoming more stable at lower temperatures during the solidification process of the molten pool.

Author Contributions

Conceptualization, J.Z., J.F., and D.Z.; funding acquisition, J.F. All authors have read and agreed to the published version of the manuscript.

Funding

This work was financially supported by the National Natural Science Foundation of China (No. 50474085), the Initial Fund of Suqian University (No. 2022XRC040), Suqian Science and Technology Project (No. K202239).

Conflicts of Interest

On behalf of all authors, the corresponding author states that there is no conflict of interest.

References

  1. Sengupta, V.; Havrylov, D.; Mendez, P. Physical Phenomena in the Weld Zone of Submerged Arc Welding-A Review. Weld. J. 2019, 98, 283–313. [Google Scholar] [CrossRef]
  2. Natalie, C.A.; Olson, D.L.; Blander, M. Physical and Chemical Behavior of Welding Fluxes. Annu. Rev. Mater. Sci. 1986, 16, 389–413. [Google Scholar] [CrossRef]
  3. Olson, D.; Liu, S.; Frost, R.; Edwards, G.; Fleming, D. Nature and Behavior of Fluxes Used for Welding. In ASM Handbook; ASM International: Almere, The Netherlands, 1993; Volume 6, pp. 55–63. [Google Scholar] [CrossRef]
  4. Chai, C.-S. Slag-Metal Reactions during Flux Shielded Arc Welding. Ph.D. Thesis, Massachusetts Institute of Technology, Cambridge, MA, USA, 1980. [Google Scholar]
  5. Zhang, J.; Peng, L.; Zhou, L.; Chen, Y. On the Si Content Prediction for Submerged Arc Welded Metal via Calphad Technique: A Brief Discussion. J. Mater. Res. Technol. 2022, 21, 1856–1862. [Google Scholar] [CrossRef]
  6. Lau, T.; Weatherly, G.; McLean, A. Gas/metal/slag Reactions in Submerged Arc Welding Using CaO-Al2O3 Based Fluxes. Weld. J. 1986, 65, 31–38. [Google Scholar]
  7. Lau, T.; Weatherly, G.; McLean, A. The Sources of Oxygen and Nitrogen Contamination in Submerged Arc Welding using CaO-Al2O3 Based Fluxes. Weld. J. 1985, 64, 343–347. [Google Scholar]
  8. Indacochea, J.E.; Blander, M.; Christensen, N.; Olson, D.L. Chemical Reactions During Submerged Arc Welding with FeO-MnO-SiO2 Fluxes. Metall. Trans. B 1985, 16, 237–245. [Google Scholar] [CrossRef]
  9. Chai, C.; Eagar, T. Prediction of Weld-metal Composition during Flux-shielded Welding. J. Mater. Energy Syst. 1983, 5, 160–164. [Google Scholar] [CrossRef]
  10. Chai, C.; Eagar, T. Slag-metal Equilibrium during Submerged Arc Welding. Metall. Trans. B 1981, 12, 539–547. [Google Scholar] [CrossRef]
  11. Zhang, J.; Shao, G.; Guo, Y.; Xu, Q.; Liu, Z. Facilitating Flux Design Process Geared Towards Submerged Arc Welding via Thermodynamic Approach: Case Study into CaF2–SiO2–Na2O–Al2O3–TiO2 Agglomerated Flux. Calphad 2022, 79, 102483. [Google Scholar] [CrossRef]
  12. Zhang, J.; Zhang, D. Thermodynamic Simulation of O Content Variation Roadmap in Submerged Arc Welding Process: From Droplet to Weld Metal. Processes 2023, 11, 784. [Google Scholar] [CrossRef]
  13. Zhang, J.; Liu, P.; Zhang, D. Advancing Manganese Content Prediction in Submerged Arc Welded Metal: Development of a Multi-Zone Model via the Calphad Technique. Processes 2023, 11, 1265. [Google Scholar] [CrossRef]
  14. Eagar, T. Sources of Weld Metal Oxygen Contamination during Submerged Arc Welding. Weld. J. 1978, 57, 76–80. [Google Scholar]
  15. Shao, G.; Liu, Z.; Fan, J.; Guo, Y.; Xu, Q.; Zhang, J. Evaluation of Flux Basicity Concept Geared toward Estimation for Oxygen Content in Submerged Arc Welded Metal. Metals 2022, 12, 1530. [Google Scholar] [CrossRef]
  16. Chai, C.; Eagar, T. Slag Metal Reactions in Binary CaF2-Metal Oxide Welding Fluxes. Weld. J. 1982, 61, 229–232. [Google Scholar]
  17. Tuliani, S.; Boniszewski, T.; Eaton, N. Notch Toughness of Commercial Submerged Arc Weld Metal. Weld. Met. Fabr. 1969, 37, 327–339. [Google Scholar]
  18. Zhang, J.; Shao, G.; Fan, J.; Wang, L.; Zhang, D. A Review on Parallel Development of Flux Design and Thermodynamics Subject to Submerged Arc Welding. Processes 2022, 10, 2305. [Google Scholar] [CrossRef]
  19. Bale, C.W.; Bélisle, E.; Chartrand, P.; Decterov, S.; Eriksson, G.; Gheribi, A.; Hack, K.; Jung, I.-H.; Kang, Y.-B.; Melançon, J. Reprint of: FactSage Thermochemical Software and Databases, 2010–2016. Calphad 2016, 55, 1–19. [Google Scholar] [CrossRef]
  20. Zhang, J.; Wang, L. Upgrading the Prediction Model for Mn Content in Submerged Arc Welded Metal via CALPHAD Technology: Case Study into Typical Acidic and Basic Fluxes. Ceram. Int. 2022, 49, 6573–6579. [Google Scholar] [CrossRef]
  21. Jung, I.-H. Overview of the Applications of Thermodynamic Databases to Steelmaking Processes. Calphad 2010, 34, 332–362. [Google Scholar] [CrossRef]
  22. Zhang, D.; Zhang, J.; Yang, S.; Shao, G.; Liu, Z. Element Transfer Behavior for CaF2-Na2O-SiO2 Agglomerated Flux Subject in Submerged Arc Welding Process. Processes 2022, 10, 1847. [Google Scholar] [CrossRef]
  23. Mitra, U.; Eagar, T. Slag-metal Reactions during Welding: Part I. Evaluation and Reassessment of Existing Theories. Metall. Trans. B 1991, 22, 65–71. [Google Scholar] [CrossRef]
  24. Mitra, U.; Eagar, T. Slag-metal Reactions During Welding: Part II. Theory. Metall. Trans. B 1991, 22, 73–81. [Google Scholar] [CrossRef]
  25. Mitra, U.; Eagar, T. Slag-metal Reactions during Welding: Part III. Verification of the Theory. Metall. Trans. B 1991, 22, 83–100. [Google Scholar] [CrossRef]
  26. Zhu, J.; Wang, Y.; Shi, H.; Huang, L.; Mao, Z. Element Loss Behavior and Compensation in Additive Manufacturing of Memory Alloys. Trans. China Weld. Inst. 2022 43, 50–55. [CrossRef]
  27. Zhang, D.; Shao, G.; Zhang, J.; Liu, Z. On the Moving of Neutral Point for Mn Subject to Submerged Arc Welding under Various Heat Inputs: Case Study into CaF2-SiO2-Na2O-MnO Agglomerated Fluxes. Processes 2022, 10, 1888. [Google Scholar] [CrossRef]
  28. Kou, S. Welding Metallurgy, 3rd ed.; JohnWiley & Sons, Inc.: Hoboken, NJ, USA, 2003; pp. 22–122. [Google Scholar]
  29. Dallam, C.; Liu, S.; Olson, D. Flux Composition Dependence of Microstructure and Toughness of Submerged Arc HSLA Weldments. Weld. J. 1985, 64, 140–151. [Google Scholar]
Figure 1. Reaction zones that control compositions in SAW: (a) overall schematic diagram of SAW, (b) droplet zone, (c) weld pool and solidification zones [13].
Processes 11 02285 g001
Figure 2. Detailed process flowchart of modeling.
Processes 11 02285 g002
Figure 3. The quantified elemental behavior of Si: (a) the transfer level evaluated in present study, (b) the transfer level evaluated by the equilibrium model.
Processes 11 02285 g003
Figure 4. The quantified elemental behavior of O: (a) the transfer level evaluated in present study, (b) the transfer level evaluated by the equilibrium model.
Processes 11 02285 g004
Figure 5. Equilibrium PO2 (star) as a function of O content in the metal: (a) droplet reaction zone, (b) weld pool zone.
Processes 11 02285 g005
Figure 6. Predicted ΔSi value via thermodynamic equilibrium model of the method proposed in this article.
Processes 11 02285 g006
Table 1. Flux compositions (wt pct) and WM labels [22].
WMFluxCaF2Na2OSiO2
WM-1F-188.771.2110.02
WM-2F-278.871.2419.89
WM-3F-368.671.2330.10
WM-4F-458.621.1940.19
WM-5F-548.841.2249.94
Table 2. Compositions of base metal and electrode (wt pct) [22].
CSiMnTiCrO
Base metal0.1120.1421.540.0150.0180.003
Electrode0.1270.0491.650.0150.0150.003
Table 3. O content in molten droplets and equilibrium O2 partial pressure.
WMPO2 (atm.)Droplet O Content (wt pct)
WM-15.03 × 10-060.295
WM-27.32 × 10-060.356
WM-31.13 × 10-050.443
WM-41.28 × 10-050.472
WM-51.36 × 10-050.487
Table 4. Metal compositions subject to the end points of droplet reactions (wt pct).
WMCSiMnTiCrOFe
WM-10.120.0550.8290.0150.0170.148Balanced
WM-20.120.0550.8290.0150.0170.178Balanced
WM-30.120.0590.8290.0150.0170.221Balanced
WM-40.120.0600.8290.0150.0170.236Balanced
WM-50.120.0630.8290.0150.0170.243Balanced
Table 5. Quantified data subject to Si and O transfer at various reaction zones.
WMΔDSiΔWSiΔDOΔWO
WM-1−0.0330.3750.147−0.099
WM-2−0.0340.5860.178−0.135
WM-3−0.0360.6520.221−0.182
WM-4−0.0370.9170.236−0.200
WM-5−0.0381.0520.243−0.209
Table 6. Quantified Δ values subject to total Si and O transfer in SAW [22].
WMΔESiΔTSiΔEOΔTO
WM-10.4440.3420.0120.048
WM-20.6180.5520.0150.043
WM-30.7210.6160.0180.039
WM-41.0930.8800.0210.036
WM-51.4291.0140.0240.034
Disclaimer/Publisher’s Note: The statements, opinions and data contained in all publications are solely those of the individual author(s) and contributor(s) and not of MDPI and/or the editor(s). MDPI and/or the editor(s) disclaim responsibility for any injury to people or property resulting from any ideas, methods, instructions or products referred to in the content.

