Article

Ammonia Decomposition over Alkali Metal (Li, K, Cs)-Promoted Bulk Mo2N Catalyst

by
Hisham S. Bamufleh
and
Sharif F. Zaman
*
Department of Chemical and Materials Engineering, Faculty of Engineering, King Abdulaziz University, P.O. Box 80204, Jeddah 21589, Saudi Arabia
*
Author to whom correspondence should be addressed.
Processes 2023, 11(8), 2287; https://doi.org/10.3390/pr11082287
Submission received: 2 June 2023 / Revised: 13 July 2023 / Accepted: 25 July 2023 / Published: 30 July 2023

Abstract

:
Ammonia (NH3), which has a 17.7 wt% gravimetric hydrogen density, has been considered as a potential hydrogen storage material. This study looked at the thermocatalytic decomposition of NH3 using a bulk Mo2N catalyst that was boosted by alkali metals (AM: 5 wt% Li, K, Cs). The K-Mo2N catalyst outperformed all other catalysts in this experiment in terms of catalytic performance. At 6000 h−1 GHSV, 100% conversion of NH3 was accomplished using the K-Mo2N, Cs-Mo2N, and Mo2N catalysts. However, when compared to other catalysts, K-Mo2N had the highest activity, or 80% NH3 conversion, at a lower temperature, or 550 °C. The catalytic activity exhibited the following trend for the rate of hydrogen production per unit surface area: K-Mo2N > Cs-Mo2N > Li-Mo2N > Mo2N. Up to 20 h of testing the K-Mo2N catalyst at 600 °C revealed no considerable deactivation.

1. Introduction

Ammonia decomposition is one of the most sought processes in recent times due to ammonia being an excellent hydrogen storage compound and hydrogen being a COX free alternative fuel, termed as next generation transportation fuel, and its versatility as an energy carrier is used as the primary fuel source for fuel cells. Hydrogen is industrially produced mainly from steam reforming of natural gas and also from biomass and coal gasification. These processes inevitably produce COX compounds which are harmful not only to the environment (the main cause of global warming) but also to hydrogen fuel cells, especially for CO poisoning of the platinum electrode [1]. Amidst these environmental issues, fuel cells have gained interest as a device for power generation without adding COX to the atmosphere and are more efficient in power generation compared to conventional gasoline engines [2].
Ammonia has the highest gravimetric H2 density of all carbonaceous compounds, at 17.75 wt% [3,4,5,6], and the highest energy density of all carbon-containing compounds, at 3000 Wh/kg [7]. Additionally, it possesses a liquid form with a very high volumetric H2 density of 121 kgH2/m3 [8]. At temperatures above 300 °C, NH3 can decompose catalytically [9]. According to thermodynamic analysis, 99% ammonia conversion is possible at 1 atm and 400 °C pressure and temperature, respectively [3,4].
According to currently published experimental and theoretical research, ruthenium is the most effective catalyst for ammonia decomposition, and its activity is increased when carbon materials, particularly carbon nanotubes (CNTs), are used as a support. This catalyst is capable of 100% NH3 conversion at 500 °C [3,7]. However, the limited availability of ruthenium and its high cost hinders its widespread use in industry and for commercialization of this process [10]. In the quest to meet this need, to develop and design a catalyst system with non-noble materials which are highly active at a lower temperature (<500 °C) for ammonia decomposition is essential. The high cost of noble metals for the catalytic decomposition of ammonia has opened research for alternative cheap metals for this endothermic reaction [11].
The effect of alkali and alkali earth metals on ammonia synthesis and decomposition material is well established [10,11,12,13,14]. The main promoting effect is due to surface modification of the catalyst both electronically and structurally, i.e., optimizing the catalyst basicity and good dispersion of active material sites and mainly elevating the role of hydrogen poising the active sites or enhancing the recombination of nitrogen atoms on the active site [13,15]. The electronegativities of alkali metals are correlated with their promoting activity for ammonia decomposition over Ru-based catalysts and reported as a more electronegative element has the less promoting effect, in the sequence of Cs  > K > Na > Li [13,16]. According to reports, lithium (Li) has little effect in promoting the NH3 decomposition reaction [17].
The utilization of metal nitrides, carbides, and alloys for the reaction has recently attracted attention [7]. Alkalis and transition metals work well as substitutes for catalysts based on the noble metals Pt, Ru, Rh, and Pd. Due to their similar reactivity to the Group VIII noble metals, the nitrides of the early transition metals have attracted a lot of interest as potential catalysts for several processes [18]. The ammonia decomposition process has received attention because of molybdenum nitride’s competitive activity with noble metals for several reactions [19,20,21]. With an activity comparable to that of platinum, it is regarded as the most active catalyst among the transition metal nitrides and carbides examined [22].
There are some reports in the literature for LiNH-promoted transition metals [23,24] and Cs-promoted Co3Mo3N catalysts [25] for the NH3 decomposition reaction, but until now there has been no report on the effect of alkali metals over bulk Mo2N-based catalysts for NH3 decomposition reaction. Here, in this paper, we are reporting the effect of K, Cs, and Li on Mo2N catalysts for the NH3 decomposition reaction supported with surface characterization (BET, XRD, XPS, HRTEM).

2. Materials and Methods

2.1. Catalyst Preparation

Without additional purification, ammonium heptamolybdate ((NH4)6Mo7O24·4H2O, Fluka, 99.9%), anhydrous citric acid (C6H8O7, 99%, Techno Pharmchem, Haryana, India), potassium nitrate (KNO3, Sigma Aldrich (St. Louis, MO, USA), >99%), cesium nitrate (CsNO3, Aldrich, >99%), and lithium nitrate (LiNO3, Fluka (Charlotte, NC, USA), >98%) were used to prepare the catalyst samples. Ammonium heptamolybdate and citric acid were employed in the required quantities for unpromoted Mo2N production [6].
For instance, the synthesis of a sample containing molybdenum nitride and 5 wt% alkali metal loading over Mo2N necessitates the use of 5.2 g of ammonium heptamolybdate, 5.7 g of citric acid (CA), and 1.49 g of LiNO3, 0.39 g of KNO3 and 0.22 g of CsNO3, respectively.
Briefly, 1.49 g of LiNO3 was dissolved in 100 cm3 of deionized water. The mixture was stirred for two hours at 50 °C. The water was then evaporated until a light-yellow gel was produced. This gel was then cooked for 24 h in a water bath at 90 °C before being held at 100 °C for 24 h. The resulting solid foam was ground into powder and heated to 550 °C under static air conditions for 4 h.
The ammonolysis reaction was conducted in a quartz-flow-microreactor-equipped PID Eng & Tech system (Madrid, Spain). A quartz reactor was charged with 1 g of the calcined sample for the nitridation procedure. Then, nitridation was carried out with a 400 cc/min pure ammonia flow while ramping the temperature up to 700 °C at a rate of 0.5 °C min−1. The catalyst was maintained at this temperature for two hours before being cooled to room temperature with a 30 cc/min He flow. The catalyst was prepared with helium that contained 1% oxygen for 2 h at room temperature before being exposed to air. As a result, the catalyst developed an oxygen passivation coating. Finally, the catalyst was put into a glass bottle and utilized for characterization investigations and catalytic activity experiments, unless otherwise noted. The catalysts that had been prepared were designated as Mo2N, K-Mo2N, Li-Mo2N, and Cs-Mo2N.

2.2. Catalyst Characterization

Using a Nova Station Quantachrome (Boynton Beach, FL, USA) instrument, the BET surface area and pore size distribution in the catalysts were examined. Before the measurements, each catalyst sample was degassed at 200 °C in a vacuum for two hours.
The catalyst samples’ X-ray diffractograms were produced using an EQUINOX 1000 Inel XRD equipment (Thermo Fisher Scientific, Waltham, MA, USA) with Co Kα = 1.7902 Å and parameters for the X-ray source generator of 40 kV and 30 mA with real-time acquisition across 2 of 110 degrees. The processing of powder pattern studies involved the use of the following software: MAUD program for Rietveld analysis, IMADINEL XRD software (v.7.0) for graphical representations, and Match Crystal Impact software (v.1.11e) for phase identification (using both COD and ICSD databases). The same conditions were used for every data collection.
All the catalyst samples were analyzed using a Tecnai G2 F20 Super Twin device (FEI, Hillsborough, OR, USA) at 200 kV with a LaB6 emitter. An energy-dispersive X-ray (EDX) detector with an S-UTW window and a high angle annular dark-field (HAADF) detector for STEM imaging were both fully installed on the microscope. With a probe size of 1 nm2, which produces a beam current of approximately 0.5 nA, all analytical work and scanning transmission electron microscopy (STEM) imaging were carried out. On an Eagle 2K HR 200 kV CCD camera (FEI, Hillsborough, OR, USA), the TEM pictures and selected-area diffraction (SAD) patterns were captured. The Tecnai G2 user interface was used to collect the HAADFSTEM EDX and CCD line traces, and Tecnai Imaging and Analysis (TIA) software (v.4.0) was used to process them.
The XPS study was performed using a high vacuum multi-technique surface analysis equipment from SPECS GmbH that is fitted with a Mg Kα 1253.6 eV X-ray source. The C 1s signal at 284.8 eV is used to adjust the reported binding energy values. As a binding energy reference for charge correction, the adventitious hydrocarbon C 1s line, which has a 284.8 eV energy value and corresponds to a C-C bond, was chosen.

2.3. Catalytic Activity Tests

In a PID Eng & Tech system (Madrid, Spain), tests on the catalytic activity were carried out using a fixed-bed quartz reactor with an exterior diameter of 6.0 mm. Catalyst 0.1 g was added to the reactor. The catalyst was activated before the reaction for 1 h at 500 °C with nitrogen flow. Following a 5 h reduction with hydrogen flow, a 1 h N2 flush was performed at the same temperature. Following catalyst activation, the temperature of the reactor was lowered to 300 °C, and pure ammonia gas was supplied at a GHSV of 6000 h−1. The temperature was then raised by 50 °C gradually after that. The reaction was carried out at each temperature up until a steady state regime was established. A relative percentage difference of less than 5% for two subsequent runs of effluent gas analysis served as evidence that the system was in a stable condition. Temperatures between 300 and 600 °C were used for the catalytic experiments. An online-connected gas chromatograph (GC-450 Varian, Palo Alto, CA, USA) outfitted with a thermal conductivity detector and a Porapak Q column (Sigma-Aldrich, Burlington, MA, USA) were used to analyze the effluent gases.

3. Results

3.1. Surface Characterization

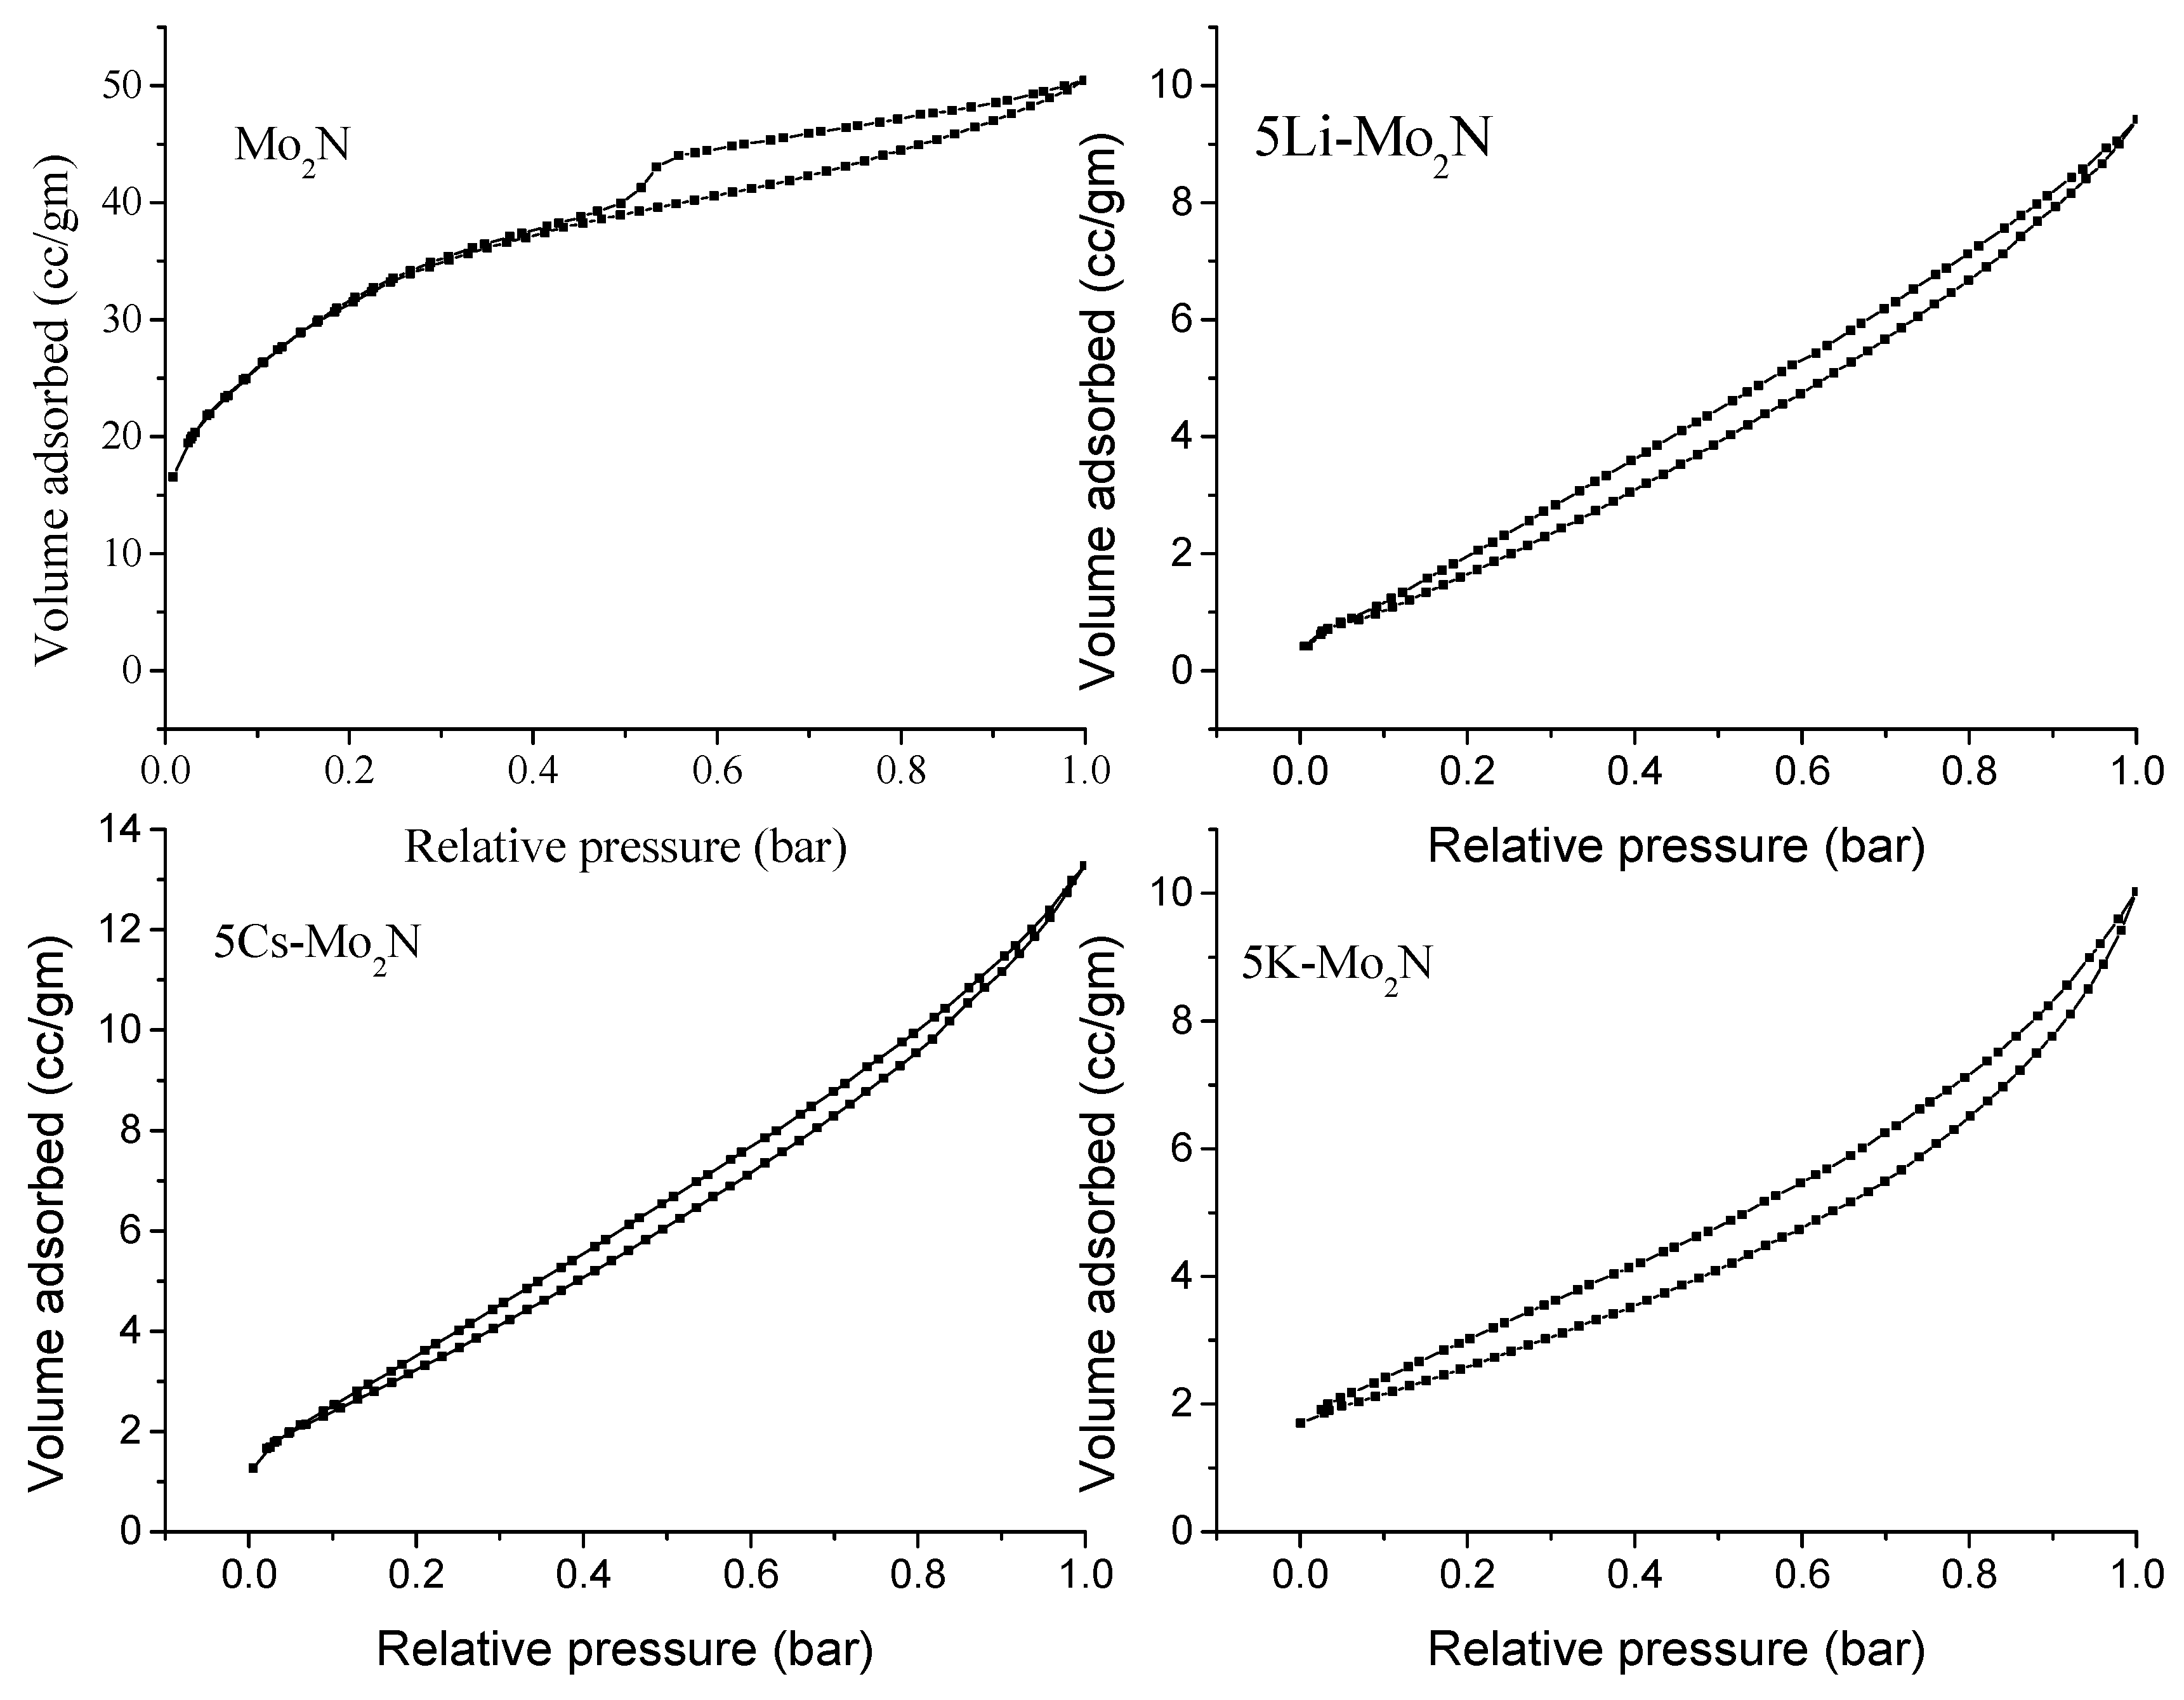
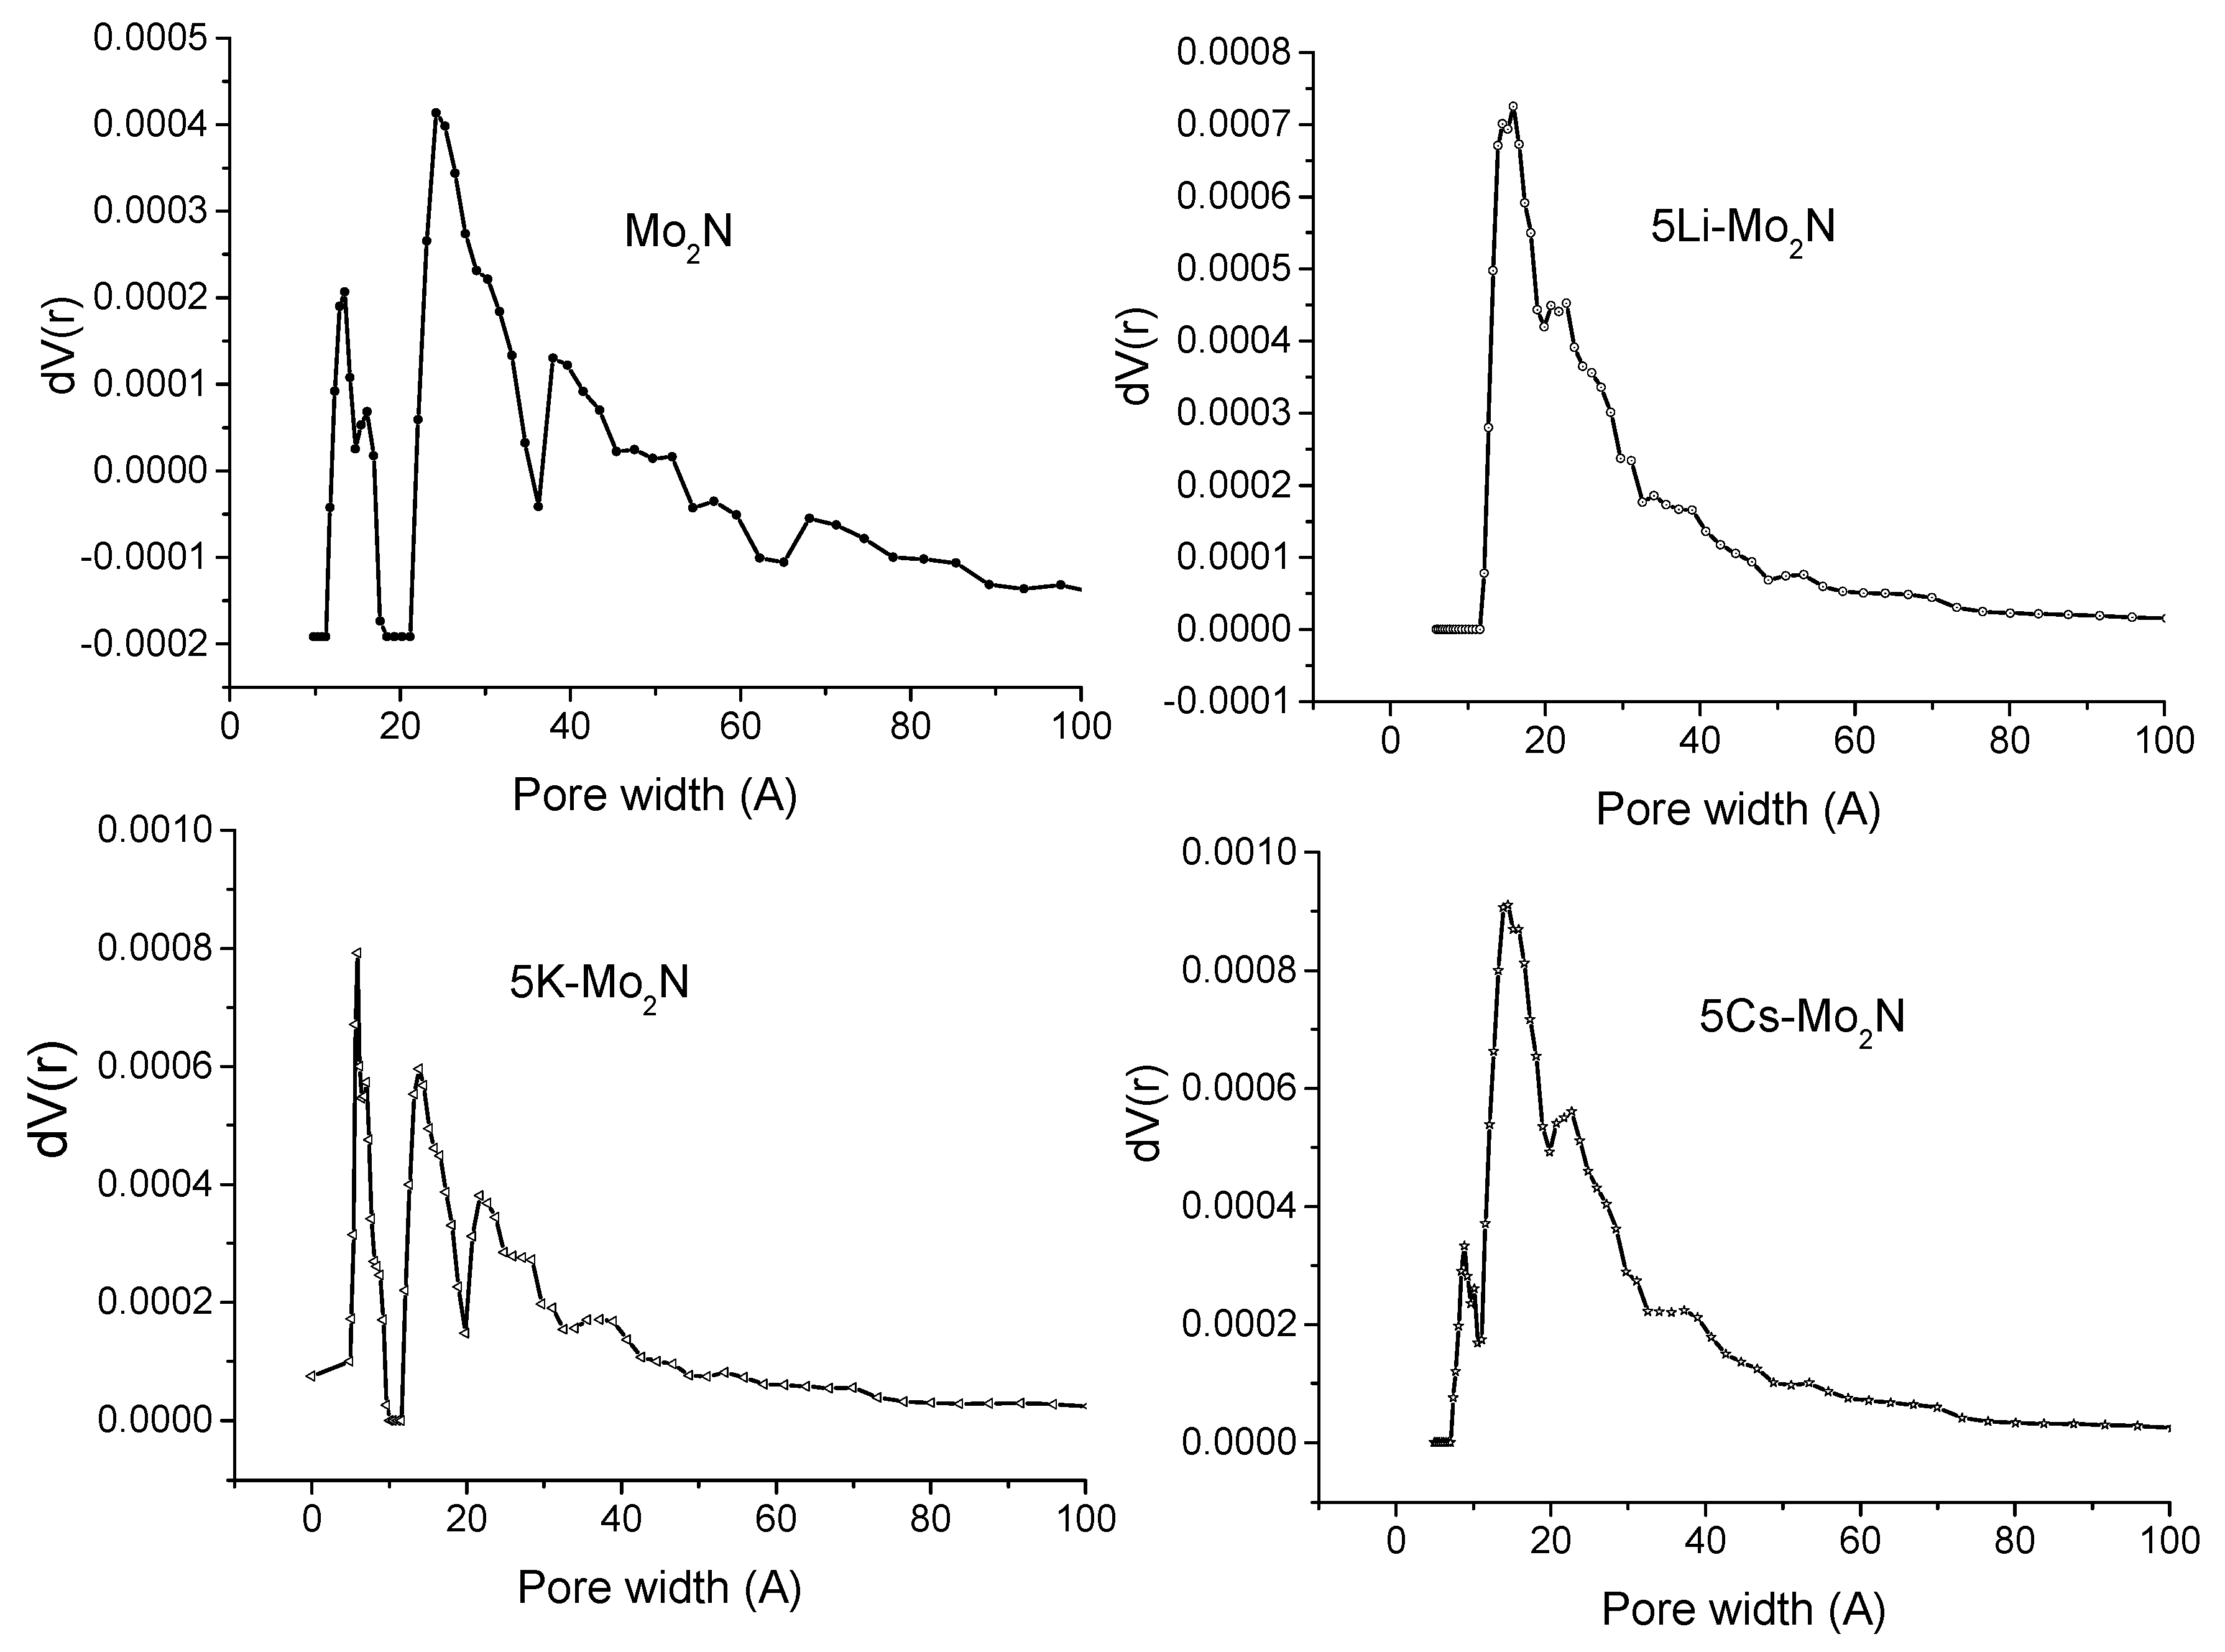
3.1.1. BET Surface Area and Pore Size Distribution

BET isotherms offer useful data on the produced catalysts’ surface area and pore size distribution. The nitrogen adsorption and desorption isotherms of catalyst samples are shown in Figure 1 at 77 K. All samples have tiny, slit-like pores, as evidenced by the type IV, H4 hysteresis of all isotherms. Molybdenum nitride made from a molybdenum trioxide precursor with plate-like particles was reported to exhibit H4 type hysteresis [26].
Figure 2 shows the alkali-metal-promoted Mo2N catalysts’ pore size distribution. Although the bulk Mo2N sample had tri-modal (micro-, meso-, and macropore range) distribution, all alkali-metal-promoted samples primarily displayed bimodal (microporous and mesoporous range) distribution. The estimated BET surface area is listed in decreasing order as follows: Mo2N (120 m2/g, 0.071 cc/g), Cs-Mo2N (13 m2/g, 0.018 cc/g), Li-Mo2N (10 m2/g, 0.013 g/cc), and K-Mo2N (8 m2/g, 0.013 cc/g) are the next three materials in the order. The decrease in surface area is brought on by the alkali metals’ large atomic size obstructing Mo2N’s micro/mesopores [27]. It is interesting to notice that shape of the pore size distribution curve for K-Mo2N kind a same for Mo2N bulk one and for Cs-Mo2N is partially retained, suggesting K and Cs are not blocking the pores (micropores) completely, whereas for Li-Mo2N, micropores are completely absent with rather a completely different pore size distribution. This may also influence the activity as later discussed in the H2 production per wt. of catalyst section.

3.1.2. XRD

Figure 3 displays the X-ray diffraction patterns of passivated-Mo2N and alkali-metal-promoted Mo2N samples. The (111), (200), (220), (311), and (222) planes of the cubic γ-Mo2N crystallographic phase are each associated with X-ray reflections at 2 = 43.7, 50.8, 75.0, 90.8, and 96.0°, respectively, in the bulk Mo2N XRD diffraction pattern [PDF 025-1366]. The bulk Mo2N sample additionally exhibits X-ray diffraction for monoclinic plane MoO2 at 2 = 30.0, 62.5, 71.5, and 79.0° with corresponding planes (−111), (211), (310), and (−402) in addition to the cubic Mo2N phase [PDF 078-1070]. This phase was formed due to passivation of the catalyst with 1% oxygen prior to exposing it to air to form a protective layer (similar to the all the nitride based catalysts studied herein). For 5K-Mo2N, the same X-ray patterns were seen. At 2 = 43.7, 50.8, 75.0, 90.8, and 96.0°, cubic -Mo2N phase XRD reflections were seen to be typical. For 5K-Mo2N, however, the generation of MoO2 was dramatically reduced. This might be caused by the surface being covered by K, having large Mo2N crystals (supported by BET’s low surface area), and developing KMoO4 species on the surface (later on confirmed by TEM study).
On the other hand, Cs promotion mostly yields γ-Mo2N along with a minor portion of δ-MoN (00-025-1367) and tetragonal Mo2N (00-025-1368) crystallographic phases. The formation of tetragonal Mo2N suggests the distortion of the cubic γ-Mo2N phase by Cs addition. Furthermore, the Cs promoted sample shows a small proportion of poly crystalline Cs-Mo-O phases [PDF 00-053-0032]. Overall, Cs addition to Mo2N slightly shifts the main X-ray reflections to higher 2θ values (30.2, 62.7, 71.7 and 79.2°), which suggests the presence of Mo2N and MoN mixture phase Mo3N2. Li2MoO4 [PDF 00-012-0763] crystals with the δ-MoN phase are primarily produced when lithium is added to Mo2N. Alkali metal-Mo-O polycrystalline phases are responsible for the unindexed reflections for 5Li (2 = 30.0, 33.7, 35.0, 66.8, 68.2, and 70°) and 5Cs-Mo2N (2 = 22.0, 25.5, and 47.8°). For all three samples, there are no crystalline phases associated with Li, K, or Cs oxides. This could be brought on by dispersed or small (4 nm) crystallites below the X-ray powder diffraction technique’s detection limit, or it could be concealed by large crystals like Li2MoO4 and/or Mo2N. Thus, XRD results clearly demonstrate the influence of alkali metal on nitride phase formation by generating different crystallographic phases. The XRD profile confirms the formation of nitride species (Mo-N phase) clearly for all the cases. Mainly, γ-Mo2N was observed for bulk K- and Cs-promoted catalyst, and the δ-MoN phase was identified for Li-promoted catalysts. The low intensity of the δ-MoN phase may be due to the large Li2MoO4 peak compared to the MoN phase.

3.1.3. XPS Analysis of the Sample

Figure 4 displays the narrow distribution of the XPS surface analysis peaks. Deconvoluted Mo 3d peaks for all the data reveal the transition pairs 3d5/2 and 3d3/2. Deconvoluted binding energies (bulk Mo2N) show a peak at 228.4, 231.6, 229.2, 232.3, 230.2, 233.7, 232.5, and 235.4 eV. Mo2+, Mo4+ at 229.2 eV and 232.2 eV, Mo5+ at 230.0 eV and 233.5 eV, and Mo6+ at 233.2 and 235.5 eV species were all attributable to the Mo 3d signal at 228.6 eV [6,28].
The identical deconvoluted Mo 3d band for alkali-metal-promoted Mo2N catalysts indicates that all of the catalysts have a comparable molybdenum oxidation state. In contrast to unpromoted Mo2N, the surface Mo species compositions for 5Li, 5K, and 5Cs-Mo2N were different, and the Mo 3d signals changed to lower binding energies. Shifts for the Mo+2 state, for instance, are 0.2 eV lower for 5 wt% K Mo2N and 0.8 eV lower for 5 wt% Cs Mo2N (may be attributed to Mo-N phase). The drop in binding energy may be attributed to K and Cs species’ propensity to donate electrons to the Mo-N phase. In contrast, the binding energy changes 0.2 eV up for 5 wt%-Li-Mo2N, indicating that the surface is dominated by an oxidic phase (XRD identified phase Li2MoO4).
As opposed to bulk Mo2N catalyst, the Mo 3d signal pattern was completely altered for alkali-metal-promoted Mo2N. Interestingly, for all alkali-metal-promoted catalysts, the oxidation state of Mo+6 (232.2 and 235.5 eV) increased, indicating that the catalytic surface is more saturated with MoO3 species (samples are exposed to air), which might also be explained by the alkali metals’ propensity to pull oxygen, which would oxidize the sample’s surface Mo as observed by XPS.
Li 1s showed a symmetric peak in the alkali metal’s orbitals XPS study with a binding energy of 54.6 eV, which was attributed to Lio metal [29] and may have come from the Li2O or Li2MoO4 phase. The binding energies of the K2p3/2 and K2p1/2 spin–orbit split doublets on the surface of 5 wt%K-Mo2N are 292.8 eV and 295.5 eV, respectively, with a split difference of 2.7 eV. [30,31]. The typical peak for K2p3/2 occurs at 293.1, and the BE shifts (−0.3 eV) to a lower value, which may be due to the emergence of K-N-O surface species or the introduction of nitrogen into the environment, as seen by the BE for potassium nitrates at 292.9 eV [32]. Later, a TEM examination confirmed the oxidized states of potassium as K2O and K2MoO4 species on the surface. Two XPS transitions for 3d5/2 at 723.5 eV and 3d3/2 at 737.6 eV were seen in the Cs 3d orbital. Cs 3d signal appearance at 725.5 and 739.2 eV is a sign that a Cs overlayer is forming [33]. The production of Ce+ ions or Cs-N species on the surface may be responsible for the shift in binding energy of 2 eV [34,35]. The plasma loss first showed around 728 eV, which may be related to the energy loss resulting from the photoelectron’s contact with other electrons. However, a new shoulder for Cs 3d5/2 developed around 726 eV, which is most likely caused by the presence of Cs2O species on the surface.

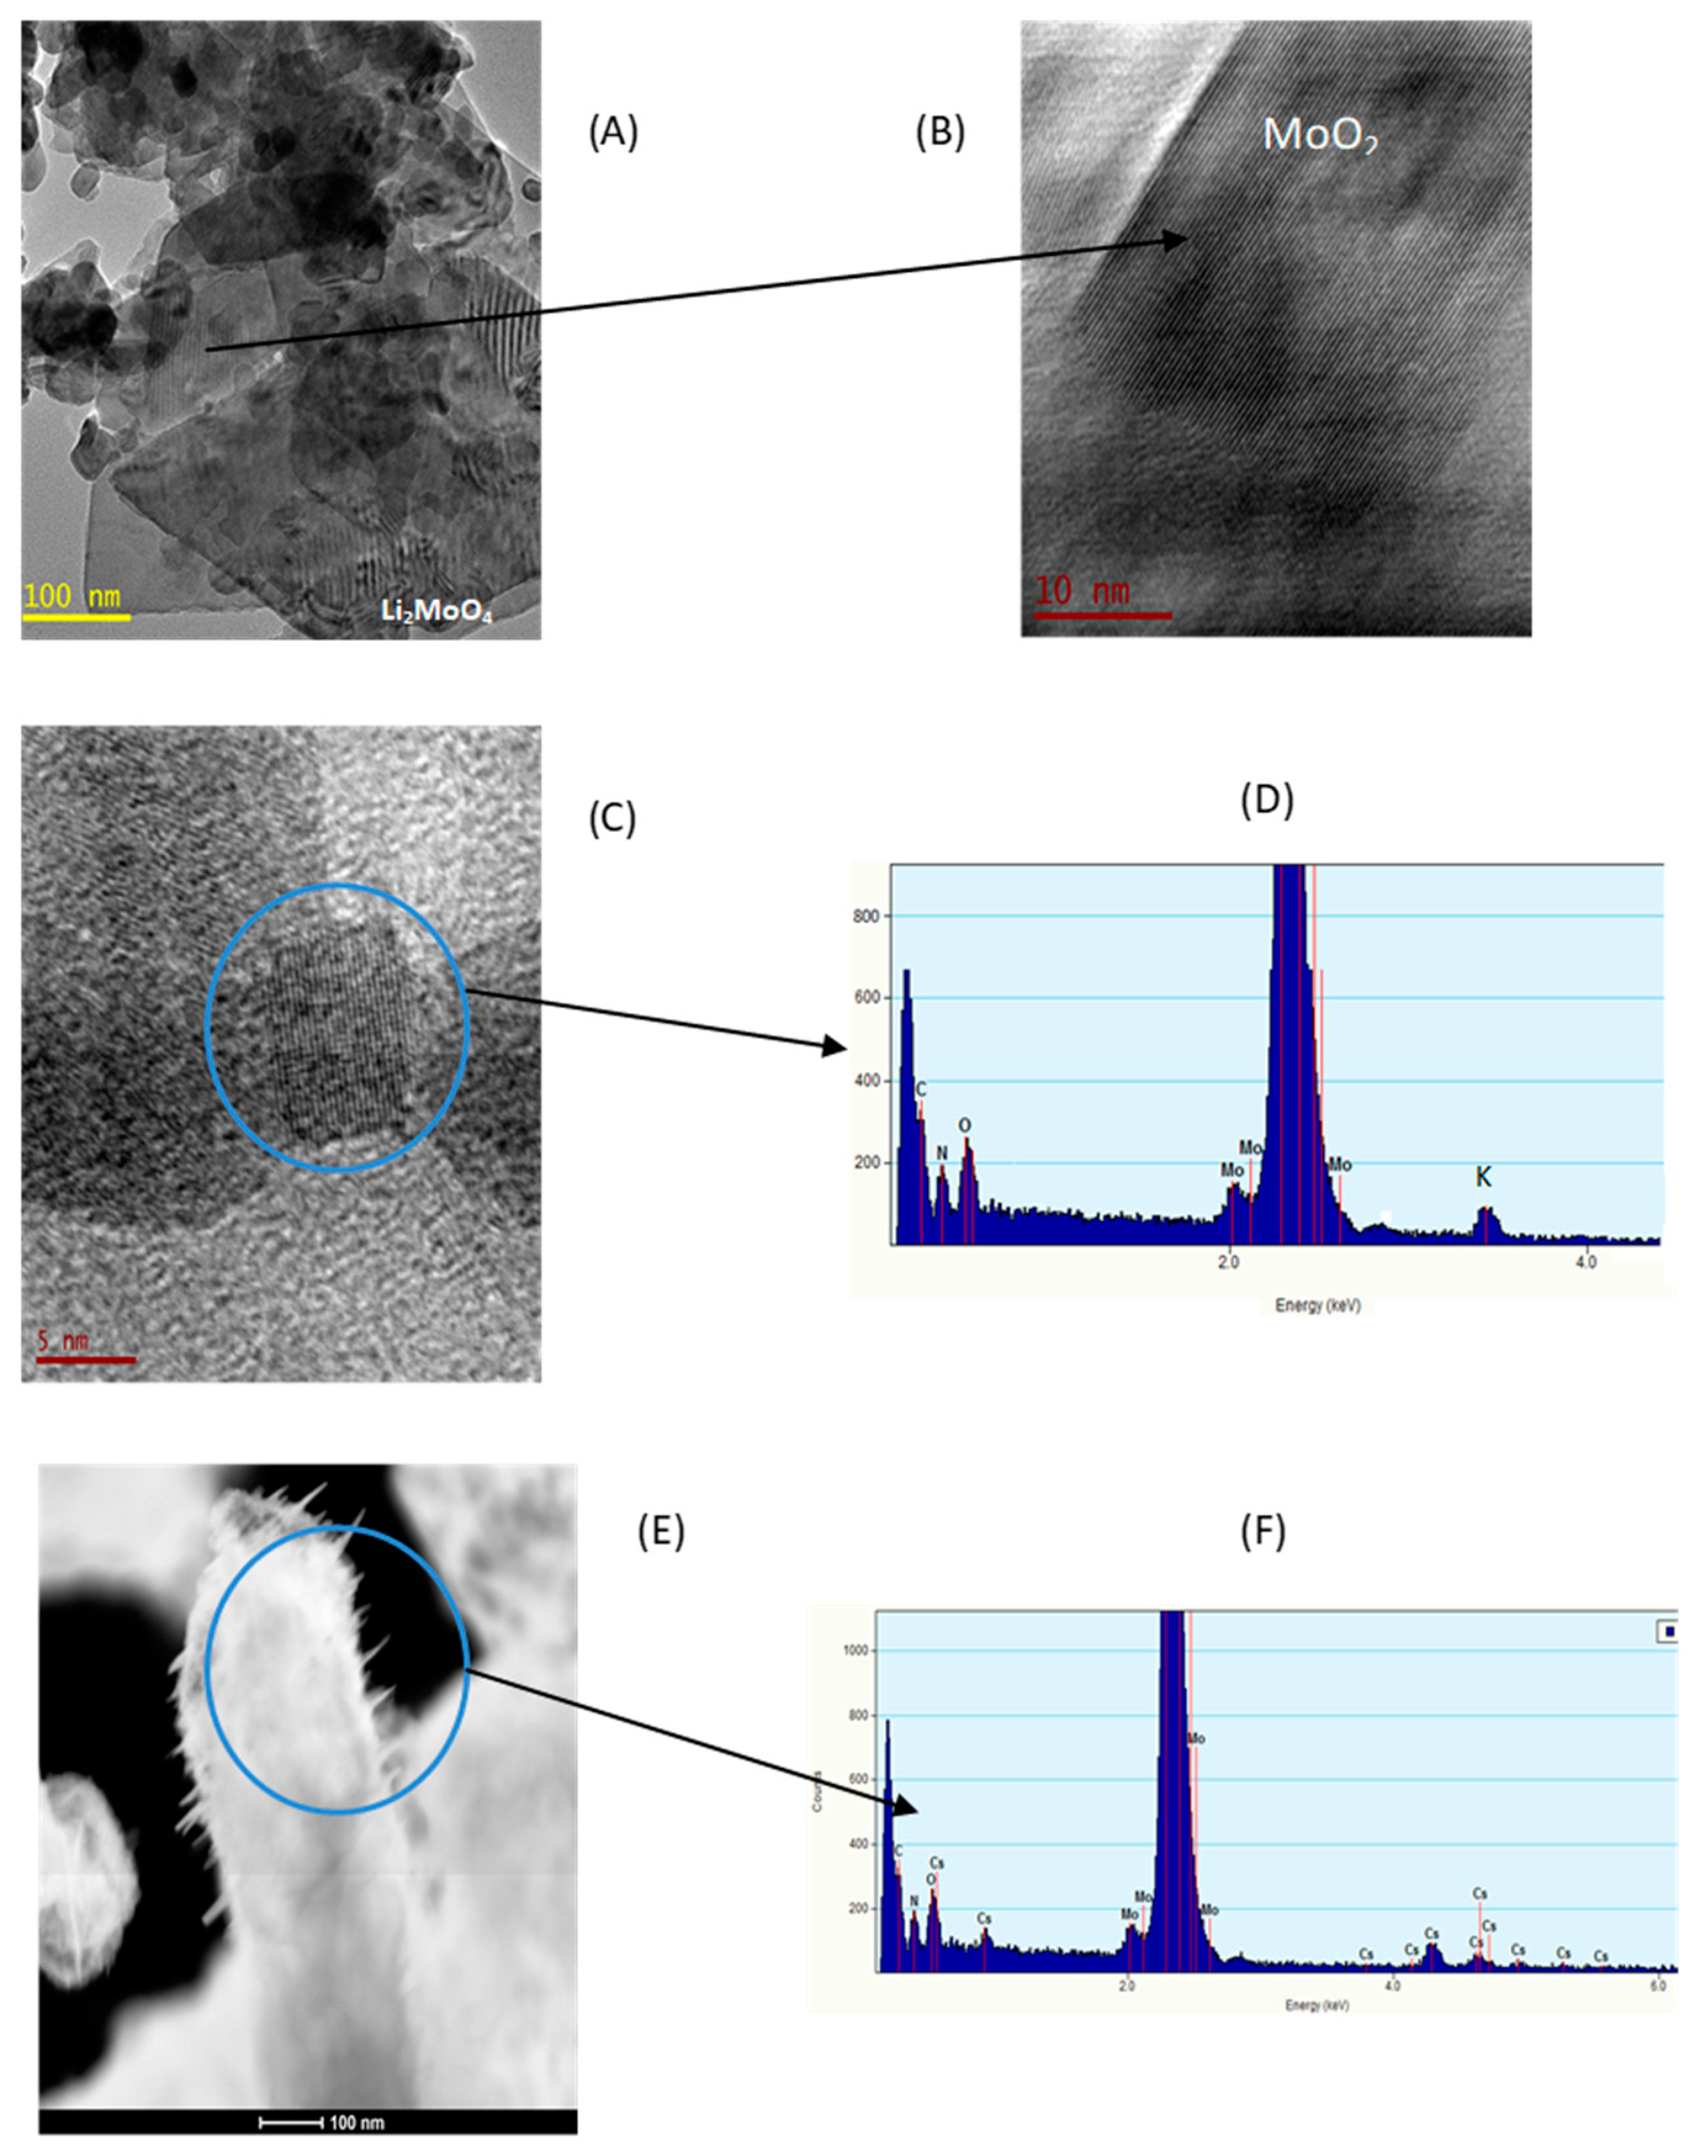
3.1.4. HRTEM and EDS Analysis

HRTEM images and analysis for the Mo2N bulk catalyst are reported elsewhere by us [6]. Figure 5 shows the results of the TEM and HR-TEM investigation of the passivated alkali-metal-promoted Mo2N samples. In Figure 5, the high resolution pictures of 5 wt% Li-Mo2N showed enormous slabs of Li2MoO4 particles that appeared to be zebra lines, big-sized MoO2 plates, and small (20–50 nm)-sized molybdenum nitride (Mo-N) platelets (a). The (211) plane of Li2MoO4 is consistent with the average distance between microcrystalline channels of zebra lines, which was found to be 4.20 Å, in Figure 5A, on average. These particles were primarily discovered in the grid of 5Li-Mo2N and Mo-N particles in the TEM sample. A high resolution transmission image of MoO2 with a matching d value of 3.41 is also shown in Figure 5B, which is consistent with the (−111) plane. Clear evidence of the presence of potassium in the matrix of Mo2N is observed by the high resolution image of Figure 5C. The focused beam EDS analysis (Figure 5D) of the corresponding area (circled area in Figure 5C) exhibits elements K, Mo and N. The results suggest the possible formation of K-Mo-N species by the chemical interaction of molybdenum nitride with K species. On the other hand, in Figure 5E, Cs-Mo-N displayed spike morphology and stems similar to those of the cactus type. According to the focused-beam EDS analysis (Figure 5F), the stem and spikes are primarily composed of Mo and N elements.

3.2. Results and Discussion

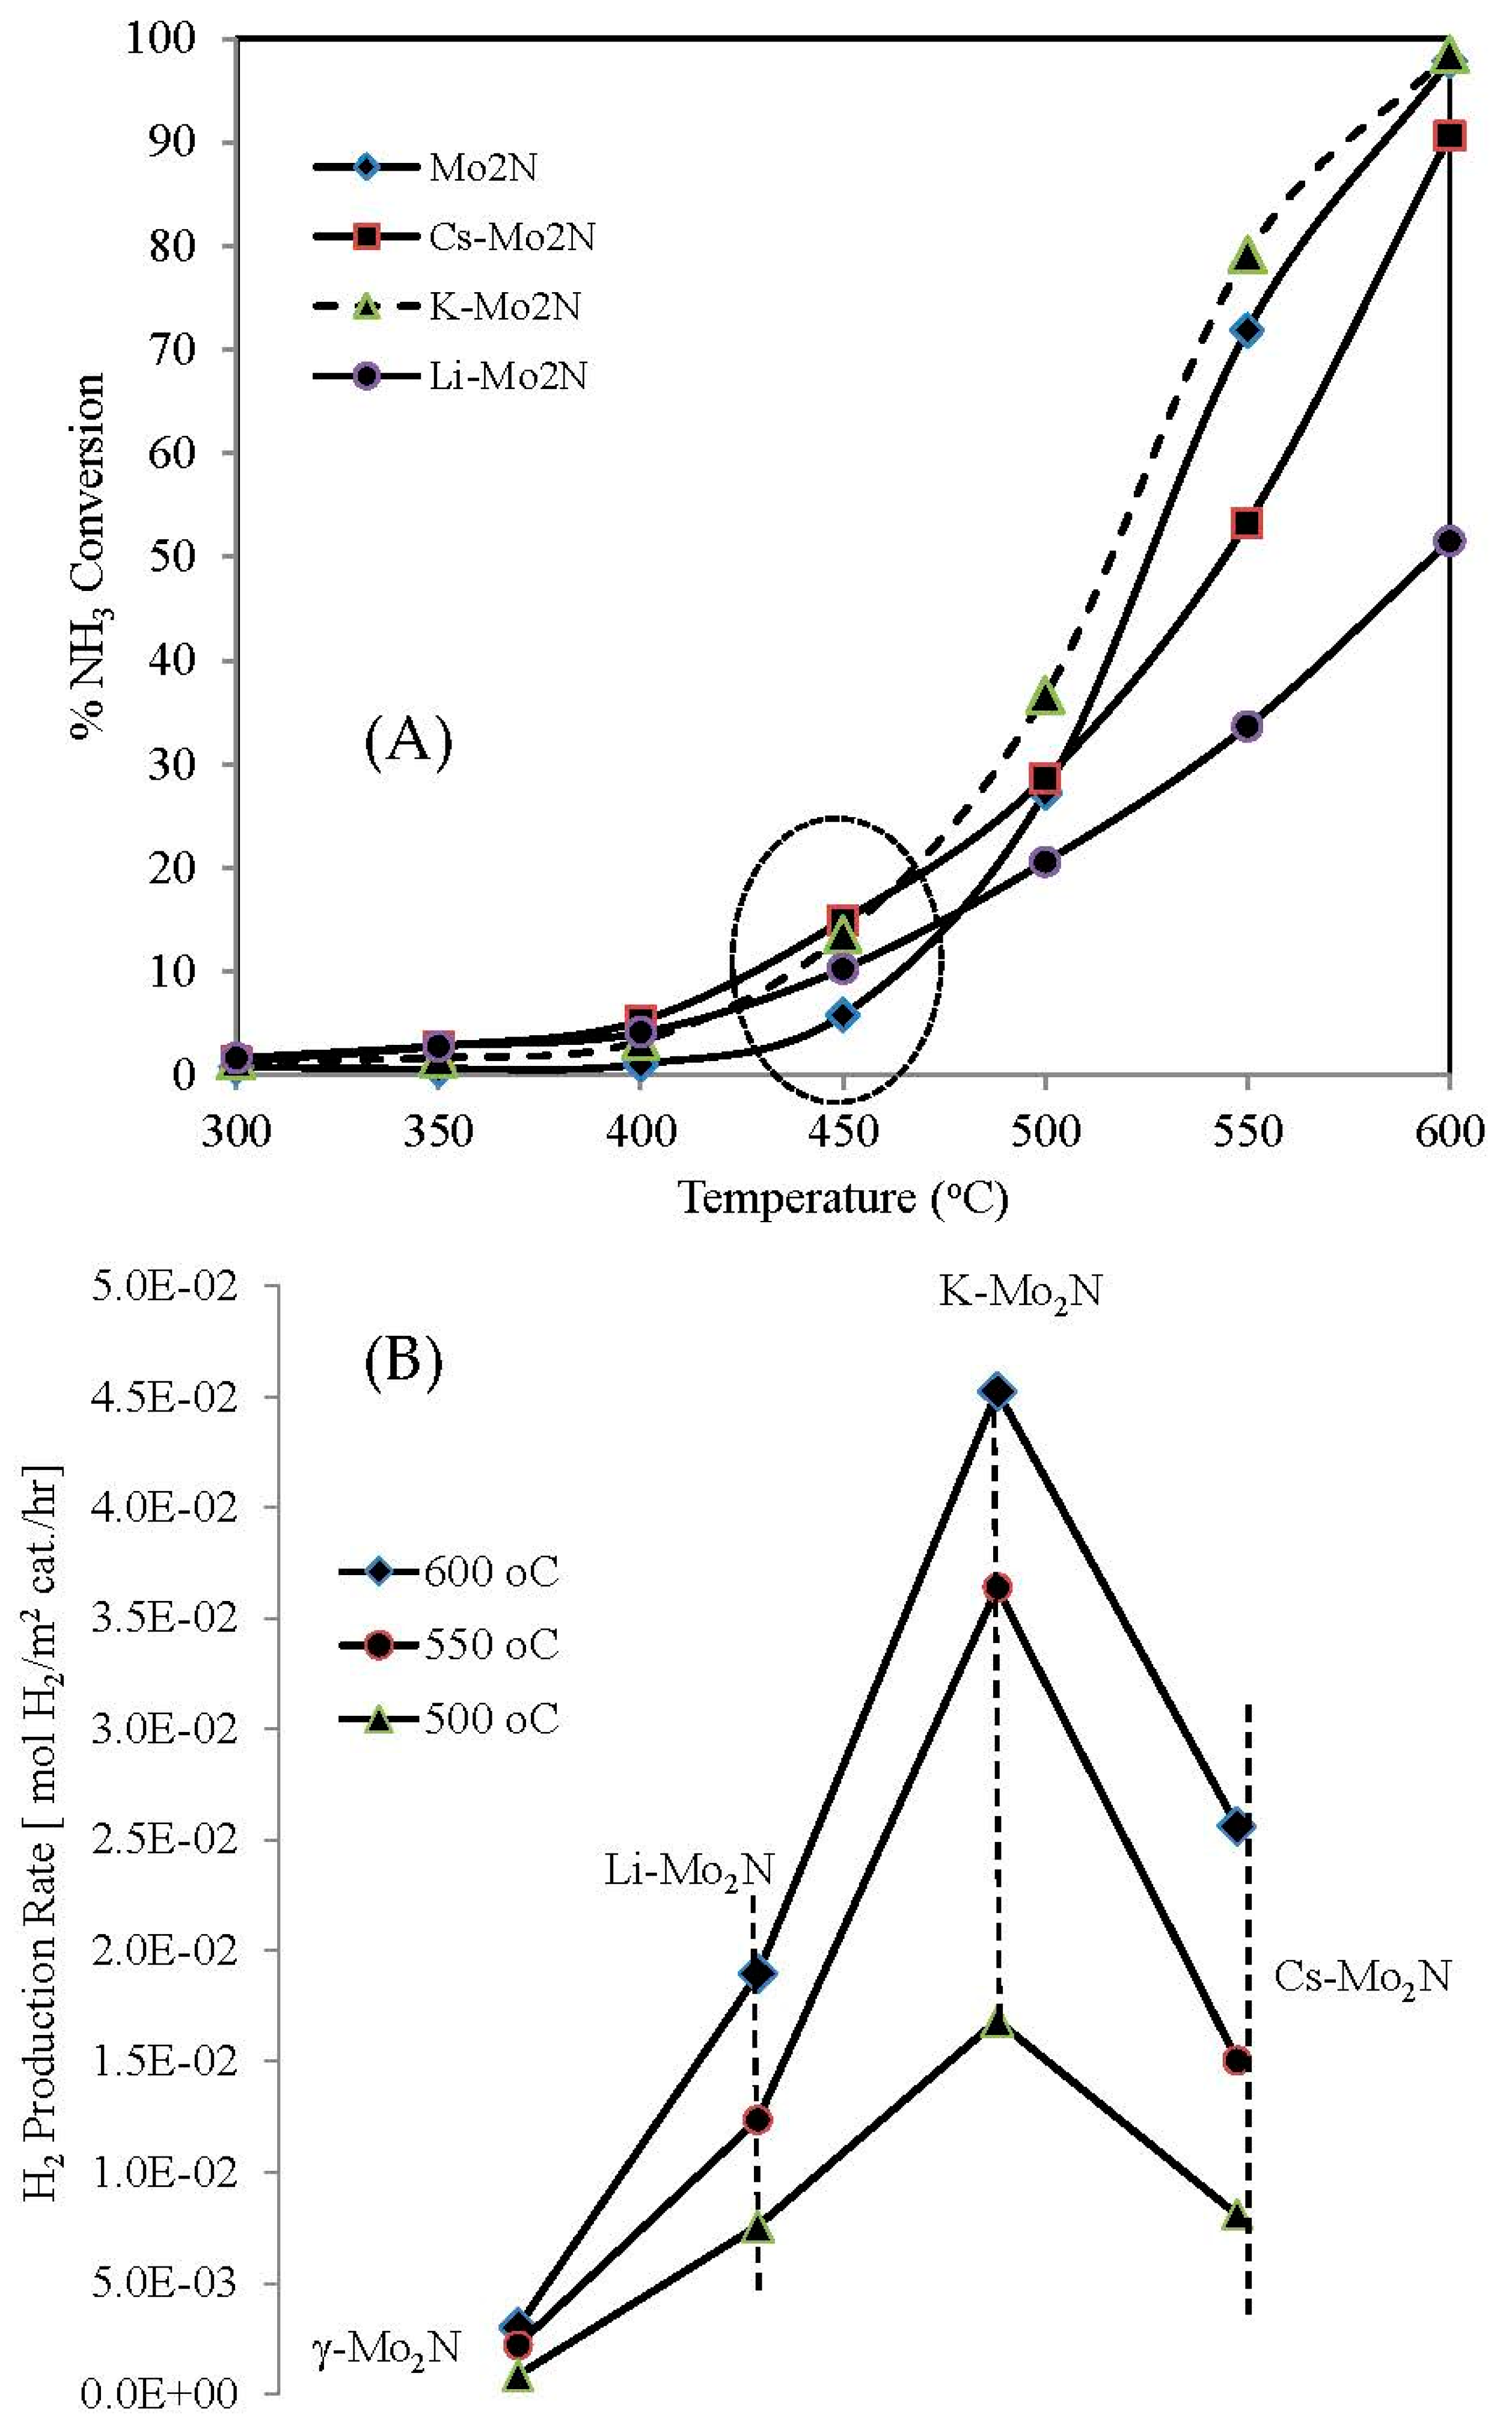
3.2.1. Activity Results

Figure 6 shows the catalytic activity for NH3 decomposition over bulk Mo2N and Cs-, K-, and Li-promoted Mo2N catalysts at various temperature ranges between 300 and 600 °C. As an endothermic reaction, ammonia decomposition increased in activity with temperature as expected, resulting in greater and more rapid conversion at temperatures exceeding 450 °C. The K-Mo2N catalyst demonstrated the maximum NH3 conversion of all the investigated catalysts. At 600 °C, the NH3 conversion rate for bulk Mo2N and K-Mo2N catalysts was virtually 100%, compared to 90% for Cs-Mo2N and 51.5% for Li-Mo2N.
The order of the catalytic activity is K-Mo2N > Mo2N > Cs-Mo2N > Li-Mo2N. It is interesting to note that the activity of the catalysts varied at lower temperatures; for example, at temperatures ≤450 °C, the catalytic activity followed the order Cs-Mo2N > K-Mo2N > Li-Mo2N > Mo2N despite having a relatively low conversion rate (XNH3 = 15%), implying a better promoting effect of Cs (marginally higher than K promoted one) at lower temperature compared to the others. Above this point, bulk Mo2N began to exhibit better activity, while K-Mo2N showed the best activity.
The promoting effect of K for NH3 decomposition is already well established for Ru-based catalysts. Wang et al. [13] have investigated the effect of alkali and alkali earth metals for Ru/CNT-based catalysts and found that potassium (K) is the best promoter for the system and optimum K loading is the atomic ratio of Ru/K = 1.5. Similarly, Yin et al. [36] also reported good stability of a Ru-K/CNT system for ammonia decomposition, where they suggested incorporation of KOH decreases the nitrogen desorption temperature and hence increases the dissociation rate. Hill and Murciano [14] recently reported that Ru on highly conductive supports (graphitized CNT’s) can be enhanced by the electronic promoter Cs. They basically concentrated on the electronic nature of the support which enhances the nitrogen recombination by electron donation to Ru, and, also, a synergetic effect between support and Cs promoter was drawn, showing up to some level Cs/Ru atomic ration 0.6, the catalysts is very active at lower temperature, i.e., more than 90% NH3 conversion at 427 °C. The effect of K as a promoter is also investigated for other non-noble catalysts, like Fe fused with Al2O3, Ca, and K [15], where K promoting increases the rate of ammonia decomposition five times compared to the non-promoted one. Co2O3-based catalysts promoted with K, Ca, and Al2O3 showed enhanced catalytic activity, such as 100% NH3 decomposition at 525 °C at 19,544 h−1 space velocity [37]. Okura K. et al. [38] reported the effect of alkali earth metals, i.e., Ca, Mg, Ba, and Sr over Ni/Y2O3 catalysts and report that the alkali earth metal modified the surface basicity and enhanced the ammonia decomposition activity, and Ba and Sr are better promoters for ammonia decomposition. Unfortunately, there has been no study reported for the alkali-metal-promoting effect for MoN2 catalysts until now.
We also noticed that K has a better promoting effect than Cs and Li in our case. Less activity for Li-promoted catalysts may be caused by the production of an excessive amount of LiMoO4 surface species (HRTEM + XRD), which prevents further reduction of the Mo phase. According to the HRTEM data, K and Cs are present as K2O and Cs2O on the surface, respectively, and they function as a better promoter than Li.
For an alkali-promoted catalyst, the surface area was significantly decreased throughout the synthesis process. Rates of NH3 breakdown or H2 production per unit surface area provide a better way to compare alkali metals’ effects on activity. The rate of production of H2 per unit surface area at 550 °C with 80%, 74%, 55%, and 30% NH3 conversion over K-Mo2N, Mo2N, Cs-Mo2N, and Li-Mo2N catalysts gives the respective values of 3.64 × 10⁻², 2.20 × 10⁻³, 1.51 × 10⁻², and 1.24 × 10⁻² mol H2 per m2 cat./hr. According to the rate of H2 production, the catalysts’ activity is in the following order: K-Mo2N > Cs-Mo2N > Li-Mo2N > Mo2N. When the comparison (550 °C) was made for H2 production per wt. of catalyst, as shown in Figure 7, K-Mo2N showed the best activity compared to the others, and Li had the least promoting effect, following the trend K-Mo2N > Mo2N > Cs-Mo2N > Li-Mo2N. Interestingly, at 600 °C, Mo2N and K-Mo2N showed almost the same H2 production rate.
Better promoting effect of K and Cs can be assigned to not affecting pore volume structure (Figure 2) and the structure of Mo2N seen in XRD (Figure 3), whereas Li interacts with Mo forming Li2MoO4, making less Mo2N, the active phase, available for this decomposition reaction. Furthermore, the mild basicity imposed by K over Mo2N aids in more effectively breaking down of NH3, i.e., aids the combination and evolution of H2 from the surface, allowing more active phase available to proceed the reaction faster. The results suggest further investigation for optimizing the K-loading surface basicity on the surface.

3.2.2. Long-Run Results

Long-run experiments were performed to see the stability of the catalysts, K-Mo2N. Long run tests were performed under two different conditions, 6000 hr−1 and 12,000 hr−1 GHSV, and mainly two different temperatures, 550 °C and 600 °C, as shown in Figure 8a,b. No considerable deactivation was observed during the time of investigation (up to 20 h), signifying the stability of the catalysts at the reaction conditions. Interestingly, K-Mo2N is highly active at higher space velocity, which is not that much of a change of conversion with space velocity compared to Mo2N [6], achieving 95% NH3 conversion at 600 °C at 12,000 h−1 GHSV, having a H2 production rate of 8.71 × 10⁻² mol H2/m2 cat./h.

4. Conclusions

For the ammonia decomposition reaction, the influence of alkali-metal (5 wt% of Li, K, and Cs) promotion over bulk Mo2N catalyst has been studied. Due to pore blockage with the alkali metals, a sharp decrease in surface area was seen for the promoted catalysts compared to bulk Mo2N. Out of all the catalysts tested, K promotion was the most successful. At 6000 h−1 GHSV, 100% conversion of NH3 was accomplished using the K-Mo2N and Mo2N catalysts at 600 °C. The pronounced promotion effect of K was observed at a lower temperature between 450 and 550 °C, i.e., at 550 °C, 80% NH3 decomposition was observed over K-Mo2N. The catalytic activity exhibited the following trend for the rate of hydrogen production per unit surface area: K-Mo2N > Cs-Mo2N > Li-Mo2N > Mo2N. For K-Mo2N catalysts tested up to 20 h at 6000 h−1 and 12,000 h−1 GHSV, no discernible deactivation was found. The pronounced activity of the bulk K-Mo2N catalyst for NH3 decomposition encouraged us to investigate the catalyst further for this reaction.

Author Contributions

H.S.B.: fund collection, research methodology, manuscript preparation. S.F.Z.: fund collection, experimentation, data analysis, manuscript preparation. All authors have read and agreed to the published version of the manuscript.

Funding

This research was funded by King Abdulaziz University, Jeddah, Saudi Arabia, grant number G-217-135-38, and the APC was funded by S.F.Z.

Acknowledgments

This project was funded by the Deanship of Scientific Research (DSR) at King Abdulaziz University, Jeddah, under grant no. G-217-135-38. The authors, therefore, acknowledge with thanks DSR for technical and financial support.

Conflicts of Interest

The authors declare no conflict of interest.

References

  1. Lendzion-Bielun, Z.; Narkiewicz, U.; Arabczyk, W. Cobalt-based Catalysts for Ammonia Decomposition. Materials 2013, 6, 2400–2409. [Google Scholar] [CrossRef] [PubMed] [Green Version]
  2. Muroyama, H.; Saburi, C.; Matsui, T.; Eguchi, K. Ammonia decomposition over Ni/La2O3 catalyst for on-site generation of hydrogen. Appl. Catal. A Gen. 2012, 443–444, 119–124. [Google Scholar] [CrossRef]
  3. Bell, T.E.; Torrent-Murciano, L. H2 production via ammonia decomposition using non-Noble metal catalysts: A review. Top. Catal. 2016, 59, 1438–1457. [Google Scholar] [CrossRef] [Green Version]
  4. Opeyemi, A.O.; Zaman, S.F. Ammonia decomposition for hydrogen production: A thermodynamic study. Chem. Pap. 2021, 75, 57–65. [Google Scholar]
  5. Lateef, J.; Zaman, S.F. Catalytic Ammonia Decomposition for Hydrogen Production: Utilization of ammonia in a fuel cell. In Sustainable Ammonia Production; Inamuddin, Boddula, R., Asiri, A., Eds.; Springer: Berlin/Heidelberg, Germany, 2019; pp. 81–105. [Google Scholar]
  6. Podila, S.; Zaman, S.F.; Driss, H.; Alhamed, Y.; Al-Zahrani, A.A.; Petrov, L.A. Hydrogen production by ammonia decomposi-tion using high surface area Mo2N and Co3Mo3N catalysts. Catal. Sci. Technol. 2016, 6, 1496–1506. [Google Scholar] [CrossRef]
  7. Yin, S.F.; Xu, B.Q.; Zhou, X.P.; Au, C.T. A mini review on ammonia decomposition catalysts for on-site generation of hydro-gen for fuel cell applications. Appl. Catal. A 2004, 277, 1–9. [Google Scholar] [CrossRef]
  8. William, I.F.D.; Joshua, W.M.; Samantha, K.C.; Hazel, M.A.H.; James, D.T.; Thomas, J.W.; Martin, O.J. Hydrogen production from ammonia using sodium amide. J. Am. Chem. Soc. 2014, 136, 13082–13085. [Google Scholar]
  9. Klerke, A.; Christensen, C.H.; Nørskov, J.K.; Vegge, T. Ammonia for hydrogen storage: Challenges and opportunities. J. Mater. Chem. 2008, 18, 2304–2310. [Google Scholar] [CrossRef]
  10. Zhang, J.; Xu, H.; Ge, Q.; Li, W. Highly efficient Ru/MgO catalysts for NH3 decomposition: Synthesis, characterization and promoter effect. Catal. Commun. 2006, 7, 148–152. [Google Scholar] [CrossRef]
  11. Weidenthaler, C.; Tseng, H.C. In situ diffraction studies during transition metal catalysis. In Proceedings of the 30th European Crystallographic Meeting, Congress Center, Basel, Switzerland, 28 August–1 September 2016. [Google Scholar]
  12. Liu, H. Ammonia Synthesis Catalysts: Innovation and Practice; World Scientific Publishing Co. Pvt. Ltd.: Singapore, 2013; pp. 1–896. [Google Scholar]
  13. Wang, S.; Yin, S.; Li, L.; Xu, B.; Ng, C.; Au, C. Investigation on modification of Ru/CNTs catalyst for the generation of COx-free hydrogen from ammonia. Appl. Catal. B: Environ. 2004, 52, 287–299. [Google Scholar] [CrossRef]
  14. Hill, A.K.; Torrente-Murciano, L. Low temperature H2 production from ammonia using ruthenium-based catalysts: Synergetic effect of promoter and support. Appl. Catal. B: Environ. 2015, 172–173, 129–135. [Google Scholar] [CrossRef] [Green Version]
  15. Kowalczyk, Z.; Sentek, J.; Jodzis, S.; Muhler, M.; Hinrichsen, O. Effect of Potassium on the Kinetics of Ammonia Synthesis and Decomposition over Fused Iron Catalyst at Atmospheric Pressure. J. Catal. 1997, 169, 407–414. [Google Scholar] [CrossRef]
  16. Aika, K.; Takano, T.; Murata, S. Preparation and characterization of chlorine-free ruthenium catalysts and the promoter effect in ammonia synthesis: 3. A magnesia-supported ruthenium catalyst. J. Catal. 1992, 136, 126–140. [Google Scholar] [CrossRef]
  17. Chang, F.; Guo, J.; Wu, G.; Wang, P.; Yu, P.; Chen, P. Influence of alkali metal amides on the catalytic activity of manganese nitride for ammonia decomposition. Catal. Today 2017, 286, 141–146. [Google Scholar] [CrossRef]
  18. Patterson, P.M.; Das, T.K.; Davis, B.H. Carbon monoxide hydrogenation over molybdenum and tungsten carbides. Appl. Catal. A: Gen. 2003, 251, 449–455. [Google Scholar] [CrossRef]
  19. Xiang, Y.; Li, X. Supported cobalt molybdenum bimetallic nitrides for ammonia decomposition. Chin. J. Chem. Eng. 2005, 13, 696–700. [Google Scholar]
  20. Podila, S.; Zaman, S.F.; Driss, H.; Al-Zahrani, A.A.; Daous, M.A.; Petrov, L.A. High performance of bulk Mo2N and Co3Mo3 N catalysts for hydrogen production from ammonia: Role of citric acid to Mo molar ratio in preparation of high surface area nitride catalysts. Int. J. Hydrog. Energy 2017, 42, 8006–8020. [Google Scholar] [CrossRef]
  21. Srifa, A.; Okura, K.; Okanishi, T.; Muroyama, H.; Matsui, T.; Eguchi, K. COx-free hydrogen production via ammonia decom-position over molybdenum nitride-based catalysts. Catal. Sci. Technol. 2016, 6, 7495–7504. [Google Scholar] [CrossRef]
  22. Tagliazucca, V.; Schlichte, K.; Schüth, F.; Weidenthaler, C. Molybdenum-based catalysts for the decomposition of ammonia: In situ X-ray diffraction studies, microstructure, and catalytic properties. J. Catal. 2013, 305, 277–289. [Google Scholar] [CrossRef]
  23. Guo, J.; Wang, P.; Wu, G.; Wu, A.; Hu, D.; Xiong, Z.; Wang, J.; Yu, P.; Chang, F.; Chen, Z.; et al. Lithium Imide Synergy with 3d Transition-Metal Nitrides Leading to Unprecedented Catalytic Activities for Ammonia Decomposition. Angew. Chem. Int. Ed. 2015, 54, 2950–2954. [Google Scholar] [CrossRef]
  24. Joshua, W.M.; Thomas, J.W.; Phillip, L.M.; Ronald, I.S.; Claire, A.M.; William, I.F.D. Bulk phase behavior of lithium imide–metal nitride ammonia decomposition catalysts. Phys. Chem. Chem. Phys. 2018, 20, 22689–22697. [Google Scholar]
  25. Atthapon, S.; Kaname, O.; Takeou, O.; Hiroki, M.; Toshiaki, M.; Koichi, E. Hydrogen production by ammonia decomposition over Cs-modified Co3Mo3N catalysts. Appl. Catal. B Environ. 2017, 218, 1–8. [Google Scholar]
  26. Panda, R.N.; Kaskel, S. Synthesis and characterization of high surface area molybdenum nitride. J. Mater. Sci. 2006, 41, 2465–2470. [Google Scholar] [CrossRef]
  27. Andersson, R.; Boutonnet, M.; Järås, S. Correlation patterns and effect of syngas conversion level for product selectivity to alcohols and hydrocarbons over molybdenum sulfide based catalysts. Appl. Catal. A Gen. 2012, 417–418, 119–128. [Google Scholar] [CrossRef]
  28. Meimei, L.V.; Xie, W.; Sun, S.; Wu, G.; Zheng, L.; Chu, S.; Gaoa, C.; Bao, J. Activated-carbon-supported K–Co–Mo catalysts for synthesis of higher alcohols from syngas. Catal. Sci. Technol. 2015, 5, 2925–2934. [Google Scholar]
  29. Tanaka, S.; Taniguchi, M.; Tanigawa, H. XPS and UPS studies on electronic structure of Li2O. J. Nucl. Mater. 2000, 283–287, 1405–1408. [Google Scholar] [CrossRef]
  30. Moggia, J.M.; Milt, V.G.; Ulla, M.A.; Cornaglia, L.M. Surface characterization of Co,K/La2O3 catalysts used for the catalytic combustion of diesel soot. Surf. Interface Anal. 2003, 35, 216–225. [Google Scholar] [CrossRef]
  31. Sawyer, R.; Nesbitt, H.; Secco, R. High resolution X-ray Photoelectron Spectroscopy (XPS) study of K2O–SiO2 glasses: Evidence for three types of O and at least two types of Si. J. Non-Cryst. Solids 2012, 358, 290–302. [Google Scholar] [CrossRef]
  32. Nefedov, V.; Salyn, Y.; Leonhardt, G.; Scheibe, R. A comparison of different spectrometers and charge corrections used in X-ray photoelectron spectroscopy. J. Electron Spectrosc. Relat. Phenom. 1977, 10, 121–124. [Google Scholar] [CrossRef]
  33. Chukeaw, T.; Seubsai, A.; Phon-in, P.; Charoen, K.; Witoon, T.; Donphai, W.; Parpainainar, P.; Chareonpanich, M.; Noon, D.; Zohourd, B.; et al. Multimetallic catalysts of RuO2–CuO–Cs2O–TiO2/SiO2 for direct gas-phase epoxidation of propylene to propylene oxide. RSC Adv. 2016, 6, 56116–56126. [Google Scholar] [CrossRef]
  34. Podgornov, E.A.; Prosvirin, I.P.; Bukhtiyarov, V.I. XPS, TPD and TPR studies of Cs–O complexes on silver: Their role in eth-ylene epoxidation. J. Mol. Catal. A: Chem. 2000, 158, 337–343. [Google Scholar] [CrossRef]
  35. Wagner, C.D.; Riggs, W.M.; Davis, L.E.; Moulder, J.F.; Muilenberg, G.E. Handbook of X-ray Photoelectron Spectroscopy; Perkin-Elmer Corp.: Waltham, MA, USA, 1979. [Google Scholar]
  36. Yin, S.; Xu, B.; Zhu, W.; Ng, C.; Zhou, X.; Au, C. Carbon nanotubes-supported Ru catalyst for the generation of COX-free hydrogen from ammonia. Catal. Today 2004, 93–95, 27–38. [Google Scholar] [CrossRef]
  37. Czekajło, Ł.; Lendzion-Bieluń, Z. Effect of preparation conditions and promoters on the structure and activity of the ammonia decomposition reaction catalyst based on nanocrystalline cobalt. Chem. Eng. J. 2016, 289, 254–260. [Google Scholar] [CrossRef]
  38. Okura, K.; Okanishi, T.; Muroyama, H.; Matsui, T.; Eguchi, K. Additive effect of alkaline earth metals on ammonia decomposi-tion reaction over Ni/Y2O3 catalysts. RSC Adv. 2016, 6, 85142–85148. [Google Scholar] [CrossRef]
Figure 1. BET isotherms for the Mo2N and alkali-metal-promoted Mo2N catalysts.
Processes 11 02287 g001
Figure 2. The pore size distribution of LiMo2N, KMo2N, CsMo2N, and Mo2N catalysts.
Processes 11 02287 g002
Figure 3. XRD diffraction patterns of bulk Mo2N, 5 wt% Li-Mo2N, 5 wt% K-Mo2N, and 5 wt% Cs-Mo2N.
Processes 11 02287 g003
Figure 4. XPS analysis of bulk Mo2N, 5 wt% Li-Mo2N, 5 wt% K-Mo2N, and 5 wt% Cs-Mo2N catalyst samples under investigation.
Processes 11 02287 g004
Figure 5. HRTEM images and EDS profile of alkali metal (Li, K and Cs)-promoted Mo2N catalysts. (A,B) Li-Mo2N, (C,D) K-Mo2N, and (E,F) Cs-Mo2N.
Processes 11 02287 g005
Figure 6. (A) NH3 decomposition over Mo2N and Li-, K-, and Cs-promoted Mo2N catalysts; (B) H2 production rate over Mo2N and Li-, K-, and Cs-promoted Mo2N catalysts.
Processes 11 02287 g006
Figure 7. Hydrogen production rate per weight of catalyst.
Processes 11 02287 g007
Figure 8. Long-run for NH3 decomposition over K-Mo2N catalyst.
Processes 11 02287 g008
Disclaimer/Publisher’s Note: The statements, opinions and data contained in all publications are solely those of the individual author(s) and contributor(s) and not of MDPI and/or the editor(s). MDPI and/or the editor(s) disclaim responsibility for any injury to people or property resulting from any ideas, methods, instructions or products referred to in the content.

