
Cadmium Elimination via Magnetic Biochar Derived from Cow Manure: Parameter Optimization and Mechanism Insights


Abstract
:1. Introduction
2. Experiments and Models
2.1. Chemicals and Materials
2.2. Synthesis of Magnetic CM Biochar
2.3. Application of RSM
2.4. Application of BP–ANN
2.5. Adsorption Experiments
2.6. Analysis Methods
3. Results and Discussion
3.1. Preparation Conditions Optimization
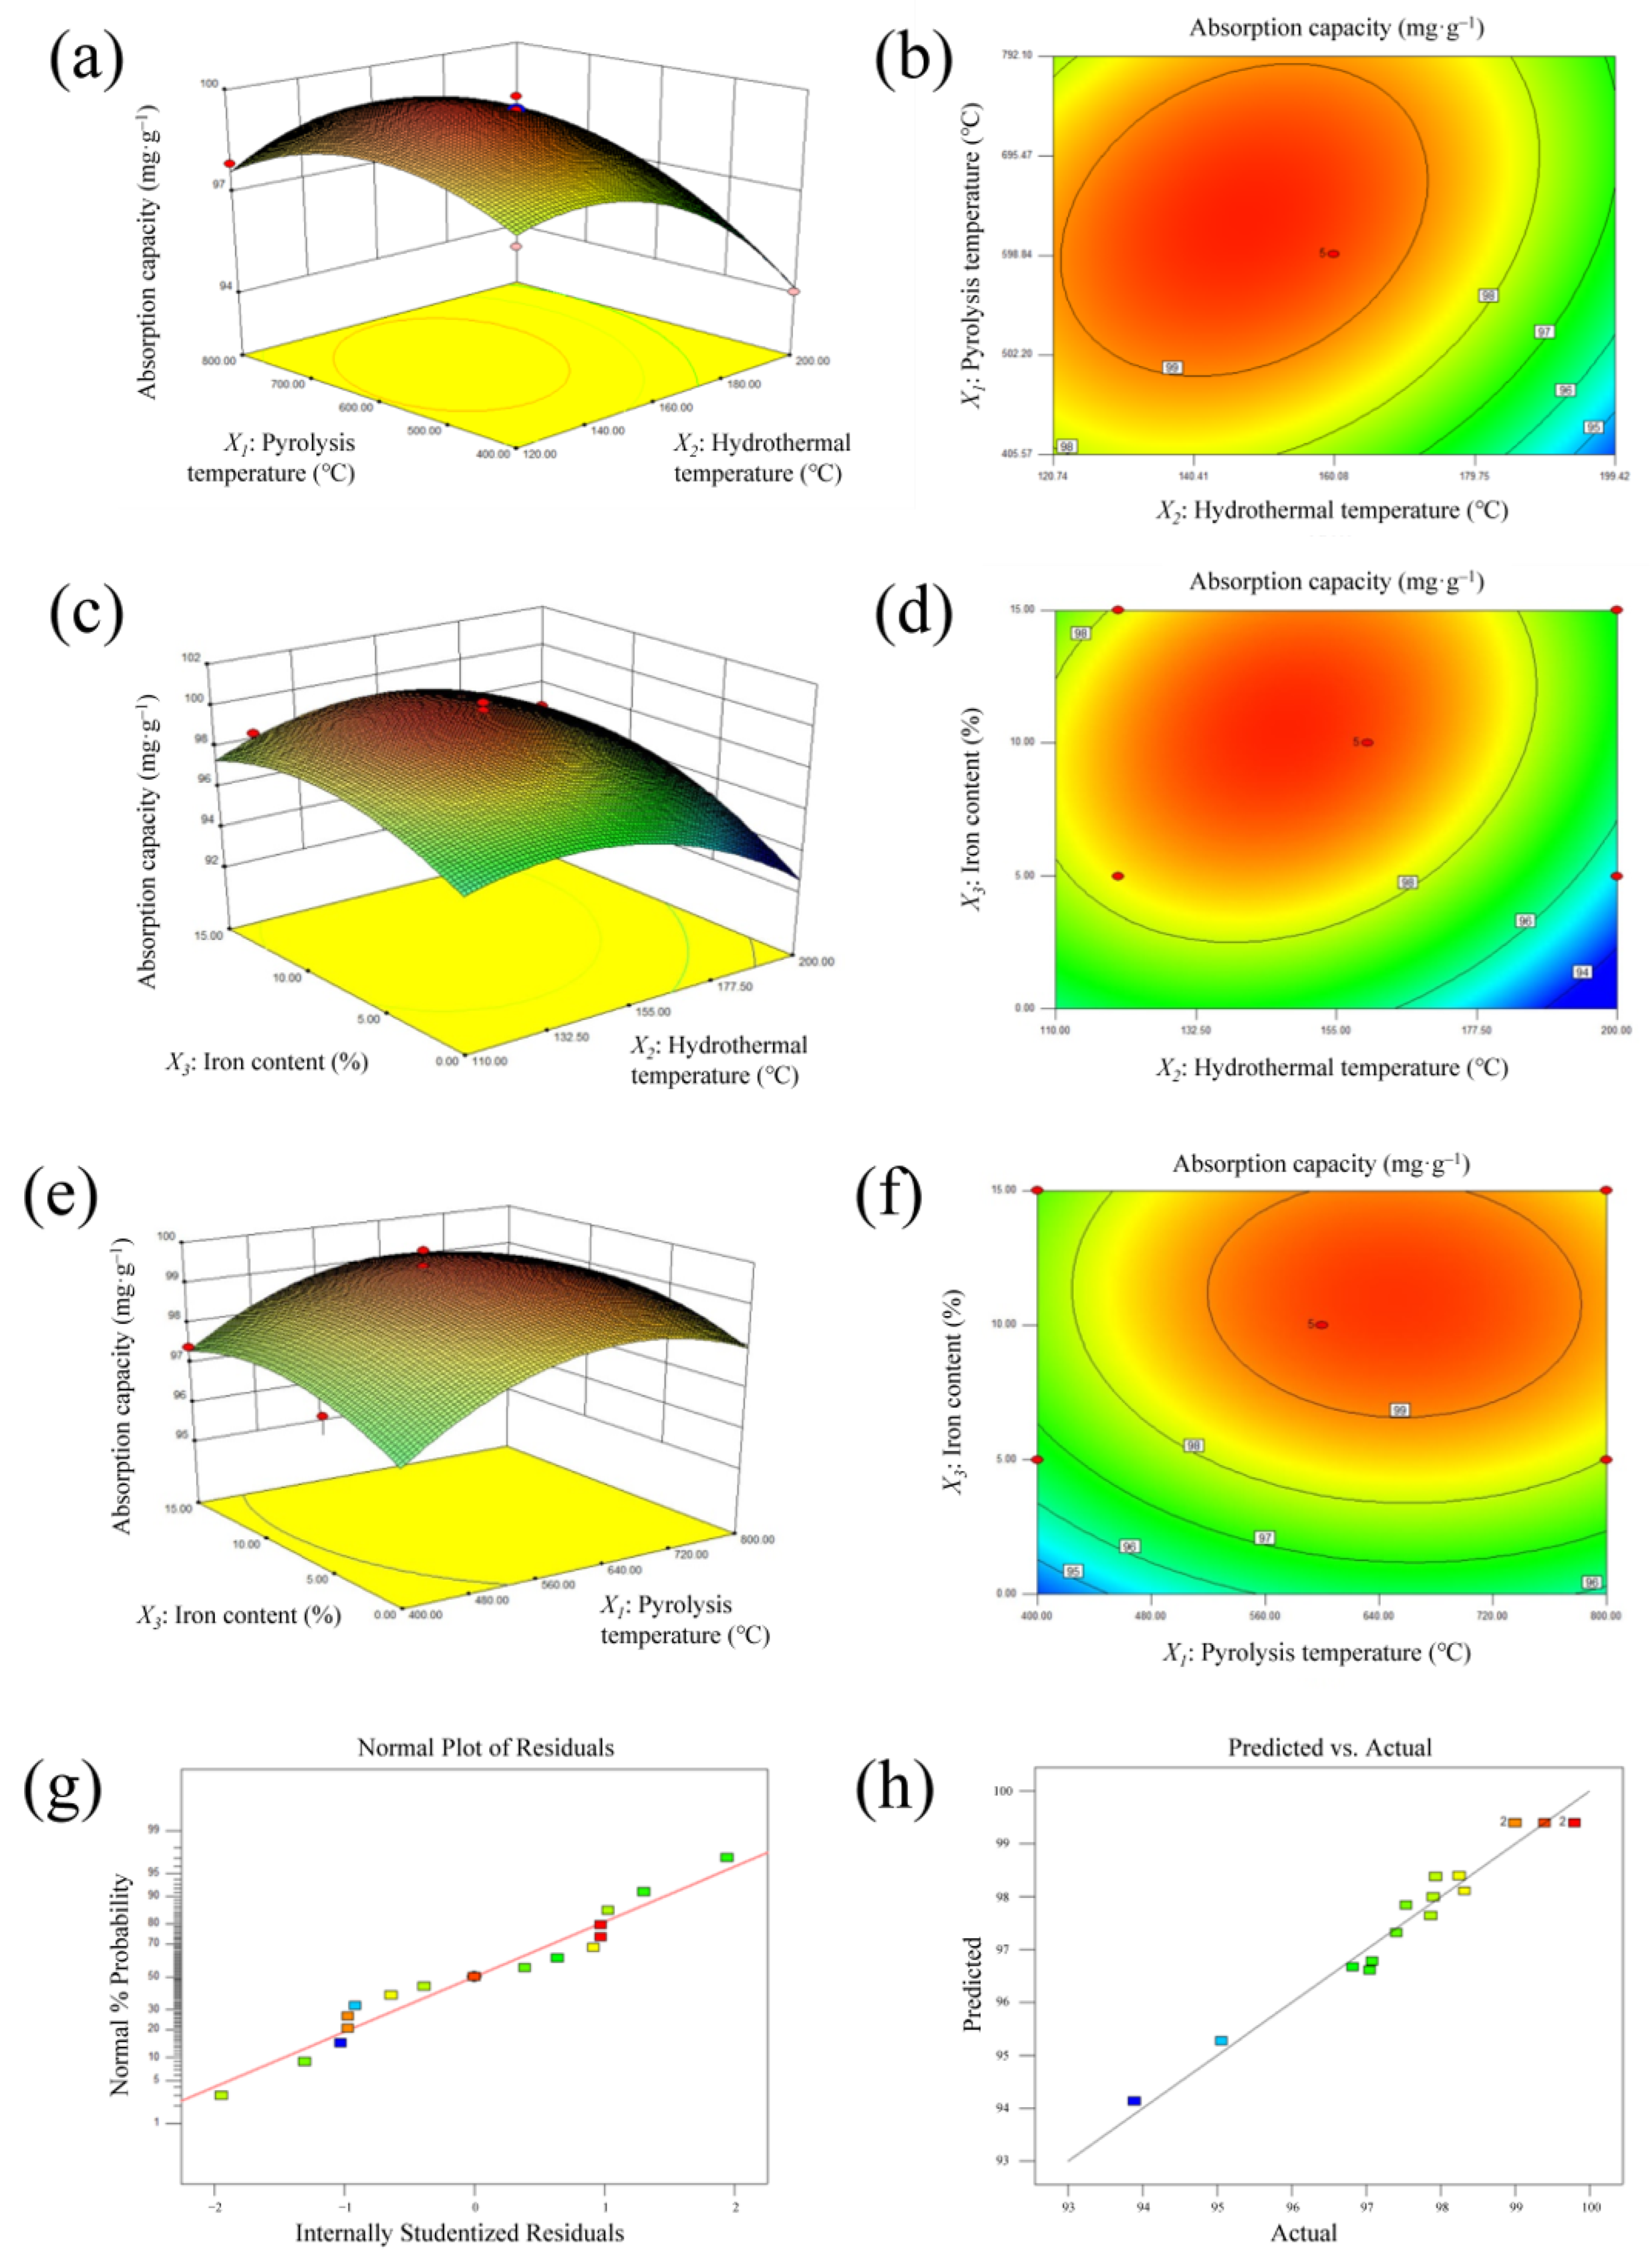
3.1.1. RSM Analysis
X3 − 8.07 X1 X3 − 2.93 X12 − 1.02 X22 − 261.45 X32
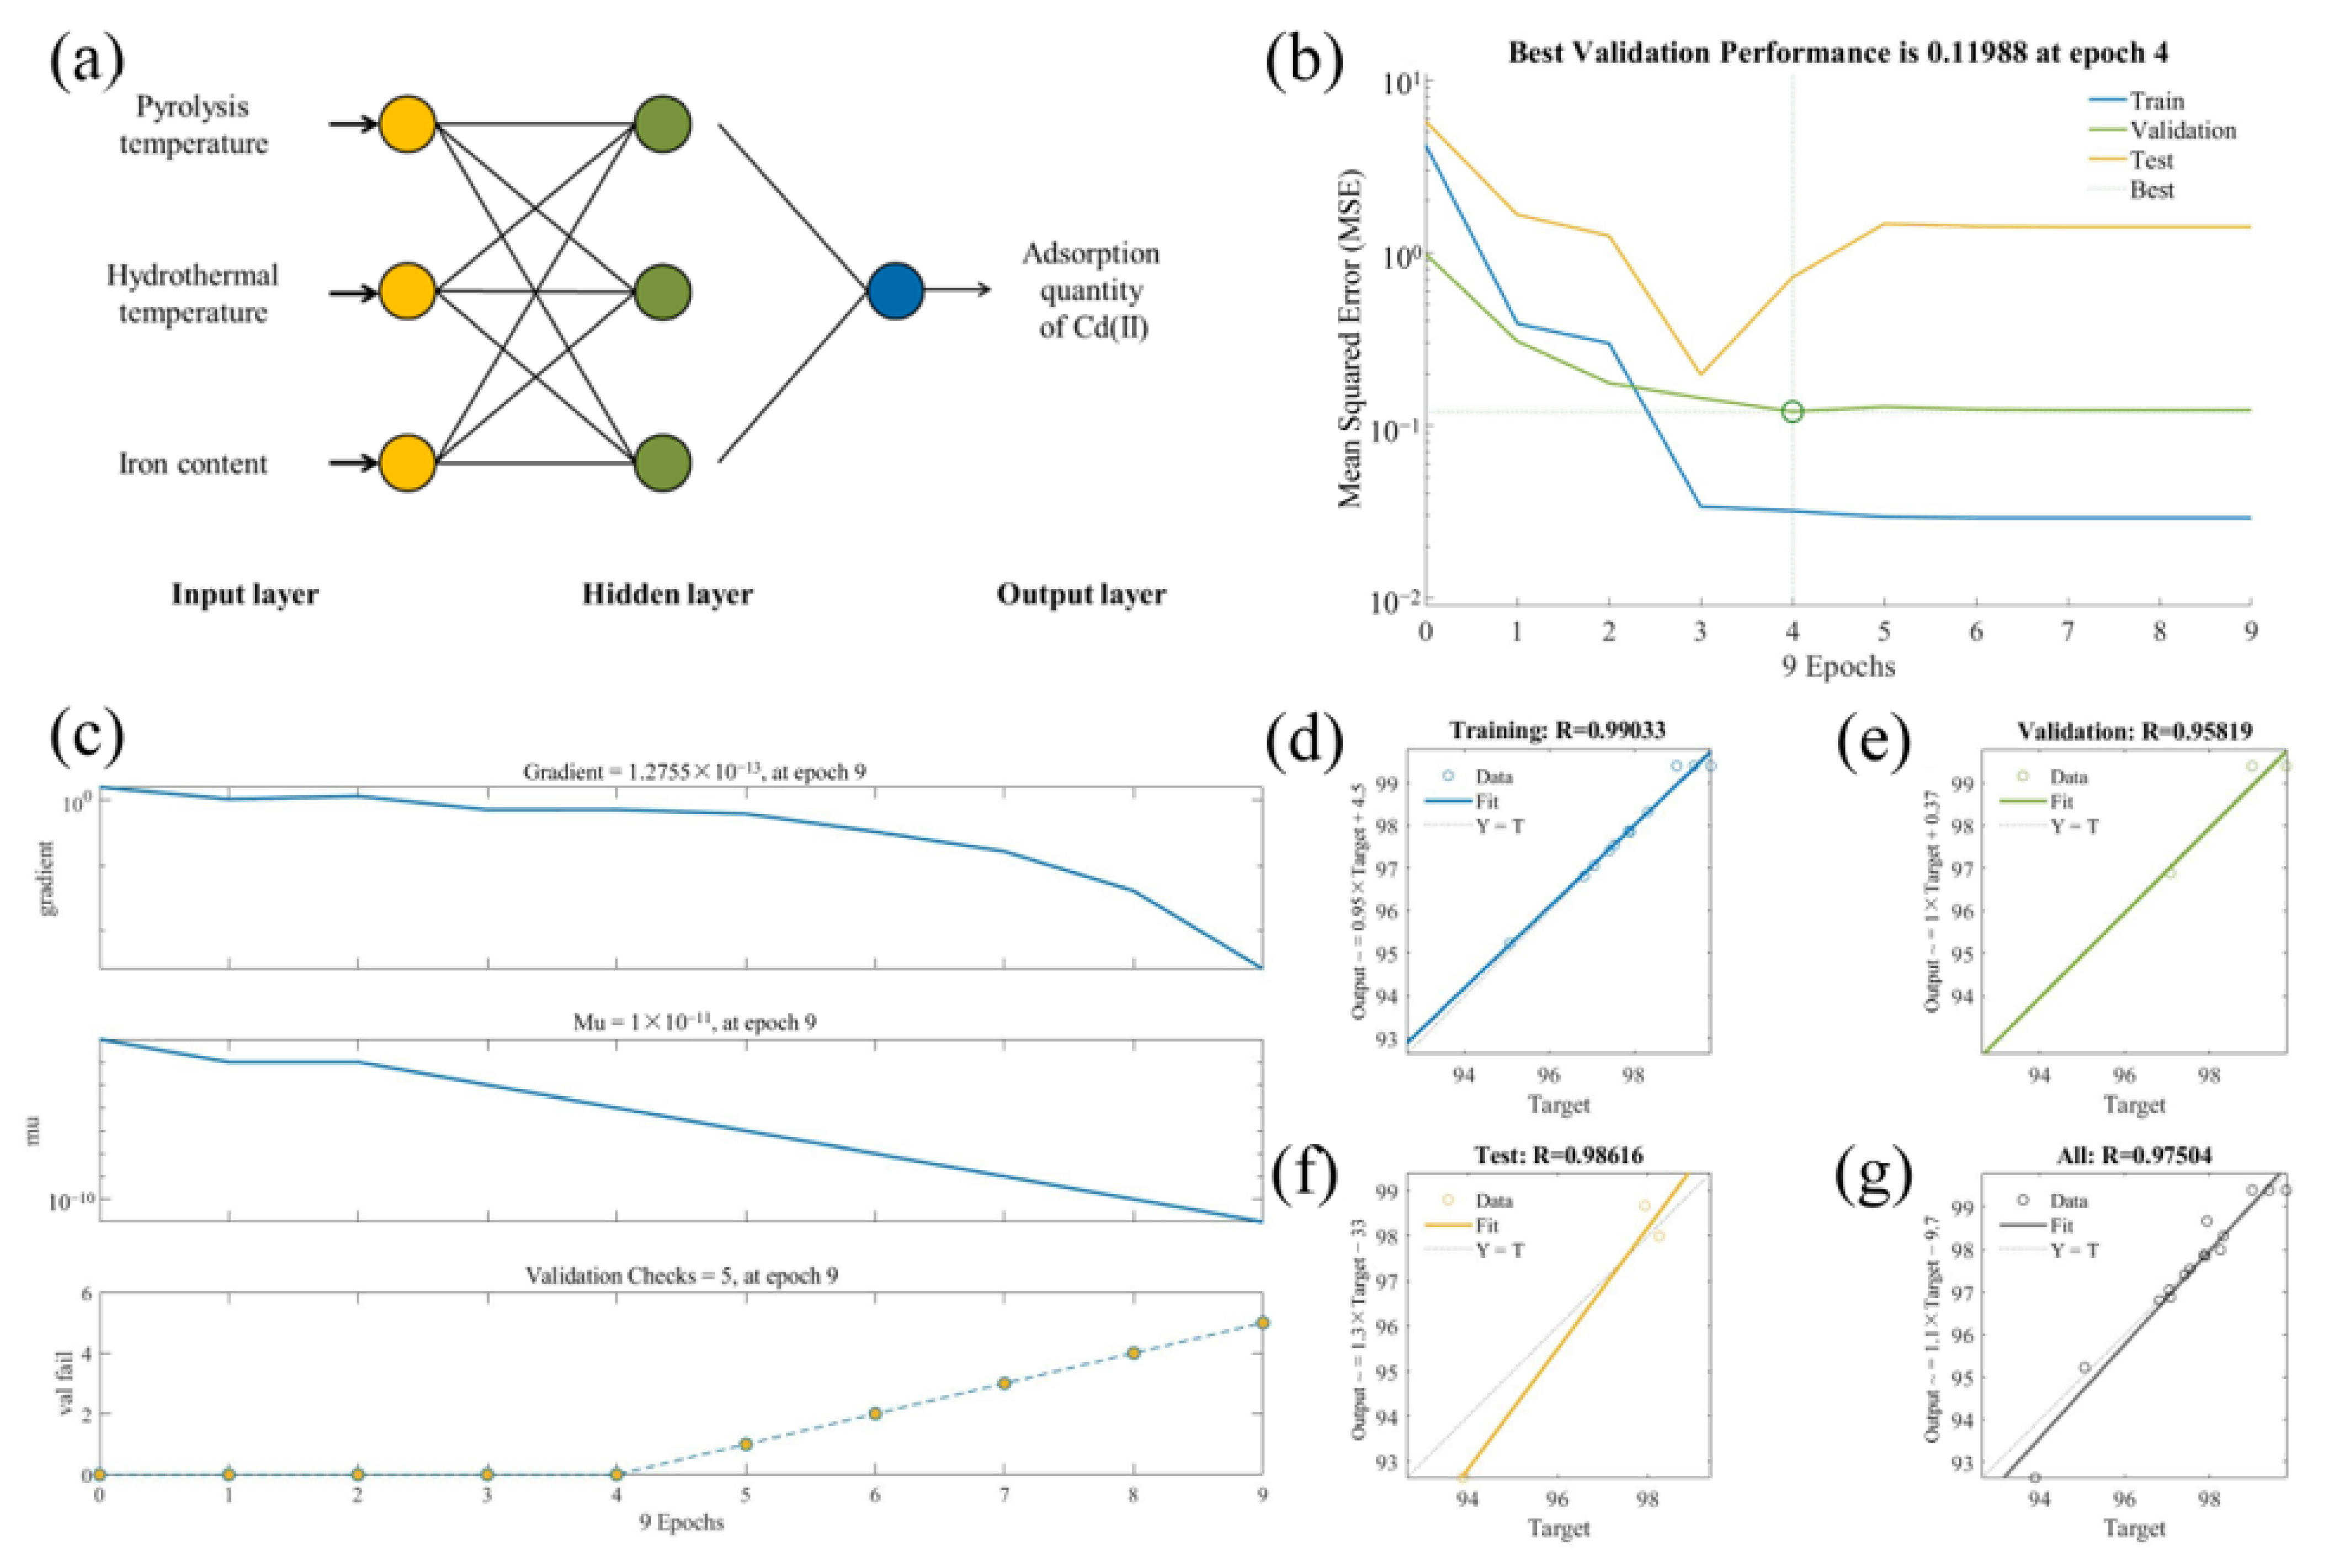
3.1.2. BP–ANN Model
3.2. Reaction Conditions Analysis
3.2.1. RSM
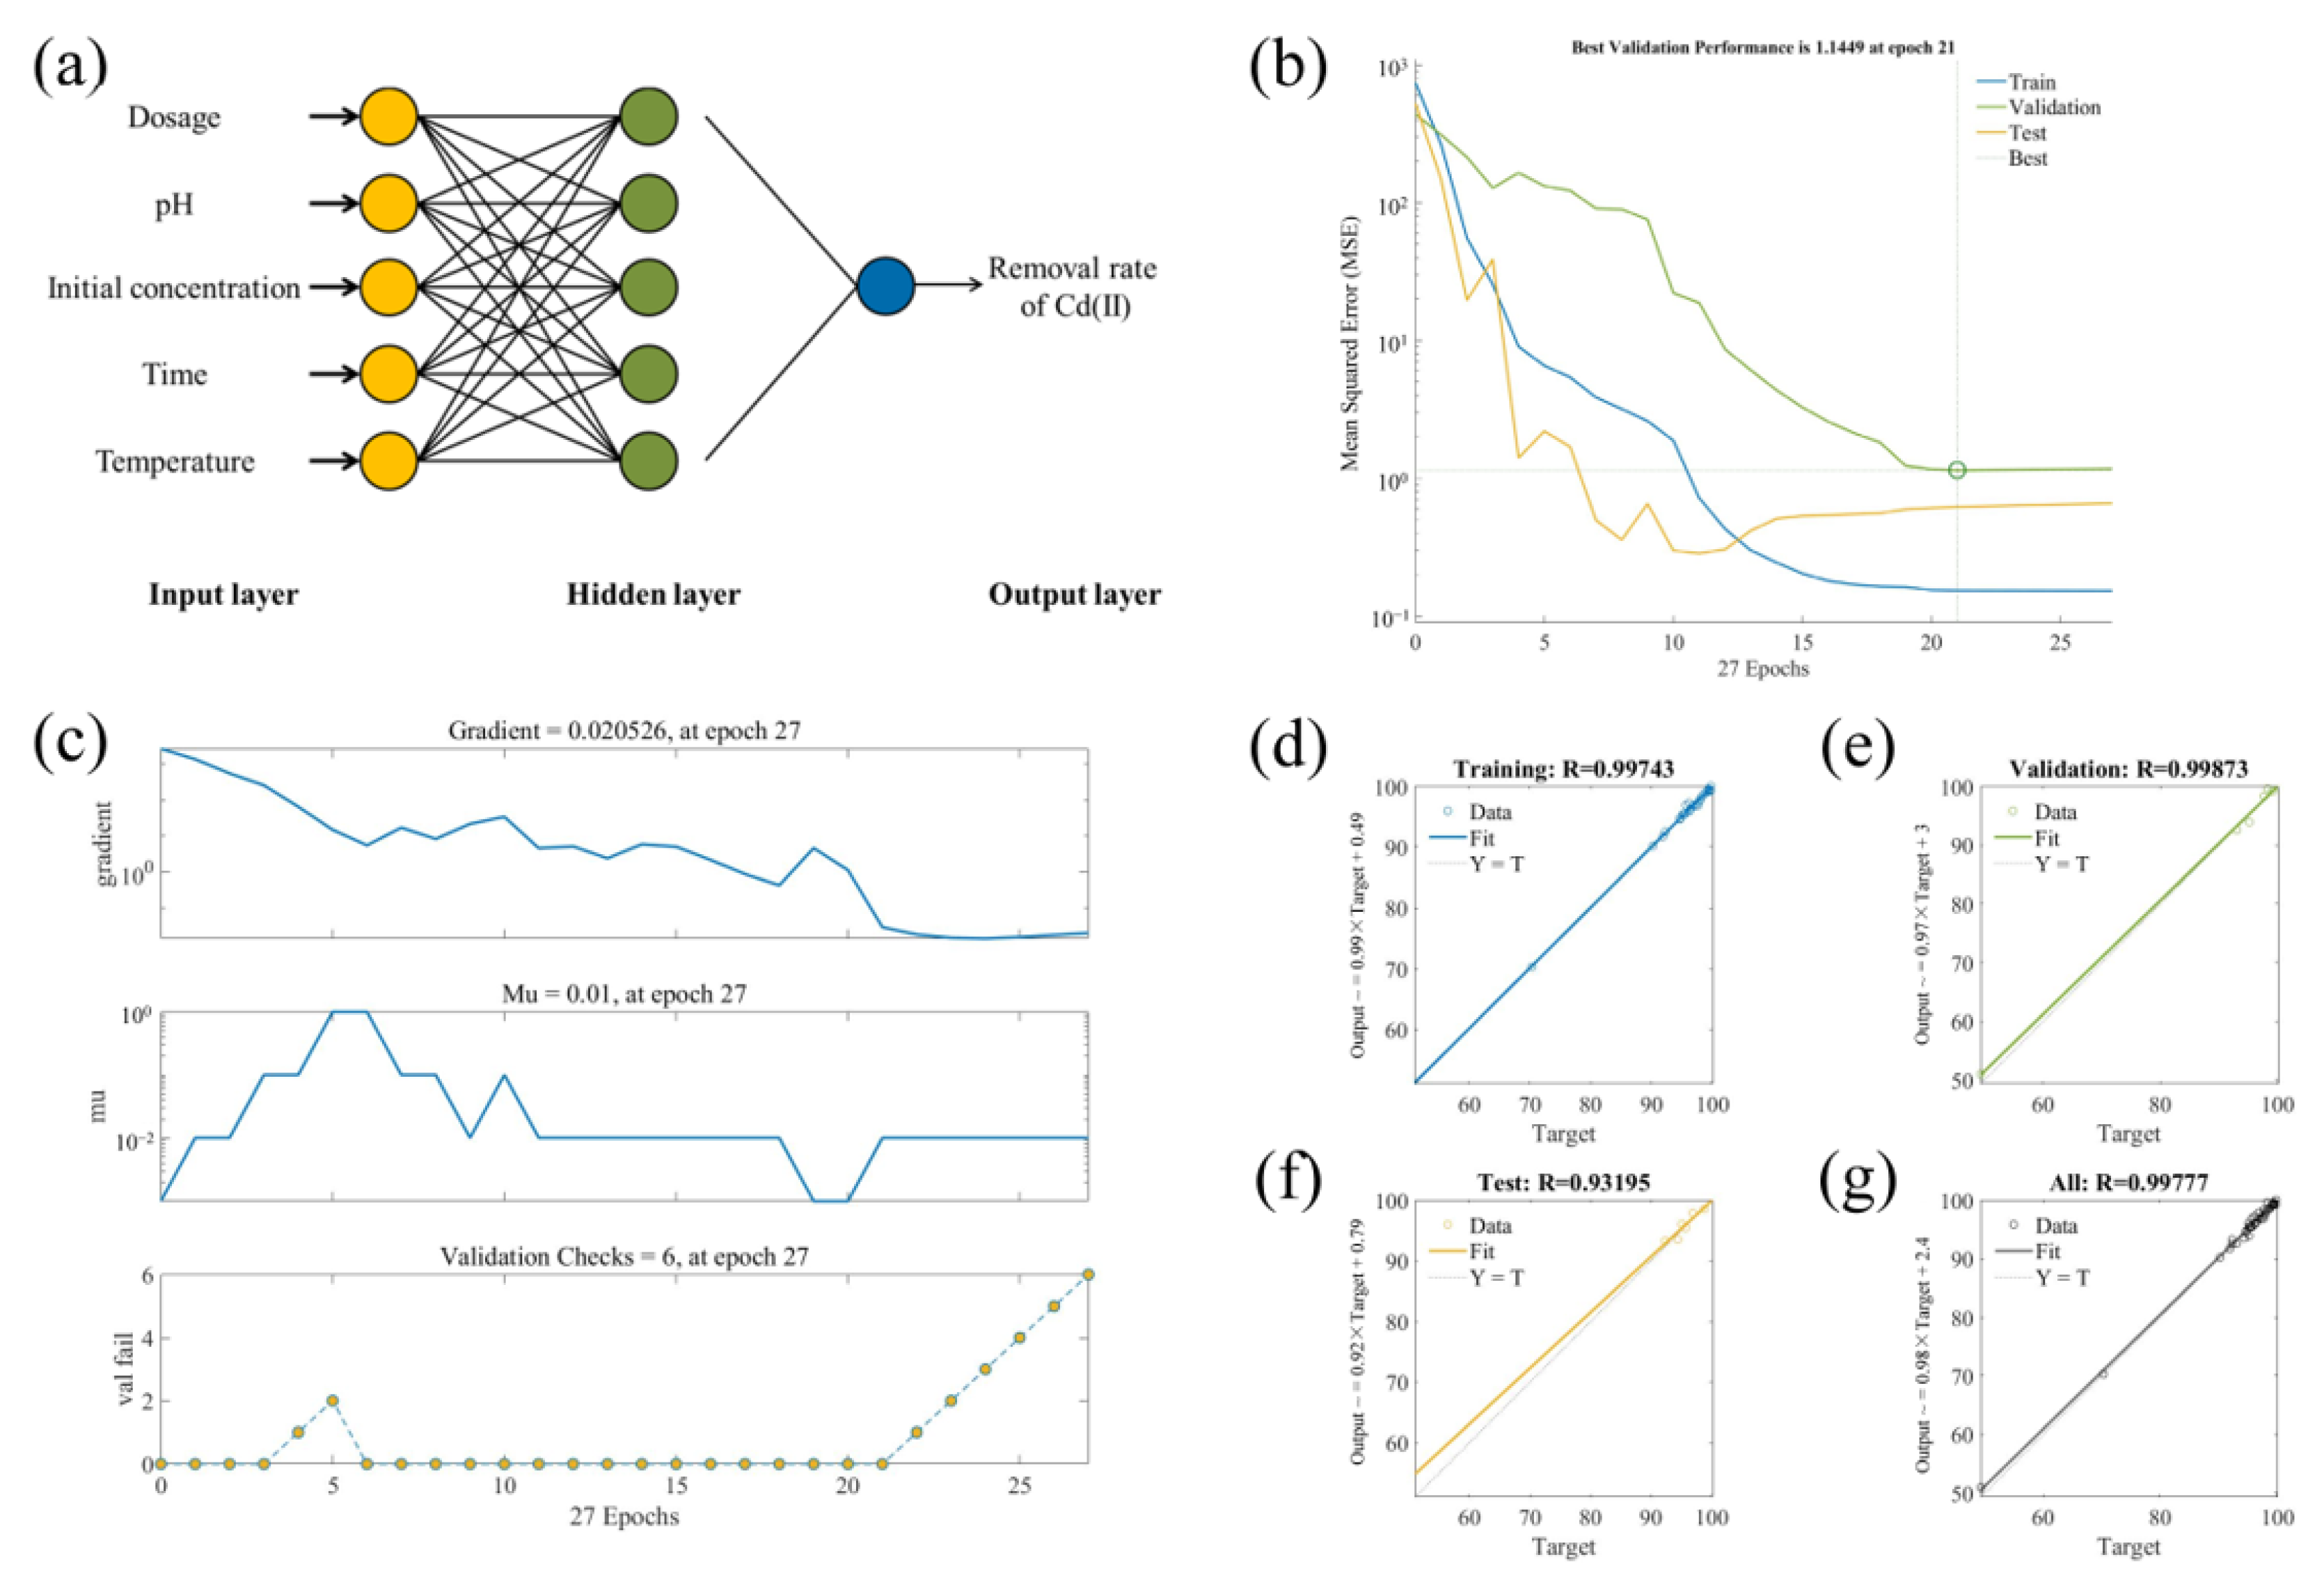
3.2.2. BP–ANN Model
3.3. Comparison of the Developed RSM and BP–ANN Models
3.4. Characteristics
3.4.1. Morphological Analysis
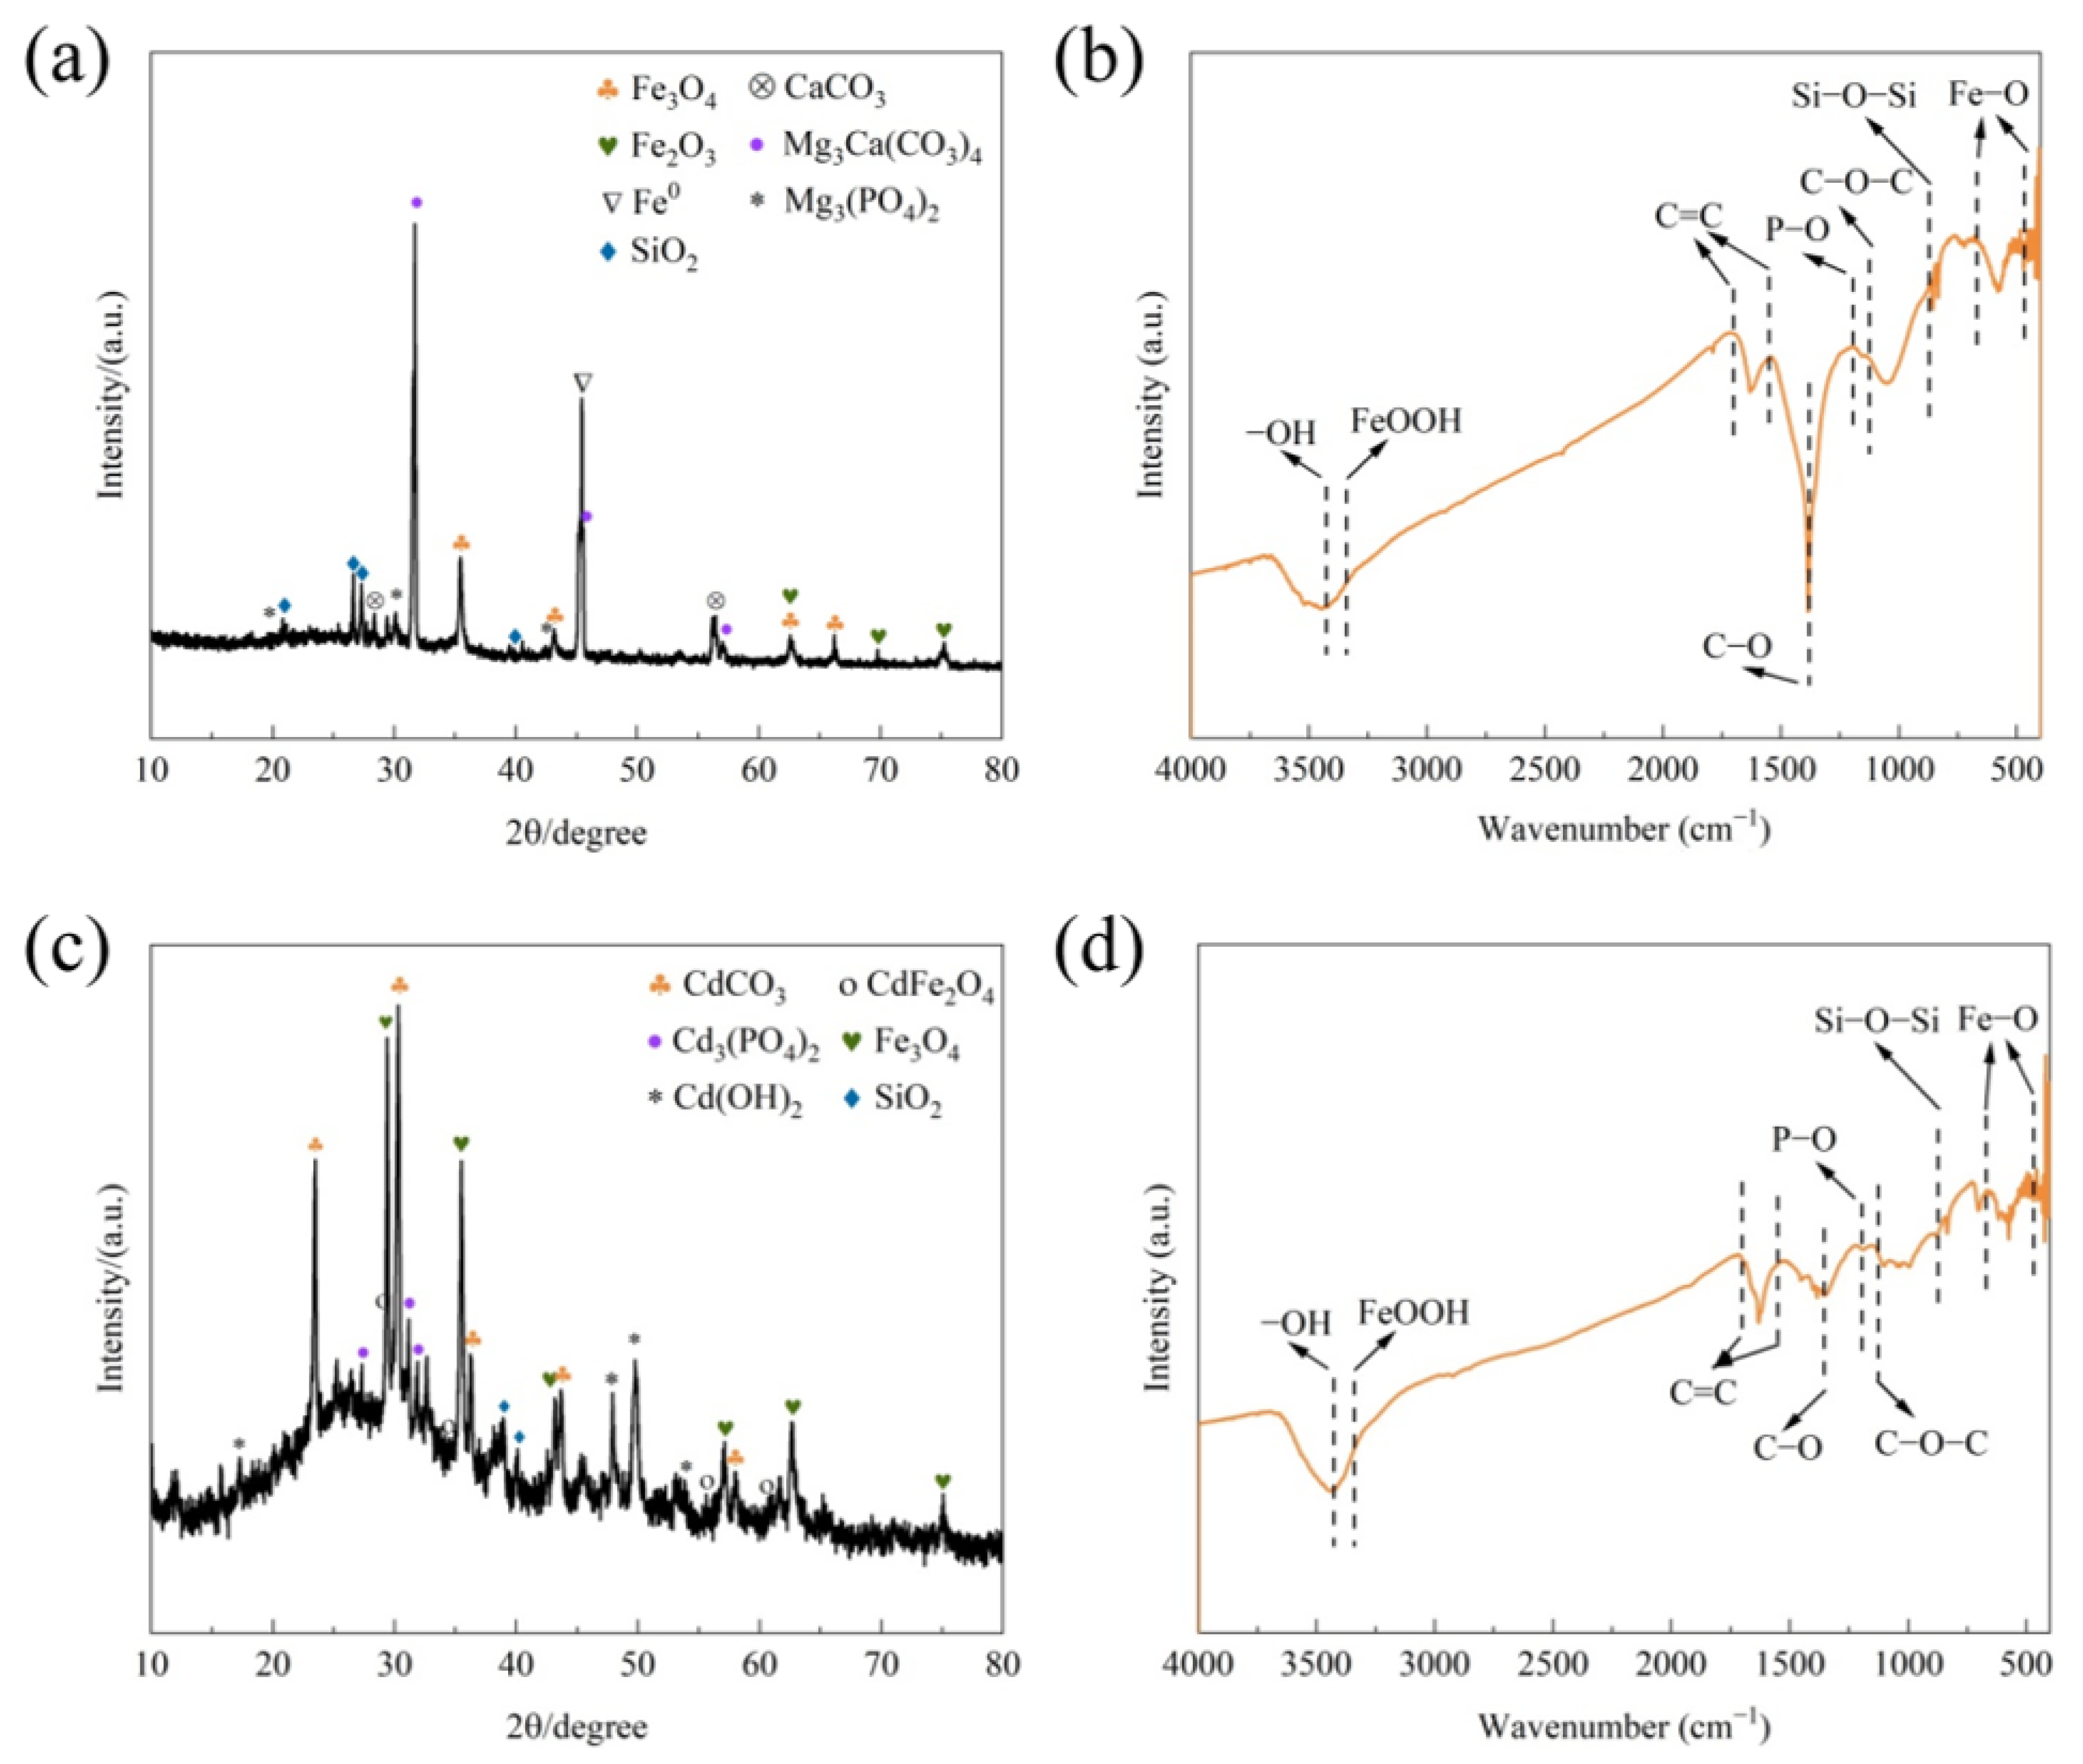
3.4.2. XRD and FTIR Analysis
3.4.3. Magnetic Properties
3.5. Batch Experiments
3.5.1. Adsorption Kinetics and Isotherms
3.5.2. Adsorption Mechanisms
4. Conclusions
Supplementary Materials
Author Contributions
Funding
Data Availability Statement
Conflicts of Interest
References
- Ammar, N.S.; Fathy, N.A.; Ibrahim, H.S.; Mousa, S.M. Micro–mesoporous modified activated carbon from corn husks for removal of hexavalent chromium ions. Appl. Water Sci. 2021, 11, 154. [Google Scholar] [CrossRef]
- Chin, J.F.; Heng, Z.W.; Teoh, H.C.; Chong, W.C.; Pang, Y.L. Recent development of magnetic biochar crosslinked chitosan on heavy metal removal from wastewater–Modification, application and mechanism. Chemosphere 2022, 291, 133035. [Google Scholar] [CrossRef]
- Cuellar, A.D.; Webber, M.E. Cow power: The energy and emissions benefits of converting manure to biogas. Environ. Res. Lett. 2008, 3, 034002. [Google Scholar] [CrossRef]
- Deng, Y.; Zhou, X.; Shen, J.; Xiao, G.; Hong, H.; Lin, H.; Wu, F.; Liao, B.-Q. New methods based on back propagation (BP) and radial basis function (RBF) artificial neural networks (ANNs) for predicting the occurrence of haloketones in tap water. Sci. Total Environ. 2021, 772, 145534. [Google Scholar] [CrossRef] [PubMed]
- Du, Y.; Dai, M.; Cao, J.; Peng, C.; Ali, I.; Naz, I.; Li, J. Efficient removal of acid orange using a porous adsorbent–supported zero–valent iron as a synergistic catalyst in advanced oxidation process. Chemosphere 2020, 244, 125522. [Google Scholar] [CrossRef]
- Erdem, H. The effects of biochars produced in different pyrolsis temperatures from agricultural wastes on cadmium uptake of tobacco plant. Saudi J. Biol. Sci. 2021, 28, 3965–3971. [Google Scholar] [CrossRef] [PubMed]
- Gadekar, M.R.; Ahammed, M.M. Modelling dye removal by adsorption onto water treatment residuals using combined response surface methodology–artificial neural network approach. J. Environ. Manag. 2019, 231, 241–248. [Google Scholar] [CrossRef]
- Guo, X.; Zhu, L.; Xu, X.; Ma, M.; Zou, G.; Wei, D. Competitive or synergetic? Adsorption mechanism of phosphate and oxytetracycline on chestnut shell–derived biochar. J. Clean. Prod. 2022, 370, 133526. [Google Scholar] [CrossRef]
- Hassan, M.A.; Mahmoud, Y.K.; Elnabtiti, A.A.S.; El-Hawy, A.S.; El-Bassiony, M.F.; Abdelrazek, H.M.A. Evaluation of Cadmium or Lead exposure with nannochloropsis oculata mitigation on productive performance, biochemical, and oxidative stress biomarkers in barki rams. Biol. Trace Elem. Res. 2023, 201, 2341–2354. [Google Scholar] [CrossRef]
- He, X.L.; Fan, S.K.; Zhu, J.; Guan, M.Y.; Liu, X.X.; Zhang, Y.S.; Jin, C.W. Iron supply prevents Cd uptake in Arabidopsis by inhibiting IRT1 expression and favoring competition between Fe and Cd uptake. Plant Soil 2017, 416, 453–462. [Google Scholar] [CrossRef]
- He, Y.; Lin, H.; Dong, Y.; Li, B.; Wang, L.; Chu, S.; Luo, M.; Liu, J. Zeolite supported Fe/Ni bimetallic nanoparticles for simultaneous removal of nitrate and phosphate: Synergistic effect and mechanism. Chem. Eng. J. 2018, 347, 669–681. [Google Scholar] [CrossRef]
- Hu, Y.B.; Du, T.; Ma, L.; Feng, X.; Xie, Y.; Fan, X.; Fu, M.L.; Yuan, B.; Li, X.Y. Insights into the mechanisms of aqueous Cd(II) reduction and adsorption by nanoscale zerovalent iron under different atmosphere conditions. J. Hazard. Mater. 2022, 440, 129766. [Google Scholar] [CrossRef] [PubMed]
- Huang, Q.; Yu, Y.; Wan, Y.; Wang, Q.; Luo, Z.; Qiao, Y.; Su, D.; Li, H. Effects of continuous fertilization on bioavailability and fractionation of cadmium in soil and its uptake by rice (Oryza sativa L.). J. Environ. Manag. 2018, 215, 13–21. [Google Scholar] [CrossRef] [PubMed]
- Karki, R.; Chuenchart, W.; Surendra, K.; Sung, S.; Raskin, L.; Khanal, S.K. Anaerobic co–digestion of various organic wastes: Kinetic modeling and synergistic impact evaluation. Bioresour. Technol. 2022, 343, 126063. [Google Scholar] [CrossRef]
- Khetib, Y.; Sedraoui, K.; Gari, A. Improving thermal conductivity of a ferrofluid–based nanofluid using Fe3O4—Challenging of RSM and ANN methodologies. Chem. Eng. Commun. 2022, 209, 1070–1081. [Google Scholar] [CrossRef]
- Klasson, K.T. Biochar characterization and a method for estimating biochar quality from proximate analysis results. Biomass Bioenergy 2017, 96, 50–58. [Google Scholar] [CrossRef] [Green Version]
- Li, X.; Yang, B.; Yang, J.; Fan, Y.; Qian, X.; Li, H. Magnetic properties and its application in the prediction of potentially toxic elements in aquatic products by machine learning. Sci. Total Environ. 2021, 783, 147083. [Google Scholar] [CrossRef]
- Liu, X.; Lee, C.; Kim, J.Y. Comparison of mesophilic and thermophilic anaerobic digestions of thermal hydrolysis pretreated swine manure: Process performance, microbial communities and energy balance. J. Environ. Sci. 2023, 126, 222–233. [Google Scholar] [CrossRef]
- Liu, Y.; Li, Y.; Xia, Y.; Liu, K.; Ren, L.; Ji, Y. The Dysbiosis of Gut Microbiota Caused by Low–Dose Cadmium Aggravate the Injury of Mice Liver through Increasing Intestinal Permeability. Microorganisms 2020, 8, 211. [Google Scholar] [CrossRef] [Green Version]
- Liu, Y.; Wang, L.; Gu, K.; Li, M. Artificial Neural Network (ANN)–Bayesian Probability Framework (BPF) based method of dynamic force reconstruction under multi–source uncertainties. Knowl.-Based Syst. 2022, 237, 107796. [Google Scholar] [CrossRef]
- Mariuzza, D.; Lin, J.C.; Volpe, M.; Fiori, L.; Ceylan, S.; Goldfarb, J.L. Impact of Co–Hydrothermal carbonization of animal and agricultural waste on hydrochars’ soil amendment and solid fuel properties. Biomass Bioenergy 2022, 157, 106329. [Google Scholar] [CrossRef]
- Medellín-Castillo, N.A.; Cruz-Briano, S.A.; Leyva-Ramos, R.; Moreno-Piraján, J.C.; Torres-Dosal, A.; Giraldo-Gutiérrez, L.; Labrada-Delgado, G.J.; Pérez, R.O.; Rodriguez-Estupiñan, J.P.; Lopez, S.Y.R.; et al. Use of bone char prepared from an invasive species, pleco fish (Pterygoplichthys spp.), to remove fluoride and Cadmium in water. J. Environ. Manag. 2020, 256, 109956. [Google Scholar] [CrossRef] [PubMed]
- Mei, Y.; Xu, J.; Zhang, Y.; Li, B.; Fan, S.; Xu, H. Effect of Fe–N modification on the properties of biochars and their adsorption behavior on tetracycline removal from aqueous solution. Bioresour. Technol. 2021, 325, 124732. [Google Scholar] [CrossRef] [PubMed]
- Muhammad, N.; Ge, L.; Chan, W.P.; Khan, A.; Nafees, M.; Lisak, G. Impacts of pyrolysis temperatures on physicochemical and structural properties of green waste derived biochars for adsorption of potentially toxic elements. J. Environ. Manag. 2022, 317, 115385. [Google Scholar] [CrossRef] [PubMed]
- Obi, C.C.; Nwabanne, J.T.; Igwegbe, C.A.; Ohale, P.E.; Okpala, C.O.R. Multi–characteristic optimization and modeling analysis of electrocoagulation treatment of abattoir wastewater using iron electrode pairs. J. Water Process Eng. 2022, 49, 103136. [Google Scholar] [CrossRef]
- Peng, B.; Liu, Q.; Li, X.; Zhou, Z.; Wu, C.; Zhang, H. Co–pyrolysis of industrial sludge and rice straw: Synergistic effects of biomass on reaction characteristics, biochar properties and heavy metals solidification. Fuel Process. Technol. 2022, 230, 107211. [Google Scholar] [CrossRef]
- Peng, H.; Guo, J.; Qiu, H.; Wang, C.; Zhang, C.; Hao, Z.; Rao, Y.; Gong, Y. Efficient removal of Cr(VI) with biochar and optimized parameters by response surface methodology. Processes 2021, 9, 889. [Google Scholar] [CrossRef]
- Plattes, M.; Bertrand, A.; Schmitt, B.; Sinner, J.; Verstraeten, F.; Welfring, J. Removal of tungsten oxyanions from industrial wastewater by precipitation, coagulation and flocculation processes. J. Hazard. Mater. 2007, 148, 613–615. [Google Scholar] [CrossRef]
- Qiu, B.; Tao, X.; Wang, H.; Li, W.; Ding, X.; Chu, H. Biochar as a low–cost adsorbent for aqueous heavy metal removal: A review. J. Anal. Appl. Pyrolysis 2021, 155, 105081. [Google Scholar] [CrossRef]
- Sun, H.; Zhou, Q.; Zhao, L.; Wu, W. Enhanced simultaneous removal of nitrate and phosphate using novel solid carbon source/zero–valent iron composite. J. Clean. Prod. 2021, 289, 125757. [Google Scholar] [CrossRef]
- Sun, L.; Gong, P.; Sun, Y.; Qin, Q.; Song, K.; Ye, J.; Zhang, H.; Zhou, B.; Xue, Y. Modified chicken manure biochar enhanced the adsorption for Cd2+ in aqueous and immobilization of Cd in contaminated agricultural soil. Sci. Total Environ. 2022, 851, 158252. [Google Scholar] [CrossRef] [PubMed]
- Szogi, A.A.; Takata, V.H.; Shumaker, P.D. Chemical extraction of phosphorus from dairy manure and utilization of recovered manure solids. Agronomy 2020, 10, 1725. [Google Scholar] [CrossRef]
- Tan, W.T.; Zhou, H.; Tang, S.F.; Zeng, P.; Gu, J.F.; Liao, B.H. Enhancing Cd(II) adsorption on rice straw biochar by modification of iron and manganese oxides. Environ. Pollut. 2022, 300, 118899. [Google Scholar] [CrossRef]
- Wang, H.; Chen, D.; Wen, Y.; Zhang, Y.; Liu, Y.; Xu, R. Iron–rich red mud and iron oxide–modified biochars: A comparative study on the removal of Cd(II) and influence of natural aging processes. Chemosphere 2023, 330, 138626. [Google Scholar] [CrossRef] [PubMed]
- Wang, H.; Cui, T.; Chen, D.; Luo, Q.; Xu, J.; Sun, R.; Zi, W.; Xu, R.; Liu, Y.; Zhang, Y. Hexavalent chromium elimination from wastewater by integrated micro–electrolysis composites synthesized from red mud and rice straw via a facile one–pot method. Sci. Rep. 2022, 12, 14242. [Google Scholar] [CrossRef] [PubMed]
- Wang, H.; Liu, Y.; Ifthikar, J.; Shi, L.; Khan, A.; Chen, Z.; Chen, Z. Towards a better understanding on mercury adsorption by magnetic bio–adsorbents with gamma–Fe2O3 from pinewood sawdust derived hydrochar: Influence of atmosphere in heat treatment. Bioresour. Technol. 2018, 256, 269–276. [Google Scholar] [CrossRef]
- Wang, H.; Wang, S.; Chen, Z.; Zhou, X.; Wang, J.; Chen, Z. Engineered biochar with anisotropic layered double hydroxide nanosheets to simultaneously and efficiently capture Pb2+ and CrO42− from electroplating wastewater. Bioresour. Technol. 2020, 306, 123118. [Google Scholar] [CrossRef]
- Wang, N.; Sun, Q.; Zhang, T.; Mayoral, A.; Li, L.; Zhou, X.; Xu, J.; Zhang, P.; Yu, J. Impregnating subnanometer metallic nanocatalysts into self–pillared zeolite nanosheets. J. Am. Chem. Soc. 2021, 143, 6905–6914. [Google Scholar] [CrossRef]
- Witek-Krowiak, A.; Chojnacka, K.; Podstawczyk, D.; Dawiec, A.; Pokomeda, K. Application of response surface methodology and artificial neural network methods in modelling and optimization of biosorption process. Bioresour. Technol. 2014, 160, 150–160. [Google Scholar] [CrossRef]
- Xu, L.; Tian, S.; Hu, Y.; Zhao, J.; Ge, J.; Lu, L. Cadmium contributes to heat tolerance of a hyperaccumulator plant species Sedum alfredii. J. Hazard. Mater. 2023, 441, 129840. [Google Scholar] [CrossRef]
- Yan, R.; Liao, J.; Yang, J.; Sun, W.; Nong, M.; Li, F. Multi–hour and multi–site air quality index forecasting in Beijing using CNN, LSTM, CNN–LSTM, and spatiotemporal clustering. Expert Syst. Appl. 2021, 169, 114513. [Google Scholar] [CrossRef]
- Yang, R.; Liang, X.; Strawn, D.G. Variability in Cadmium uptake in common wheat under Cadmium stress: Impact of genetic variation and silicon supplementation. Agriculture 2022, 12, 848. [Google Scholar] [CrossRef]
- Yu, X.; Zhou, H.; Ye, X.; Wang, H. From hazardous agriculture waste to hazardous metal scavenger: Tobacco stalk biochar–mediated sequestration of Cd leads to enhanced tobacco productivity. J. Hazard. Mater. 2021, 413, 125303. [Google Scholar] [CrossRef] [PubMed]
- Zhang, A.; Li, X.; Xing, J.; Xu, G. Adsorption of potentially toxic elements in water by modified biochar: A review. J. Environ. Chem. Eng. 2020, 8, 104196. [Google Scholar] [CrossRef]
- Zhou, X.; Xu, D.; Yang, J.; Yan, Z.; Zhang, Z.; Zhong, B.; Wang, X. Treatment of distiller grain with wet–process phosphoric acid leads to biochar for the sustained release of nutrients and adsorption of Cr(VI). J. Hazard. Mater. 2023, 441, 129949. [Google Scholar] [CrossRef] [PubMed]
- Zhou, X.; Zhu, Y.; Niu, Q.; Zeng, G.; Lai, C.; Liu, S.; Huang, D.; Qin, L.; Liu, X.; Li, B.; et al. New notion of biochar: A review on the mechanism of biochar applications in advannced oxidation processes. Chem. Eng. J. 2021, 416, 129027. [Google Scholar] [CrossRef]


Disclaimer/Publisher’s Note: The statements, opinions and data contained in all publications are solely those of the individual author(s) and contributor(s) and not of MDPI and/or the editor(s). MDPI and/or the editor(s) disclaim responsibility for any injury to people or property resulting from any ideas, methods, instructions or products referred to in the content. |
© 2023 by the authors. Licensee MDPI, Basel, Switzerland. This article is an open access article distributed under the terms and conditions of the Creative Commons Attribution (CC BY) license (https://creativecommons.org/licenses/by/4.0/).
Share and Cite
Wen, Y.; Chen, D.; Zhang, Y.; Wang, H.; Xu, R. Cadmium Elimination via Magnetic Biochar Derived from Cow Manure: Parameter Optimization and Mechanism Insights. Processes 2023, 11, 2295. https://doi.org/10.3390/pr11082295
Wen Y, Chen D, Zhang Y, Wang H, Xu R. Cadmium Elimination via Magnetic Biochar Derived from Cow Manure: Parameter Optimization and Mechanism Insights. Processes. 2023; 11(8):2295. https://doi.org/10.3390/pr11082295
Chicago/Turabian StyleWen, Yi, Dingxiang Chen, Yong Zhang, Huabin Wang, and Rui Xu. 2023. "Cadmium Elimination via Magnetic Biochar Derived from Cow Manure: Parameter Optimization and Mechanism Insights" Processes 11, no. 8: 2295. https://doi.org/10.3390/pr11082295
APA StyleWen, Y., Chen, D., Zhang, Y., Wang, H., & Xu, R. (2023). Cadmium Elimination via Magnetic Biochar Derived from Cow Manure: Parameter Optimization and Mechanism Insights. Processes, 11(8), 2295. https://doi.org/10.3390/pr11082295