Abstract
Continuous dissolution of spent fuel is indeed one of the key technologies that can significantly improve the efficiency and stability of spent fuel reprocessing. The China Institute of Atomic Energy designed a prototype rotary drum dissolver, and the dissolution behavior of UO2 pellets in the dissolver was calculated using the Discrete Element Method. A kinetic equation was established to model the dissolution behavior, considering variables such as temperature, nitric acid concentration, and stirring intensity. The calculations showed that complete pellet dissolution took about 10 h in the continuous reaction, compared to 6 h in the batch dissolution experiment due to the gradual decrease in nitric acid concentration. A 16 h continuous dissolution experiment confirmed the calculated results, with a deviation of 10.8% between the simulation and experiment in terms of the mass of dissolved pellets. It was also found that it takes approximately 30 h to reach equilibrium in the continuous rotary dissolver, with a nitric acid concentration of 2.8 mol/L and a uranium concentration of 243 g/L at equilibrium.
1. Introduction
Nuclear energy is considered a form of clean energy with numerous advantages [1]. However, the question of how to handle the disposal of spent fuel produced by nuclear power plants has become a major concern [2]. One approach to improving the utilization of nuclear resources is through nuclear fuel reprocessing, which involves the recovery of U and Pu from the spent fuel. In hydrometallurgical nuclear fuel reprocessing, chemical extraction is employed to recover and extract useful nuclides from irradiated reactor components [3,4]. The process begins by cutting the irradiated spent fuel elements into short sections for dissolution with nitric acid in a dissolver. Subsequent steps involve separation and extraction to obtain the final product. The dissolver plays a crucial role in this process and can be categorized into two forms: batch and continuous types [5,6]. The continuous dissolver offers several advantages, including: ① maintaining a constant composition of the dissolving solution, ensuring stable discharge, and enabling convenient control; ② exhibiting stable exhaust levels with no gas peaks, along with efficient control of the exhaust gas absorption and scrubbing system; ③ having a dissolver size that is only 5% to 10% of a batch dissolver with the same average dissolution speed, making it safer; ④ eliminating the need to add a soluble neutron poison and preventing further oxidation of Pu (IV). Various continuous dissolvers are used, such as turntable type, drum type, and pulse type, among others [7,8]. Currently, in industrial applications, the turntable continuous dissolver is the only type being used. However, another type, known as the rotating drum continuous dissolver, has gained significant attention. This particular dissolver incorporates pellets that roll through it due to the rotation of the inner wall of the drum, which enhances the solid–liquid mass transfer process. The design of rotary drum continuous dissolvers dates back to the 1950s when the Oak Ridge National Laboratory in the United States began developing them. They successfully constructed several examples and conducted subsequent experiments [7]. In order to advance the technology for continuous dissolution, the China Institute of Atomic Energy (CIAE) designed and manufactured a rotary drum continuous dissolver in 2020. The institute also successfully carried out continuous dissolution experiments for uranium in 2021.
Experimental research involving radioactive materials necessitates the use of specialized radioactive laboratories that must adhere to stringent operating conditions. These laboratories are costly to operate, which poses challenges for conducting experiments. Moreover, the utilization of actual fuel for experiments or system testing in future large-scale industrial equipment would result in significant resource consumption. Therefore, in the field of nuclear facilities, optimizing processes and equipment through simulation calculations can lead to substantial cost savings by minimizing the need for extensive experimental trials. This approach allows for efficient resource allocation and can expedite the development and implementation of advanced nuclear technologies. By utilizing simulation techniques, practitioners can confidently analyze and refine their designs, leading to enhanced performance and improved safety in nuclear facilities while minimizing costly real-world experimentation [9,10,11,12,13]. Due to the limited availability of continuous dissolution process equipment and the high costs associated with experiments, this study employs numerical simulation methods to determine the conditions for continuous dissolution experiments.
In recent decades, significant advancements have been made in studying the dissolution kinetics of uranium dioxide [14,15,16,17,18,19,20,21]. These studies have primarily focused on key aspects including dissolution rate, the impact of solution conditions on dissolution rate, dissolution mechanisms, and surface reactions [22]. Moreover, researchers have delved into the mechanisms and surface reactions involved in the dissolution of uranium dioxide [23,24,25]. Utilizing techniques such as surface analysis, and theoretical simulations [26,27,28], they have uncovered vital information regarding ion transfer steps, the formation of surface species, and the mechanisms governing dissolution rate control. However, it is important to note that the dissolution kinetics of uranium dioxide is strongly influenced by the manufacturing process of the raw materials, leading to significant variations in the solubility of fuel obtained through different manufacturing processes. Therefore, this study focuses on conducting dissolution experiments specifically on uranium dioxide pellets manufactured by the CNNC North Nuclear Fuel Elements Company, aiming to establish a model to analyze the dissolution behavior of this specific fuel type and providing methods and dates for the design and optimization of industrial-scale equipment in the future.
This paper focuses on utilizing individual uranium pellet dissolution data to establish a kinetic reaction equation. Subsequently, this equation is incorporated into the Discrete Element Method to simulate the dissolution process of uranium pellets within a continuous rotary drum dissolver. The obtained results are then validated through experimental verification. By analyzing the concentration of nitric acid and uranium within the dissolver, as well as the dissolution time of individual pellets, valuable insights into the operating conditions of the dissolver and the pellet dissolution process are gained and analyzed. The calculations provide valuable insights that serve as the basis for the ongoing continuous dissolution experiment process and offer a methodology for optimizing the structure of the continuous dissolver.
2. Reaction Model Establishment and Parameter Setting
2.1. Discrete Element Method
Traditional mechanical research typically assumes a continuous medium and assumes that the research object consists of interconnected microclusters without any gaps. However, this assumption is not valid for bulk granular materials. To address this limitation, in 1971, Dr. Cundall proposed a numerical simulation method known as the Discrete Element Method (DEM) [10]. DEM is an approach that analyzes discrete particles based on principles derived from molecular dynamics. The fundamental concept involves breaking down the discontinuities into sets of rigid elements, with each element satisfying the equation of motion. By employing a time-step iterative method, the motion equations of each rigid element can be solved, ultimately providing information about the overall motion state of the discontinuity.
As Figure 1 illustrates, the complete discrete element iterative calculation process involves: (1) geometric structure movement, (2) particle generation, (3) particle–particle contact and particle–structure contact detection, (4) contact force calculation, (5) volume force/field force calculation, (6) particle motion calculation, (7) bond updates.
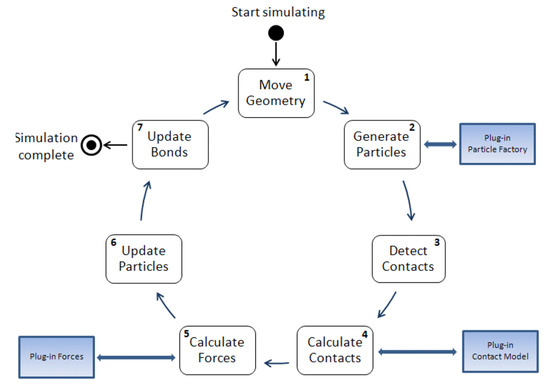
Figure 1.
Discrete element iterative calculation process.
Contact variables in our study include the normal overlap (δn) and the tangential overlap (δt). The normal overlap is measured in length dimensions, while the tangential overlap is measured in length dimensions in two directions and in area dimensions in three directions. The contact force between objects consists of various components, including elastic force, friction force, damping force, electrostatic force, van der Waals force, and viscous force. In our research, the collision process between materials is relatively simple, and we only consider elastic force, friction force, and damping force. The influence of the other forces is considered negligible in our study. Hence, our contact model follows the Hertz–Mindlin no-slip contact model [29].
2.2. Establishment of Reaction Kinetics
In this study, the kinetic model of the dissolution reaction is established based on experimental data obtained from dissolution reaction experiments. The model parameters are determined through curve fitting. The dissolution reaction experiments conducted in this study encompass four different types: the effect of stirring speed on the dissolution process; influence of temperature on the dissolution process; impact of nitric acid concentration on the dissolution process; change in the solid surface area of the pellet during the reaction [29]. For each calculation, a single pellet is dissolved in a specific volume of nitric acid solution using a batch process. The surface area of the pellet and the concentration change curve of uranium (U) are obtained through relevant measurement methods.
The kinetic model of the reaction between UO2 and nitric acid solution was designed using the following empirical reaction formula:
UO2[s] + 3HNO3 = UO2(NO3)2 + 0.5NO[g] + 0.5NO2[g] + 0.5H2O[l]
In chemical reaction kinetics, the rate equation commonly utilizes the Arrhenius kinetics form, which includes an exponential term for the reaction coefficient and a term for the reactant concentration order. However, the equation mentioned above represents an apparent overall reaction equation rather than a fundamental elementary reaction equation. Consequently, the reaction coefficient term employs a double exponential term subtraction to account for the possible forward and reverse reactions.
Additionally, the equation incorporates a factor that accounts for the contact surface area in gas/liquid/solid reactions. This includes the changes in the reaction surface area of the solid itself and the influence of gas generation on the contact area between the solid and liquid. Moreover, for non-elementary reactions, the order of the reactant concentration does not necessarily have to be an integer.
The equation for the chemical reaction rate is presented below. The first term of the reaction model is the Arrhenius form of the reversible reaction, the second term represents the nitric acid concentration term, the third term denotes the initial surface area term of the pellet, the fourth term is the reaction surface area correction term, and the final term signifies the correction item for the solid–liquid contact area:
Reaction area correction: According to the experimental results concerning the solid surface area of the pellets during the reaction, the pellets form a porous state, resulting in the solid surface area first increasing and then decreasing. A piecewise function is used to describe the changes in the solid surface area, as indicated below:
The piecewise function must satisfy the following relationships at several special state points:
- when ε = εmax, φ1 = φ2,
- when ε = 100, φ2 = A2 + B2 + C2 = 0.
During the dissolution reaction, the gas phase product covers a certain area of the solid surface, thus the actual reaction area of solid–liquid contact is reduced, and the reaction area is further influenced by the liquid volume fraction on the solid surface. The experimental data contain the results of the reaction process at various stirring speeds. Here, the functional relationship between the volume fraction of the liquid phase to the solid phase surface and the stirring speed is established, as shown below:
In actual rotary drum dissolver equipment, the rotation speed of the drum is considerably slower than the stirring speed used in the experimental dissolution of a single pellet. Consequently, it can be assumed that the pellets are in a non-stirring state, leading to a solid–liquid contact area correction factor of 0.5. The reaction kinetic model described above involves 14 parameters that require calibration. Mathematical regression calculations are performed on these model parameters using experimental data. The fitting process yields the following results, as presented in Table 1.

Table 1.
Calibration results of reaction kinetic model parameters.
In the discrete element model, detailed calculations are performed to determine the movement and accumulation state of particles. However, the model is unable to calculate the distribution of the flow field and concentration of the solution. Therefore, it is necessary to develop a mathematical model and calculation program to determine the composition and mass change of the solution. The mathematical model for the solution in the discrete element model is based on the following assumptions: ① Mass conservation and component conservation calculations are based on the fully mixed-flow assumption. With the exception of nitric acid, the concentration distribution of solution components is not considered, and it is assumed that the solution concentration is uniform throughout the equipment. ② When calculating the reaction rate of pellet particles, it is assumed that the concentration of the nitric acid solution in the drum follows a linear distribution from the inlet to the outlet. ③ During the dissolution process, the volume of the solution in the equipment remains constant. ④ Pellets are removed from the system when they reach the top of the drum or when the dissolution level exceeds 99%. By considering these assumptions, the mathematical model and program can determine the composition and mass change of the solution in the discrete element model.
The mass and composition conservation equations and closed equations of the nitric acid solution are as follows:
The particle size of the pellets will gradually decrease during dissolution in the calculation process. The calculation time step of the DEM will also fall, maintaining the calculation time step at 20% of the Rayleigh time step.
2.3. Physical Model
In the DEM, a representation of a cylindrical pellet with a diameter of 8 mm and a height of 13 mm was constructed by the combination of multiple spheres, as illustrated in Figure 2. The simplified dissolver structure is depicted in Figure 3.
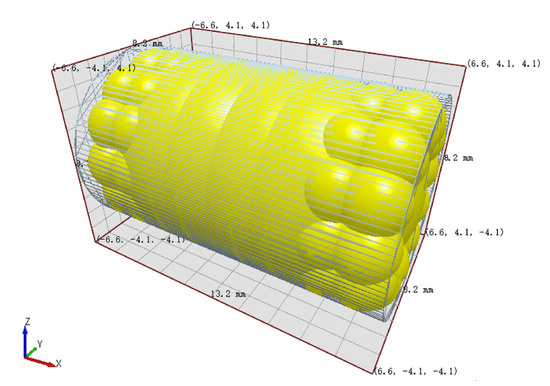
Figure 2.
Pellet model.
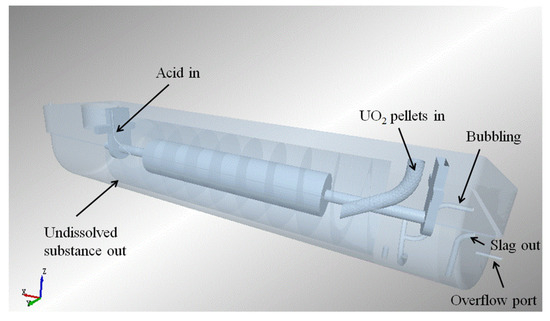
Figure 3.
Diagram of dissolver.
Figure 4 illustrates the main components of the dissolver. It primarily consists of a U-shaped groove, an upper cover, and a rotating drum. The U-shaped groove and the upper cover together form the dissolving cavity, which serves as the main space for the dissolution process. The rotating drum is positioned at the bottom of the dissolving cavity. It is composed of spiral blades, a rotating drum shell, and a rotating shaft. The spiral blades play a crucial role in mixing and stirring the solution and solid particles. The lower section of the U-shaped groove contains a heating layer, which helps to maintain the desired temperature for the dissolution process. The rotation of the drum is driven by a motor through the reversing gear and the reducer, enabling the movement and mixing of the solution and solid particles. The dissolver also features various pipeline interfaces, including a solid powder inlet for introducing solid pellets, an acid inlet for adding nitric acid solution, a liquid outlet for removing the dissolved solution, a tail gas outlet for expelling gases, a bubbling port for introducing gas into the solution, a slag discharge port for removing solid residues, and temperature and pressure test ports for monitoring and control.
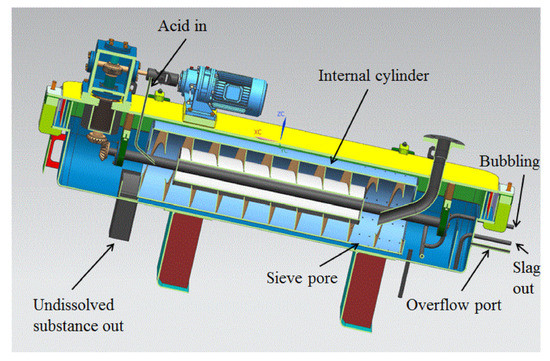
Figure 4.
Three-dimensional model of the dissolver.
The operating process of the equipment is as follows: UO2 pellets are injected into the dissolver through the solid feed port at a specific frequency. The injected UO2 pellets are continuously pushed from the right to the left by the rotation of the spiral blade. As the UO2 pellets move along the dissolving cavity, they come into contact with the nitric acid, leading to the gradual dissolution of the pellets. Nitric acid is added at the last stage of the spiral blade near the rotating shaft on the left-hand side of the drum. As the UO2 pellets dissolve, the resulting uranyl nitrate solution passes through sieve holes in the spiral blades. The dissolved uranyl nitrate solution eventually flows out through the overflow port, which allows continuous removal of the solution from the dissolving cavity. The gas produced during the dissolution process is directly discharged from the gas outlet. The gas is further processed and treated by a gas treatment device to eliminate any harmful components or emissions. This operating process allows for the efficient dissolution of UO2 pellets into a solution of uranyl nitrate while removing any generated gases and maintaining a continuous flow of the solution.
2.4. Simulated Operating Conditions
In this study, temperature changes in the dissolver are not considered. In actual operation, temperature control methods are employed to maintain the reactor at the intended operating temperature of 90 °C. To simplify the model and avoid the need for an energy equation, the model is set to a constant temperature of 90 °C. Furthermore, the density of the solution is related to the concentration of nitric acid and uranyl nitrate. Considering time efficiency, the simulation process was accelerated by a factor of 100. This acceleration allows for faster simulations without compromising the overall results and analysis. By assuming a constant temperature and accelerating the simulation, the model focuses on the key aspects of the dissolution process and allows for more efficient calculations within the given time frame. The operational conditions are displayed in Table 2, while the particle properties are presented in Table 3.
Table 2.
Operating conditions.
Table 3.
Particle properties.
2.5. Reaction Model Verification
2.5.1. Comparison of Single Pellet Dissolution Experiments
Results from the parameter calibration experiment used in this study were derived solely from the dissolution of a single uranium pellet. A comparison between the experimental data and the results obtained from the calibrated kinetic reaction model is presented in the following figures.
In Figure 5 and Figure 6, the experimental data are represented as points, while the results from the kinetic reaction model are shown as lines. Figure 5 specifically compares the reaction rates at different stirring speeds. The kinetic reaction model generates a smooth curve, indicating the expected trend. However, it is observed that the experimental data points at 200–400 rpm are lower than the kinetic reaction model between the 100 and 150 min marks. The experimental data points are spread on both sides of the reaction kinetics lines, resulting in a relative deviation of 14.64%. Overall, this suggests that the simulation is reasonably accurate in capturing the trend and behavior of the reaction rates for different stirring speeds. Figure 6 displays a comparison of reaction rates at different temperatures. For most temperature points (45 °C, 75 °C, and 90 °C), the experimental data points are scattered on both sides of the kinetic reaction model lines, indicating some level of consistency. However, at 60 °C, the experimental data consistently fall below the simulated results. Therefore, it can be concluded that the model exhibits inaccuracies under certain conditions. The overall deviation between the simulated and experimental results in Figure 6 is 26.54%. Despite the observed deviations, both figures show that the kinetic reaction model can effectively capture the relationship between the UO2 dissolution rate and stirring speed, as well as the reaction temperature. In general, the calculated results from the model align reasonably well with the experimental data.
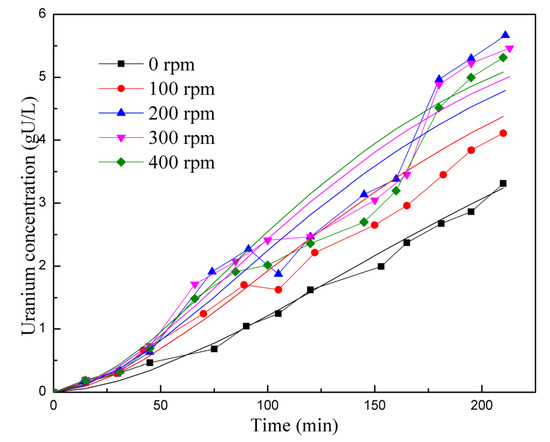
Figure 5.
Comparison of reaction rates at different stirring speeds.
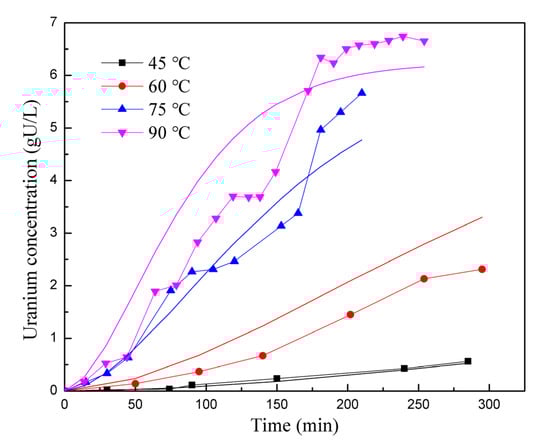
Figure 6.
Comparison of reaction rates at different temperatures.
Figure 7 displays the deviation distribution of data points for all the reaction rate experiments. The graph reveals that the experimental data points are not uniformly distributed on both sides of the diagonal line. Instead, deviations follow specific patterns in different areas, suggesting potential explanations: There might be a mechanism or factor that affects the reaction rate during the dissolution process, which is not considered in the simulation. This omission could lead to calculated results being generally higher than the measured data in the middle stage of the reaction, while in the latter stage, the calculated results are mostly lower than the measured data. In other words, the observed deviations could be due to the influence of unaccounted factors or mechanisms on the reaction rate.
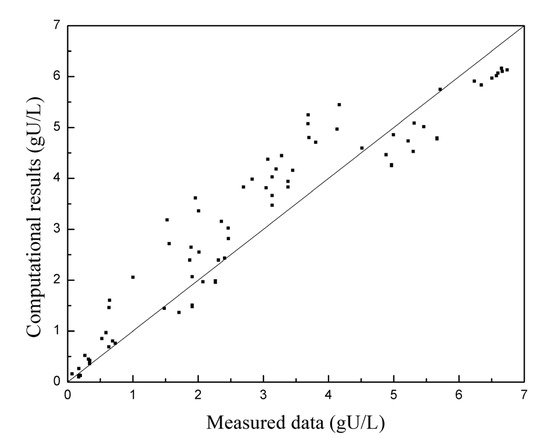
Figure 7.
Deviation distribution of all reaction rate experiment data points.
2.5.2. Comparison of Continuous Dissolution Experiments
After obtaining the results from the numerical simulation, a continuous dissolution experiment was conducted. The process of continuous dissolution is the ongoing dissolution of uranium pellets within a rotary drum continuous dissolver, as depicted in Figure 8. The simulation results were utilized to determine the residence time of the continuous dissolution experiment, which was set at 8 h. In order to expedite the attainment of equilibrium, the pre-equilibration method was employed, conserving raw materials. The initial conditions of the experiment were similar to those used in the simulation.
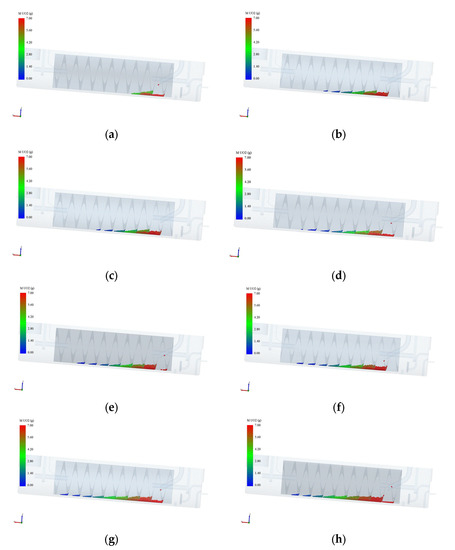
Figure 8.
Pellet dissolution process. (a) Simulation time: 2 hours; (b) Simulation time: 4 hours; (c) Simulation time: 6 hours; (d) Simulation time: 8 hours; (e) Simulation time: 10 hours; (f) Simulation time: 12 hours; (g) Simulation time: 20 hours; (h) Simulation time: 28 hours.
The complete experiment, including pre-equilibration and continuous dissolution, took a total of 16.5 h. During this time, 8.5 h were dedicated to pre-equilibration, while the remaining 8 h were allocated to continuous dissolution. At the conclusion of the experiment, 2.31 kg of undissolved pellets remained, encompassing both pellets retained within the dissolver and discharged pellets. Meanwhile, a total of 14.19 kg of pellets were dissolved.
Using the mass change data from the P9 pellet in Figure 9, which approximated the equilibrium state, the theoretical particle dissolution process was calculated. According to these calculations, 12.66 kg of pellets should have been dissolved within the 8 h residence time. However, the actual mass of dissolved pellets indicated an error of 10.8% when compared to the simulation results. Notably, the experimental results exhibited a higher dissolution rate than the simulation.
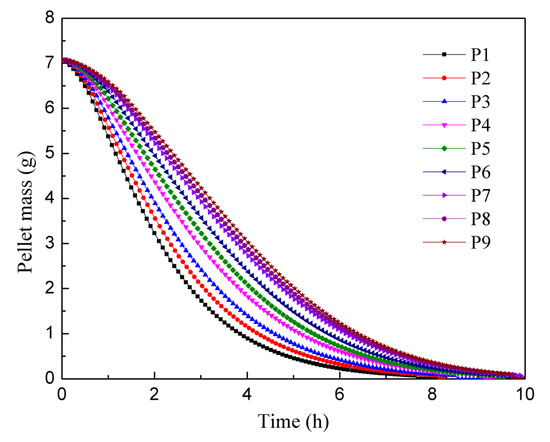
Figure 9.
Mass change curve of the first feed particle in each pitch area.
This discrepancy can be attributed to several factors. In the continuous rotary dissolver, the acid comes into countercurrent contact with the pellets, and the rotation of the drum encourages the pellets to roll. These mechanisms enhance the solid–liquid mass transfer process, which was not considered in the single pellet dissolution process. Therefore, this omission leads to the incorrect presumption that the pellets would dissolve more slowly than they actually did in reality.
3. Results and Discussion
3.1. Pellet Dissolution Time
Figure 8 illustrates the pellet dissolution process as calculated in the simulation. In this simulation, the initial liquid holding capacity is approximately 21.5 L, with a 6 mol/L concentration of nitric acid, and a residence time of 10 h and 40 min. From the diagram, it can be observed that as the pellets enter the drum and move upward while the drum rotates, their quality gradually decreases until complete dissolution is achieved. The pellets directly enter the second stage of the drum upon entry, as the pellet inlet is designed to extend deeper into the drum, preventing the pellets from falling off the end into the shell. By comparing the diagrams at t = 6 h and t = 28 h, it is evident that the average mass of the first batch of pellets reaching the fifth stage at t = 6 h is approximately 1 g, while the average mass of the pellets at the fifth stage at t = 28 h is around 3 g. This phenomenon can be attributed to the changes in concentration of nitric acid and uranium concentration during the dissolution process. Initially, the concentration of nitric acid is relatively high, while the uranium concentration is low. As the nitric acid is continuously consumed in the reaction, the concentration of nitric acid of the solution in the drum decreases, while the uranium concentration increases. Consequently, the reaction rate decreases, resulting in a reduction in the speed of pellet dissolution. This explains the observed increase in average pellet mass at later stages of the dissolution process. Overall, the simulation provides insights into the changing dynamics of pellet dissolution, showcasing the effects of the concentration of nitric acid and uranium concentration on the reaction rate and the subsequent rate of pellet dissolution.
Figure 9 presents a graph depicting the quality change in the first pellet in each pitch area. The graph reveals that the pellet dissolution process is faster in the initial stages, and as pellets are added later, the rate of dissolution slows down. This phenomenon can be attributed to the solid–liquid contact area. During the dissolution process, the internal pores of the pellet expand, leading to an increase in surface area. Consequently, the solid–liquid contact area initially increases during the expansion stage of the pellet, but gradually decreases as the pellet dissolves [30]. In the presented graph, the P9 particles are added approximately 10 h later than the P1 particles. After 4 h of dissolution, the P1 particles only weigh around 1 g, whereas the P9 particles still weigh about 3 g. This discrepancy indicates that changes in concentration of nitric acid and uranium concentration have a significant impact on the rate of pellet dissolution. The full mixed flow model assumes that the nitric acid concentration is uniformly distributed in the axial direction of the drum. Consequently, pellet particles entering later experience a slower dissolution rate. However, regardless of when they were added, all pellets reach complete dissolution within 10 h. Comparing the results of the two experiments, it can be observed that a single uranium pellet in an excess of 6 mol/L nitric acid solution takes approximately 6 h to fully dissolve. It is reasonable to expect complete dissolution to occur after 10 h in a solution with a lower concentration of nitric acid and higher uranium concentration. These findings highlight the influence of the concentration of nitric acid and uranium on the dissolution rate of uranium pellets.
3.2. Changes in Nitric Acid Concentration and Uranium Concentration
Figure 10 displays the changes in nitric acid concentration over a continuous operation period of 30 h. The concentration of nitric acid of the solution initially decreases rapidly and then slows down. Towards the end of the experiment, the concentration of nitric acid curve becomes nearly flat, indicating the attainment of a stable state. The average nitric acid concentration in the solution, once it reaches this stable state, is about 2.8 mol/L. It is important to note that the actual consumption of nitric acid in the process of dissolving uranium is a highly complex phenomenon. Apart from the various reactions between uranium and nitric acid, the NO2 produced by the reaction can also react with water to form nitric acid and nitrous acid, which further react with uranium, concentration of nitric acid, and other factors related to the type of dissolver and aeration. In this study, the reaction equation used was selected based on experience, which means there may be some inherent error in predicting acid consumption. In future research, additional continuous dissolution experiments will be conducted to further refine and optimize the reaction model, allowing for a more accurate prediction of acid consumption. These experiments will contribute to enhancing the understanding of the dissolution process and improving the reliability of the reaction model.
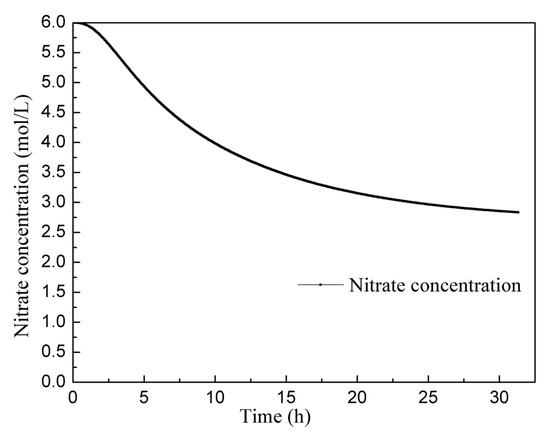
Figure 10.
Change in the nitric acid concentration curve over 30 h.
Figure 11 depicts the uranium concentration curve over a continuous operation period of 30 h. Initially, the uranium concentration exhibits a rapid increase and then gradually rises at a slower rate, reaching a uranium concentration of 243 gU/L at 30 h. It is notable that the induction period in this case is only about an hour. One possible reason for this short induction period is the assumption made in the simulation calculations that the solution concentration is uniform. This assumption neglects the process of component diffusion within the solution. In reality, the concentration of acid surrounding the pellet is lower compared to other areas, resulting in a slower dissolution rate. This discrepancy can manifest as a shorter induction period. Considering the non-uniform concentration distribution around the pellet, it is expected that the dissolution rate would be slower in the region with a lower acid concentration. This phenomenon may contribute to the observed differences, including the shorter induction period. Accounting for such non-uniform concentration effects would likely improve the accuracy of the dissolution model and provide a more comprehensive understanding of the uranium dissolution process.
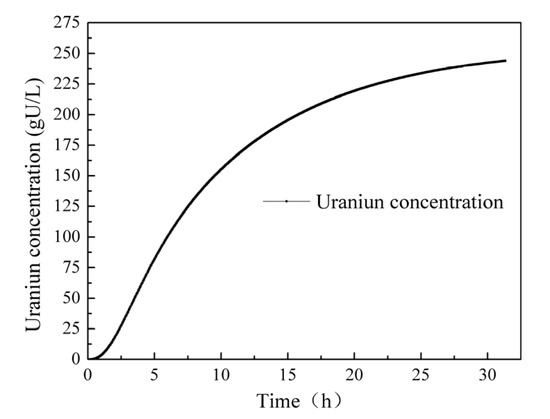
Figure 11.
Change in the uranium concentration over 30 h.
4. Conclusions
Based on the experimental data of UO2 pellet batch dissolution, a kinetic model for the dissolution of uranium pellets was developed. This model was then utilized to simulate the dissolution process of UO2 pellets in a continuous drum dissolver using the discrete element method. The simulation results were further validated through experimental verification. Subsequently, an analysis was conducted on the changes in the concentration of nitric acid and UO2 pellets in the dissolver over a continuous operation period of 30 h, as well as the quality changes observed in the pellets. The main conclusions derived from this study are as follows:
- Based on the batch dissolution data of individual UO2 pellets, a kinetic model was developed to describe the dissolution reaction of these pellets. Subsequently, a dissolution reaction calculation program was created using the discrete element model to simulate the uranium dissolution process in a rotary drum dissolver.
- Due to the full mixed flow model and the assumption that the nitric acid concentration was uniformly distributed axially in the drum, the pellet dissolution rate in the experiment was higher than the simulation results, and the deviation between the simulation and the experiment was 10.8%. In the future, it will be necessary to consider the influence of the rotation of the drum and the countercurrent contact between the solids and liquids in the kinetic reaction model.
- When the dissolver reaches equilibrium, the pellets require 10 h to dissolve completely under standard operating conditions. The dissolver takes 30 h to reach the equilibrium. After 30 h, the uranium concentration in the dissolver is 243 gU/L and the concentration of nitric acid is 2.8 mol/L.
By combining the kinetic model with the discrete element method in a dissolution reaction calculation program, this study successfully achieved the continuous dissolution of uranium in a rotary drum dissolver. This research contributes to the development of a comprehensive understanding of uranium dissolution, facilitating future optimization and control of the process.
Future Plan:
Model Optimization: The next step is to continue optimizing the dissolution model by incorporating the influence of solid–liquid two-phase flow state on the dissolution process. This consideration will lead to a more comprehensive and accurate representation of the system dynamics.
Dissolver Structure Optimization: Further improvements can be made to the structure of the rotary drum continuous dissolver. Currently, the effective volume of the device is relatively lower, and the size of the device is larger. Efforts should be made to enhance the efficiency of the dissolver by optimizing its design and increasing its effective volume while reducing its physical footprint.
Author Contributions
Conceptualization, W.Z.; formal analysis, T.L.; investigation, J.Z.; data curation, T.L.; writing—original draft preparation, T.L.; writing—review and editing, C.Z.; supervision, F.L.; project administration, T.Y. All authors have read and agreed to the published version of the manuscript.
Funding
National Key R&D Program of China (2022YFB4603000).
Data Availability Statement
The data is unavailable due to privacy or ethical restrictions.
Conflicts of Interest
The authors declare no conflict of interest.
Nomenclature
| A1, B1 | correction factor parameter of the low percentage of dissolved volume |
| A2, B2, C2 | correction factor parameters of the high percentage of dissolved volume |
| Ci | stoichiometric number of each component of the solution |
| E1, E2 | reaction activation energy, J/mol |
| E1,ref, E2,ref | reaction activation energy at experimental temperature, J/mol |
| Fin,i | inlet flow rate of nitric acid, kg/s |
| Fout,i | outlet flow rate, kg/s |
| [HNO3] | concentration of nitric acid, mol/L |
| K1, K2 | pre-factor of reaction rate |
| Karea | initial surface area of pellets, m3 |
| M | total mass of solution, kg |
| Mi | mass of a certain solution component, kg |
| MWi | molar mass of each component of the solution, kg/kmol |
| R | reaction rate of pellets, kmol/s |
| S1 | stirring factor |
| T | reaction temperature, 300 K |
| Tref | experimental temperature, K |
| V | total volume of solution, 0.0215 m3 |
| Yi | mass fraction of the components of the solution in the dissolver, kg/kg |
| Yin,i | mass fraction of the components at the inlet of the nitric acid, kg/kg |
| αgas,max | maximum gas volume fraction on the solid surface without stirring, the value is 0.5 |
| αliquid | correction factor of solid–liquid contact area |
| Γ | order of reactant concentration |
| Ε | percentage of dissolved volume, % |
| εmax | percentage of dissolved volume at the maximum surface area of the pellet, % |
| Ρ | density, kg/m3 |
| Φ | reaction surface area correction factor |
| φ1 | correction factor for low percentage of dissolved volume |
| φ2 | correction factor for high percentage of dissolved volume |
| Ω | stirring speed, rpm |
| Subscripts | |
| I | subscript of solution component, HNO3, UO2(NO3)2, H2O |
References
- Cheng, Y.M.; Xia, S.; Liao, X.P.; Shi, B. Adsorptive Recovery of Uranium from Nuclear Fuel Industrial Wastewater by Titanium Loaded Collagen Fiber. Chin. J. Chem. Eng. 2011, 19, 592–597. [Google Scholar]
- Ye, G.A.; Jiang, Y.Q. Status and Development of Nuclear Fuel Reprocessing Technology in China. China Nucl. Ind. 2015, 012, 26–30. (In Chinese) [Google Scholar]
- Lu, W.H. Analysis of Spent Fuel Reprocessing Current Status in the World. Jiangxi Chem. Ind. 2018, 140, 16–18. (In Chinese) [Google Scholar] [CrossRef]
- Ye, G.A.; Zheng, W.F.; He, H.; Ma, J.; Wang, J. Status and Development of Technology on Reprocessing Spent Nuclear Fuel in China. At. Energy Sci. Technol. 2020, 54, 75–83. (In Chinese) [Google Scholar]
- Wu, Z.Q.; Qin, Y.Q.; Liu, Y.; Hou, Y.Y. Spent Fuel Batch Dissolver Enlarging Design and Hydraulics Experimental Investigation. At. Energy Sci. Technol. 2016, 50, 1480–1485. (In Chinese) [Google Scholar] [CrossRef]
- Gelatar, J.K.; Kumar, B.; Sampath, M.; Kumar, S.; Kamachi, U.; Natarajan, R. Dissolution of intact UO2 pellet in batch and rotary dissolver conditions. J. Radioanal. Nucl. Chem. 2015, 303, 1029–1035. [Google Scholar] [CrossRef]
- Jiang, S.J.; Ren, F.Y. Nuclear Fuel Reprocessing Engineering; Atomic Energy Press: Beijing, China, 1995; pp. 57–58. (In Chinese) [Google Scholar]
- Ren, F.Y.; Zhou, Z.X. Foreign Nuclear Fuel Reprocessing; Atomic Energy Press: Beijing, China, 2006; pp. 82–84. (In Chinese) [Google Scholar]
- Huang, Y.C.; Tang, J.; Xie, Q.R.; Ma, Y.F. Application of Computational Fluid Dynamics in Chemical Engineering. Mod. Chem. Ind. 2007, 27, 65–74. (In Chinese) [Google Scholar] [CrossRef]
- Hai, H.; Spencer, B.; Hales, J. Discrete element method for simulation of early-life thermal fracturing behavior in ceramic nuclear fuel pellets. Nucl. Eng. Des. 2014, 278, 515–528. [Google Scholar] [CrossRef]
- Sun, L.; Podila, K.; Chen, Q.; Bayomy, A.M.; Rao, Y.F. Computational Fluid Dynamics Modeling of Fire and Human Evacuation for Nuclear Applications. J. Nucl. Eng. Radiat. Sci. 2020, 6, 011112. [Google Scholar] [CrossRef]
- Wang, C.; Liu, H.; Wang, J.; Wu, Z.B.; Wang, L. Three-dimensional physical simulation experiment study on carbon dioxide and dissolver assisted horizontal well steam stimulation in super heavy oil reservoirs. J. Pet. Explor. Prod. Technol. 2016, 6, 825–834. [Google Scholar] [CrossRef]
- Li, Y.; Chen, R.; Guo, K.; Tian, W.X.; Qiu, S.Z.; Su, G.H. Numerical analysis of the dissolution of uranium dioxide by molten zircaloy using MPS method. Prog. Nucl. Energy 2017, 100, 1–10. [Google Scholar] [CrossRef]
- Bertolotto, S.; Szenknect, S.; Lalleman, S.; Magnaldo, A.; Raison, P.; Odorico, M.; Podor, R.; Claparede, L.; Dacheux, N. Effect of surface orientation on dissolution rate and surface dynamics of UO2 single crystals in nitric acid. Corros. Sci. 2020, 176, 109020. [Google Scholar] [CrossRef]
- Mohun, R.; Desgranges, L.; Canizarès, A.; Raimboux, N.; Duval, F.; Omnee, R.; Jégou, C.; Miro, S.; Simon, P. Investigating the role of irradiation defects during UO2 oxidative dissolution. J. Nucl. Mater. 2018, 509, 305–312. [Google Scholar] [CrossRef]
- Ikeda, Y.; Yasuike, Y.; Nishimura, K.; Hasegawa, S.; Takashima, Y. Kinetic study on dissolution of UO2 powders in nitric-acid. J. Nucl. Mater. 2015, 224, 266–272. [Google Scholar]
- Ning, Y.; Luo, Z.; Li, Y.; Zhang, Y. Alkaline leaching characteristics of uranium from Lincang coal: Correlation with the dissolution of coal humic substances. Fuel 2021, 305, 121507. [Google Scholar] [CrossRef]
- Yoo, T.; Steven, D.S.; Ken, C. Analysis and Modeling of Oxide Reduction Processes for Uranium Oxides. J. Nucl. Mater. 2021, 545, 152625. [Google Scholar]
- Ou, T.; Peng, H.; Su, M.; Shi, Q.; Tang, J.; Chen, N.; Chen, D. Fast and Efficient Removal of Uranium onto a Magnetic Hydroxyapatite Composite: Mechanism and Process Evaluation. Processes 2021, 9, 1927. [Google Scholar]
- Gunnell, L.; Manwaring, K.; Lu, X.; Reynolds, J.; Vienna, J. Machine Learning with Gradient-Based Optimization of NuclearWaste Vitrification with Uncertainties and Constraints. Processes 2022, 10, 2365. [Google Scholar]
- Zhu, M.; Mao, H.; Wang, Y.; Guo, M.; Li, B.; Wu, F.; Tian, J.; Ma, D. Study on the Equivalence of Metallic-Cerium-Simulated Uranium-Aerosol Generation under Fire. Processes 2023, 11, 419. [Google Scholar]
- Thomas, D.; Laurent, C.; Szenknect, S.; Philippe, M.; Nicolas, D. Dissolution of Th0.25U0.75O2 sintered pellets: Impact of nitrate ions and nitrous acid. Hydrometallurgy 2021, 204, 105717. [Google Scholar] [CrossRef]
- Li, W.; Skinner, R.; Megna, K.; Chen, J.; Perera, S.; Murimboh, J.; Waller, E.; Erhardt, L.; Cornett, R.J. In vitro dissolution study of uranium dioxide and uranium ore with different particle sizes in simulated lung fluid. J. Radioanal. Nucl. Chem. 2009, 279, 209–218. [Google Scholar] [CrossRef]
- Perevalov, S.; Toropchenova, E. Microwave-assisted dissolution of ceramic uranium dioxide in TBP–HNO3 complex. J. Radioanal. Nucl. Chem. 2013, 298, 1613–1618. [Google Scholar] [CrossRef]
- Zhao, Y.F.; Chen, J. Studies on the dissolution kinetics of ceramic uranium dioxide particles in nitric acid by microwave heating. J. Nucl. Mater. 2008, 373, 53–58. [Google Scholar] [CrossRef]
- Bao, Y.Y.; Li, T.C.; Wang, D.F.; Cai, Z.Q.; Gao, Z.M. Discrete element method study of effects of the impeller configuration and operating conditions on particle mixing in a cylindrical mixer. Particuology 2020, 49, 146–158. [Google Scholar] [CrossRef]
- Verma, P.; Mahanty, B.; Ali, S.; Mohapatra, P. In situpreconcentration during the di-(2-ethylhexyl) phosphoric acid-assisted dissolution of uranium trioxide in an ionic liquid: Spectroscopic, electrochemical, and theoretical studies. Inorg. Chem. 2021, 60, 10147–10157. [Google Scholar] [CrossRef]
- Kim, J.; Yoo, T.; Kim, E.; Yoon, S. Smoothed particle hydrodynamics modeling and analysis of oxide reduction process for uranium oxides. Chem. Eng. Sci. 2022, 261, 117974. [Google Scholar] [CrossRef]
- Bao, Y.Y.; Lu, Y.; Cai, Z.Q.; Gao, Z.M. Effects of rotational speed and fill level on particle mixing in a stirred tank with different impellers. Chin. J. Chem. Eng. 2018, 26, 1383–1391. [Google Scholar] [CrossRef]
- Liu, F.; Zheng, W.F.; Zuo, C.; Yan, T.H. Kinetics of Dissolution Reaction of UO2 Pellets in Nitric Acid Solution. Hydrometall. China 2020, 39, 380–384. (In Chinese) [Google Scholar]


Disclaimer/Publisher’s Note: The statements, opinions and data contained in all publications are solely those of the individual author(s) and contributor(s) and not of MDPI and/or the editor(s). MDPI and/or the editor(s) disclaim responsibility for any injury to people or property resulting from any ideas, methods, instructions or products referred to in the content. |
© 2023 by the authors. Licensee MDPI, Basel, Switzerland. This article is an open access article distributed under the terms and conditions of the Creative Commons Attribution (CC BY) license (https://creativecommons.org/licenses/by/4.0/).