Article

Diagenesis and Diagenetic Mineral Control on Reservoir Quality of Tight Sandstones in the Permian He8 Member, Southern Ningwu Basin

1
School of Energy Resource, China University of Geosciences, Beijing 100083, China
2
Exploration and Development Research Institute, Huabei Oil Field Company, PetroChina, Renqiu 062552, China
*
Authors to whom correspondence should be addressed.
Processes 2023, 11(8), 2374; https://doi.org/10.3390/pr11082374
Submission received: 14 July 2023 / Revised: 4 August 2023 / Accepted: 4 August 2023 / Published: 7 August 2023

Abstract

:
The sandstone reservoirs of the He8 member within the Lower Permian Shihezi Formation are important targets for oil and gas exploration in the southern Ningwu Basin. This study utilized thin-section identification, scanning electron microscopy, and X-ray diffraction analysis to examine the petrological features and reservoir characteristics, and evaluate the impact of the mineral composition and diagenesis type on the porosity of the sandstone reservoir. Additionally, a multiple linear regression prediction model was developed to predict the distribution of promising sandstone reservoirs in the study area. The results of the analysis revealed that the sandstone of the He8 member is mainly composed of feldspathic lithic sandstone, followed by lithic sandstone. The main reservoir type is characterized by secondarily dissolved pores and micropores within kaolinite aggregates. The low porosity (ranging from 0.2% to 10.7%) and permeability indicate that the He8 member is a tight sandstone reservoir. This reservoir has undergone compaction, cementation, and dissolution diagenesis, and is presently in the stage of mesodiagenesis B. The rigid framework of quartz, the dissolution of feldspar grains, and the intergranular pores of kaolinite are significant contributors to reservoir quality and the main drivers of porosity. In this study, a multivariate linear regression model was developed based on the mineral content of quartz, feldspar, carbonate minerals, kaolinite, smectite, and rock fragments, which accurately predicts the porosity of the studied reservoirs. Based on this model, it was predicted that the north of the Jingle South sub-depression contains a favorable reservoir space in the tight sandstone reservoir of the He8 member. The findings of this study hold significant reference value in the quantitative characterization of tight sandstone reservoirs with similar depositional and diagenetic characteristics, and improving the prediction effect of favorable reservoirs.

1. Introduction

Tight sandstone gas is a significant contributor to the world’s oil and gas resources [1,2] due to its widespread distribution and vast reserves. In recent years, there have been significant discoveries of large gas fields in the Ordos Basin, specifically in Sulige, Daniudi, and Shenmu, with geological reserves exceeding 100 billion cubic meters [3] Considering the recent discoveries in the Ordos Basin, it is important to investigate the tight sandstone reservoirs in neighboring basins such as the Ningwu Basin. However, previous work in this area has mainly focused on the exploration and development of coalbed methane [4,5,6], while the basic characteristics of tight sandstone reservoirs in this region remain unclear. The study of tight sandstone reservoirs is gaining importance in oil and gas exploration [7]. These reservoirs exhibit widespread gas contents, but the degree of enrichment is primarily determined by their storage capacity [2]. It is generally believed that the degree of development of pores or fractures in tight sandstone reservoirs control the enrichment and high production of tight sandstone gas [8]. The fine characterization of the petrological characteristics of sandstone reservoirs and clarification of their impact on storage spaces are important in evaluating the quality of tight sandstone reservoirs. This is crucial for identifying sweet spot intervals and predicting favorable areas [9,10].
The composition and evolution of minerals determine the formation and distribution of sweet spot intervals in tight sandstone reservoirs [11]. Generally, medium to coarse-grained sandstone reservoirs with a high rigid particle content and good sorting exhibit better reservoir quality [12]. Authigenic clay minerals play a crucial role in controlling the preservation and destruction of reservoir space, which largely determines the microscopic pore structure characteristics and reservoir quality [10,13]. Huang et al. [14] believed that authigenic illite and kaolinite serve as indicator minerals associated with the dissolution of unstable grains such as feldspar and the development of secondary pores, which are beneficial to the preservation of secondary pores of mineral dissolution. Baker [15] and Griffiths et al. [16] observed the protective mechanism of chlorite attached to the surface of particles in the form of a pore liner or particle envelope for pores in sandstone reservoirs. However, little research has been conducted on the influence of mineral genesis on the sandstone reservoir space in the southern Ningwu Basin. In recent years, researchers have linked diagenesis evolution with mineral composition and logging response to predict high-quality sandstone reservoirs [11,17]. While machine learning methods require a large amount of data, which limits their use in predicting high-quality reservoirs in early exploration areas, multiple linear regression can effectively predict reservoir quality based on appropriate test data [18]. Therefore, in order to promote effective exploration in areas conducive to oil and gas development within the He8 member, it is necessary to clarify the main controlling factors of porosity evolution and the correlation between porosity and mineral content [11]. This will allow the prediction of the “sweet spot” within the He8 member of the study area.
This study analyzed the mineralogical characteristics, reservoir physical properties, and pore space types of tight sandstone reservoirs of the He8 member in the southern Ningwu Basin using scanning electron microscopy, thin section identification, and XRD test results. The specific aims of our work included: (1) clarifying the control mechanism of high-quality sandstone reservoir development from the perspective of sedimentation and diagenesis; (2) establishing a sandstone reservoir porosity prediction model based on mineral content using multiple linear regression, and (3) predicting favorable areas in the study area based on the model, in order to provide reference for further promoting the exploration and development of tight sandstone gas in the southern Ningwu Basin.

2. Geological Setting

The Ningwu Basin is located in the central part of northern China (Figure 1a), forming a pattern surrounded by the Lvliangshan Uplift in the west and the Wutaishan Uplift in the east (Figure 1b). The Ningwu Basin has a length of approximately 200 km and a width of 20–30 km, with a total area of approximately 4875.28 km2 [19]. The Ningwu South Block lies in the south of the Ningwu Basin, and can be divided into five tectonic belts based on their structural features, including the Zhongzhuang steep slope belt, the Jingyou slope belt, the Fengrun nosing structure belt, the Jingle south sub-depression, and the Ningwu sub-depression [4] (Figure 1b).
In the Ningwu Basin, the late Carboniferous–early Permian strata comprise the Benxi, Taiyuan, Shanxi, and Shihezi Formations in a stratigraphic sequence. Three coal-bearing formations, the Benxi, Taiyuan, and Shanxi Formations, are the source rocks of tight sandstone gas reservoirs in the study area. Vertically, the sandstone of the Shihezi Formation provides a reservoir for the formation of coal-bearing gas reservoirs. Based on sedimentary cycle characteristics, lithology, and logging curves, the Lower Shihezi Formation is divided into the He8, He7, He6, and He5 members from the bottom to the top [20]. Among them, the He8 member was the target layer of this study and contains interbedded gray and light gray mudstones and fine to medium-grained sandstones (Figure 2). The thickness of the He8 member of the Shihezi Formation in the study area ranges from 30 m to 99 m (average = 73 m), showing a gradual thinning trend from northeast to southwest (Figure 2). The sandstone accumulation thickness is higher in the Jingle south sub-depression and the northern part of the Zhongzhuang steep slope belt, with a cumulative thickness ranging from 34 m to 65 m (average = 44 m) (Figure 3).

3. Experimental Methods

All of the samples used in this study were collected from three different tectonic belts, the Fengrun nosing structure belt (NT1 and NT8 wells), the Jingle south sub-depression (NT2 and NT4 wells), and the Zhongzhuang steep slope belt (N7 well) (Figure 1 and Figure 2). A total of 60 samples were collected for XRD testing and thin-section identification, and 10 samples were collected for scanning electron microscopy (SEM) and mercury intrusion.

3.1. X-ray Diffraction Analyses

For XRD analysis, first, 5 g of sample was ground into a powder in an agate mortar. The powder was repeatedly washed with distilled water and then placed in a 2000 mL quartz crucible, to which, 1500 mL of distilled water was added and thoroughly mixed. The mixture was dried at 50 °C. Then, the upper part of the solution (<2 µm suspension) was aspirated into a centrifuge tube, centrifuged at 2500× g rpm for 20 min, and the sample of sediment particles (<2 µm) at the bottom of the centrifuge tube was extracted. The mineral content was semi-quantitatively determined using a Bruker D8 Advance X-ray diffractometer with a Cu target (parameters: Kα1 = 1.54060 A°, 2.2 kW, 40 kV, tube flow 40 mA, scanning range 0–167°, step width 0.037). The whole rock composition and clay mineral content were determined based on the peak area on the diffraction spectrum, with a relative error of 5%.

3.2. Thin-Section Analyses

Thin-section analysis is used to determine the mineralogical composition, diagenetic relationships, and pore types of sandstones [21,22]. Sandstone samples were sliced, cast, and made into thin sections. The samples were identified under a polarized optical microscopy to determine the type of cementation, pore structure, and mineral type. To highlight the pores, all thin sections were vacuum-impregnated with blue epoxy resin, and semi-stained with alizarin red for carbonate mineral identification, and evaluated using an optical microscope. Under the microscope, blue indicates pore space, and red indicates calcite cementation.

3.3. SEM Analyses

For SEM observation, 11 sandstone samples were obtained from wells NT1 and NT8 along the bedding and vertical bedding with an area of approximately 1 cm × 1 cm and a thickness of approximately 5 mm, respectively. The sample was placed in a vacuum coating machine for vacuum pumping, and then gold plating was carried out on the fresh fractures of the sample. These samples’ pore and mineral morphology were observed using an FE-SEM (quantum 200F SEM). The SEM was operated in low-vacuum mode. The accelerating voltage was 30 kV and the working distance was approximately 10 mm. The SEM resolution was 1.2 nm. Then, the minerals and pores of the sample were observed at a magnification of 30 to 6000 times. The specific operating parameters of the SEM are described in previous studies [23,24,25].

3.4. Porosity and Permeability Analyses

For porosity and permeability analyses, all samples were prepared into cylindrical pieces (2.5 cm in diameter, 3 cm in length), dried, and placed in a pulse permeameter (PoroPDP-200) for the analyses. Mercury intrusion analysis was conducted using a AutoPore IV 9500. The sample was dried to a constant weight at 105 ℃ before testing, with a maximum experimental pressure of 200 MPa. Details of this methodology have been described in previous studies [25].

4. Results

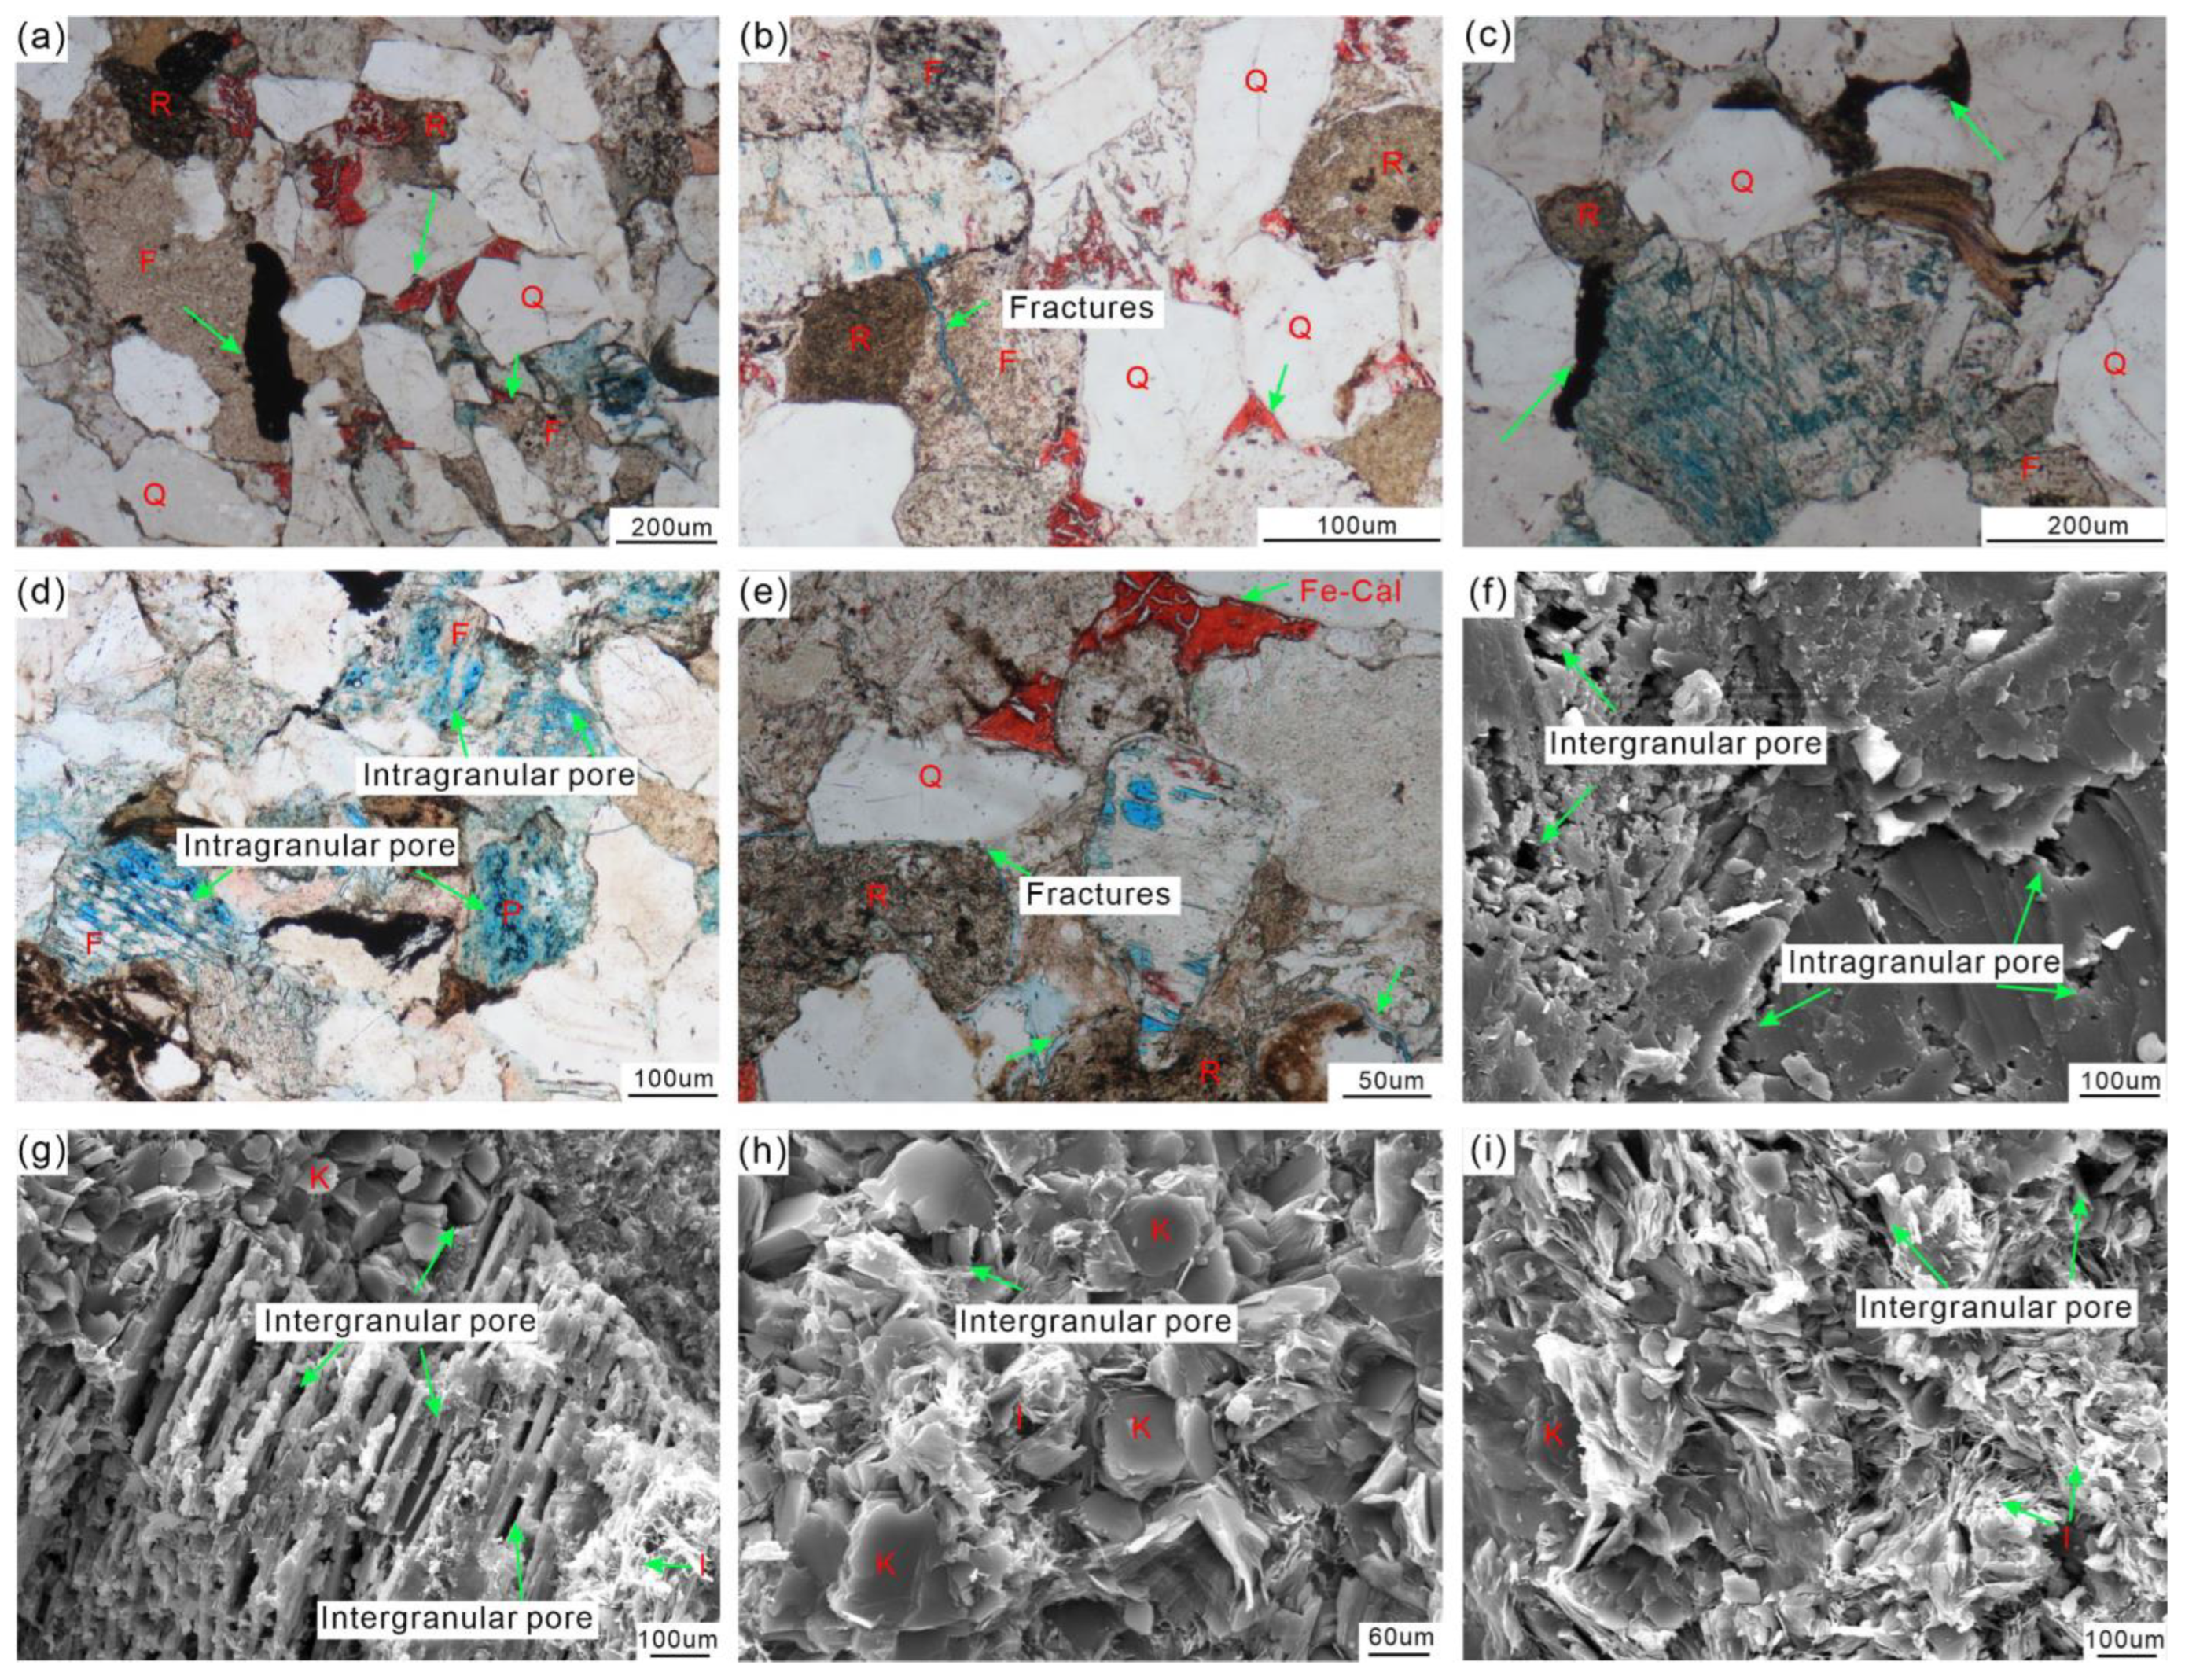
4.1. Petrological Features

The studied samples from the He8 member in the southern Ningwu Block exhibit overall characteristics of a high quartz content, abundant rock fragments, and low feldspar content (Figure 4a). The quartz content ranges from 36.1% to 64.3% (average = 57.4%). The percentage of rock fragments ranges between 16.8% and 37.4% (average = 29.2%), with the fragments being mainly composed of acidic extrusive rocks, followed by metamorphic rocks, intermediate basic extrusive rocks, sedimentary rocks, and a small amount of tuff. The feldspar content ranges from 6.8% to 31.4% (average = 13.4%), and the potassium feldspar content is extremely low (0% to 5%, average = 2.2%). The sandstones of the He8 member are dominated by feldspathic lithic sandstones, followed by lithic sandstones, with only two samples of feldspathic quartz sandstone and lithic feldspar sandstone (Figure 4b). The grain size is mainly medium to fine sand with good sorting, and a roundness between circular and sub circular particles. The main type of cementation is contact cementation. The argillaceous matrix is 0~18%, the cement content is 1~6%, and it is dominated by calcareous material. In addition, there are few authigenic siliceous minerals and clay minerals, and the clay minerals are characterized by being kaolinite-rich (34–80%, average 57.5%), chlorite-poor (5–20%, average 10.0%), and illite-poor (2–24%, average 10.8%).

4.2. Reservoir Porosity and Permeability

The porosity of the sandstone samples from the He8 member in the study area ranges from 0.20% to 10.70% (average = 4.76%), which is classified mainly as low to extremely low porosity. The permeability ranges from 0.01 × 10⁻³ to 0.26 × 10⁻³ µm2 (average 0.08 × 10⁻³ µm2), mainly belonging to a low to ultra-low permeability, with typical tight sandstone characteristics. There is a relatively strong positive correlation between the porosity and permeability of the sandstone reservoirs in the analyzed samples (Figure 5a), indicating that pores are the main reservoir space. The feldspathic lithic sandstones have relatively favorable physical properties with porosity ranging from 1.2% to 10.7% (average = 5.5%) and permeability ranging from 0.01 × 10⁻³ µm2 to 0.12 × 10⁻³ µm2 (average = 0.078 × 10⁻³ µm2). The porosity greater than 7% accounts for approximately 35.7% in this group (Figure 5b), which is similar to the proportion of sandstones in the He8 member of the Linxing–Shenfu gas field in the northeastern Ordos Basin, where a trillion-square-meter-scale gas field has already been built (porosity range from 2% to 14%) [20]. Compared to feldspar lithic sandstone, the lithic sandstone reservoirs have relatively poor physical properties with porosity ranging from 1.4% to 5.7% (average = 3.7%), and the permeability is mainly distributed between 0.01 × 10⁻³ µm2–0.09 × 10⁻³ µm2 (average = 0.045 × 10⁻³ µm2). In addition, the overall physical characteristics of the reservoir from well NT8 to well NT1 show a significant trend of improvement.

4.3. Pore Structure of the Tight Sandstone Reservoir

The pore spaces of the sandstone in the He8 member of the study area are mainly secondary pores, followed by primary pores and microfractures (Figure 6a,b,e,f). However, due to the abundance of rock fragments, including acid extrusive rocks and metamorphic rocks in the He8 member sandstone, the primary intergranular pores were filled and lost during burial compaction. Only a small number of primary pores were preserved in some samples with abundant rigid particles and good sorting, mainly in the form of triangular or triangle-like features (Figure 6b,d). Overall, the secondary pores are dominant. A large number of secondary pores including intergranular dissolution pores, intragranular dissolution pores, and moldic pores can be observed in feldspar. Among them, intergranular dissolution pores and intragranular dissolution pores are the most common in feldspathic lithic sandstones (Figure 6c,d,f). Intragranular dissolution pores have a honeycomb appearance because of detrital feldspar or rock fragment dissolution (Figure 6d), and the moldic pores are mainly the result of the complete dissolution of unstable detrital grains (Figure 6a,c). The authigenic clay mineral aggregates, including illite and kaolinite, contained a large number of micro-nano-scale intergranular pores (Figure 6g–i). Microfractures with good connectivity and long extensions are also common in the He8 member, and these have increased the storage space of the reservoir to some extent. Figure 6b shows a tensional fracture with a relatively flat attitude and a certain opening that is often filled with Fe-calcite. Figure 6e shows shrinkage fractures formed due to the strong contraction of rock fragments during the middle–later diagenetic stage, and these are distributed along the grain rims with large openings and uneven rims.
The capillary pressure curve morphology of feldspathic lithic sandstone samples mostly has a long and gentle section, which is distributed below the mercury injection pressure of 2 MPa (Figure 7a), and the displacement pressure is between 0.62 MPa and 0.152 MPa (average = 0.89 MPa). This indicates that the pore throat structure of feldspathic lithic sandstones is developed with larger pore throats, and mercury enters the sample more easily in the initial stage. The pore throat size distribution of this type of pore throat structure exhibits a right unimodal appearance distribution feature (Figure 7b), with peak values mainly distributed between 0.3 µm and 1 µm (average = 0.29 µm). This has a similar pore size distribution with high-quality reservoirs in the Chang 7 member of the Ordos Basin [26] and the He8 member of the Linxing–Shenfu area [20], and is mainly characterized by residual intergranular pores and dissolved pores (Figure 6c,f). There is a good configuration relationship between pores and throats, and they are the main contributors to reservoir properties. The capillary pressure curve of lithic sandstone samples is characterized by a high displacement pressure and small pore throat radius (Figure 7c,d), with an average displacement pressure of 27.54 MPa and a left a right unimodal appearance distribution feature of pore throat size. Furthermore, the peak values are mainly distributed around 0.01 µm, with an average pore throat radius of 0.008 µm. This type of sample has more developed nanoscale pore throats, with a strong heterogeneity of pore throats and relatively tight rocks.

5. Discussion

5.1. The Influence of Deposition on Pore Structure

Depositional microfacies is the most macroscopic and direct geological factor affecting reservoir properties. Sandstones formed in different depositional environments have different hydrodynamic conditions and deposition patterns, resulting in differences in sediment grain size, rock structural characteristics (sorting), and mineral composition [27,28]. In addition, the difference in rock structure and mineral composition caused by different provenance conditions of the same depositional microfacies [29] can lead to a certain difference in the original physical property and pore structure of the reservoir. This can also have an impact on the type and intensity of diagenesis in the late burial period. For example, the sediment with low composition maturity has a weak anti-compaction ability, which is not conducive to the preservation of the primary pores. However, on the other hand, they also lay a material foundation for later dissolution and the development of secondary pores. Due to the sedimentation period of the He8 member, the study area is generally located in the delta front, with underwater distributary channels and mouth bar as the main sedimentary bodies. The sand bodies formed are thick and widely distributed. The lithology is mainly feldspar lithic sandstone, followed by lithic sandstone. The grain size of sandstone reservoirs has not changed considerably, mainly consisting of medium and fine sand, with little difference in sorting properties. Therefore, grain size and rock structure do not play a significant role in controlling reservoir physical properties. The difference in mineral composition caused by depositional factors indirectly influences the diagenesis path and diagenesis evolution process in the process of sediment burial, as well as the type and occurrence of minerals formed in this process [30]. This determines the difference in the current pore structure of sandstone in the He8 member.

5.2. Diagenesis and Pore Evolution

5.2.1. Compaction

Studies have indicated that when the buried depth of sediment is less than 2500 m, compaction is the main factor that damages the reservoirs’ physical properties and pore structure [31,32]. The main reason for this is that the rearrangement and deformation of particles reduces the size of some primary intergranular pores, which reduces reservoir performance. In the study area, the maximum burial depth (3200 m) of the He8 member during geological history has been shallower than that of the strongly compacted Xujiahe Formation in the Sichuan Basin [33,34] (Figure 1a) and the He8 member in the western Ordos Basin [9] (Figure 1a). In addition, rigid particles are mainly in a linear or point to line contact (Figure 6a–c), and rock fragment grains are occasionally characterized by compression deformation (Figure 6d,e). This indicates that the compaction intensity in the study area is relatively low. Based on the quantitative calculation method of sandstone porosity during the diagenetic evolution process [35,36], quantitative calculation was conducted for the porosity loss due to compaction and cementation, and the porosity increase due to dissolution of sandstone reservoirs in the He8 member of the study area during the diagenetic process. The primary porosity was calculated using
φ1 = 20.91 + 22.90/S0
where φ1 is the original porosity;
S0 = (d75/d25)1/2
where d75 is the grain diameter in the cumulative curve when the cumulative content is 75% and d25 is the grain diameter at a cumulative content of 25% in the accumulation curve.
Through experiments and calculations, it was concluded that the average S0 is 1.50, and the average primary porosity (φ1) of the sandstone reservoir in the He8 member of the study area is 36.10%. The remaining porosity after compaction (φ2, Equation (3)) varies from 3.59% to 17.47% (average, 9.41%) Figure 8). The remaining porosity after compaction of lithic sandstone (average 7.85%) is lower than that of feldspar lithic sandstone (average 10.15%). This is due to the relatively high content of plastic rock fragments and the low content of rigid minerals, mainly feldspar and quartz, in the lithic sandstone. In addition, the background of the coal-bearing strata in the He8 member results in a lack of early carbonate cementitious materials, resulting in a weak anti-compaction ability of the lithic sandstone skeleton. The continuous compaction during the burial process results in the loss of some of the primary pores, and a portion of the rock fragments occupies the pore space and blocks the throat, resulting in a higher porosity loss after compaction (average 28.25%). However, the porosity loss after compaction ranges from 18.63% to 32.87% (average, 26.69%), which is slightly lower than that of the Xujiahe Formation in the Sichuan Basin [34] and the Sulige He8 member in the Ordos Basin [37,38]. This indicates that the compaction in the study area is generally minor.
φ2 = C + (P1 × P0/Pt)
where φ2 refers to the remaining porosity after compaction; C is the cement content; P1 is the interparticle plane porosity; P0 is the measured porosity; and Pt is the total plane porosity (Table 1).

5.2.2. Cementation

When the buried depth of sediment exceeds 2500 m, the porosity loss depends on the amount of quartz, carbonate minerals, and other types of cement [39,40]. On the one hand, the cementation and filling of authigenic minerals reduces the reservoir space of sandstone and promotes the transformation of primary pores into smaller intergranular pores. On the other hand, clogging of the pore throats leads to poor pore connectivity of the pore spaces in the sandstone [10,41].
The main types of cement in the analyzed samples of the sandstone reservoirs in the He8 member are siliceous material, carbonates, and clay minerals. Siliceous cementation is in the form of secondary enlarged edges (Figure 9a,b) growing around detrital quartz grains, and authigenic quartz crystals filling pores (Figure 9a). The hardness of quartz increases the compaction resistance of sandstone reservoirs, and this allows some primary pores to continue to exist at the grain rims while improving the physical properties of tight sandstone reservoirs [25,42]. The main types of carbonate cementation are Fe-calcite and Fe-dolomite. Due to the stratigraphic background of the coal measures in the study area, the decomposition of bacteria during eodiagenesis caused the early stratigraphic water to be acidic and lacking in carbonate cement. During the late burial process, the thermal evolution of organic matter in the source rock generated hydrocarbon and decarboxylates to produce organic acids and CO2, which kept the stratigraphic water acidic and led to the inability of CaCO3 to precipitate. Due to the consumption of organic acids and CO2 in the mesodiagenesis stages, the pH value of pore water gradually became alkaline, which was conducive to the precipitation of calcareous cements such as Fe-calcite or Fe-dolomite that filled the intragranular dissolution pores in the feldspar grains and intergranular pores (Figure 9c,d). The clay mineral type of the sandstone reservoirs is mainly kaolinite, and chlorite and illite can also be observed; however, montmorillonite has basically disappeared. Based on the calculation of the remaining porosity after cementation (Equation (4)), the remaining porosity φ3 ranges from 0.22% to 2.82% (average, 1.22%), and the porosity loss due to cementation changes from 2.40% to 16.80% (average, 8.19%) in the sandstone reservoir in the analyzed samples. The remaining porosity of feldspar lithic sandstone after cementation (average 1.39%) is higher than that of lithic sandstone (average 0.92%).
φ3 = P1 × P0/Pt
where φ3 refers to the remaining porosity after cementation; P1 is the interparticle plane porosity; P0 is the measured porosity; and Pt is the total plane porosity.

5.2.3. Dissolution

Tight sandstone reservoirs generally lose a large number of primary pores due to compaction and cementation during burial evolution. However, the excellent porosity values in deeply buried sandstone indicate that the porosity loss during compaction and cementation processes may be compensated for by subsequent porosity increases caused by dissolution [10,12]. The dissolution of sandstone reservoirs in the He8 member of the analyzed samples may have occurred during shallow burial due to climatically controlled atmospheric fresh water, and during deep burial due to the organic acid-rich fluids. During the shallow burial period of the strata, the organic matter was temporarily immature, and the dissolution fluid was mainly atmospheric freshwater that infiltrated from the surface; the presence of the dissolution fluid was mainly manifested by the dissolution of rock fragments, feldspar, and carbonate minerals. As the burial depth of the stratum increased, the decarboxylation of the rich organic matter in the mudstone in the coal-bearing strata also produced CO2-rich or organic-acid-rich fluids, which enhanced the acidity of the pore water. Rock fragments and feldspar were also dissolved again under acidic conditions, forming secondary pores (Figure 6a,c). Feldspar can also dissolve along weak points such as joint and fracture surfaces, forming a windowpane shape (Figure 6c). The effect of dissolution on pore evolution can be quantitatively characterized based on the formulae of the increasing porosity after dissolution (Equation (5)). Through calculations, it can be shown that the porosity increase caused by the dissolution of the tight sandstone reservoirs in the analyzed samples changes from 0.59% to 7.88% (average = 3.54%). In the early and middle stages, the porosity increase due to dissolution was 1.49% and 2.05%, respectively. Among them, the porosity increase due to dissolution of feldspar lithic sandstone (average = 3.86%) is higher than that of lithic sandstone (average = 2.76%). This is because feldspar can form superior secondary pores compared to rock fragments, resulting in an increase in reservoir macropores and porosity. At the same time, it also enhances the permeability and improves the pore structure.
φ4 = P2 × P0/Pt
where φ4 refers to the increasing porosity after dissolution; P2 is the dissolution plane porosity; P0 is the measured porosity; Pt is the total plane porosity.

5.2.4. Diagenetic Sequence and Pore Evolution Stage

Based on the distribution and formation sequence of the authigenic minerals observed under the microscope, and referring to the classification standard for the diagenetic stages of clastic rocks (acidic water, medium conditions) in the oil and gas industry (SY/T5477-2003), it is believed that the reservoir of the He8 member underwent syndiagenesis stages, eodiagenesis stages A and B, and the mesodiagenesis stage A, and is presently mainly in the mesodiagenesis stage B. The main mineral assemblages are characterized by the predominance of kaolinite, converted to illite, with montmorillonite having basically disappeared. Quartz overgrowths typically occur around grains or develop as authigenic quartz crystals, resulting in tight reservoirs. A degree of microfractures has developed in the He8 member due to the high quartz content. The homogenization temperature test inclusion results indicate that the formation temperature ranged from 90 to 159 ℃, indicating the paleo-geothermal range of the A–B stage of mesodiagenesis.
Eodiagenesis stage A: The burial depth of the strata was relatively shallow, and the ground temperature was relatively low during this time, mainly resulting in compaction and weak cementation. The pore type was mainly intergranular pores, and the porosity rapidly decreased from the original 36.10% to approximately 14.10% (Figure 10a). Eodiagenesis stage B: with the increase in the burial depth of the strata, the intergranular pores gradually decreased with the increase in compaction, and the compaction continued to reduce the porosity by 4.69% (the porosity was 9.41% at this time). Due to the influence of atmospheric fresh water, feldspar and rock fragments began to dissolve, resulting in a porosity increase of approximately 1.49% (the porosity was 10.90% at this time). The formed dissolution products, such as quartz and kaolinite, filled the primary pores of the reservoir, resulting in a porosity reduction of approximately 3.10% after cementation (Figure 10b; at this time, the porosity was 7.80%). Mesodiagenesis stage A: the stratigraphic depth continued to increase to more than 3000 m, and the organic matter matured and generated hydrocarbons at this time; also, large amounts of organic acids or CO2 fluids were generated, and these dissolved the feldspars and rock fragments in the sandstone once again, forming intergranular or intragranular dissolution pores that enhanced the porosity by 2.05% (the porosity was 9.85% at this time). The simultaneously produced dissolution products of quartz and clay minerals, including kaolinite as well as Fe-calcite and Fe-dolomite, in the mid- to late-stages, further began to cement and fill the pores, resulting in a porosity reduction of 4.60% (Figure 10c; where the porosity was 5.25%). After mesodiagenesis stage B: with the consumption of organic acids, the stratigraphic water environment gradually became alkaline, and Fe-calcite and Fe-dolomite filled the remaining primary pore space and secondary dissolution pores, resulting in a porosity reduction of 0.49%. Now, the porosity has decreased to 4.76%.

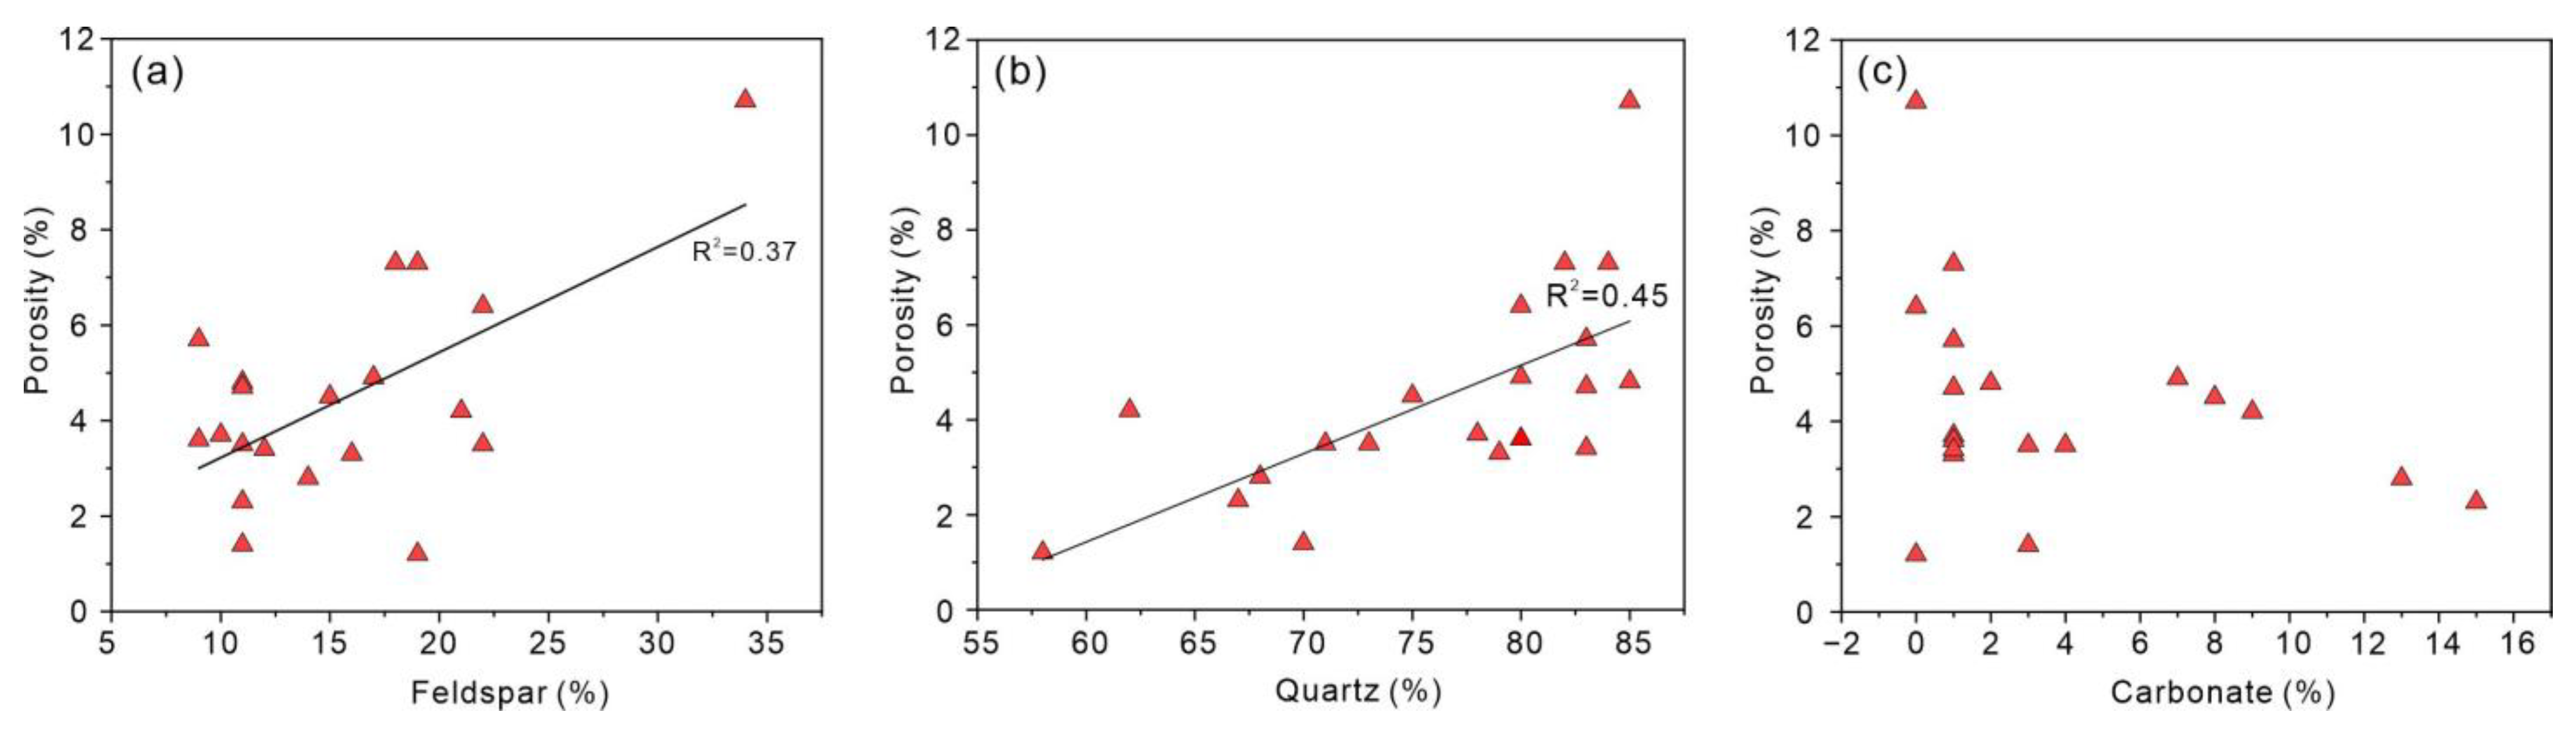
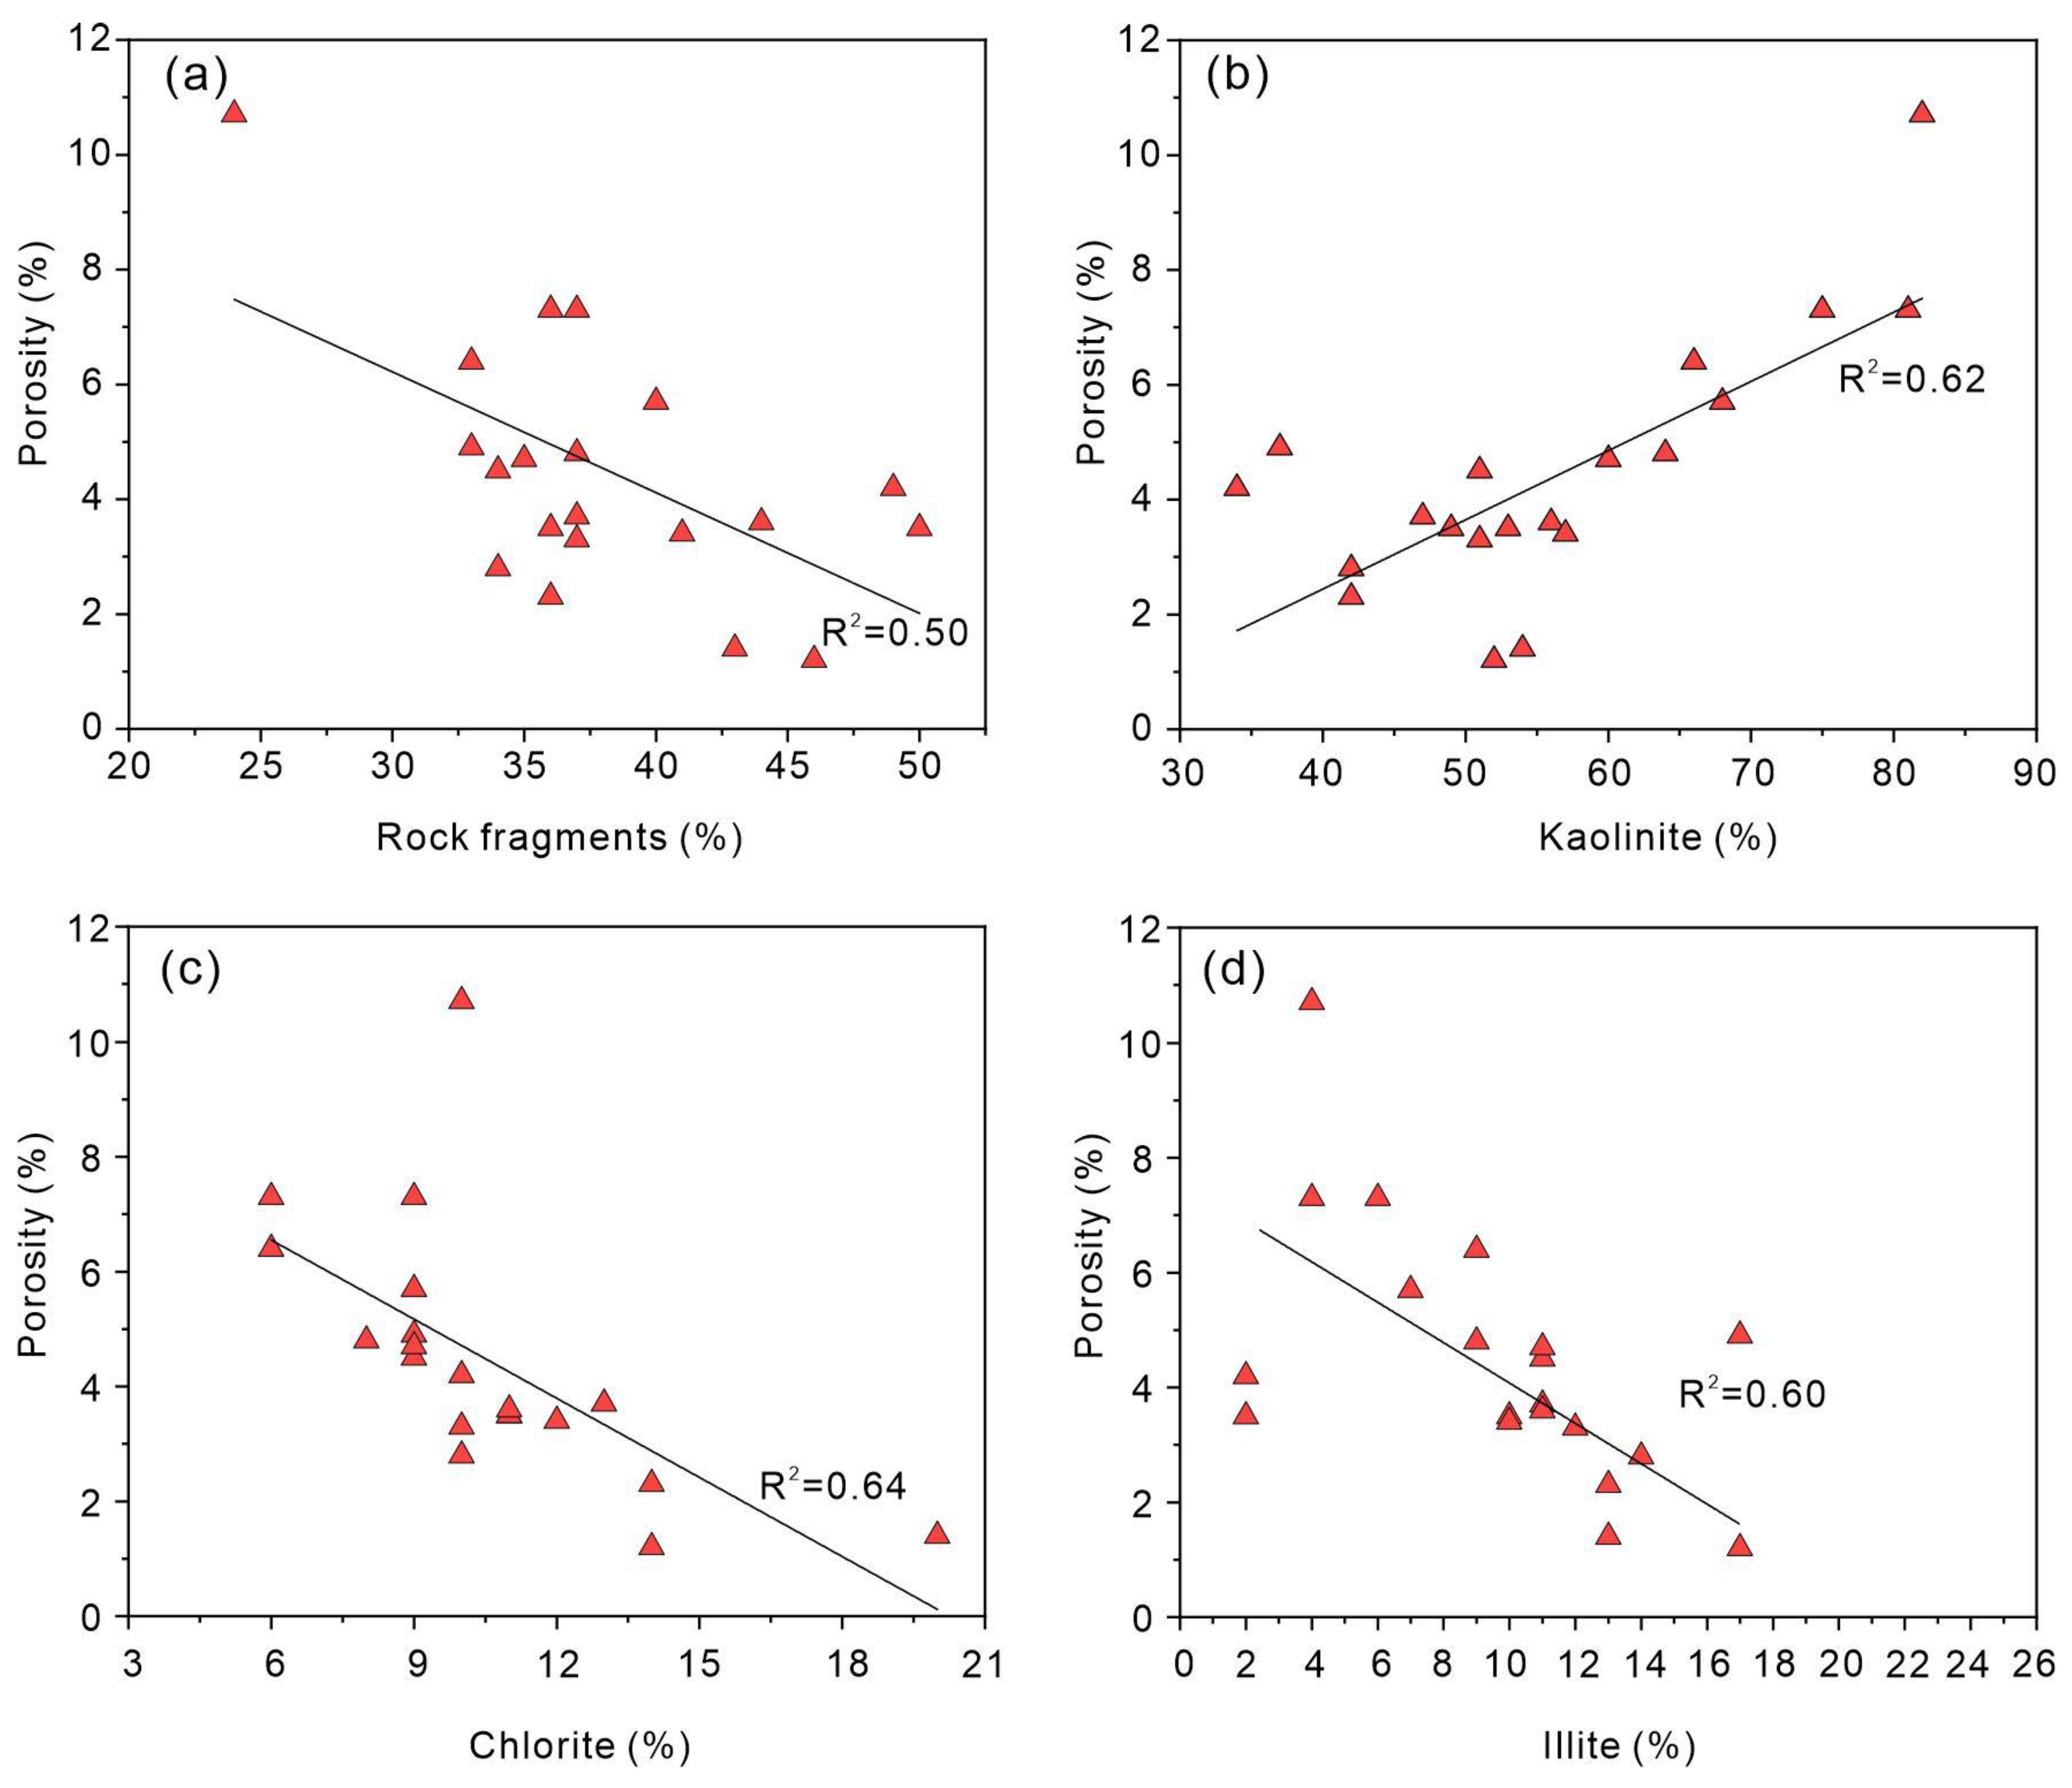
5.3. Effect of Mineral Composition on Porosity

The differences in the original mineral components during the deposition process of sandstone in the He8 member of the study area, to a certain extent, constrain the development of compaction, thereby indirectly affecting the evolution process of pores. After deposits enters the burial diagenetic environment, cementation and dissolution affect the evolution of primary and new minerals in the reservoir, controlling the evolution and formation of primary and secondary pores in feldspar lithic sandstone and lithic sandstone, ultimately resulting in differences in pore structure [43]. Clarifying the formation and sources of minerals is crucial for elucidating the formation and evolution of primary and secondary pores [44,45], and selecting favorable intervals.

5.3.1. Rigid Minerals

The reservoir of the He8 member of the analyzed samples exhibits synergistic development characteristics of multiple pore types dominated by secondary pores, with the development of mic-fractures supplemented by primary pores. Both quartz and feldspar show a positive correlation with porosity (Figure 11a,b), as higher amounts of detrital quartz enhance the compaction resistance of the sandstone reservoir, causing some primary pores to be preserved at the grain rims. Acidic fluid easily enters sandstone intervals during the later period of acid water filling, which promotes water–rock reactions and facilitates the formation of secondary dissolution pores [33]. Dissolution pores usually originate directly from chemically unstable minerals of original components like detrital feldspar, generating large numbers of secondary dissolution pores under the influence of early atmospheric freshwater and acidic conditions caused by organic acid injection. The feldspar grain content in the He8 member of the analyzed samples (average = 15.6%) is comparable to that in the Linxing–Shenfu Block (average = 17.6%) [20], while the high content of kaolinite and the low abundance of illite indicate an acidic diagenetic environment. Therefore, the feldspar in the He8 member of the analyzed samples experienced prolonged dissolution during burial diagenesis, and secondary dissolution pores became the main contributor to porosity.
Although carbonate minerals are also chemically unstable minerals and can generate a large number of secondary dissolution pores, the content of carbonate minerals is not significantly correlated with porosity (Figure 11c). This indicates that carbonate minerals have a dual impact on the reservoir space of sandstone reservoirs: on the one hand, carbonate minerals fill in the primary intergranular pores as cements; on the other hand, the early formation of carbonate minerals can cause the sandstone to have strong compaction resistance, which protects some of the primary intergranular pores [46]; carbonate minerals also provide the material basis for the formation of intergranular and intragranular dissolution pores under the injection process of organic acid or CO2 fluid.

5.3.2. Plastic Minerals

The sandstone in the He8 member of the analyzed samples is enriched with rock fragments. Although the rock fragments were dissolved under the action of atmospheric fresh water, the eodiagenesis, and organic acid fluid in the mesodiagenesis stages, there is a certain negative correlation between the rock fragment content and porosity (Figure 12a), indicating that the enrichment of rock fragments blocked some pores to some extent. The rock fragment types of the He8 member of the analyzed samples are mainly composed of acidic extrusive rocks and metamorphic rock fragments, including plastic phyllite and slate (Figure 13a,b). These rock fragments often have strong plasticity and are extremely prone to deformation and pore clogging during the later burial and compaction process. This is not conducive to the intrusion of large quantities of acidic fluids in the later stage, thereby reducing the development of dissolution pores to a certain extent.
There is a strong positive correlation between kaolinite content and porosity in the He8 member of the analyzed samples (Figure 12b). A large number of intergranular pores in the kaolinite can be observed (Figure 6g,h and Figure 13c), indicating that the formation of kaolinite has a positive effect on the reservoir space of the sandstone. The kaolinite of the analyzed samples exists in the form of book-like aggregates (Figure 6h,i and Figure 13c), which are a typical product of an acidic dissolution environment [47]. The widespread occurrence of the shale interlayer in the He8 member in the study area has had an important influence on the formation of kaolinite (Figure 2). During the eodiagenesis and mesodiagenesis stages, influenced by atmospheric fresh water and the continuous decomposition of aquatic plants producing humic acid, the first dissolution of unstable minerals, including feldspar, and transformation into kaolinite occurred. With the increase in the burial depth and the increase in temperature and pressure conditions during the middle stage of thermal evolution (Ro = 0.5~1.0%), the degree of the thermal degradation of humic kerogens gradually increased. This thermal degradation is manifested as the loss of carboxyl groups and the formation of a large number of short-chain carboxylic acids, which caused the pore fluid at this time to exhibit strong acidity. This led to the secondary dissolution of feldspar and its transformation into kaolinite and the generation of a large number of secondary pores [48].
Illite is a product of alkaline or alkaline rock-forming environments; therefore, its content shows an opposite trend to that of kaolinite. A negative correlation was observed between illite and porosity in the He8 member of the analyzed samples (Figure 12d), suggesting that the formation of illite reduced some of the reservoir space. Intergranular pores of illite grains formed under conditions dominated by alkaline diagenesis can be the main contributor to porosity, such as the dissolution pores in the sandstone reservoirs formed under alkaline rock-forming environments in the Sulige gas field, which account for 81% of the current total porosity [49]. However, the predominance of kaolinite in the study area indicates that the environment was mainly acidic for a considerable period of time, and most of the illite coexists with kaolinite in the study area (Figure 6g,h and Figure 13d). This suggests that the illitization of kaolinite is a major source of illite formation in the study area. Some studies have indicated that the pores in tight sandstones formed under acidic rock-forming conditions may be lost during the later alkaline rock-forming process [14,49]. One possible reason for this is that the generated illite blocks some of the pores, which is also one of the reasons for the negative correlation between illite and the porosity of the analyzed samples.
The negative correlation between chlorite and porosity in the He8 member of the analyzed samples (Figure 12c) indicates that its impact on reservoir porosity is not of positive significance. Chlorite is a silicate mineral that can indicate alkaline dissolution environments [50]. Similar to illite, a large amount of chlorite, in the form of thin films in intergranular pores, positively affects the pore properties of sandstone reservoirs. In contrast, a small amount of chlorite in a scattered state tends to occupy part of the reservoir space [48]. The formation of authigenic chlorite requires an alkaline diagenetic environment and an adequate source of iron ions [51]. Although the study area is rich in igneous rock fragments containing iron ions, the lack of a long-term alkaline diagenetic environment restricted the formation of a large amount of authigenic chlorite. At the same time, due to the relatively closed conditions of the low porosity and low permeability of the sandstone reservoir, fluid migration was slow, and most of the chlorite filled the pore space, reducing the reservoir space.
In summary, the reservoir space of sandstone reservoirs is jointly controlled by multiple minerals during diagenesis, and the impact mechanisms of different minerals on porosity are different. Feldspar, quartz, and kaolinite are the main contributors to porosity, while rock fragments, illite, and chlorite had a negative impact on the development of reservoir pores in the study area.

5.4. Mineral Content and Porosity Prediction Models

5.4.1. Multiple Linear Regression Model Building and Validation

Reservoir space development is controlled and restricted by various factors and can be summarized as being mainly controlled by sedimentation and diagenesis. However, its impact mode and degree are distinct in different regions or depths of reservoirs [52]. In the study area, the formation of favorable reservoirs in the tight sandstone is related to the secondary dissolution pores of minerals, including feldspar, and the rigid protective framework of terrigenous quartz. Quantitative research on the influencing factors of porosity in tight reservoirs is crucial for predicting favorable reservoirs of tight sandstone gas. Generally, multiple linear regression analysis can solve the quantitative dependency relationship between a dependent variable and multiple independent variables [18,53], quantitatively characterize the main influencing factors of porosity formation, and improve the prediction accuracy of porosity. Assuming that the dependent variable Y is correlated with i predictor variables, the general formula for the multiple regression model is as follows:
Y = β0 + β1 x1 + β2 x2 + β3 x3…… + βi xi.
where Y is the dependent variable, x1, x2…xi are the independent variables, and β0, β1, β2, …, βi are the regression coefficients obeying the normal distribution N (0, σ2). The porosity Y and each mineral content parameter x1, x2, …, xi were observed in n groups of samples, and the observations were substituted into Equation (6). Assuming that the estimated values of the regression coefficients β0, β1, … βi are b0, b1, …, bi, the residuals can be calculated between the regression estimates and the true values, and the residual sum of squares can be optimized according to the least square principle, so as to solve the regression coefficient. Substituting this value into Equation (6), the regression equation can be obtained. According to the influence of mineral composition on porosity, this study finally selected the content of quartz (Q), feldspar (F), carbonate minerals (Cb), kaolinite (K), illite (I), chlorite (C), and rock fragments (R) as independent variables, and porosity as the dependent variable to establish a porosity prediction model using the SPSS software. The specific operation steps were described in the literature [54]. Based on the compilation of the SPSS analysis results, a mineral prediction model affecting the porosity variation was developed as follows:
Y = 11.23 + 0.04 × Q + 0.11 × F − 0.03 × Cb + 0.03 × K − 0.11 × C − 0.27 × I − 0.21 × R
Multiple linear regression equations can verify the accuracy of the model by testing the significance of regression coefficients and regression models [55]. The multiple R is the correlation coefficient between the independent variable and the dependent variable, used to measure the degree of correlation between porosity and various mineral content parameters [55], the multiple R of the model (0.95) is greater than the detection value (0.91), indicating a significant positive correlation between the sandstone reservoir porosity and various mineral content parameters (Table 2). The determination coefficient R2 of the prediction model reflects to what extent the multiple linear regression model can explain the changes in the dependent variable. The model (R2 = 0.884) indicates that the mineral content parameter can explain 88.4% of the changes in porosity. The adjusted R2 reflects the best fit of the regression equation by eliminating the influence of the number of independent variables on R2. The larger the R2 and R2 (adj), the better the fitting effect of the regression model [56]. The adjusted R2 is relatively large (0.86), indicating a good fitting effect of the model. In addition, through the F-test regression equation model, the F-value (19.1) is greater than its examination threshold (14), further indicating that the established prediction model has certain significance, and the regression model is reliable in analyzing the relationship between porosity and mineral content parameters. Furthermore, the residual error usually reflects the accuracy of the established model in predicting dependent variables. Generally, the smaller residual error (0.86) indicates that the established model has a good effect. Overall, the established prediction model has a certain geological significance and value.
In order to verify the prediction effect (reliability) of the model, each mineral composition tested in the NT1 well was substituted into the prediction model, and the prediction effect of the model was analyzed by comparing with the measured porosity. The predicted porosity of the model is basically consistent with the measured porosity (the average error is only 0.42%, Figure 14). In addition, in statistics, determining whether the predicted value matches the measured value also requires determining the homogeneity of the sample. The paired samples t-test is usually used to identify whether two groups of samples are significantly different [53,57]. The significance probability p-value of the paired sample t-test between the model-predicted porosity and the measured porosity (0.52) is greater than 0.05, which indicates that the two groups of samples are comparable, and there is no significant difference between them at the 95% confidence interval, that is, the model-predicted porosity and the measured porosity basically match. In addition, the mineral content data of the tight sandstone reservoir in well NT8 was selected as the sample data. Based on the established porosity prediction model, the mineral content data corresponding to the four samples were substituted into the model for porosity prediction. The results show that the results of the porosity prediction model still fit well with the measured porosity (Figure 14) (the average error is only 0.26%).

5.4.2. Exploration Significance of the Multiple Linear Regression Porosity Model

The evaluation and optimization of the sweet spot is the core of tight gas exploration and research, and is implemented throughout the exploration and development process. The pore structure evolution of tight reservoirs is of great significance for hydrocarbon charging mechanisms [58], which largely determines the location of hydrocarbon transport and accumulation. Porosity is a key parameter for evaluating the capacity of tight sandstone gas reservoirs, and as oil and gas exploration expands to deeper and newer blocks [59], it is increasingly difficult to find relatively favorable reservoirs. Multiple linear regression models can be applied to predict and interpret the porosity of known mineral contents. It has some geological significance in predicting the distribution of sweet spot areas (intervals).
Based on the established multiple linear regression model, the porosity of wells NT4 and NT2 in the Jingle south sub-depression and well N7 in the Zhongzhuang steep slope belt were calculated, and it was found that the predicted porosity is higher in the northern part of the study area, especially in well NT4 (Figure 15). The predicted porosity of the He8 member ranges from 3.1% to 12.8% (average = 7.5%), and the percentage of reservoirs with a porosity greater than 10% is approximately 25%. Although lower than the sandstone reservoirs in the He8 member of the Sulige area (current porosity is approximately 9.3%) [49], it is generally higher than that of the sandstone reservoirs in the He8 member of the Linxing–Shenfu area (current porosity is approximately 6.2%) [20].
The Sulige gas field in the Ordos Basin is a typical tight sandstone gas field, with cumulative proven natural gas reserves reaching 4 × 10¹² m3 and an annual gas production of 2.5 × 10¹⁰ m3, accounting for over 25% of China’s total natural gas production [42]. Here, the He8 member is the main gas-bearing interval and it is mainly composed of medium–coarse-grained lithic sandstone and medium–coarse-grained lithic quartz sandstone, with a small amount of feldspathic lithic sandstone. Despite the compaction and cementation that increased the tightness of the sandstone reservoirs, dissolution during the mesodiagenetic stage increased the porosity by up to 12.3% (Table 2), resulting in the formation of high-quality sandstone reservoirs with an average porosity of 9.3% [49]. One of the reasons for the formation of the high-yield area in the Sulige gas field is the significant effect of the porosity enhancement caused by dissolution [37]. The Linxing–Shenfu area is located on the northeastern margin of the Ordos Basin, and has discovered super-giant tight gas fields with proven reserves of over 100 billion cubic meters. The He8 member is the main gas-bearing interval of the gas field, with a lithology similar to that of the Ningwu South Block, being mainly composed of medium–coarse-grained feldspathic lithic sandstone and medium–coarse-grained lithic sandstone [60]. The He8 member sandstone reservoir was mainly compacted and strongly cemented during burial, resulting in low porosity and limited dissolution, preventing the organic-acid-rich fluids from fully entering the sandstone. The dissolution porosity only increased by 2.8%, and the current porosity is approximately 6.2% (Table 3). However, the successful development of a production capacity exceeding 15 × 108 m3/a [61] indicates that tight sandstones with such dissolution intensity have exploration significance. Compared to the Linxing–Shenfu area, the northern part of the Ningwu South Block has higher porosity with well-developed dissolution pores. Moreover, the interval with the high predicted porosity in the NT4 well displays good gas logging characteristics (Figure 2). This indicates that the He8 member sandstone reservoir in the northern Jingle south sub-depression may have considerable exploration and development prospects. Therefore, attention should be paid to the strong dissolution (feldspar-rich) intervals in the exploration and development of tight sandstone gas in the future.

6. Conclusions

(1)
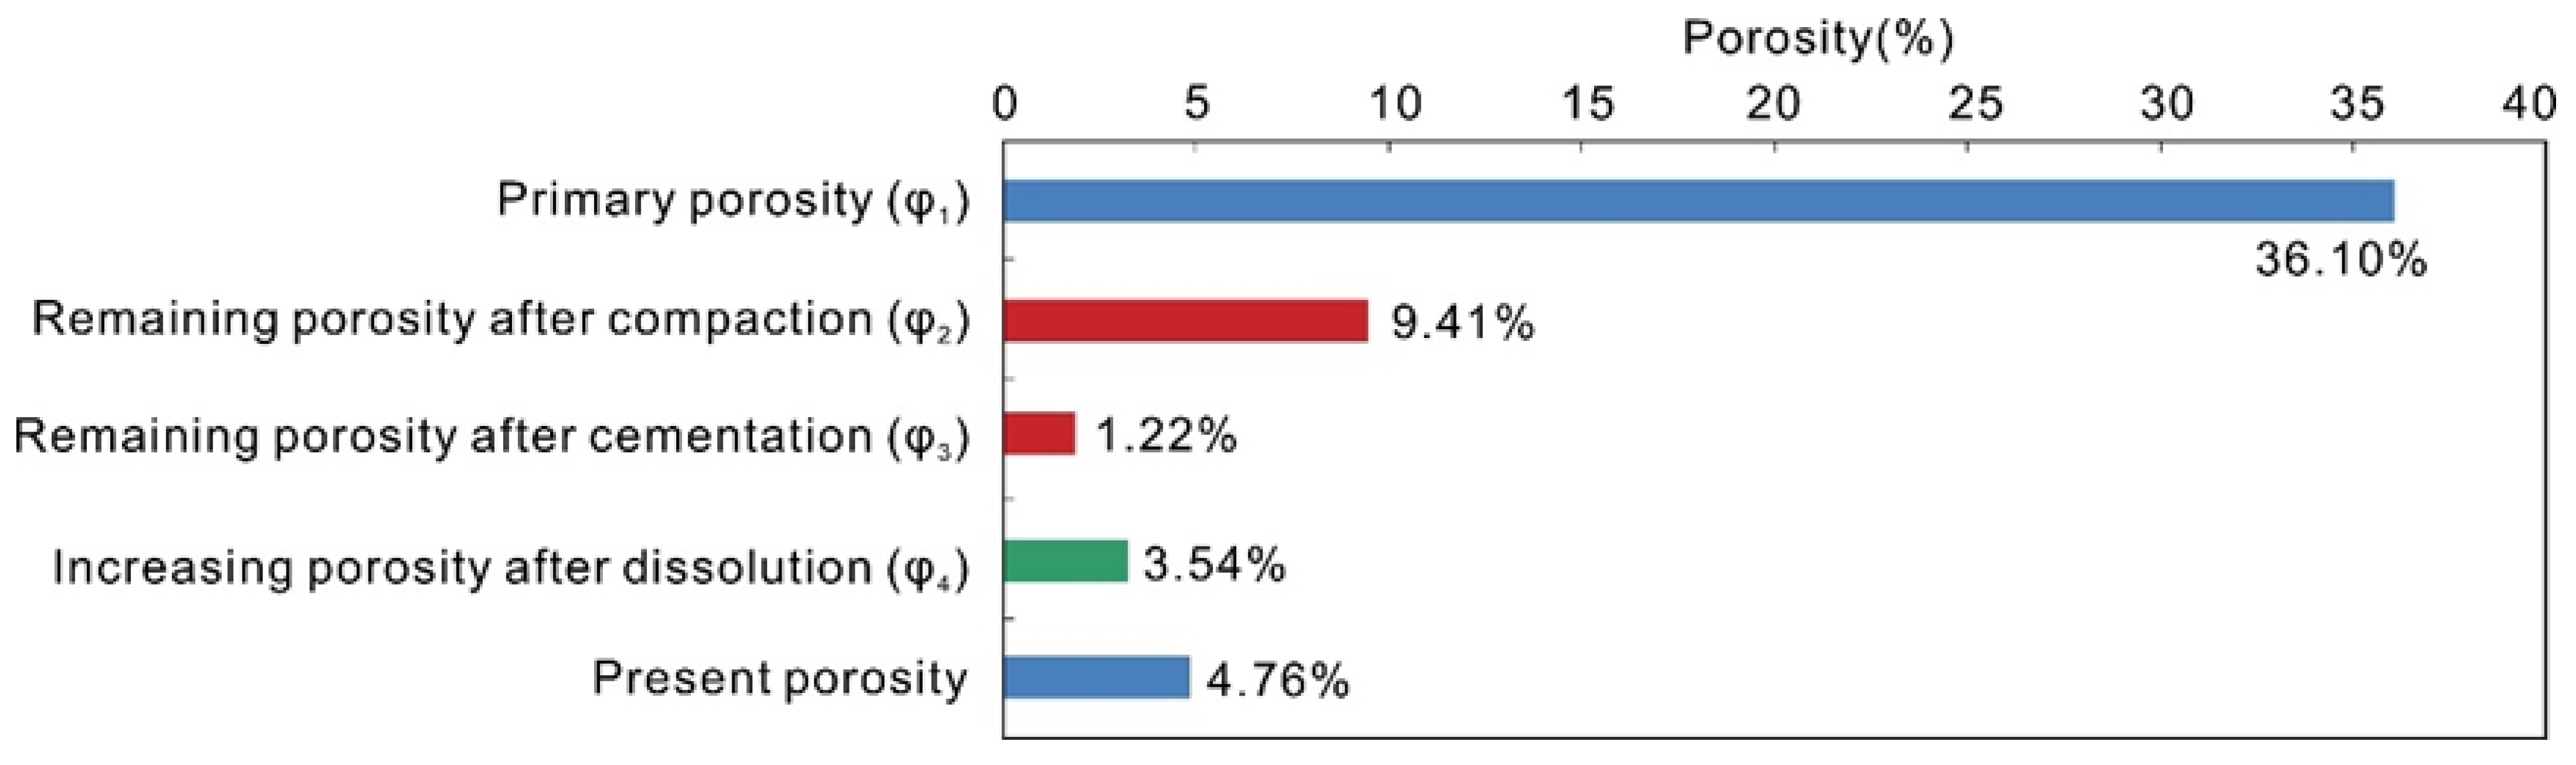
Pore evolution was linked to mineral grids of depositional origin and new minerals formed during diagenesis influence. The He8 member sandstone reservoir underwent destructive diagenetic processes, including compaction and cementation, resulting in a porosity loss of 26.69% and 8.19%, respectively. Constructive diagenetic processes, including dissolution, increased the porosity by 3.54%. The reservoir is currently in the stage B of mesodiagenesis.
(2)
The pore spaces of the He8 member sandstone are mainly composed of secondary pores and micropores within kaolinite aggregates. The rigid quartz framework and feldspar grain dissolution has improved the reservoir quality. Carbonate minerals have had a dual impact on the formation of pore spaces in the sandstone. The dissolution of kaolinite mineral grains is a contributor to porosity.
(3)
The multiple linear regression model established based on the mineral contents of quartz, feldspar, carbonate minerals, kaolinite, chlorite, and rock fragments can better predict the distribution of reservoir porosity. The model predicts that the tight sandstone reservoir in the He8 member in the north of the Jingle south sub-depression has a favorable reservoir space.

Author Contributions

Conceptualization, S.T. and D.L.; methodology, P.Z.; validation, Y.C. and F.H.; formal analysis, P.L., J.H. and X.G.; investigation, Z.Y.; data curation, Y.C., X.W., Z.L. and P.Z.; writing—original draft preparation, D.L.; writing—review and editing, S.T.; visualization, D.L. and P.Z.; supervision, S.T. and Y.G.; funding acquisition, S.T. All authors have read and agreed to the published version of the manuscript.

Funding

This work was supported by the National Natural Science Foundation of China (No. 42272197).

Data Availability Statement

The research data of this article can be obtained from the corresponding author “Lin Donglin” through reasonable requests.

Acknowledgments

We thank Zhang, Q, Yang, X.X., and Zhang, K., for their fieldwork and experimental analysis assistance.

Conflicts of Interest

The authors declare no conflict of interest.

References

  1. Zou, C.N.; Yang, Z.; Tao, S.Z.; Yuan, X.J.; Zhu, R.K.; Hou, L.H.; Wu, S.T.; Sun, L.; Zhang, G.S.; Bai, B.; et al. Continuous hydrocarbon accumulation over a large area as a distinguishing characteristic of unconventional petroleum: The Ordos basin, north-central China. Earth Sci. Rev. 2013, 126, 358–369. [Google Scholar] [CrossRef] [Green Version]
  2. Jia, C.; Zou, C.; Li, J.; Li, D.; Zheng, M. Evaluation criteria, major types, characteristics and resource prospects of tight oil in China. Pet. Res. 2016, 1, 1–9. [Google Scholar] [CrossRef]
  3. Ji, G.; Jia, A.L.; Meng, D.W.; Guo, Z.; Wang, G.T.; Cheng, L.H.; Zhao, X. Technical strategies for effective development and gas recovery enhancement of a large tight gas field: A case study of Sulige gas field, Ordos Basin, NW China. Pet. Explor. Dev. 2019, 46, 629–641. [Google Scholar] [CrossRef]
  4. Wei, J.G.; Tang, S.H.; Zhang, S.H.; Sun, C.R.; Zhang, T.Q.; Gong, M.H. Analysis on characteristics and influence factors of transitional facies shale pore in Ningwu basin. Coal Geol. Explor. 2018, 46, 78–85. [Google Scholar]
  5. Zuo, Z.X.; Zhang, X.B.; Chen, S.B.; Si, Q.H.; Zhang, C.; Liu, Z. Heterogeneity of Shale Gas Reservoirs in Coal Measures: A Case Study of the Taiyuan and Shanxi Formations in the Ningwu Basin. Acta Geol. Sin. 2017, 91, 1130–1140. [Google Scholar]
  6. Sun, C.R.; Tang, S.H.; Wei, J.G. Characterization of microscopic pore structure of transitional fades shale of Taiyuan Formation in Ningwu Basin. China Min. Mag. 2017, 26, 155–161. [Google Scholar]
  7. Zou, C.N.; Yang, Z.; He, D.B.; Wei, Y.S.; Li, J.; Jia, A.L.; Chen, J.J.; Zhao, Q.; Li, Y.L.; Li, J.; et al. Theory, technology and prospects of conventional and unconventional natural gas. Pet. Explor. Dev. 2018, 45, 604–618. [Google Scholar] [CrossRef]
  8. Zhang, F.; Jiang, Z.X.; Xiao, H.M.; Hu, B.; Chen, P.; Tang, X.L.; Sun, W.; Zhu, L.; Wang, Q.Y. Testing origin of reservoir quality difference of tight sandstones in the Yanchang Formation, Ordos Basin, China. Mar. Pet. Geol. 2022, 137, 105507. [Google Scholar] [CrossRef]
  9. Lai, J.; Wang, G.; Ran, Y.; Zhou, Z.L.; Cui, Y.F. Impact of diagenesis on the petro-physical properties of tight oil reservoirs: The case of Upper Triassic Yanchang Formation Chang 7 oil layers in Ordos Basin, China. J. Pet. Sci. Eng. 2016, 145, 54–65. [Google Scholar] [CrossRef]
  10. Lai, J.; Wang, G.; Wang, S.; Cao, J.T.; Li, M.; Pang, X.J.; Zhou, Z.L.; Fan, X.Q.; Dai, Q.Q.; Yang, L.; et al. Review of diagenetic facies in tight sandstones: Diagenesis, diagenetic minerals, and prediction via well logs. Earth Sci. Rev. 2018, 185, 234–258. [Google Scholar] [CrossRef]
  11. Cui, Y.F.; Wang, G.W.; Jones, S.J.; Zhou, Z.L.; Ran, Y.; Lai, J.; Li, R.J.; Deng, L. Prediction of diagenetic facies using well logs–a case study from the upper Triassic Yanchang Formation, Ordos Basin, China. Mar. Pet. Geol. 2017, 81, 50–65. [Google Scholar] [CrossRef] [Green Version]
  12. Taylor, T.R.; Giles, M.R.; Hathon, L.A.; Diggs, T.N.; Braunsdorf, N.R.; Birbiglia, G.V.; Kittridge, M.G.; Macaulay, C.I.; Espejo, I.S. Sandstone diagenesis and reservoir quality prediction: Models. Myths, and reality. AAPG Bull. 2010, 94, 1093–1132. [Google Scholar] [CrossRef]
  13. Xi, Z.D.; Tang, S.H.; Lash, G.G.; Ye, Y.P.; Lin, D.L.; Zhang, B. Grain assemblages and diagenesis in Ordovician-Silurian transition shale deposits of the Upper Yangtze Platform, South China. J. Asian Earth Sci. 2022, 230, 105188. [Google Scholar] [CrossRef]
  14. Yuan, G.H.; Cao, Y.C.; Gluyas, J.; Li, X.Y.; Xi, K.L.; Wang, Y.Z.; Jia, Z.Z.; Sun, P.P.; Oxtoby, N.H. Feldspar dissolution, authigenic clays, and quartz cements in open and closed sandstone geochemical systems during diagenesis: Typical examples from two sags in Bohai Bay Basin, East China. AAPG Bull. 2015, 99, 2121–2154. [Google Scholar] [CrossRef]
  15. Baker, J.C.; Hacord, P.J.; Martin, K.R.; Ghori, K.A.R. Diagenesis and petrophysics of the Early Permian Moogooloo sandstone, southern Camarvon Basin, Western Australia. AAPG Bull. 2000, 84, 250–265. [Google Scholar]
  16. Griffiths, J.; Worden, R.H.; Utley, J.E.P.; Brostrøm, C.; Martinius, A.W.; Lawan, A.Y.; Al-Hajri, A.I. Origin and distribution of grain-coating and pore-filling chlorite in deltaic sandstones for reservoir quality assessment. Mar. Pet. Geol. 2021, 134, 105326. [Google Scholar] [CrossRef]
  17. Ran, Y.; Wang, G.W.; Lai, J.; Zhou, Z.L.; Cui, Y.F.; Dai, Q.Q.; Chen, J.; Wang, S.C. Quantitative characterization of diagenetic facies by using logging cross-plot: A case study on Chang 7 tight sandstone oil reservoir in Heshui area, Ordos Basin. Acta Sedimentol. Sin. 2016, 34, 694–706. [Google Scholar]
  18. Liu, H.P.; Luo, Y.; Zhao, Y.C.; Zhang, C.M.; Zhou, S.B.; Shao, L.K. Controlling factors and predictions of well-connected pore-throat volumes in tight oil sandstones. J. Pet. Sci. Eng. 2022, 218, 111034. [Google Scholar] [CrossRef]
  19. Xu, Q.; Xu, F.Y.; Jiang, B. Geology and transitional shale gas resource potentials in the Ningwu Basin, China. Energy Explor. Exploit. 2018, 36, 1482–1497. [Google Scholar] [CrossRef] [Green Version]
  20. Yang, G.; Huang, W.; Zhong, J.; Sun, N. Occurrence, Classification and Formation Mechanisms of the Organic-Rich Clasts in the Upper Paleozoic Coal-Bearing Tight Sandstone, Northeastern Margin of the Ordos Basin, China. Energies 2020, 13, 2694. [Google Scholar] [CrossRef]
  21. Hu, Y.Y.; Pang, X.Q.; Jiang, F.J.; Li, L.; Zheng, D.Y.; Shao, X.H. Coupling relationship between tight sandstone reservoir and gas charging: An example from lower Permian Taiyuan Formation in Kangning field, northeastern Ordos Basin, China. Mar. Pet. Geol. 2019, 105, 238–250. [Google Scholar]
  22. Wang, J.Y.; Jiang, J.F.; Hu, Q.H.; Zhang, C.L.; Yang, X.G.; Mo, W.L.; Wang, X.R.; Qi, Z.G. A quantitative model and controlling factors of secondary pore development for tight sandstone reservoirs in the carboniferous Benxi Formation, Ordos Basin, China. Mar. Pet. Geol. 2023, 148, 106034. [Google Scholar] [CrossRef]
  23. Schieber, J.; Camp, W.; Diaz, E.; Wawak, B. SEM observations on ion-milled samples of Devonian black shalesfrom Indiana and New York: The petrographic context of multiple pore types. Electron Microsc. Shale Hydrocarb. Reserv. AAPG Mem. 2013, 102, 153–171. [Google Scholar]
  24. Schieber, J. Mud re-distribution in epicontinental basins–Exploring likely processes. Mar. Pet. Geol. 2016, 71, 119–133. [Google Scholar] [CrossRef] [Green Version]
  25. Xi, Z.D.; Tang, S.H.; Wang, J.; Yang, G.Q.; Li, L. Formation and development of pore structure in marine-continental transitional shale from northern China across a maturation gradient: Insights from gas adsorption and mercury intrusion. Int. J. Coal Geol. 2018, 200, 87–102. [Google Scholar] [CrossRef]
  26. Zhang, Q.P.; Liu, Y.C.; Wang, B.T.; Ruan, J.F.; Yan, N.; Chen, H.; Wang, Q.; Jia, G.W.; Wang, R.N.; Liu, H.; et al. Effects of pore-throat structures on the fluid mobility in Chang 7 tight sandstone reservoirs of longdong area, Ordos Basin. Mar. Pet. Geol. 2022, 135, 105407. [Google Scholar] [CrossRef]
  27. Ramm, M. Reservoir quality and its relationship to facies and provenance in Middle to Upper Jurassic sequences, northeastern North Sea. Clay Miner. 2000, 35, 77–94. [Google Scholar] [CrossRef]
  28. Islam, M.A. Diagenesis and reservoir quality ofBhuban sandstones (Neogene), Titas Gas Field, Bengal Basin, Bangladesh. J. Asian Earth Sci. 2009, 35, 89–100. [Google Scholar] [CrossRef]
  29. Ajdukiewicz, J.M.; Lander, R.H. Sandstone reservoir quality prediction: The state of the art. AAPG Bull. 2010, 94, 1083–1091. [Google Scholar] [CrossRef]
  30. Bjørlykke, K. Relationships between depositional environments, burial history and rock properties. Some principal aspects of diagenetic process in sedimentary basins. Sediment. Geol. 2014, 301, 1–14. [Google Scholar] [CrossRef]
  31. Higgs, K.E.; Zwingmann, H.; Reyes, A.G.; Funnell, R.H. Diagenesis, porosity evolution, and petroleum emplacement in tight gas reservoirs, Taranaki basin, New Zealand. J. Sediment. Res. 2007, 77, 1003–1025. [Google Scholar] [CrossRef]
  32. Dutton, S.P.; Loucks, R.D. Diagenetic controls on evolution of porosity and permeability in lower Tertiary Wilcox sandstones from shallow to ultradeep (200–6700 m) burial, Gulf of Mexico Basin, U.S.A. Mar. Pet. Geol. 2010, 27, 69–81. [Google Scholar] [CrossRef]
  33. Lai, J.; Wang, G.W.; Chai, Y.; Xin, Y.; Wu, Q.K.; Zhang, X.T.; Sun, Y.H. Deep burial diagenesis and reservoir quality evolution of high-temperature, high-pressure sandstones: Examples from Lower Cretaceous Bashijiqike Formation in Keshen area, Kuqa depression, Tarim basin of China. AAPG Bull. 2017, 101, 829–862. [Google Scholar] [CrossRef]
  34. Xu, H.; Liu, M.J.; Zhang, Z.; Ye, S.J.; Yang, Y.T.; Wu, L.; Zhang, L.; Nan, H.L.; Tan, X.C.; Zeng, W.; et al. Diagenesis and porosity evolution of the 3rd member of Xujiahe Formation tight sandstone reservoir in the Western Sichuan Depression, Sichuan Basin. Nat. Gas Geosci. 2022, 33, 344–357. [Google Scholar]
  35. Beard, D.C.; Weyl, P.K. Influence of texture on porosity and permeability of unconsolidated sand. AAPG Bull. 1973, 57, 349–369. [Google Scholar]
  36. Yang, J.Q.; Ji, Y.L.; Wu, H.; Meng, L.J. Diagenesis and Porosity Evolution of Deep Reservoirs in the Nanpu Sag: A case study of Sha 1 Member of the Paleogene in No. 3 structural belt. Acta Sedimentol. Sin. 2022, 40, 203–216. [Google Scholar]
  37. Bai, Y.Y.; Sun, W.; Ren, D.Z.; Han, J. Quantitative classification and characteristic difference of diagenetic facies in He8 reservoir of the Su 48 block, west area of Sulige Gas Field, Ordos Basin. Nat. Gas Geosci. 2018, 29, 1739–1747. [Google Scholar]
  38. Wei, Q.S.; Guo, Y.Q.; Chen, S.; Shi, K.; Li, W.P. Microscopic pore throat characterization analysis of tight sandstone reservoirs in He8 member of Sulige gas field, China. Fresenius Environ. Bull. 2021, 30, 448–456. [Google Scholar]
  39. Paxton, S.T.; Szabo, J.O.; Ajdukiewicz, J.M.; Klimentidis, R.E. Construction of an intergranular volume compaction curve for evaluating and predicting compaction and porosity loss in rigid-grain sandstone reservoirs. AAPG Bull. 2002, 86, 2047–2067. [Google Scholar]
  40. Zou, C.N.; Hou, L.H.; Kuang, L.C.; Kuang, J. Genetic mechanism of fan controlled diagenetic reservoir facies of the fan-controlled permo-triassic in western marginal area the Junggar Basin. Chin. J. Geol. Sci. Geol. Sin. 2007, 587–601. [Google Scholar]
  41. Pittman, E.D.; Larese, R.E. Compaction of Lithic Sands: Experimental Results and Applications. AAPG Bull. 1991, 75, 1279–1299. [Google Scholar]
  42. Wu, H.Y.; Zhao, J.Z.; Wu, W.T.; Li, J.; Huang, Y.Z.; Chen, M.N. Formation and diagenetic characteristics of tight sandstones in closed to semi-closed systems: Typical example from the Permian Sulige gas field. J. Pet. Sci. Eng. 2021, 199, 108248. [Google Scholar] [CrossRef]
  43. Wang, Z.N.; Luo, X.R.; Lei, Y.H.; Zhang, L.K.; Shi, H.; Lu, J.H.; Cheng, M.; Liu, N.G.; Wang, X.Z.; He, Y.H.; et al. Impact of detrital composition and diagenesis on the heterogeneity and quality of low-permeability to tight sandstone reservoirs: An example of the Upper Triassic Yanchang Formation in Southeastern Ordos Basin. J. Pet. Sci. Eng. 2020, 195, 107596. [Google Scholar] [CrossRef]
  44. Wang, Y.Z.; Lin, M.R.; Xi, K.L.; Cao, Y.C.; Wang, J.; Yuan, G.H.; Kashif, M.; Song, M.S. Characteristics and origin of the major authigenic minerals and their impacts on reservoir quality in the Permian Wutonggou Formation of Fukang Sag, Junggar Basin, western China. Mar. Pet. Geol. 2018, 97, 241–259. [Google Scholar] [CrossRef]
  45. Ma, B.; Cao, Y.; Jia, Y. Feldspar dissolution with implications for reservoir quality in tight gas sandstones: Evidence from the Eocene Es4 interval, Dongying Depression, Bohai Bay Basin, China. J. Pet. Sci. Eng. 2017, 150, 74–84. [Google Scholar] [CrossRef]
  46. Hong, D.D.; Cao, J.; Wu, T.; Dang, S.; Hu, W.X.; Yao, S.O. Authigenic clay minerals and calcite dissolution influence reservoir quality in tight sandstones: Insights from the central Junggar Basin, NW China. Energy Geosci. 2020, 1, 8–19. [Google Scholar] [CrossRef]
  47. Worden, R.H.; Morad, S. Clay minerals in sandstones: Controls on formation, distribution and evolution. In Clay Mineral Cements in Sandstones; Special Publication; Worden, R.H., Morad, S., Eds.; International Association of Sedimentologists: Flanders, Belgium, 2003; Volume 34, pp. 3–41. [Google Scholar]
  48. Surdam, R.C.; Crossey, L.J. Oraanic-inoraanic reactions during progressive burial: Key to porosity and permeability enhancement and preservation. Philos. Trans. Roval Soc. Lond. Ser. A 1985, 315, 135–156. [Google Scholar]
  49. Bi, M.W.; Chen, S.Y.; Zhou, Z.H.; Liu, J.; Zheng, G.Q.; Zhang, M.L. Genesis of secondary pores of tight sandstone reservoir in He8th Member in Su 6 area of Sulige gas field. J. China Univ. Pet. 2015, 39, 8–16. [Google Scholar]
  50. Bjørlykke, K. Clay mineral diagenesis in sedimentary basinsda key to the prediction of rock properties. Examples from the North Sea Basin. Clay Miner. 1998, 33, 15–34. [Google Scholar] [CrossRef]
  51. Berger, A.; Gier, S.; Krois, P. Porosity-preserving chlorite cements in shallowmarine volcaniclastic sandstones: Evidence from Cretaceous sandstones of the Sawan gas field, Pakistan. AAPG Bull. 2009, 93, 595–615. [Google Scholar] [CrossRef] [Green Version]
  52. Mouna, M.A.; Marghani, M.Z.; Ahmed, E.R. Facies analysis, diagenesis, and petrophysical controls on the reservoir quality of the low porosity fluvial sandstone of the Nubian formation, east Sirt Basin, Libya: Insights into the role of fractures in fluid migration, fluid flow, and enhancing the permeability of low porous reservoirs. Mar. Pet. Geol. 2022, 147, 105986. [Google Scholar]
  53. Chen, X.J.; Li, P.F.; Li, P.; Hui, P.; Guo, Y.H. Application of Multiple Stepwise regression Analysis in Prediction of Coal Seam Gas Content. Coal Eng. 2019, 51, 106–111. [Google Scholar]
  54. Mei, X.R.; Chen, P.; Gao, Y.S. Research on correlation factor analysis and regression model of coal calorific value based on SPSS. China Coal 2011, 37, 88–91. [Google Scholar]
  55. Ulusay, R.; Türeli, K.; Ider, M.H. Prediction of engineering properties of a selected litharenite sandstone from its petrographic characteristics using correlation and multivariate statistical techniques. Eng. Geol. 1994, 38, 135–157. [Google Scholar] [CrossRef]
  56. Wang, Z.K.; Chen, J.F.; Li, W.P.; Wang, Q.Q.; Niu, Q.H.; Liu, S.L.; Hu, Y.B. Relationship between petrographic parameters and physical-mechanical properties of weakly cemented sandstones. Q. J. Eng. Geol. Hydrogeol. 2020, 54, qjegh2018-168. [Google Scholar] [CrossRef]
  57. Abdulmohsin, A.H.; Wahab, A.B.H.; Hossen, A.J.M.A. A New Hybrid Feature Selection Method Using T-test and Fitness Function. Comput. Mater. Contin. 2021, 68, 3998. [Google Scholar] [CrossRef]
  58. Guo, S.; Lyu, X.; Zhang, Y. Relationship between tight sandstone reservoir formation and hydrocarbon charging: A case study of a Jurassic reservoir in the eastern Kuqa Depression, Tarim Basin, NW China. J. Nat. Gas Sci. Eng. 2018, 52, 304–316. [Google Scholar] [CrossRef]
  59. Zeng, Q.L.; Mo, T.; Zhao, J.L.; Tang, Y.L.; Zhang, R.H.; Xia, J.F.; Hu, C.L.; Shi, L.L. Characteristics, genetic mechanism and oil and gas exploration significance of high- quality sandstone reservoirs deeper than 7000 m: A case study of the Bashijiqike Formation of Lower Cretaceous in the Kuqa Depression, NW China. Nat. Gas Ind. B 2020, 7, 317–327. [Google Scholar] [CrossRef]
  60. Zhang, Y.Y.; Jiang, S.; He, Z.L.; Wang, Y.B.; Guo, M.Q.; Zhu, G.H.; Cai, D.S.; Lu, S.F.; Xiao, D.S.; Li, Y.C.; et al. Characteristics of heterogeneous diagenesis and modification to physical properties of Upper Paleozoic tight gas reservoir in eastern Ordos Basin. J. Pet. Sci. Eng. 2021, 208, 109243. [Google Scholar] [CrossRef]
  61. Mi, L.J.; Zhu, G.H. Geological characteristics and exploration breakthrough in Linxing-Shenfu tight gas fi eld, northeastern Ordos Basin. China Pet. Explor. 2021, 26, 53–67. [Google Scholar]
Figure 1. (a) Location of Ningwu Basin, and (b) regional geological map of Ningwu South Block.
Processes 11 02374 g001
Figure 2. Connected well diagram of sandstone of He8 member in the study area. Abbreviations: Str. = Stratigraphic, Dep. = Depth, SX = Shanxi Formation.
Processes 11 02374 g002
Figure 3. Cumulative thickness distribution of sandstone in He8 member of Ningwu South Block.
Processes 11 02374 g003
Figure 4. (a) Percentage diagram of mineral content, and (b) ternary diagram of sandstone type of He8 member in the study area. I—Quartz sandstone, II—Feldspathic quartz sandstone, III—Lithic quartz sandstone, IV—Feldspathic sandstone, V—Lithic feldspathic sandstone, VI—Feldspar lithic sandstone, VII—Lithic sandstone.
Processes 11 02374 g004
Figure 5. Characteristics of the physical distribution of the sandstone reservoir in He8 member in the study area. (a) Cross plot of porosity and permeability, (b) cumulative porosity distribution.
Processes 11 02374 g005
Figure 6. Minerals and pore types of sandstone reservoir in He8 member in the study area. Q = quartz, F = Feldspar, R = Rock fragments, I = Illite, and K = Kaolinite. (a) Residual intergranular pores and dissolution pores; (b) Microfracture and residual intergranular pores; (c,d,f) Intragranular dissolution pores; (e) Shrinkage fractures (green arrows); (gi) Intergranular pores (green arrows).
Processes 11 02374 g006
Figure 7. Capillary pressure curves, and pore throat size distribution curves of feldspathic lithic sandstone samples (a,b) and lithic sandstone samples (c,d). (a,c) Capillary pressure curves, (b,d) pore throat size distribution characteristics.
Processes 11 02374 g007
Figure 8. Quantitative parameter statistics of porosity evolution in He8 member of Ningwu Basin.
Processes 11 02374 g008
Figure 9. Photomicrographs showing quartz and carbonate cements of He8 member sandstones in Ningwu basin. Q = quartz, F = Feldspar, R = Rock fragments, P = Pores. (a) Quartz overgrowth and authigenic quartz crystals (green arrows), well NT1; (b) Authigenic quartz crystal (green arrows); (c,d) Fe-dolomites (stained red) filling in large intragranular and intergranular pores, well NT1.
Processes 11 02374 g009
Figure 10. Diagenetic sequence of He8 member sandstone in the study area. Abbreviations: Syn. = Syndiagenesis.
Processes 11 02374 g010
Figure 11. Cross plot of rigid minerals and porosity of sandstone reservoir in He8 member in the study area. (a) Porosity vs. feldspar content, (b) porosity vs. quartz content, and (c) porosity vs. carbonate minerals content.
Processes 11 02374 g011
Figure 12. Cross plot of plastic minerals and porosity of sandstone reservoir in He8 member in the study area. (a) Porosity vs. rock fragments content, (b) porosity vs. kaolinite content, (c) porosity vs. chlorite content, and (d) porosity vs. illite content.
Processes 11 02374 g012
Figure 13. Photomicrographs showing rock fragments, illite, and kaolinite of He8 member sandstones in Ningwu basin. Q = quartz, F = Feldspar, R = Rock fragments, IL = Illite, K = Kaolinite, and P = Pore. (a,b) rock fragments of acidic extrusive rocks and metamorphic (green arrows), well NT1; (c) Vermicular kaolinite (K); (d) Fibrous illite (IL) well NT1.
Processes 11 02374 g013
Figure 14. Verification diagram of porosity prediction based on well NT1 and well NT8.
Processes 11 02374 g014
Figure 15. Average porosity distribution of sandstone reservoir in He8 member of Ningwu South Block.
Processes 11 02374 g015
Table 1. Pore evolution parameters of tight sandstone reservoirs in He8 member of the Ningwu Basin.
NumberLithologyDepth
/m
Content of Cement (C)/%Measured Porosity (P0)/%Total Plane Porosity
(Pt)/%
Interparticle Plane Porosity
(P1)/%
Dissolution Plane Porosity
(P2)/%
1Feldspathic lithic sandstones1683.412.404.208.341.826.52
21683.97.203.509.172.526.65
31787.412.001.203.231.641.59
41788.012.0010.7017.644.6413.00
51788.57.206.409.582.786.80
61789.07.207.3012.273.288.99
71789.62.407.3011.213.347.87
81790.09.604.908.052.135.93
91790.514.004.507.231.955.28
101791.014.402.806.481.674.81
111792.12.403.305.701.434.26
121832.56.507.508.902.16.80
131857.27.304.406.001.34.75
141857.98.005.505.701.54.20
15Lithic sandstones1792.816.802.304.721.383.34
161793.87.203.706.341.614.73
171794.57.203.505.981.524.46
181795.64.805.709.502.477.02
191796.34.804.808.022.085.94
201797.02.404.708.092.046.05
211798.12.403.608.841.926.92
221798.54.803.405.831.484.35
231819.212.001.406.791.075.72
24Lithic feldspathic sandstones1836.111.407.708.611.86.81
Average8.184.768.012.065.95
Table 2. List of goodness-of-fit test of the multiple linear regression model.
Multiple RDetermination Coefficient/R2Adjusted R2Residual ErrorF-Value
0.950.8840.860.8619.1
Table 3. Comparison of parameters of Sulig and Linxing–Shenfu tight sandstone reservoirs.
Gas FieldLithologyPrimary PorosityRemaining Porosity after CompactionRemaining Porosity after CementationIncreasing Porosity after Dissolution Current Porosity
SuligLithic quartz sandstone/lithic sandstone41.226.817.912.39.3
Linxing–ShenfuFeldspar lithic sandstone/lithic sandstone35.625.17.82.86.2
Disclaimer/Publisher’s Note: The statements, opinions and data contained in all publications are solely those of the individual author(s) and contributor(s) and not of MDPI and/or the editor(s). MDPI and/or the editor(s) disclaim responsibility for any injury to people or property resulting from any ideas, methods, instructions or products referred to in the content.

