Article

Experimental Study and Mathematical Modeling under Various Hot-Air Drying Conditions of Thin Layer Olive Pomaces

EMIR Laboratory, University of Monastir, 15 Avenue Ibn Eljazzar IPEIM, Monastir 5019, Tunisia
*
Author to whom correspondence should be addressed.
Processes 2023, 11(9), 2513; https://doi.org/10.3390/pr11092513
Submission received: 20 July 2023 / Revised: 8 August 2023 / Accepted: 9 August 2023 / Published: 22 August 2023

Abstract

:
The present work studies the convective drying of a granular porous medium in a bed of olive pomace. The experimental tests were conducted in a closed convection drying loop of hot air. The experimental tests measured the mass loss over time. Tests were carried out for five temperature values: 60 ± 0.1 °C, 70 ± 0.1 °C, 80 ± 0.1 °C, 90 ± 0.1 °C and 100 ± 0.1 °C, respectively. Moreover, three values of velocities of the drying air, 1 ± 0.01 ms−1, 1.5 ± 0.01 ms−1 and 2 ± 0.01 ms−1, were considered. The effects of initial humidity, bed thickness and pomace composition on the drying process were studied. The results show that the moisture content decreases when the temperature and the velocity of the drying air increase. In addition, the composition of olive pomace (pulp, pits and raw pomace) significantly affects the drying time. A characteristic drying curve and its equation were determined. Seven thin layer drying models were tested, and the Midilli et al.’s model produced the best agreement. The effective moisture diffusivity coefficient (Deff), the activation energy (Ea) and the pre-exponential coefficient of the Arrhenius law were evaluated. The results could be of great help for the pretreatment of crude olive pomace when moving to industrial scale and before passing to the step of biofuel (pellets, briquettes or logs, Syngas) production.

1. Introduction

In recent years, biomass has emerged as a promising renewable energy source for solid, liquid and gas biofuel production via thermochemical conversion processes for the goals of heat and electricity production. The main goal is to replace conventional fuel oil, natural gas and coal, which are the subject of future depletion and are currently the main sources of harmful environmental and health effects [1].
A large quantity of agri-food byproducts of agricultural crop wastes (about 4.427 tons) and olive mill residues (about 2 million tons) are generated each year in Tunisia [2]. Indeed, after the olive oil extraction stage, the olive industry wastes are divided into two types: solid byproducts (olive pomace) and liquid byproducts (olive mill wastewater). If released in open natural basins and in high quantities, these wastes could be considered to be a harmful source of environmental pollution [3]. However, remediation of this could be possible when using these sources for the production of green energy via combustion, pyrolysis or gasification of biofuels [4], soil fertilizer [5] or chemical products based on polyphenols, which are abundant in these sources [6]. Furthermore, activated or deactivated biochar produced from olive mill solid waste could be very efficient as a soil amendment and for removing hazardous pollutants [7]. These sources of biomass, and more precisely, the raw olive pomace, which interest us in the present study, present high moisture content, especially when using the two-phase extraction process [8,9]. More precisely, the olive pomace ratio accounts for about 25–30% of the olives processed. However, the water content depends on the olive oil extraction system. Indeed, with the pressure system, the processing of 1 ton of olives generates an average of 330 kg of olive pomace, whose humidity is between 25 and 30%. But, with the continuous chain by centrifugation, the same amount of olives provides on average 550 kg of olive pomace with a moisture content varying between 45 and 68% [10]. Hence, the upgrading of this olive byproduct requires the reduction of moisture by up to 6 to 10%. Hence, a drying process is essential.
Many studies dealing with the drying process, either through an experimental approach or through a modelling/simulation approach, have been reported in the literature. Zomorodian et al. [11] determined the equilibrium moisture content Xe for canola seed in various equilibrium-relative humidities of air and for three temperatures. To fit the adsorption isotherm curves obtained from the experiments, they compared thirteen mathematical and semi-empirical models. They concluded, based on the estimations of R2 (coefficient of determination), χ 2 (the chi-square) and the RMSE (root-mean-square error), that the Halsey model showed an efficient fit to their curve at 25 and 40 °C. Also, they concluded that the GAB model, at 55 °C, exhibits good agreement with their experimental data.
Moreover, Rabha et al. [12] investigated the drying of a thin layer of pepper in an indirect-type forced convection solar tunnel containing two double-pass solar air heaters mounted in series and under the open sun. They observed that, for a 200 g sample, the humidity content decreased from 58.96% (db) to 12% (db) within 123 h for the drying using solar energy and within 193 h for the open sun case. By comparison with the experimental results from mathematical models available in the literature, they concluded that the Midilli and Kucuk model was the best in the case of chili peppers dried under a solar dryer based on forced convection, whereas the Page and the Modified Page models were the most satisfactory in the case of an open sun-drying process for the same sample type.
In a recent work, Mellalou et al. [13] studied the different drying properties (efficiency, consumption of the specific energy, etc.) of three-layer thicknesses of two-phase olive pomace dried in a hybrid greenhouse (solar/hot air) dryer. They concluded that the initial moisture fell from 54 wt% to 20 wt% within 14, 32 and 53 h for 2, 4 and 6 cm layer thickness, respectively. Also, they stated that the two-term Gaussian model produced the best fit with the experimental data. In addition, kinetics, as a crucial necessity of industrial activities, has a main role in thin-layer porous-medium dehydration. This is why a good understanding of all types of moisture is necessary [14]. In this review paper, the authors produced a model-free method and a model-fitting method and examined their applicability to different drying processes for lignite, taking into account various factors, including the humidity percentage, the size of the particle, the heat transfer process, the form of the pore, the temperature used for drying and the pressure. All of this is advantageous to the lignite upgrading industry due to our understanding of what happens at the microscopic level during moisture dehydration. In the same context as the above, the present investigation seeks to provide a better insight into the diffusion mechanisms that govern the drying mechanism of olive pomace, investigated in a thin-layer porous medium. For that, an experimental device consisting of a closed convection drying loop of hot air was used. Measurements of moisture content for different isothermal temperatures, different hot air velocities and different layer thicknesses were considered.
Given the complexity of the drying mechanisms, a kinetic study based on seven semi-theoretical and/or empirical thin-layer drying models was carried out, and a the most suitable models were identified. We have gathered the experimental results for various conditions of the drying air on a single curve, which is the characteristic drying curve (CDC), whose use is very practical for scientists and industrialists through its polynomial fit of 4 degrees, which describes the macroscopic behavior during the drying of olive pomace. Finally, we evaluated the kinetic parameters of the Arrhenius law.
Although preliminary and limited to laboratory scale, the present study on raw olive pomace drying allows us to understand the drying mechanism and the most influential parameters, especially when extending this study to the industrial scale using a rotary dryer fed with hot combustion gases or a dryer using solar energy to preheat the convective air.

2. Materials and Methods

2.1. Experiment

From the Zouila Company specialized in olive oil, olive pomace and soap manufacturing (Mahdia, Tunisia), some olive pomaces have been gathered. The dominant olive species is the so-called “Sahli Chemlali” in the Sahel region of Tunisia, which is one of the 54 varieties of olive tree in Tunisia. The method used is that of centrifugation in two phases. The olive pomace has been processed raw without sieving. Consequently, the grain size varies between 0.2 and 2 mm. The initial humidity content of olive pomace varied from 58 wt% to 60 wt% (w. b.). The literature reported the work by Krokida et al. [15] who built a theoretical model, which will be used to operate an industrial rotary dryer. The wind tunnel used in our study, shown in Figure 1, is located within the closed-circuit laboratory (LETTM, Faculty of Sciences of Tunis, Tunis, Tunisia). It is installed in a large, insulated room in order to minimize thermal and hygrometric variations of the outside environment. The airflow is produced by a centrifugal fan of adjustable frequency and using a speed variator. The air, which was previously heated, was sent perpendicular to the surface of the thin layer of sample placed in a rectangular support whose dimensions are: 14 ± 0.1 cm wide, 16 ± 0.1 cm long and 2 ± 0.1 cm thick. The dryer was run for about 30 to 60 min before the drying experiments to reach thermal stabilization. Once the drying temperature and air velocity were set, the stand containing the wet sample of olive pomace was placed in the drying chamber on the tray and a stopwatch was started to record the time of the drying process. The variation of the wet mass (mh(t)) with respect to time was resolved through measuring three times in 3 min using a precision scale (±0.01 g) and by calculating the average of the three measurements. The dried sample was then placed for 24 h in an oven brought to the temperature of T = 105 °C to determine its dry mass ms. We have considered drying air temperatures of 60 °C, 70 °C, 80 °C, 90 °C and 100 °C. The chosen air speeds were 1 ms−1, 1.5 ms−1 and 2 ms−1. Two thickness layers were tested, 2 cm and 4 cm. Once the mass of used samples reached a constant value in at least three consecutive weighings, the drying test was ended.

2.1.1. Drying Models

The content of moisture with respect to time is expressed as follows:
X t = m h t m s m s
where X ( t ) is the humidity content, mh(t) is the samples’ wet mass at instant t and ms is the stabilized mass of the dry sample.
We define the moisture ratio for given samples during the phase of drying as:
X r = X t X e X c X e  
Based on previous research [16], we can consider that X c = X 0 . Thus, by comparing the equilibrium moisture content value X e with the initial moisture content X 0 and X ( t ) , we can conclude that X e value is negligible and the moisture ratio can be expressed as follows:
X r = X t X 0      
In order to find the satisfactory model fitting of the drying curves, we considered seven drying models. A nonlinear optimization system using the “Origin.Pro.8” (OriginLab corporation, Northampton, MA, USA) data processor was used for curve fitting. In Table 1, we give the expressions of Xr defined for each model. R2 (the coefficient of determination) and χ2 (the reduced chi-square) are the main parameters for judging the effectiveness of the proposed models. Various statistical factors were calculated using the following Equations [17]:
R 2 = 1 i = 1 N ( X r   p r e , i X r   e x p , i ) 2 i = 1 N ( X r   p r e , i ¯ X r   e x p , i ) 2
χ 2 = i = 1 N ( X r   p r e , i X r   e x p , i ) 2 N n
where, X r   e x p , i and X r   p r e , i correspond to the experimental moisture ratios and the predicted ones. “n” is the number of constants and “N” is the number of observations.
To understand the drying behavior and the efficiency of the process, we calculated the drying rate, which can be determined experimentally using [12]:
D r X t + Δ t X t Δ t
D r is the rate of drying expressed, ∆t is the time taken for drying, and X t + Δ t and X t represent, respectively, the moisture contents at time t + Δ t and at time t.

2.1.2. The Effective Diffusivity (Deff) and the Activation Energy (Ea)

During the drying phase, many parameters are involved such as heat, momentum and mass transport mechanisms. During manipulation, the convection of hot air passes across the moist products. A transfer of heat takes place from the surface to depth through convection. The transfer of mass, including all kinds of humidity, takes place from depth towards the surface of the sample then it evaporates in the external environment due to the continuous supply of heat. Indeed, under the action of the concentration gradients, the internal mass transfer is carried out by the capillary flow of diffusion and the viscous flow inside the products [25]. As for almost all agricultural products, the transport of liquid water within the olive pomace is achieved by pure diffusion phenomena and this is because of the effect of the concentration gradient [25]. The diffusion of water is described by an effective diffusion coefficient because it represents several elementary mechanisms of water transfer (migration by capillarity, vapor diffusion, etc.) and this coefficient depends on the moisture content of the product, the temperature and the retraction of the product. In the case of olive pomace, we assumed that diffusion is the main cause of moisture transfer, then, the shrinkage of the product is neglected and the diffusion coefficient and temperature hold constant values. The diffusion process is developed and studied based on Fick’s second law [26], which can be modeled for the one-dimensional case in Cartesian coordinates as follows:
X t = D e f f 2 X x 2  
where X is the content of moisture on dry basis, x is the space variable and D e f f m 2 s 1 presents the diffusion coefficient. By referring to the development of Crank’s Equation [27], we can apply the solution of the equation for particles with slab geometry whose expression is:
X r = 8 π 2 n = 0 1 ( 2 n + 1 ) 2 e x p ( 2 n + 1 ) 2 π 2 D e f f t 4 L 2  
Here, L defines the sample’s half thickness. Using the approximation, assuming that only the first term in the series (Equation (8)) is significant, the expression of Xr is truncated to the following form:
X r = 8 π 2 exp π 2 D e f f t 4 L 2  
Then, the logarithmic form of Equation (9) can be expressed as follows:
L n X r = L n 8 π 2 π 2 D e f f 4 L 2 t
Therefore, the effective diffusion coefficient D e f f can be determined by using the slope of Equation (10).
The Arrhenius Equation below expresses the interaction between the diffusion coefficient ( D e f f ) and the activation energy ( E a ) as well as its dependence on temperature:
D e f f = D 0 exp E a R T
where D 0 in   m 2 s 1 denotes the pre-exponential factor of the Arrhenius law and E a is the activation energy ( k J m o l 1 ), R is the universal gas constant ( k J m o l 1 K 1 ) and T is the drying air temperature (K). The activation energy is defined as the required barrier energy that should be crossed to reach stability. It can be determined after calculating the slope of the Arrhenius curve when representing L n ( D e f f ) versus   ( 1 / T ) . The slope of the curve is ( E a R ) and the intercept is L n ( D 0 ) .

3. Results and Interpretations

3.1. Influence of the Temperature of the Drying Air

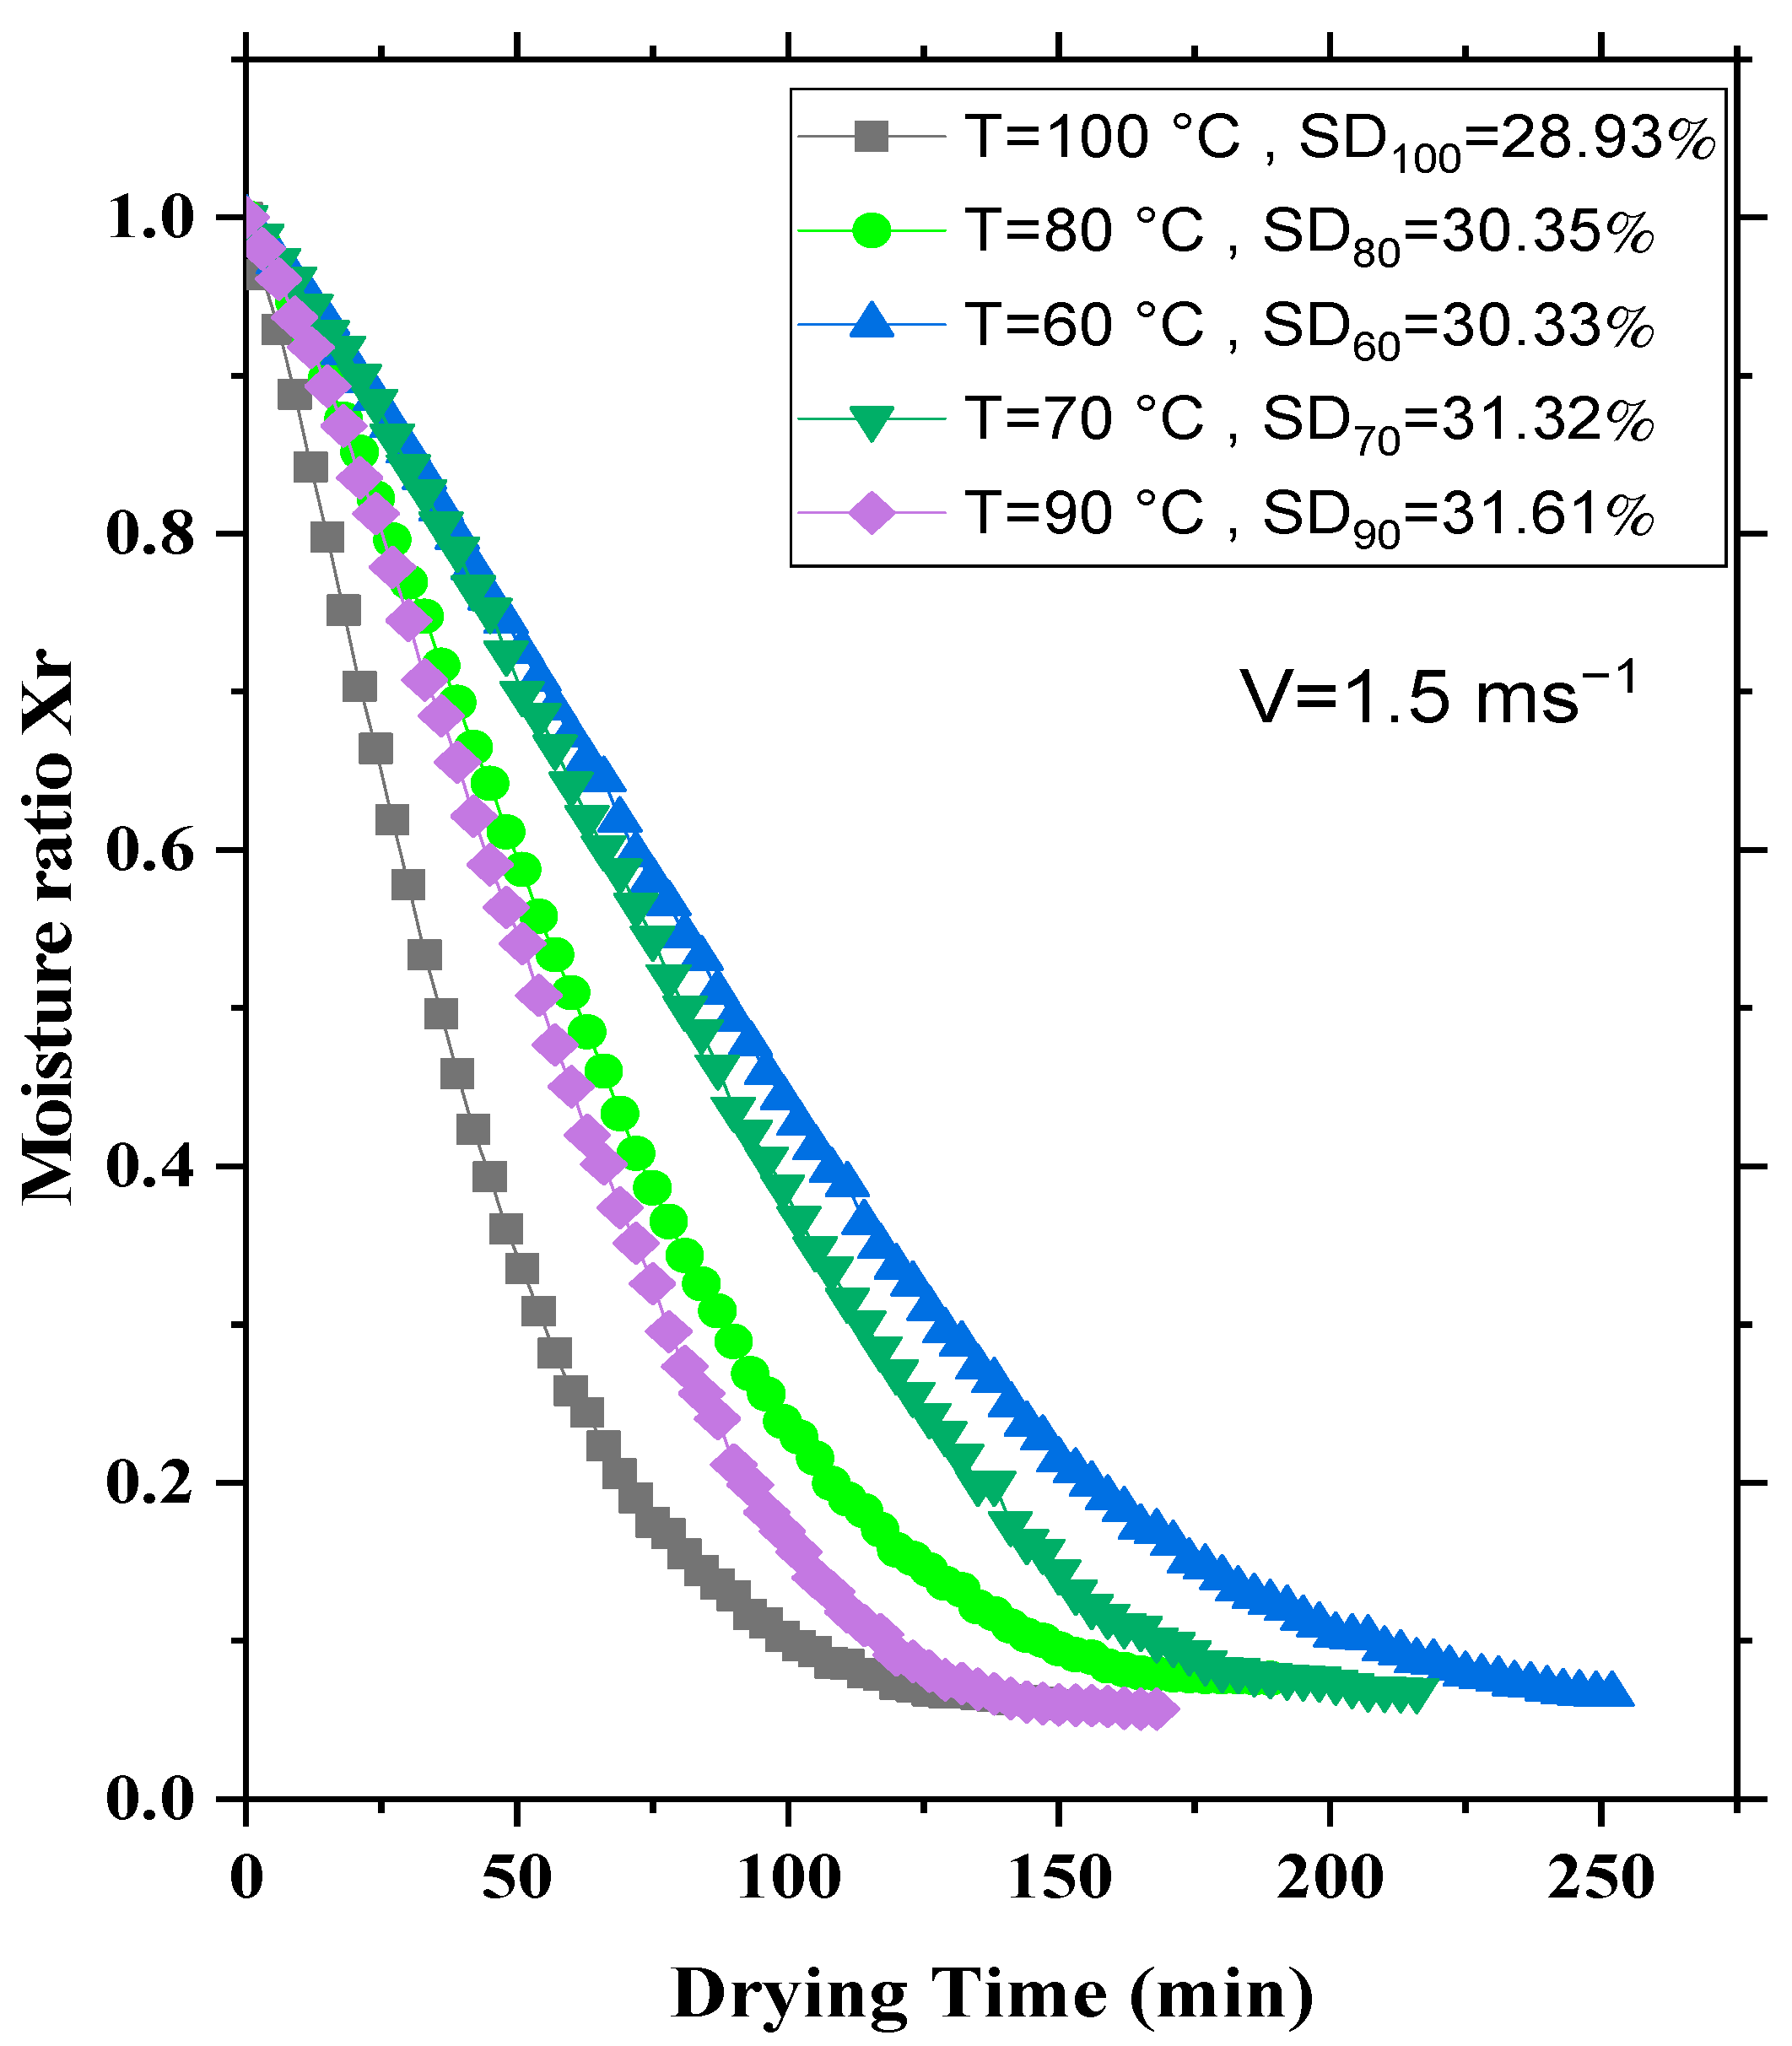
Figure 2 illustrates the variation of the dimensionless moisture content (Xr) as a function of the drying time (t) for a speed of the drying air equal to 1.5 ms−1. As expected, drying kinetics are significantly affected by the temperature of the drying air.
Indeed, an increase in T for a limited time causes a drastic decrease in X. This is explained by the evaporation phase, which accelerates with an increase in temperature. In fact, the times necessary to reduce the humidity of the product to about 8% are, respectively, 219 min at T = 60 °C, 178 min at T = 70 °C, 155 min at T = 80 °C, 121 min at T = 90 °C and 108 min at T = 100 °C. Hence, this increase in the temperature of the drying air leads to a rise in the heat flow brought by the air to the sample and thus an acceleration in the evacuation of the water molecules from the inside to the outside of the sample. These findings are in good agreement with previous work on the drying of olive pomace [26,27,28]. Due to the presence of different types of moisture in the olive pomace sample, its migration and release into the evaporative process occurs in different stages. This trend appears in all curves in Figure 3. Hence, each curve corresponding to an isothermal temperature could be divided into three stages as discussed by Zhao et al. [29] and Li et al. [30], even though both research teams worked on a different substance (lignite). According to Li et al. [30] and as we can see in Figure 3, these stages of drying are as follows: The first phase, which is a very short warm-up period during which the drying rate increases and the temperature of the sample reaches the temperature of the drying air. Afterwards, comes a period at constant speed (near the peak) during which the heat supplied by the drying air is entirely consumed to vaporize the liquid water and the temperature of the sample remains equal to the temperature of the drying air. In this phase, the surface of the product is saturated with water so that a thin film of liquid is kept on the surface, due to the migration of water from the core of the product to its outer surface caused by capillary pressure. It is a phase that is not easily identifiable because the cell walls disrupt the rapid migration of moisture to the outer surface. The third phase corresponds to the phase in which the speed of drying is decreasing. In this phase, the water transfer within the sample to the surface decreases and is no longer sufficient to maintain a constant drying rate. In this phase, the movement of water towards the surface of the sample is explained by Fick’s second law. In the same context, Zhao et al. [29] called them initial drying at constant speed, then drying at descending speed and finally, drying in depth.

3.2. Impact of the Velocity of the Drying Air

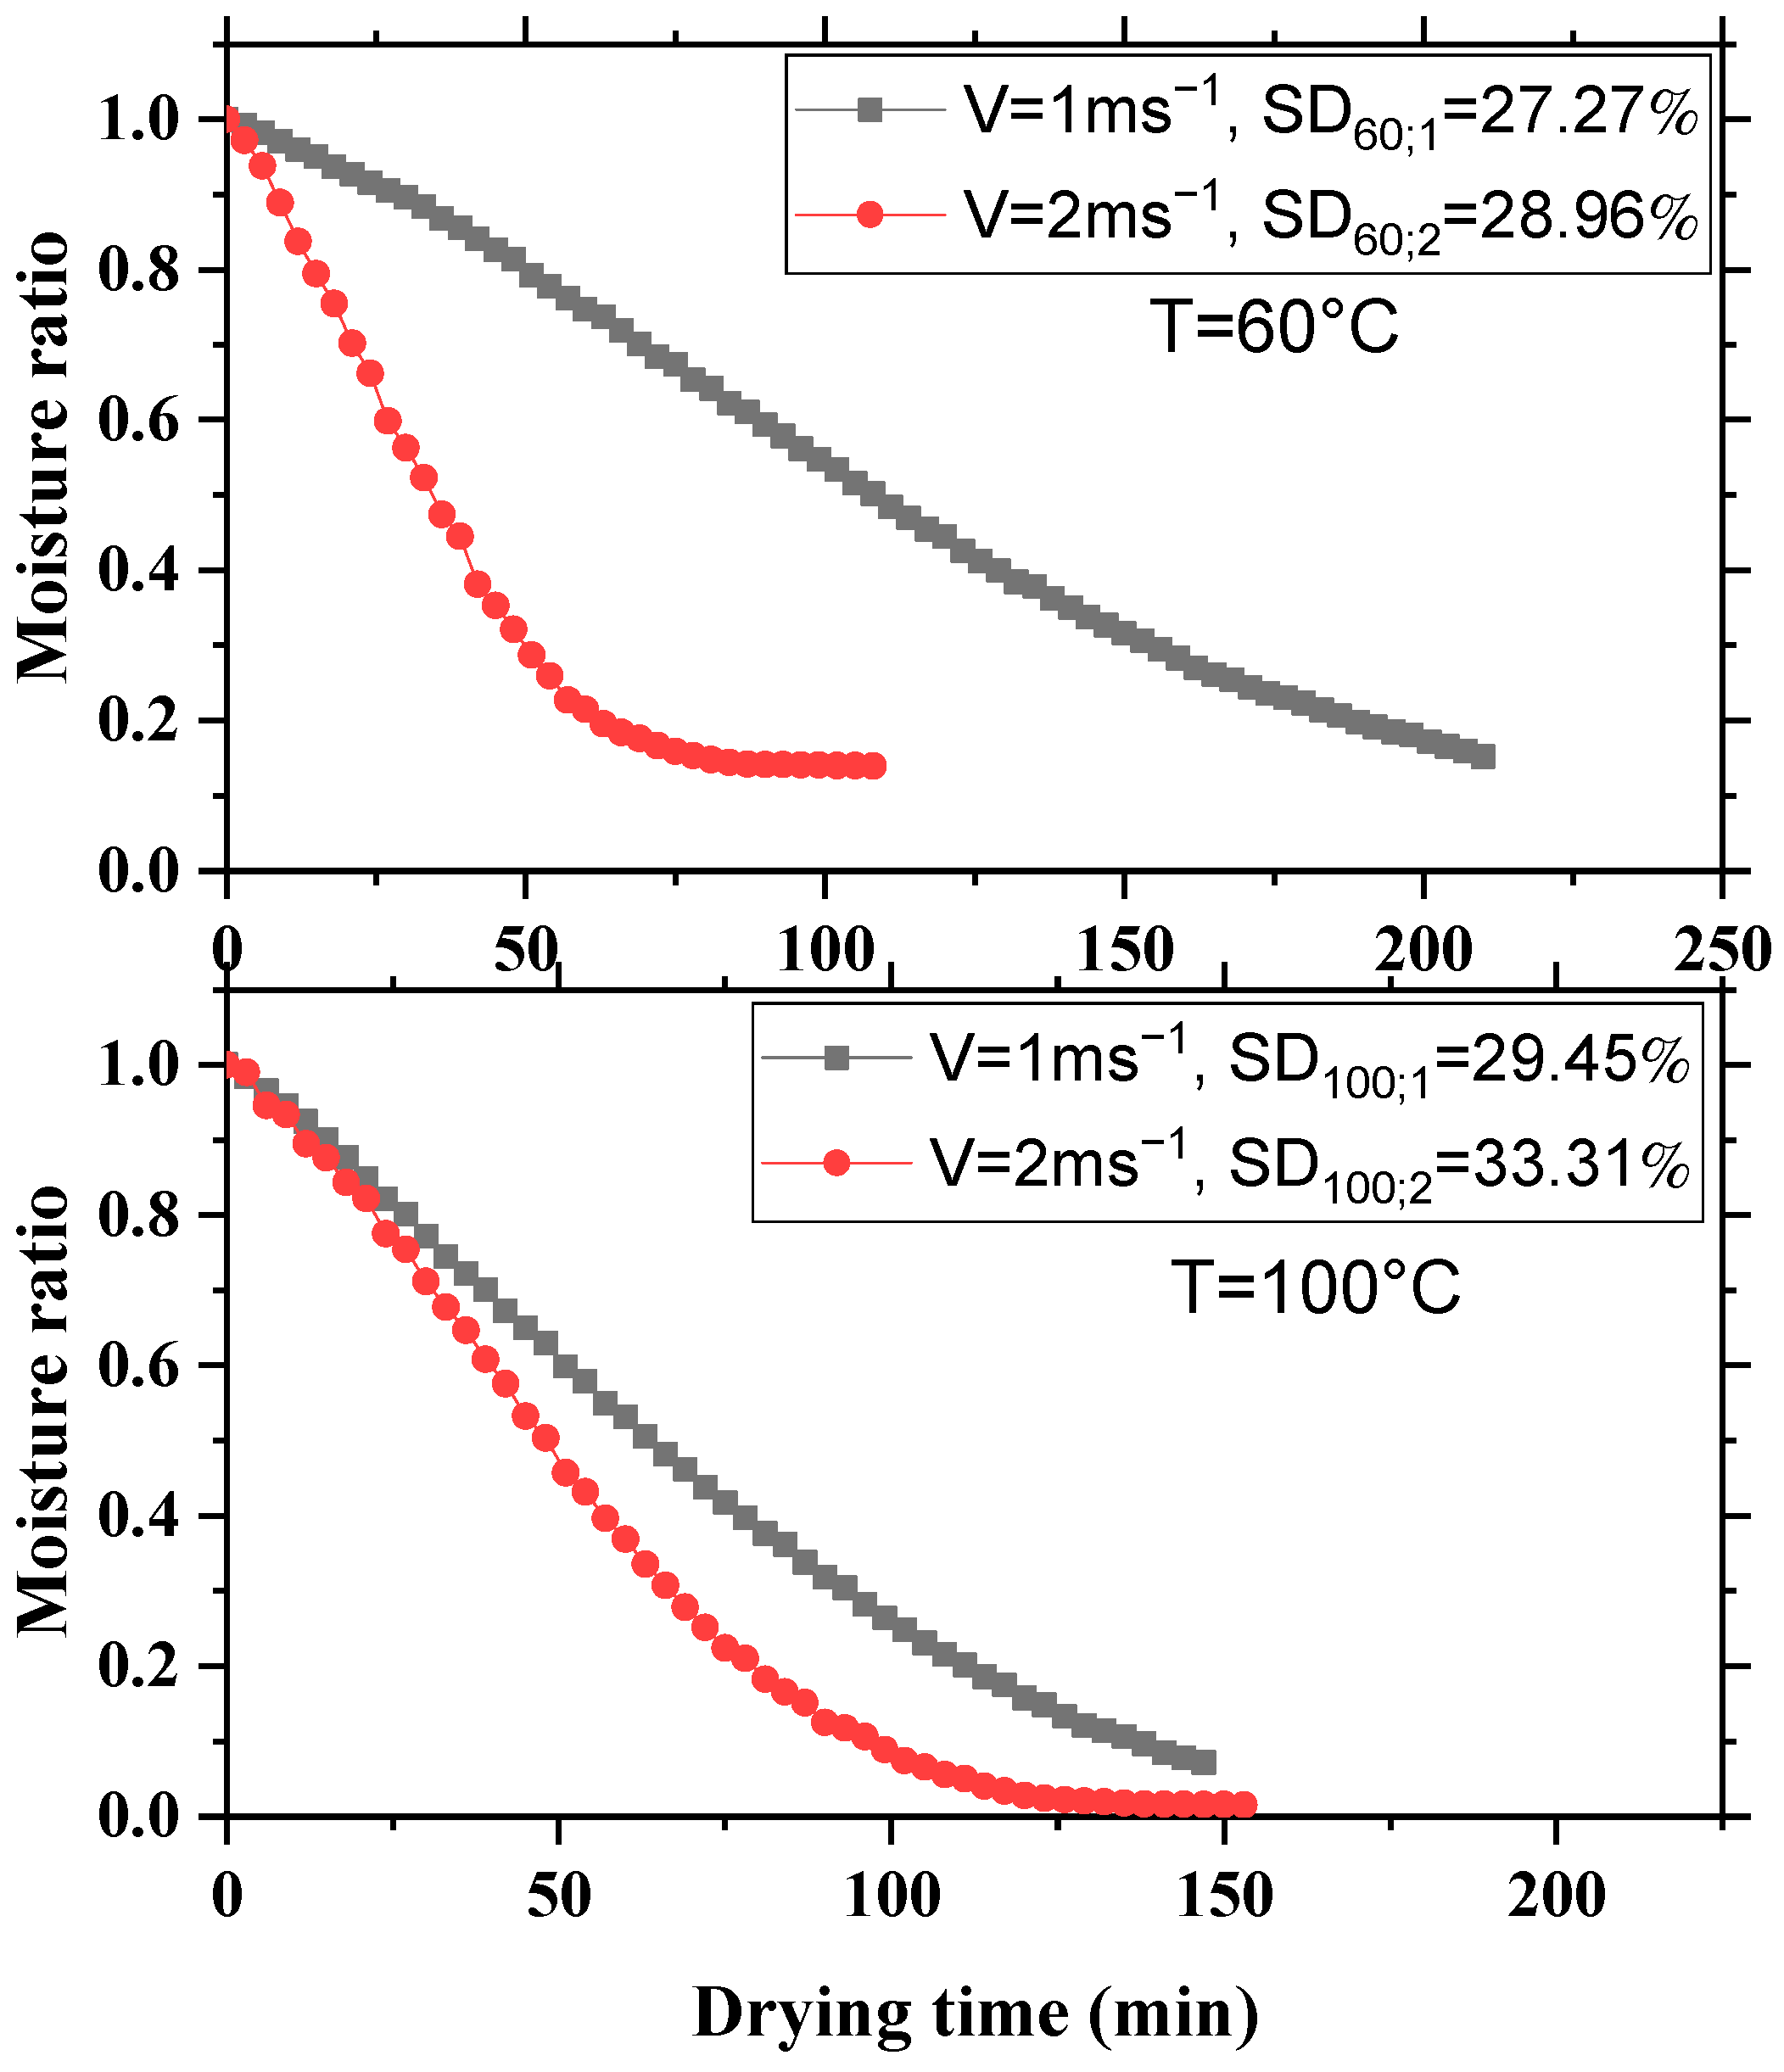
Figure 4 shows the effect of two velocities of the drying air while keeping the same temperature. To accomplish a moisture content of 10 to 15% at T = 60 °C, the drying time is 76 min for V = 2 ms−1 and 204 min for V = 1 ms−1. Thus, by doubling the speed of the drying air, we observe that the time required for drying is reduced by three times. This could be explained by the effect of turbulence when increasing the air velocity and the enhanced heat transfer to the sample. Thereby, the heat flux exchange and the moisture dehydration become more efficient with turbulence, as was reported in the literature [31,32]. However, it can be concluded that for high temperatures and especially for water’s boiling temperature (T = 100 °C), the drying air velocity factor becomes less effective (the drying time was 118 min for V = 1 ms−1 and is reduced to 83 min for V = 2 ms−1). Hence, temperature plays a more important role and the drying air velocity in this particular case.

3.3. Influence of Layer Thickness

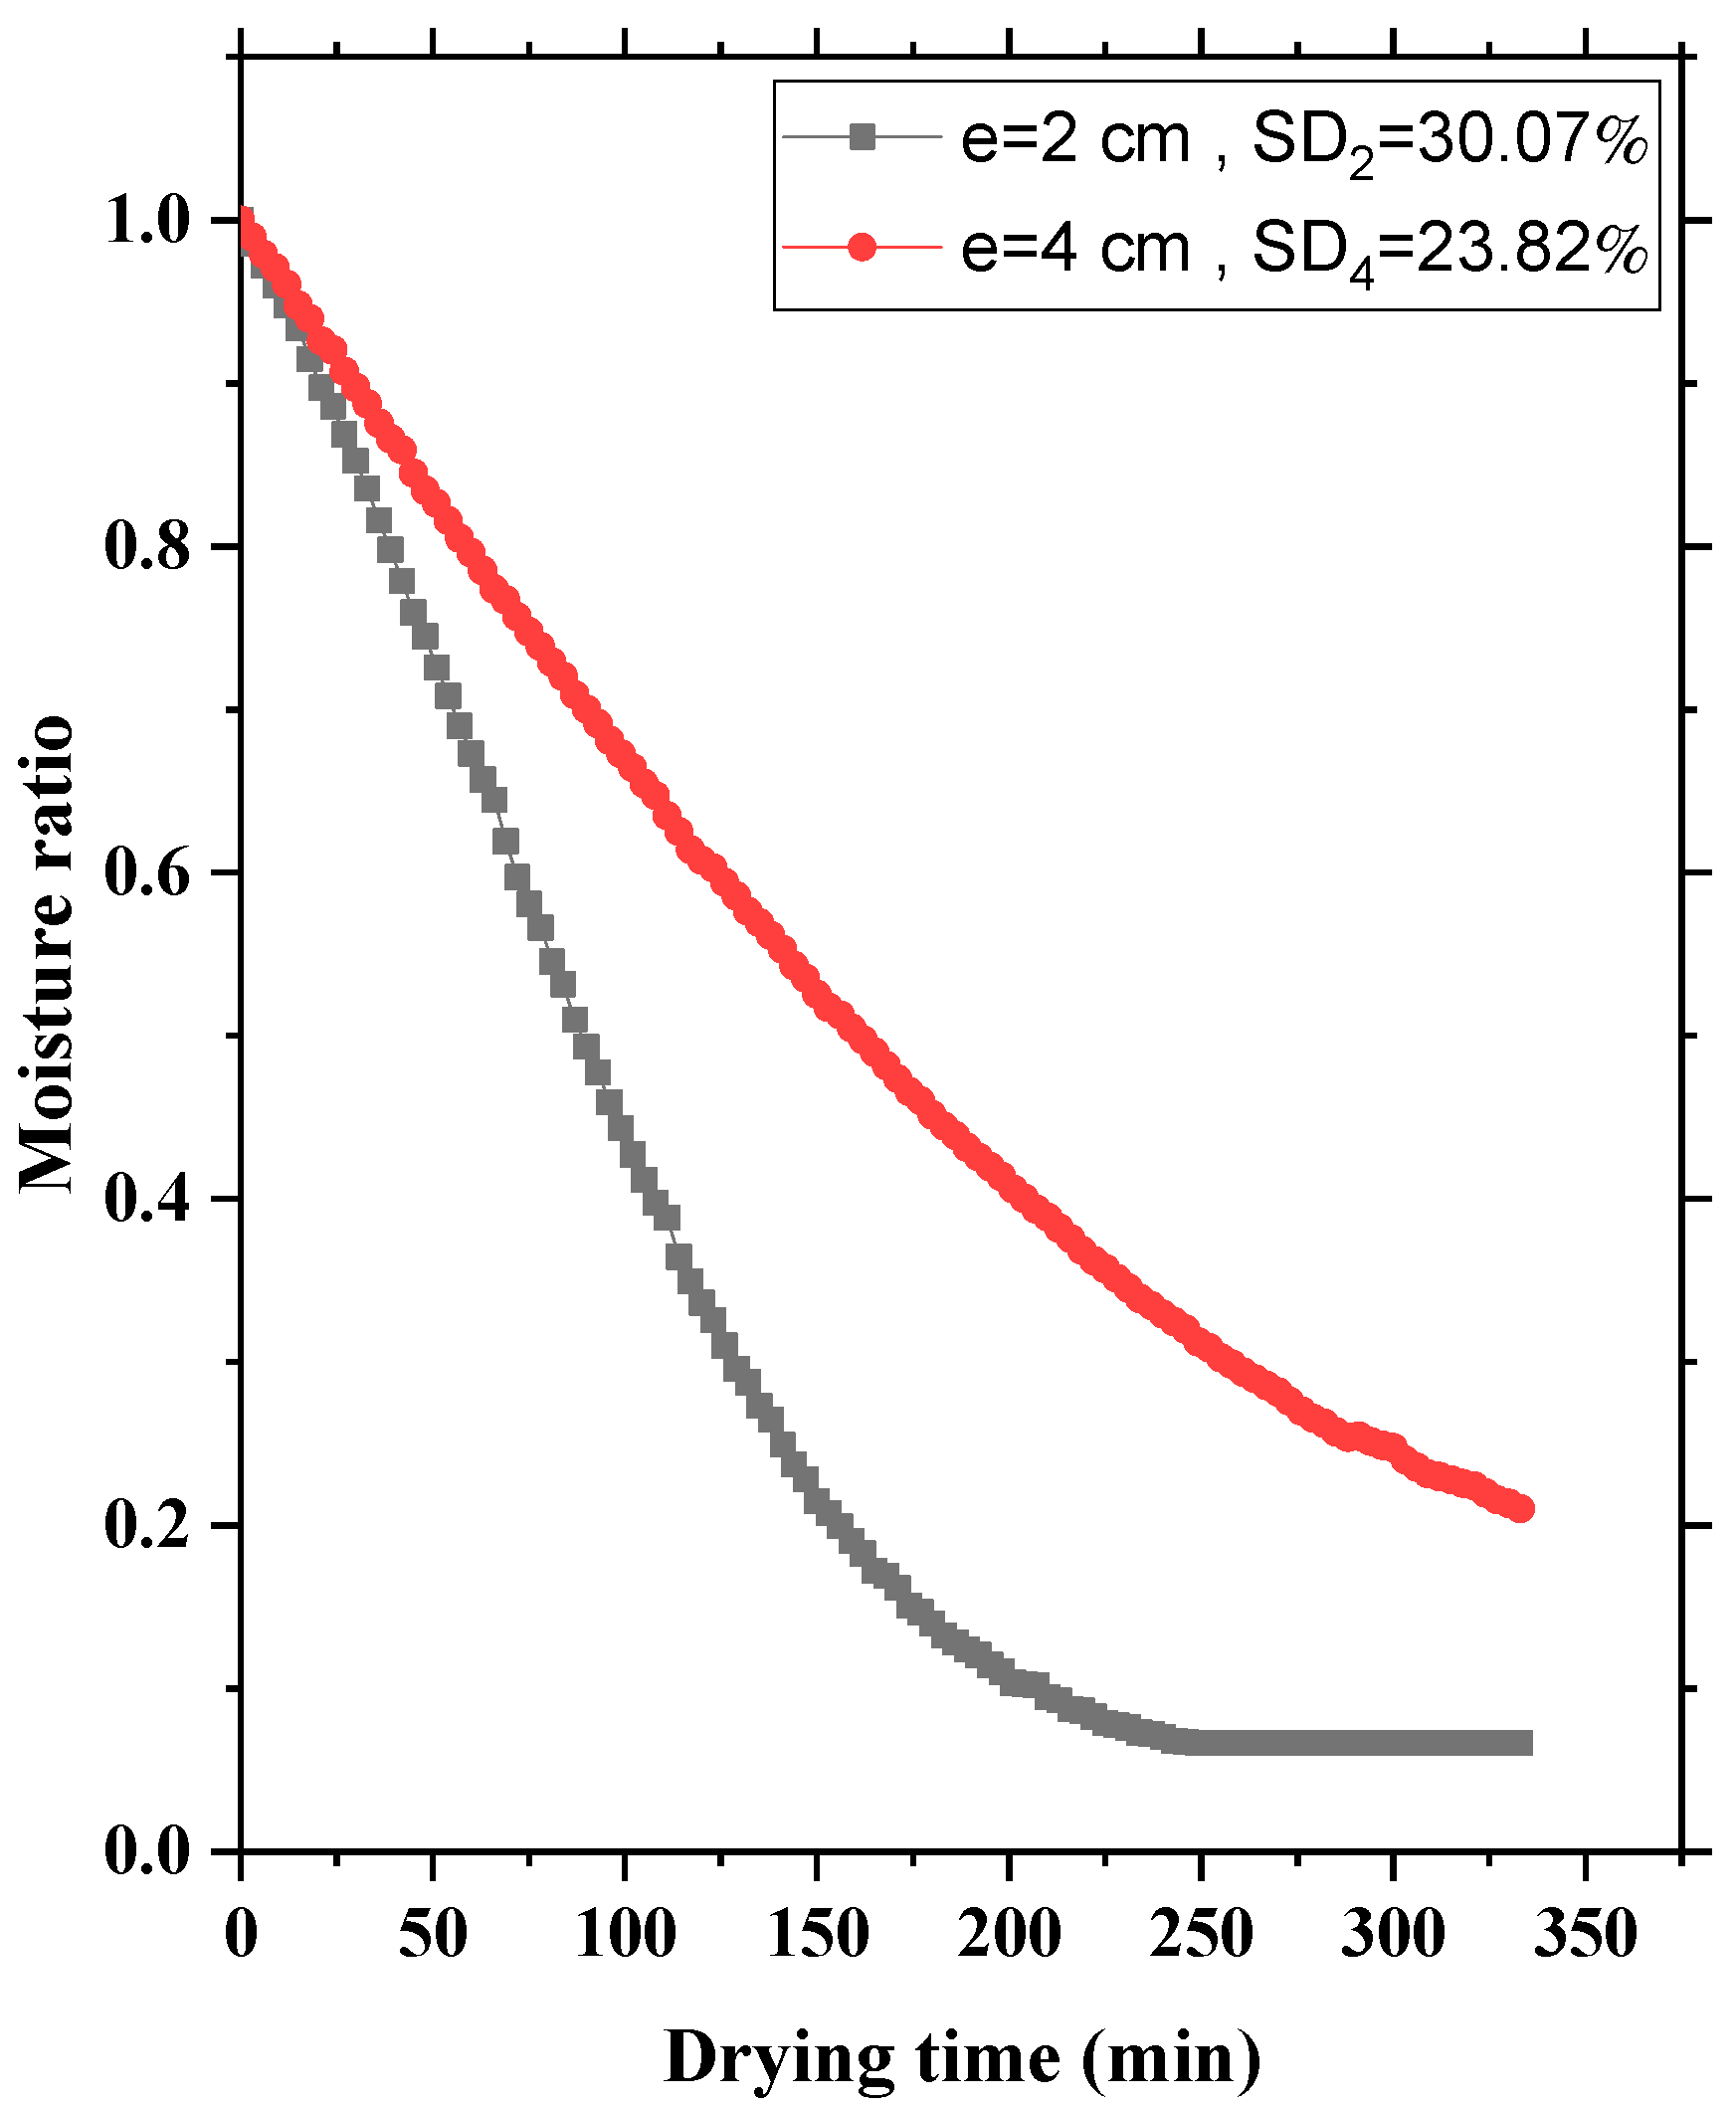
Figure 5 reports the change in humidity versus the time factor at T = 60 °C and V = 1.5 ms−1 for different layer thicknesses. It can be seen that the drying time increases when the sample thickness is higher. In a physical meaning, this could be due to the large distance that the moisture migrated to the surface. Indeed, to reach a humidity of 20%, the drying process took 333 min for a thickness equal to 4 cm, while it took only 156 min for the thickness of 2 cm. This result is in agreement with previous studies [33].

3.4. Influence of Initial Moisture

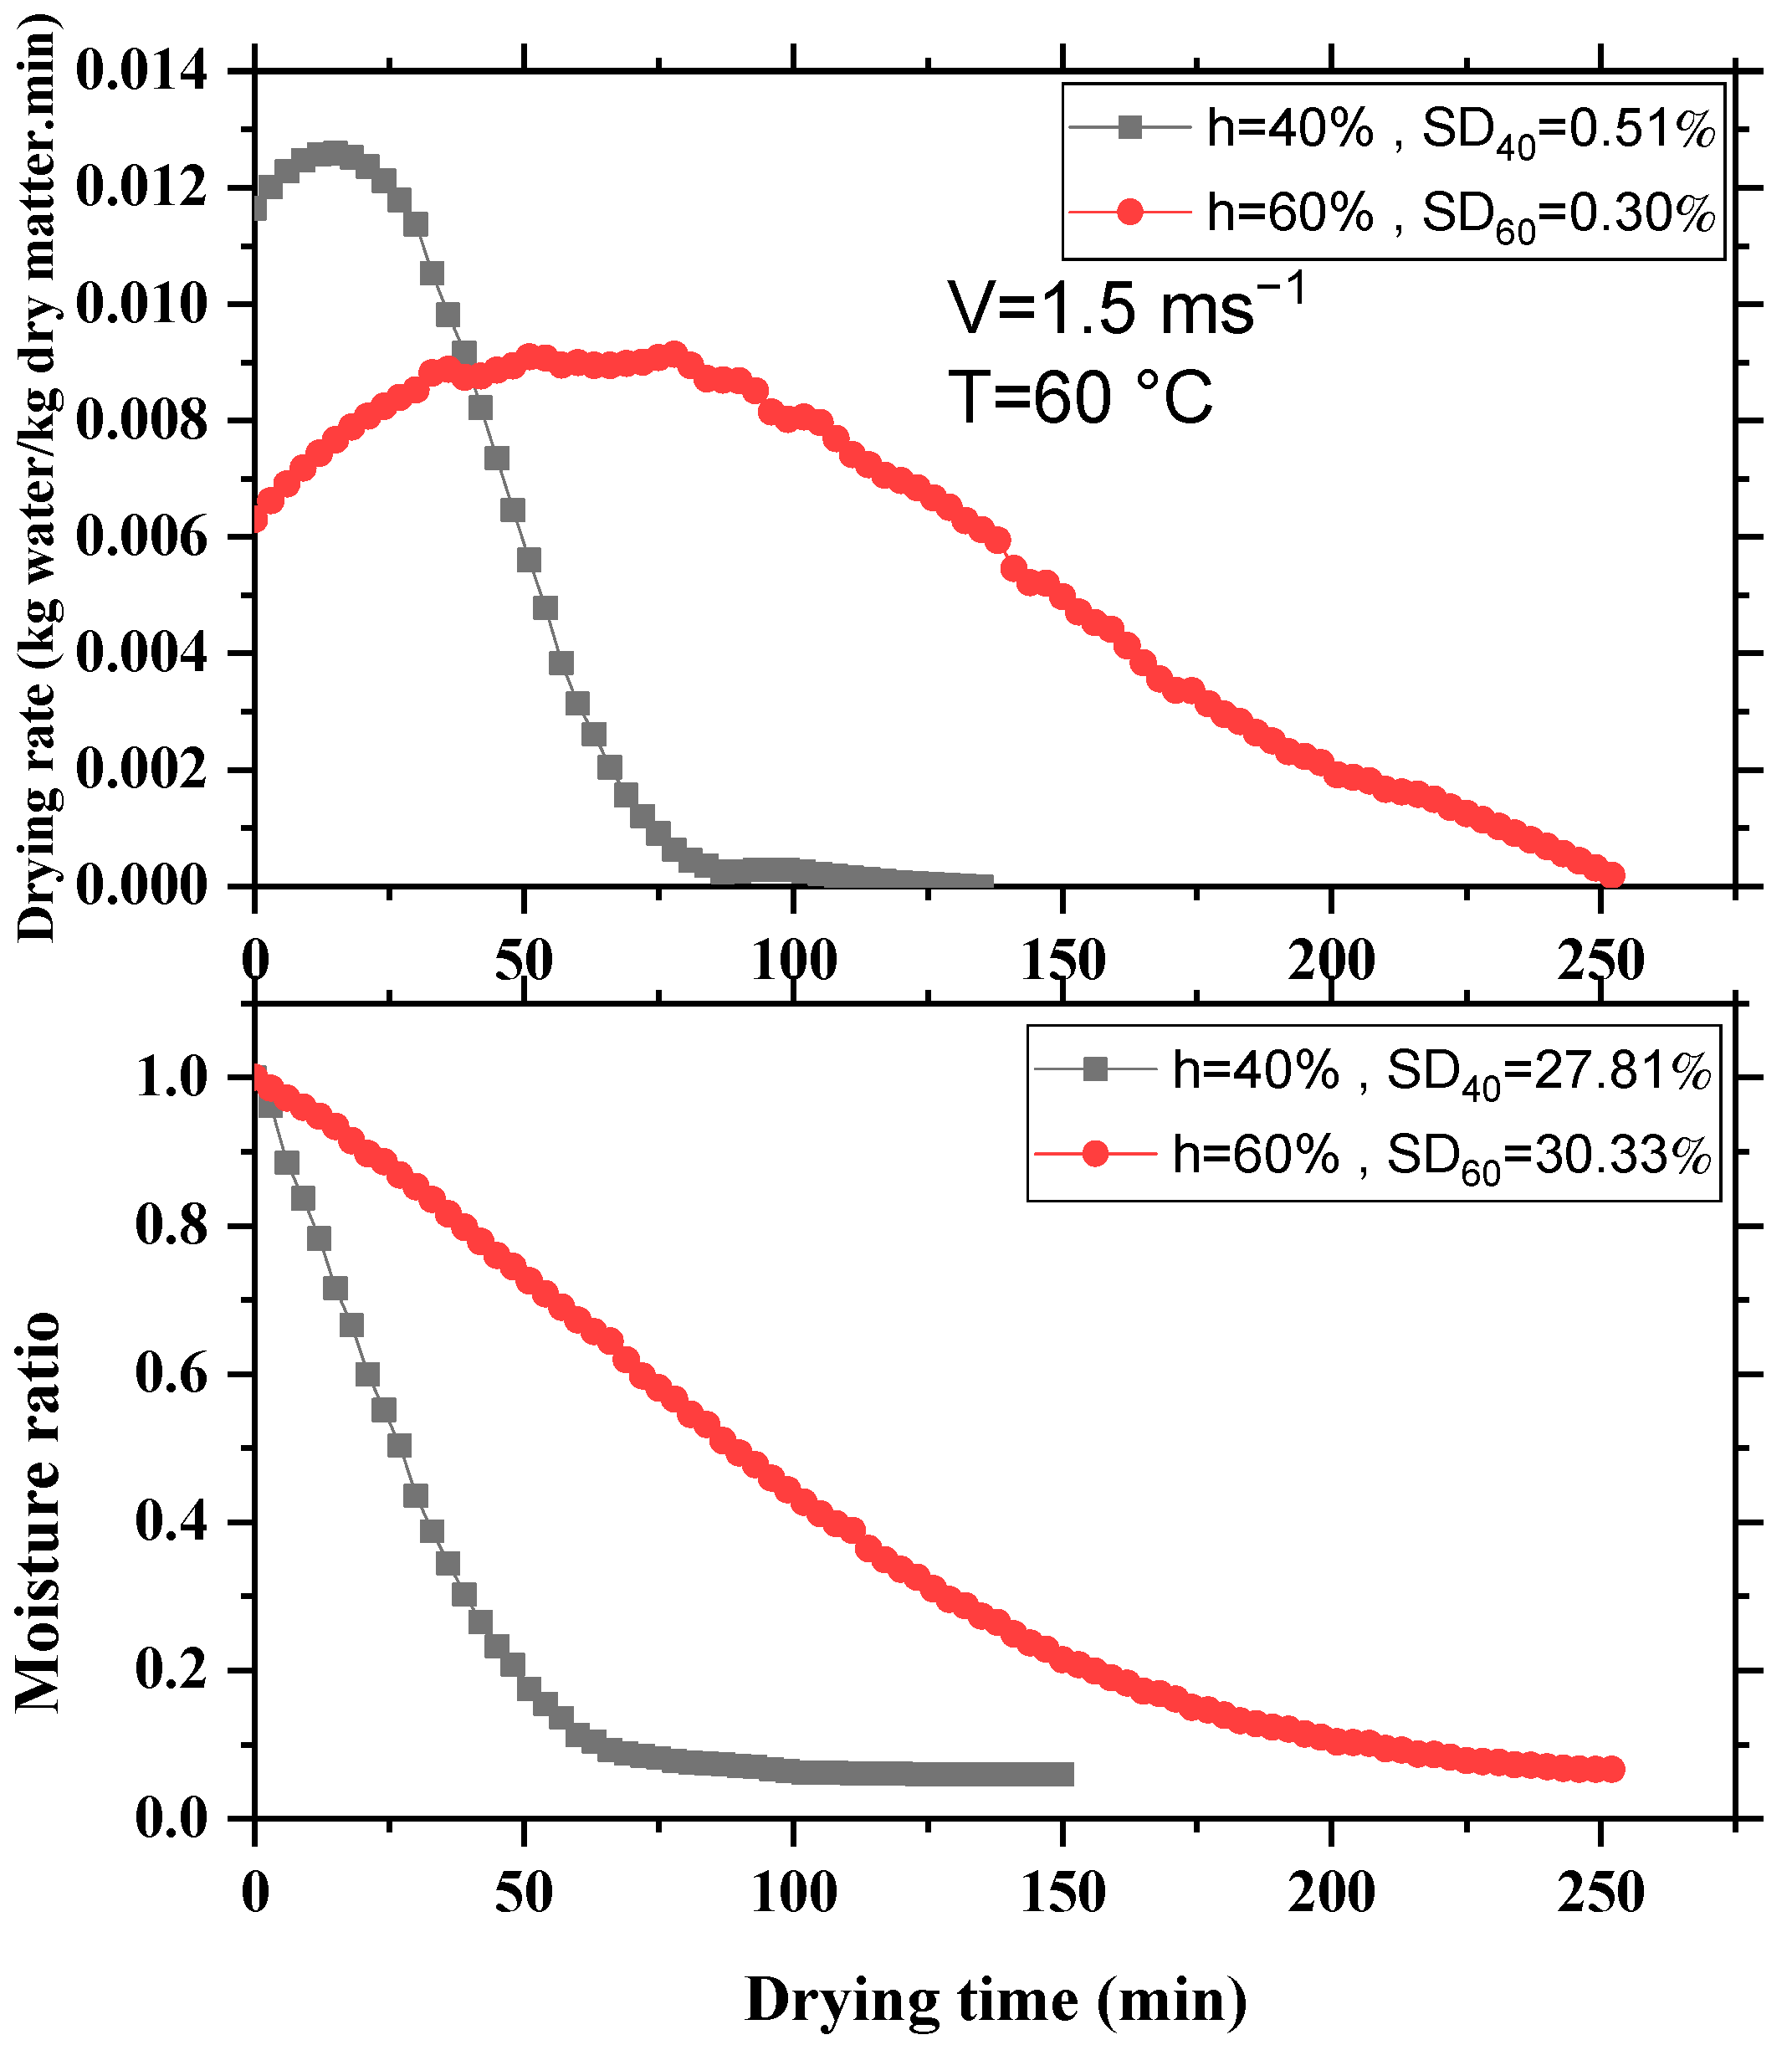
In this section, we investigate the impact of the initial humidity of the sample on the drying procedure. Figure 6 shows how the moisture content and the drying rate vary as a function of time, from two initial humidities of the biomass (40% and 60%). The curves indicate that the drying mechanism depends on the initial humidity content of the by-product. In fact, the figure shows that when the moisture content decreases, the drying time also decreases. More precisely, the time required for the drying of the sample containing 60% humidity is 183 min while it is 62 min for the sample containing 40% humidity under similar conditions (T = 60 °C, V = 1.5 ms−1 and e = 2 cm).

3.5. Influence of Olive Pomace Composition

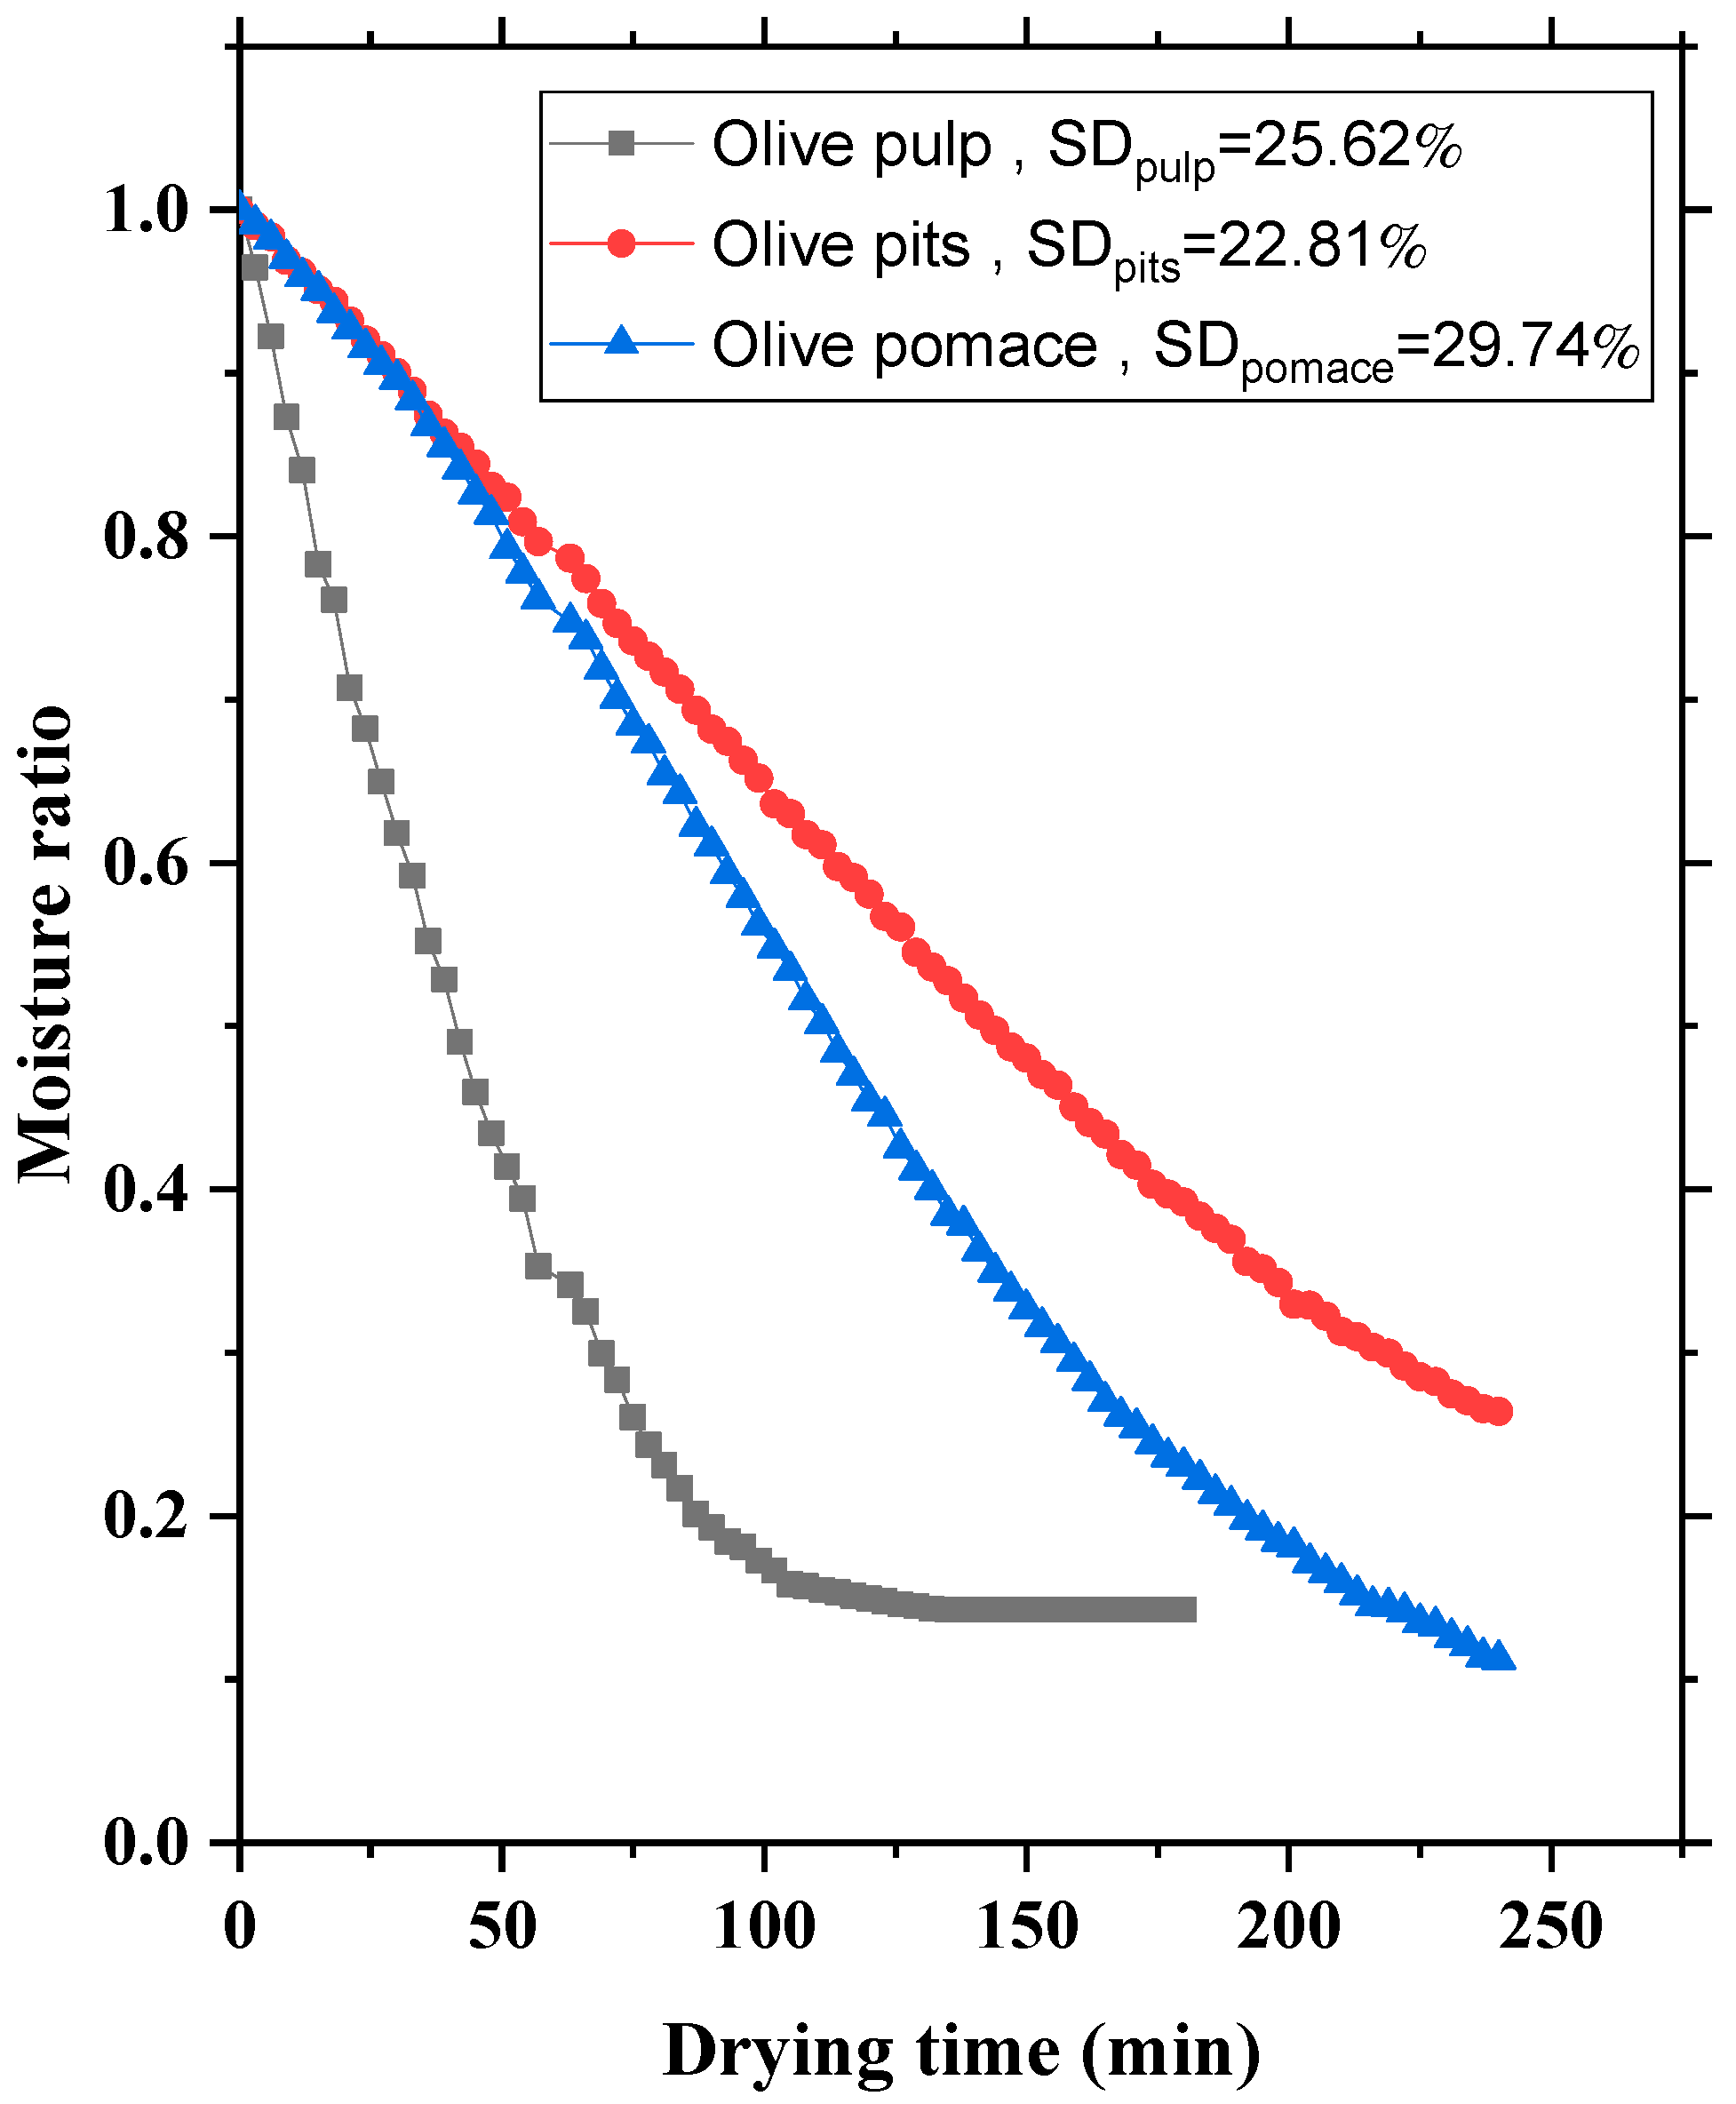
The weight of olive pomace represents about a third of the weight of crushed fresh olives. The main composition of whole olives is 39.54% dry matter and 60.46% water content, whereas, it has 85.17% pulp, 14.83% pits. The oil content is 14.36% in fresh matter [34]. In modern mills, a special machine is used to de-stone a given percentage of olives before they pass through the crusher. The recovered cores are then dried and used for several purposes, hence the interest in drying. The size “d” of the particles of pulps and cores used is between 0.1 mm and 2.0 mm. Figure 7 illustrates the moisture content versus drying time for the three sample types (pulp, pits and the olive pomace) with an initial humidity close to 60%, an air speed value equal to 1 ms−1 and a drying air temperature equal to 60 °C.
The drying time taken by the pits is much longer than that taken by the olive pomace and that taken by the pulp for the given moisture content. Indeed, free water is concentrated at the level of the olive pulp. Therefore, the evaporation of this water takes place more rapidly than in the case of olive pits where the water molecules are concentrated in the interior pores of its structure. Accordingly, water requires more time to escape.
It can be concluded regarding all previous results that the drying process is affected by many factors, and furthermore, the drying air temperature is the main guiding force.

4. Drying Modeling

A number of earlier studies have concentrated on the kinetics modelling of the convective drying of wet olive pomace [35,36,37]. In our case, the moisture content measurement values were fitted using the seven selected mathematical models given in Table 1. The thickness of the olive pomace layer was e = 2 cm. Table 2 summarizes the models used as well as the values of R2 and χ 2 provided by nonlinear regression.
Obtained results of R 2 range between 0.947 and 0.999 and of χ 2 ranged between 0.07 × 10⁻⁴ and 51.81 × 10⁻⁴. The efficiency of such fitting is proven by a value of R2 closest to 1 and the lowest value of χ 2 . It can be concluded that Midilli et al.’s model [18] produces the best agreement [18]. Hence, this model was selected to represent the drying of olive pomace in a thin layer, especially as the same model was frequently used in numerous reports dealing with biological materials under heated and convected air [38,39,40,41,42,43].
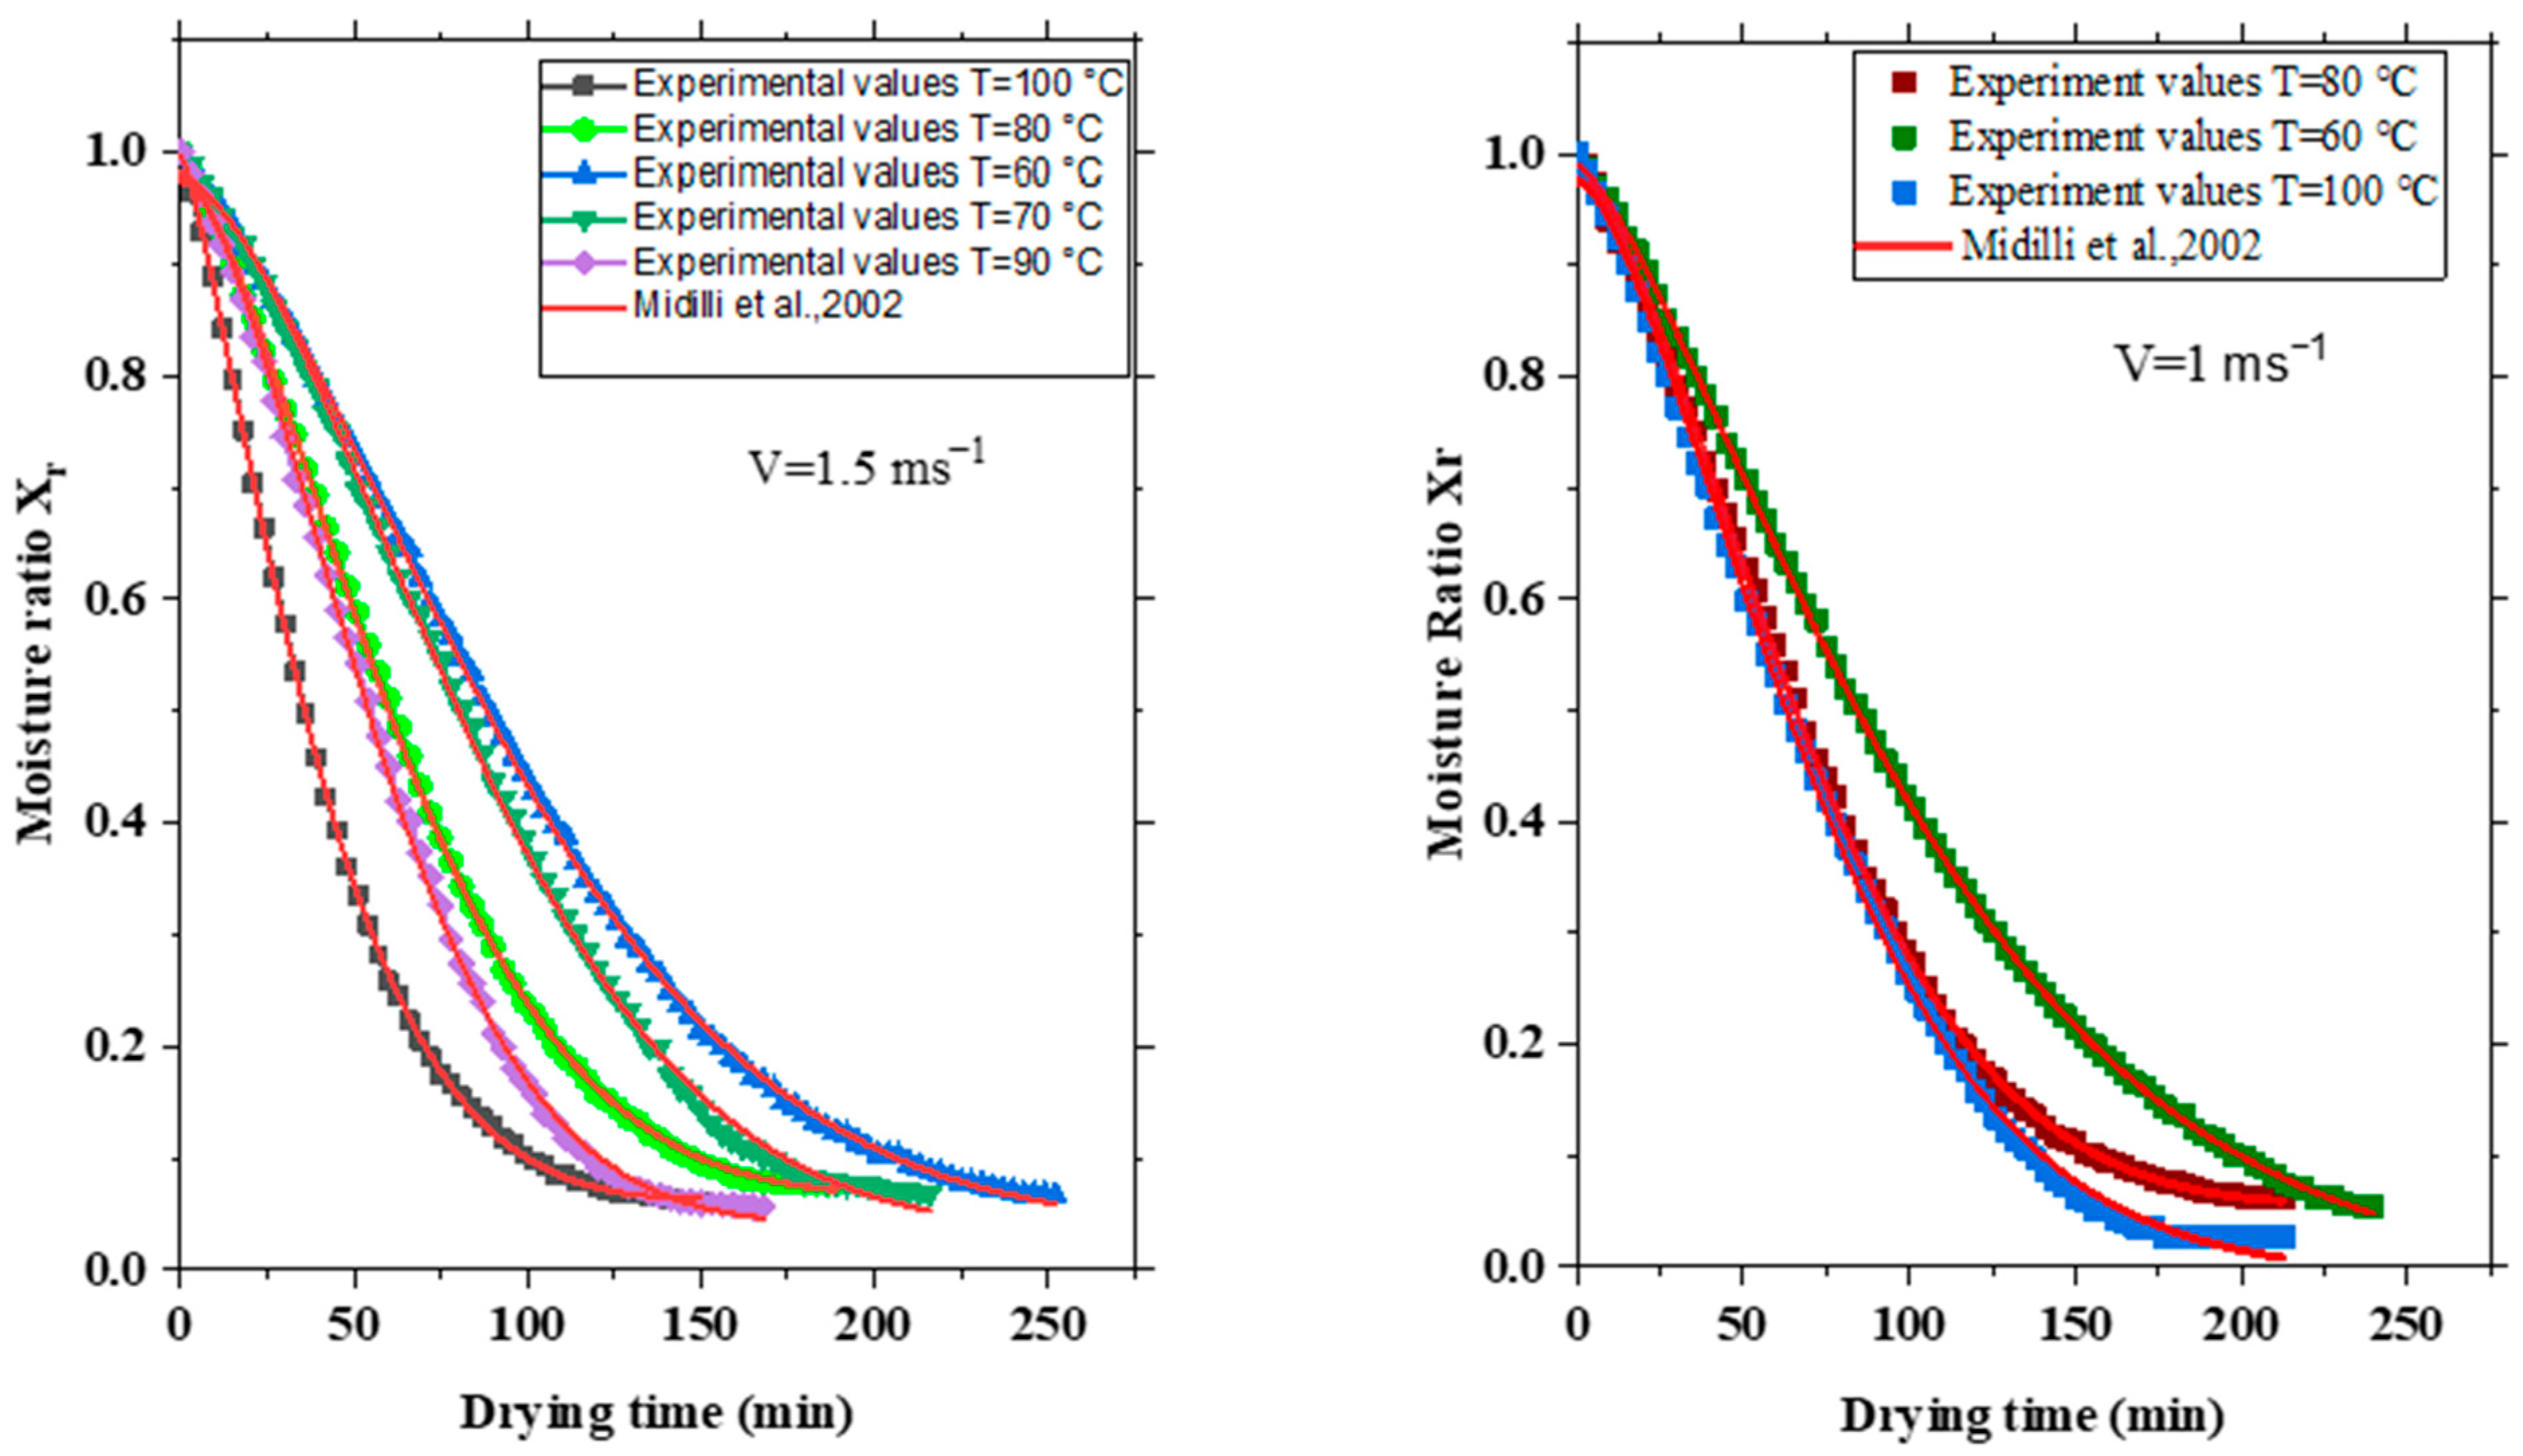
Figure 8 shows the experimental moisture content curves and their approximations predicted by Midilli et al.’s model [18] for different values of air speed.
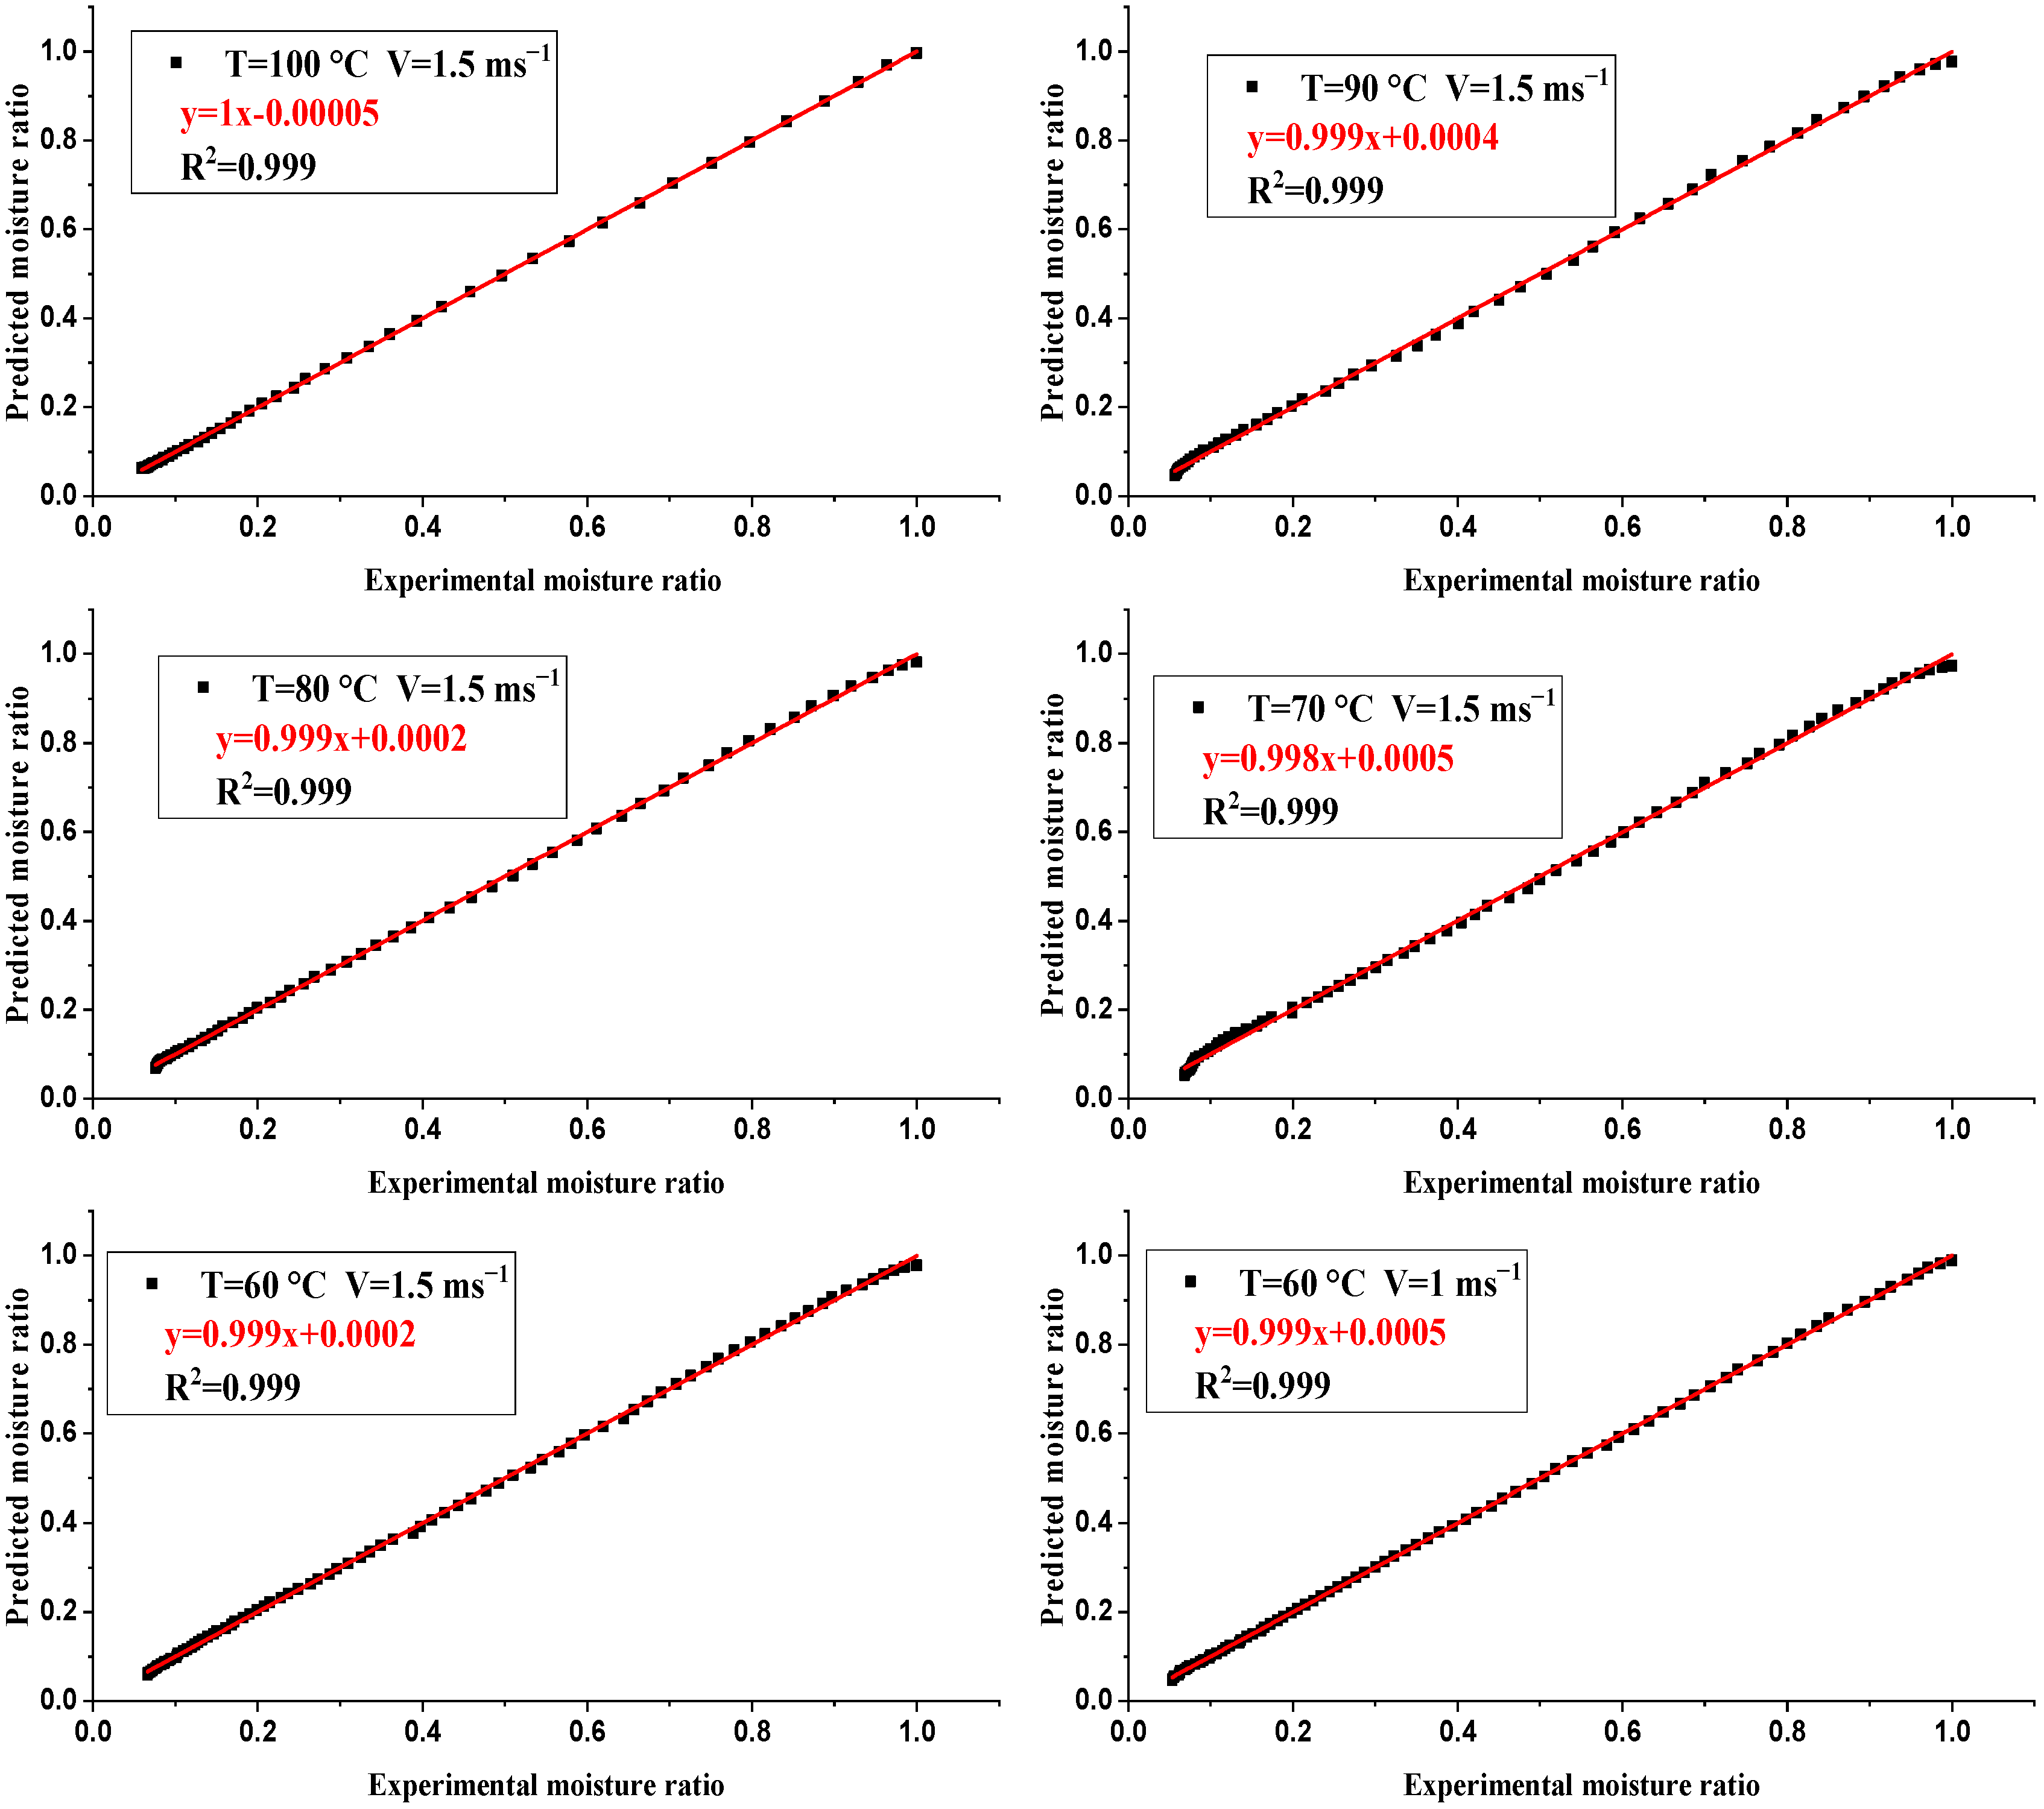
The validity of the model in our case is demonstrated by the fact that the experimental values of the moisture ratio are in excellent agreement with the predicted ones in the model under certain conditions as shown in Figure 8. Also, Figure 9 shows that the experimental findings are well fitted to the predicted ones for all experimental conditions.
Table 3 illustrates the values of the constants of the model retained for two velocities of drying air 1 ms−1 and 1.5 ms−1

5. Characteristic Drying Curve

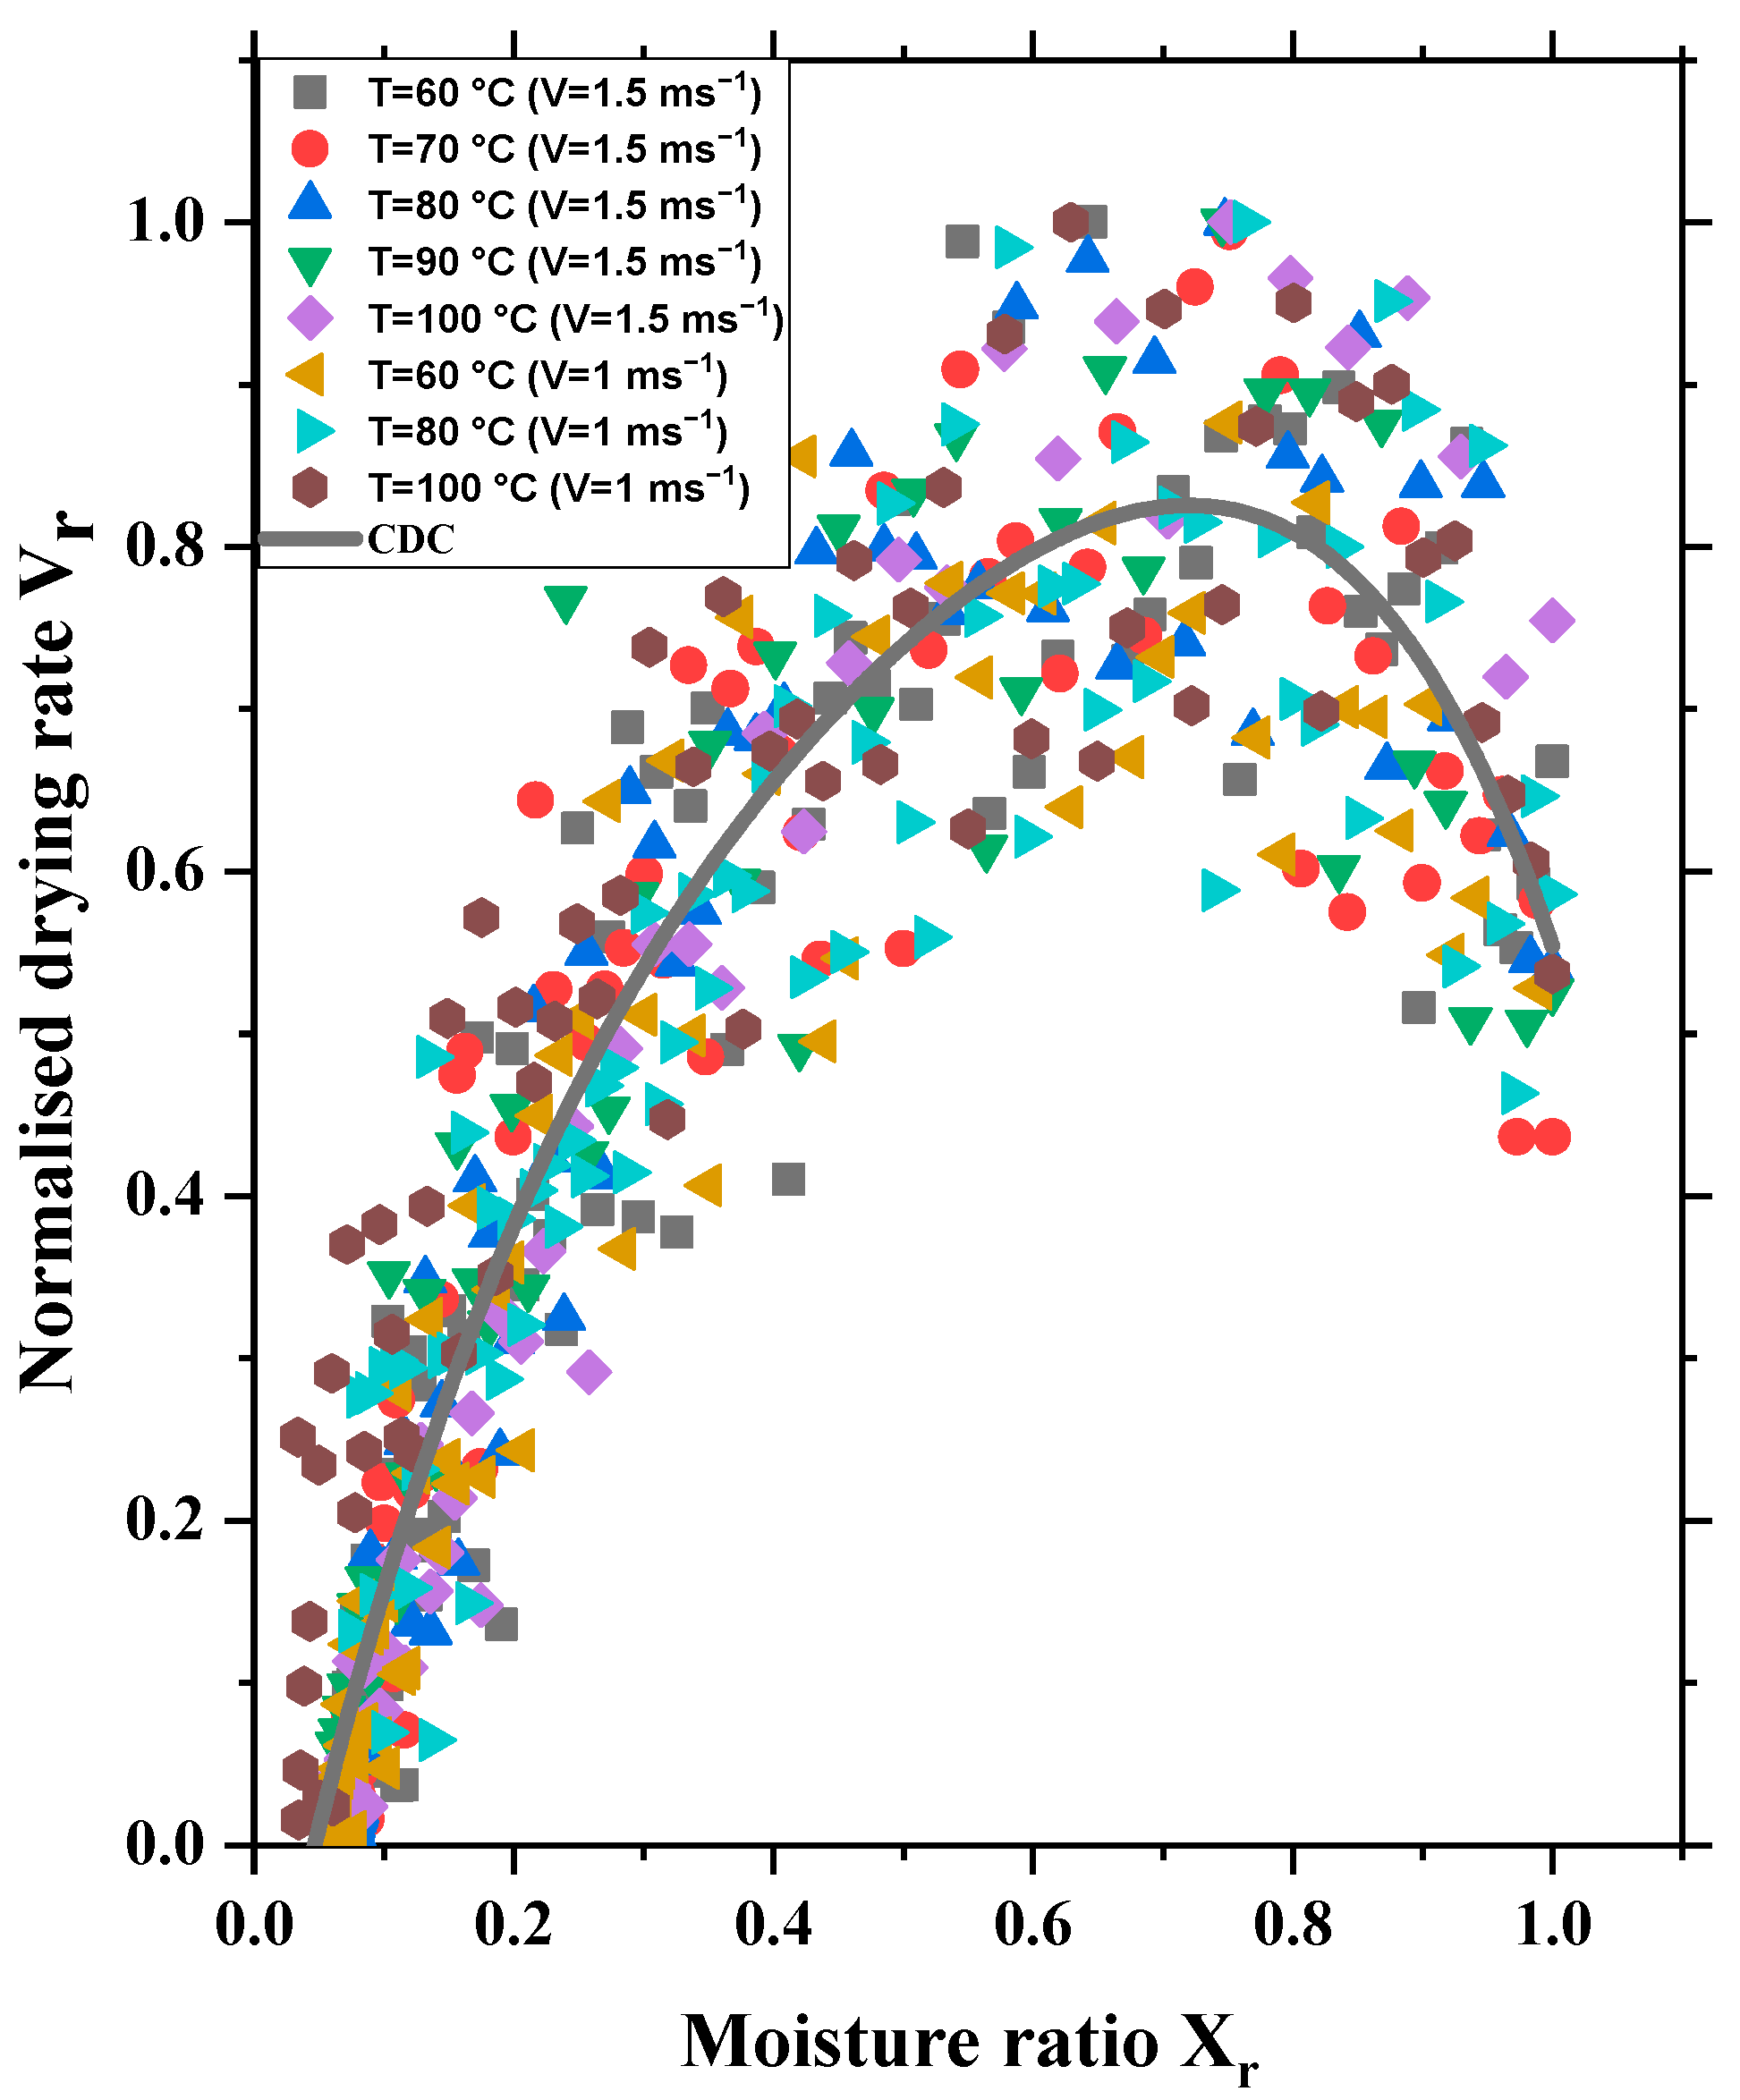
Figure 10 represents the characteristic drying curve of the olive pomace at different drying conditions.
The method for determining the characteristic drying curves (CDC) was developed by Van Meel [44]. It consists of a normalization by representing the ratio of the drying rate at a time t to the rate of first phase as a function of the reduced water content X r under the same air conditions. The general form of the CDC is given by:
V r = f X r = d X r d t t d X d t 0
V r and   X r are, respectively, the dimensionless drying rate and the dimensionless moisture content. Figure 10 provides experimental drying results, which are plotted to represent V r = f ( X r ) with a coefficient of determination R2 = 0.889.
Figure 10 shows that the drying curves have approximately the same shape, despite variations in air temperatures and product properties.
Moreover, several researchers have chosen the polynomial model to describe the characteristic curve of drying [45,46]. Indeed, using the non-linear optimization method, we can find the best fit for the olive pomace characteristic drying curve:
V r = 3.61 X r 4 + 7.27 X r 3 6.75 X r 2 + 3.81 X r 0.16
Then, a characteristic curve of the olive pomace can be found, despite the complexity of the microscopic phenomena. Equation (13) is available in the range of following experimental conditions: 60 °C ≤ T ≤ 100 °C; 1 ms−1 ≤ V ≤ 1.5 ms−1; and initial moisture h ≈ 60%.
Figure 11 shows a drying test that we completed outside of the conditions mentioned in order to test Equation (13) for V = 2 ms−1 and T = 100 °C. We observe that the theoretical results given by Equation (13) predict the experimental results reasonably well.

6. Effective Diffusivity and Energy Activation

Table 4 below presents the values of the diffusion coefficient Deff, found for the different air conditions. The way Equation (7) is written suggests that the effective diffusion coefficient is a constant parameter, which is not true. Indeed, during the drying of agricultural products, for example, the effective diffusion coefficient can vary with the local moisture content and with changes in sample dimensions. Also, assuming that the first term of Equation (8) is sufficiently determined by curve fitting, the effective diffusion coefficient needs to be justified. This is because although this is a conventional approach to calculate the effective diffusion coefficient, a problem of significant truncation errors appears in the case of a large mass transfer Biot number, which corresponds to the prescribed boundary condition used by Crank to analytically solve the diffusion Equation. However, with a good approximation in the case of a supposedly homogeneous distribution of moisture, a thin bed and for a constant temperature imposed during manipulation, it could be possible to assume that the diffusion coefficient is constant, especially when we are not using the case of a coupled transfer of heat and mass described by the Biot number.
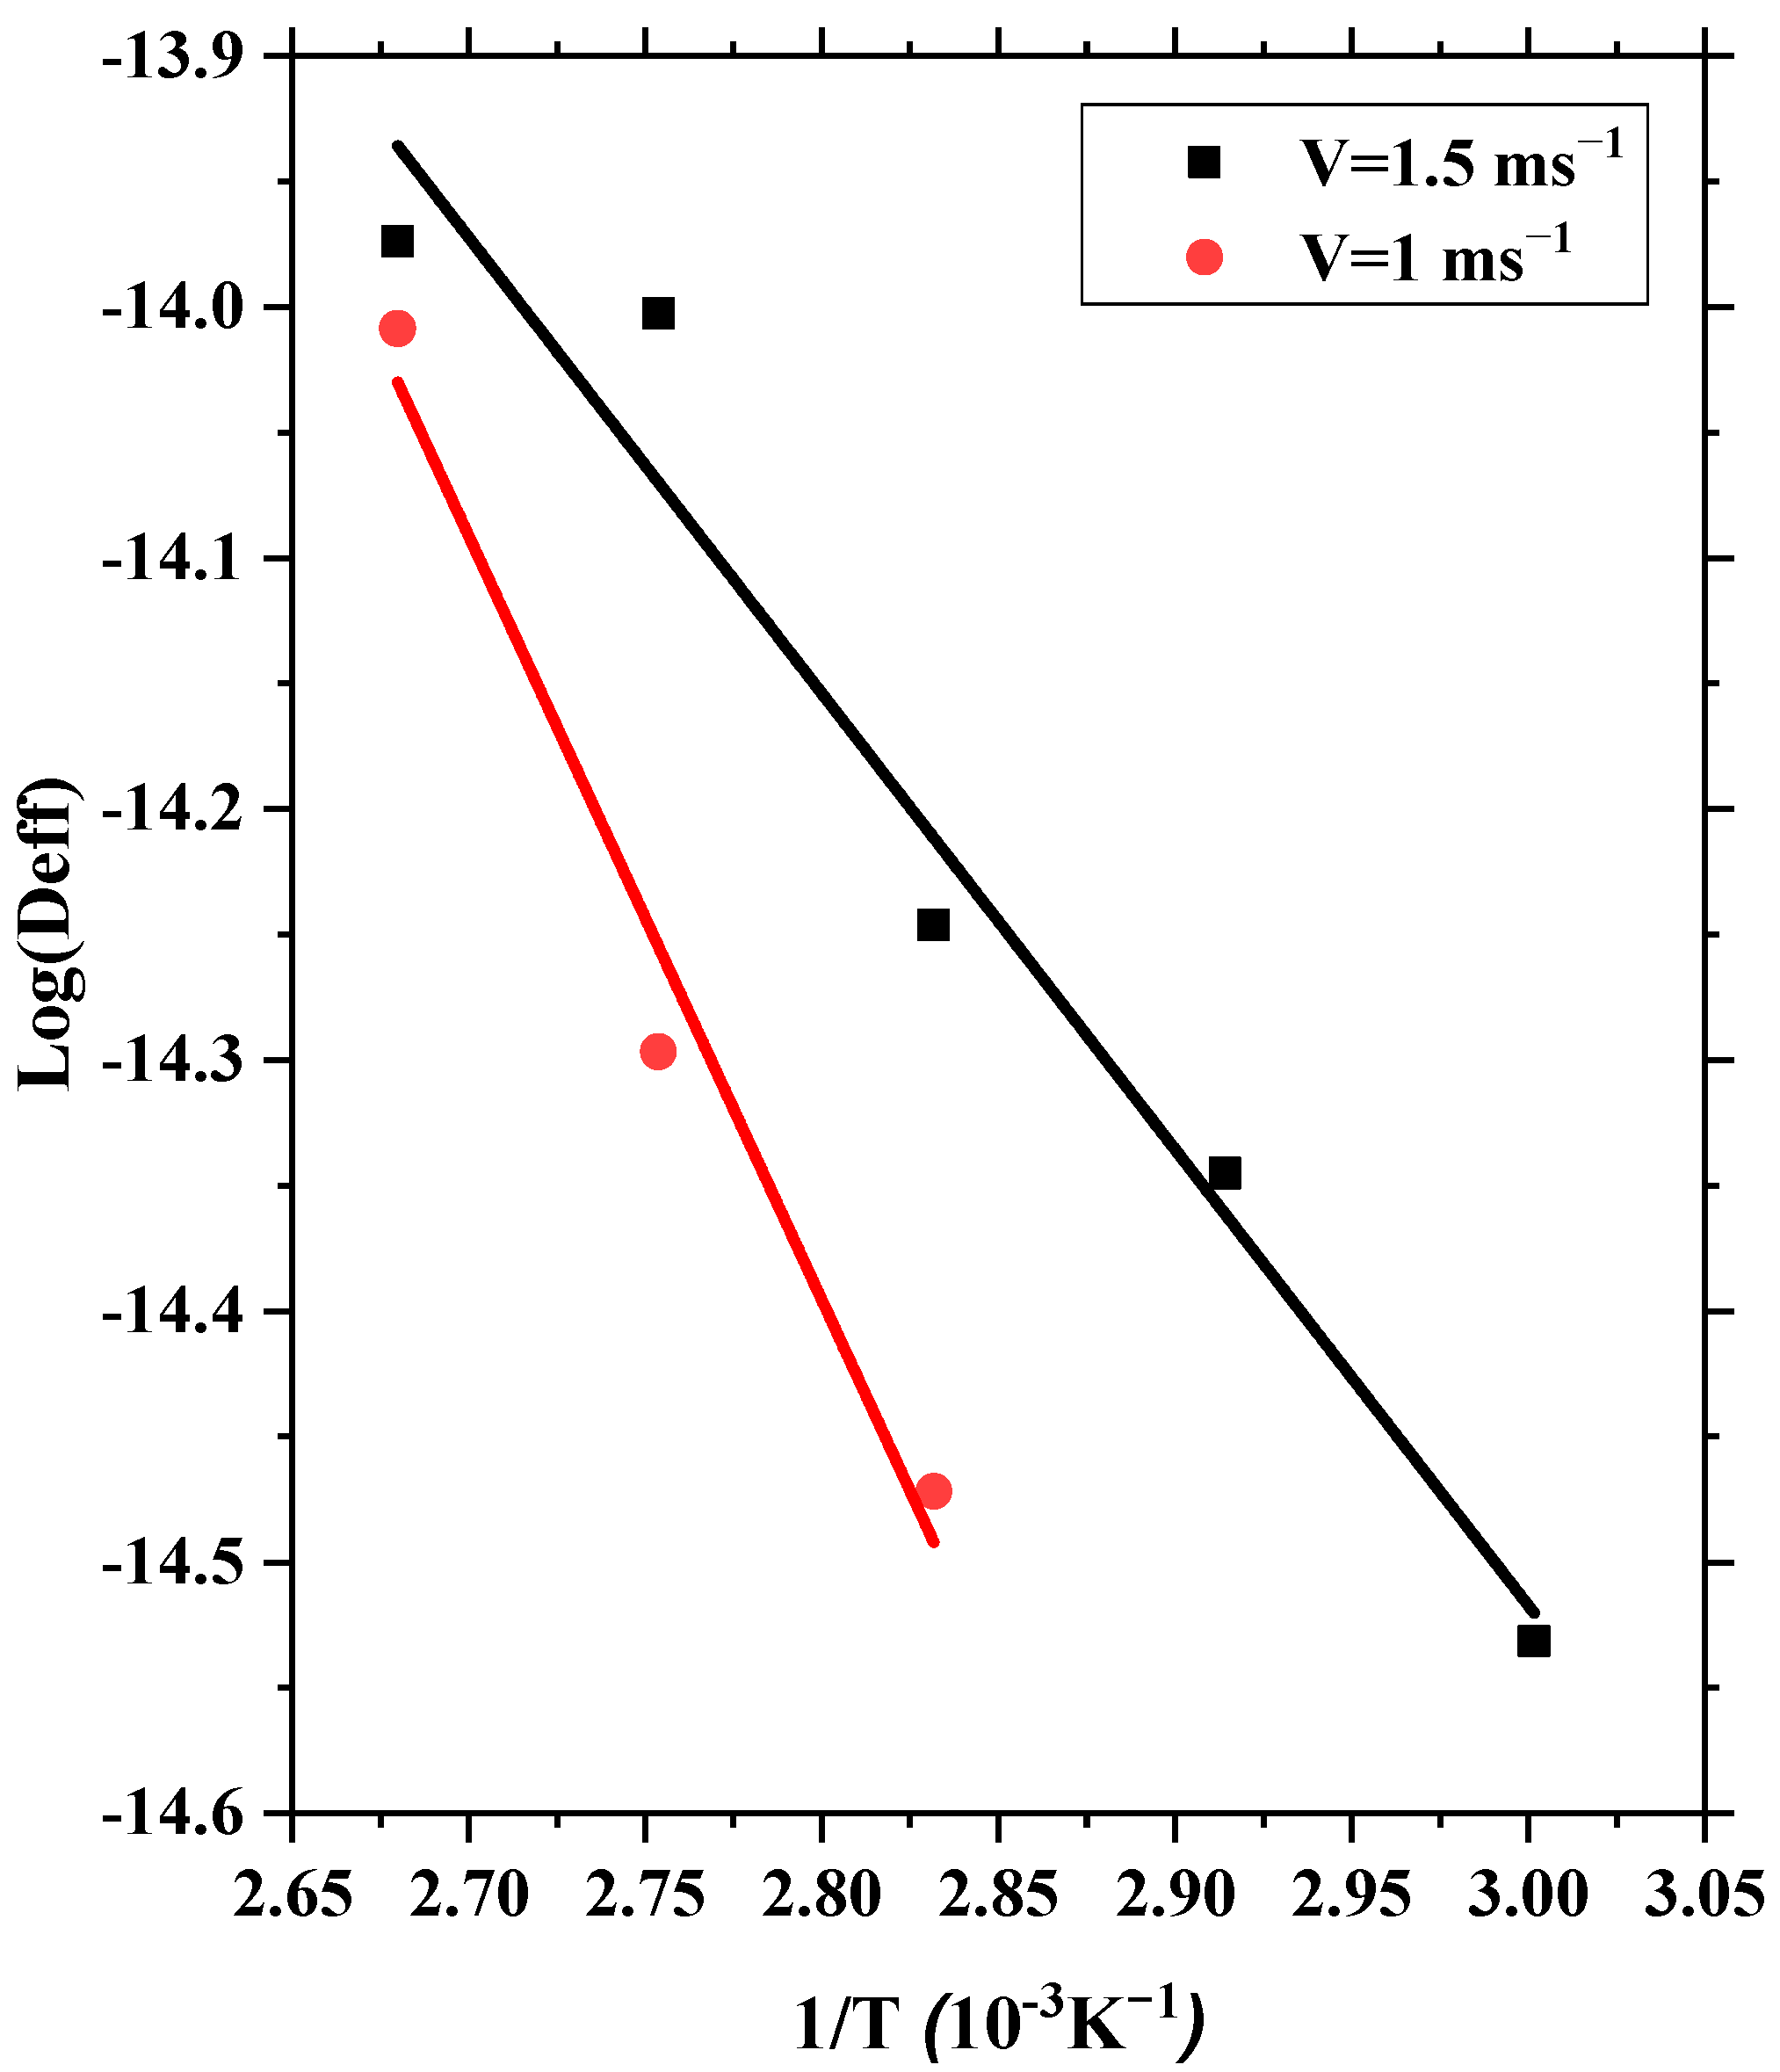
The effective diffusion coefficient values Deff range from 4.88 × 10⁻⁷ m2s−1 to 11.01 × 10⁻⁷ m2s−1. Such values are in concordance with the those found by Meziane [41] for whom Deff ranges between 0.68 × 10⁻⁷ m2s−1 and 2.15 × 10⁻⁷ m2s−1 when the air temperature is varied between 50 °C and 80 °C with a velocity of air equal to 1 ms−1. Similarly, Göğüş and Maskan [42] evaluated Deff values between 1.84 × 10⁻⁷ m2s−1 and 3.94 × 10⁻⁷ m2s−1 when the velocity of the air is equal to 1 ms−1 and its temperature varies between 60 °C and 80 °C. Table 4 shows that Deff value increases as the drying air temperature increases. Furthermore, Deff depends strongly on the velocity as a rise in the air speed leads to an increase in the diffusion coefficient. Similar results were also reported during the drying of other agricultural products, including peaches [43], apricots [47], prickly pear [48] and carrot slices [49]. From the curve of Ln (Deff) as a function of 1/T (Figure 12), we can estimate the values of the activation energy and of the pre-exponential factors. The corresponding values are given in Table 5.
The values of activation energy are 15.1 kJmol−1 and 25.3 kJmol−1 for air velocities of 1.5 ms−1 and 1.0 ms−1, respectively. They are close to the values reported in the literature for olive mill solid wastes. Indeed, Koukouch at al. [36] evaluated the activation energy of 26.06 kJmol−1 and I. Doymaz et al. [6] estimated it at 26.71 kJmol−1. For Meziane and Mesbahi [50], the values of E a range from 26.30 kJmol−1 to 37.63 kJmol−1 and for Göğüş and Maskan [42], they estimated E a to be between 25.4 kJmol−1 and 29.2 kJmol−1. Thus, an increase in the speed of the drying air causes a decrease in the activation energy.

7. Conclusions

In this paper, we investigated the drying of olive pomace using a closed convection drying loop of hot air. The study was conducted for five drying air temperatures varying from 60 °C to 100 °C and for three drying air velocities varying between 1 ms−1 and 2 ms−1 and for two sample layer thicknesses of 2 cm and 4 cm. The results show that when the temperature and velocity of the drying air increase and the sample’s thickness decreases, the time required for drying drops considerably. Moreover, the humidity content and the rate of drying rely on the initial moisture and the composition of the biomass. On an industrial scale, we can therefore act on the different parameters studied in this article to obtain a reliable product ready for use in different fields.
To fit the obtained curves, seven models were examined. The model of Middili et al. gives the best agreement with measurements. Also, we established the equation of the characteristic drying curve, which is practical to know for the behavior of the drying of olive pomace in a temperature range from 60 °C to 100 °C, for an initial humidity around 60% and an air speed between 1 and 1.5 ms−1. Such drying curves could be of potentially significant value to the scientific and industrial communities.
Finally, we estimated the activation energy, which decreases from 25.309 kJmol−1 to 15.101 kJmol−1 when the speed increases from 1 ms−1 to 1.5 ms−1. We also calculated the effective diffusivity via the Arrhenius correlation.

Author Contributions

C.N., validation, formal analysis, data curation and writing—original draft preparation; M.L., conceptualization, methodology, investigation, writing—review and editing, supervision and project administration. All authors have read and agreed to the published version of the manuscript.

Funding

This research received no funding.

Data Availability Statement

Not available.

Acknowledgments

All authors would like to thank the technical staff from LETTM laboratory (Faculty of Sciences of Tunis) and especially Sofien Azzouz for providing us with experimental facilities to carry out our experiments.

Conflicts of Interest

The authors declare no conflict of interest.

References

  1. IPCC. Contributing of Working Groups I, II and III to the Fifth Assessment Report of the Intergovernmental Panel on Climate Change; Synthesis Report; IPCC: Geneva, Switzerland, 2014; Available online: https://www.ipcc.ch/pdf/assessmentreport/ar5/syr/SYR_AR5_FINAL_full.pdf (accessed on 1 April 2020).
  2. ANGED. Strategic Options for the Promotion of Value of Organic Waste VDO Tunisia; ANGED: Tunis, Tunisia, 2009. [Google Scholar]
  3. World Bioenergy Association. Statistics, Global Bioenergy; World Bioenergy Association: Stockholm, Sweden, 2020. [Google Scholar]
  4. Mami, M.A.; Lajili, M.; Echekki, T. CFD Multiphase Combustion Modelling of Oleic by-Products Pellets in a Counter-Current Fixed Bed Combustor. Comptes Rendus Chim. 2022, 25, 113–127. [Google Scholar] [CrossRef]
  5. Doymaz, I.; Gorel, O.; Akgun, N. Drying Characteristics of the Solid By-Product of Olive Oil Extraction. Biosyst. Eng. 2004, 88, 213–219. [Google Scholar] [CrossRef]
  6. Vitali Čepo, D.; Radić, K.; Jurmanović, S.; Jug, M.; Grdić Rajković, M.; Pedisić, S.; Moslavac, T.; Albahari, P. Valorization of Olive Pomace-Based Nutraceuticals As Antioxidants in Chemical, Food, and Biological Models. Molecules 2018, 23, 2070. [Google Scholar] [CrossRef]
  7. Ungureanu, G.; Pătrăuţanu, O.A.; Volf, I. A Bio-Based Carbon Rich Material for Efficient Remediation of Environmental Hazardous. Comptes Rendus Chim. 2022, 25, 153–163. [Google Scholar] [CrossRef]
  8. Alburquerque, J. Agrochemical Characterisation of “alperujo”, a Solid by-Product of the Two-Phase Centrifugation Method for Olive Oil Extraction. Bioresour. Technol. 2004, 91, 195–200. [Google Scholar] [CrossRef]
  9. Roig, A.; Cayuela, M.; Sánchez-Monedero, M. An Overview on Olive Mill Wastes and Their Valorisation Methods. Waste Manag. 2006, 26, 960–969. [Google Scholar] [CrossRef]
  10. Vossen, P. Olive Oil: History, Production, and Characteristics of the World. HortScience 2007, 42, 1093–1100. [Google Scholar] [CrossRef]
  11. Zomorodian, A.; Kavoosi, Z.; Momenzadeh, L. Determination of EMC Isotherms and Appropriate Mathematical Models for Canola. Food Bioprod. Process. 2011, 89, 407–413. [Google Scholar] [CrossRef]
  12. Rabha, D.; Muthukumar, P.; Somayaji, C. Experimental Investigation of Thin Layer Drying Kinetics of Ghost Chilli Pepper (Capsicum Chinense Jacq.) Dried in a Forced Convection Solar Tunnel Dryer. Renew. Energy 2017, 105, 583–589. [Google Scholar] [CrossRef]
  13. Abderrahman, M.; Abdelaziz, B.; Abdelkader, O. Thermal Performances and Kinetics Analyses of Greenhouse Hybrid Drying of Two-Phase Olive Pomace: Effect of Thin Layer Thickness. Renew. Energy 2022, 199, 407–418. [Google Scholar] [CrossRef]
  14. Han, R.; Zhou, A.; Zhang, N.; Li, Z. A Review of Kinetic Studies on Evaporative Dehydration of Lignite. Fuel 2022, 329, 125445. [Google Scholar] [CrossRef]
  15. Krokida, M.K.; Maroulis, Z.B.; Kremalis, C. Process Design of Rotary Dryers for Olive Cake. Dry. Technol. 2002, 20, 771–788. [Google Scholar] [CrossRef]
  16. Koukouch, A.; Idlimam, A.; Asbik, M.; Sarh, B.; Izrar, B.; Bah, A.; Ansari, O. Thermophysical Characterization and Mathematical Modeling of Convective Solar Drying of Raw Olive Pomace. Energy Convers. Manag. 2015, 99, 221–230. [Google Scholar] [CrossRef]
  17. Ertekin, C.; Yaldiz, O. Drying of Eggplant and Selection of a Suitable Thin Layer Drying Model. J. Food Eng. 2004, 63, 349–359. [Google Scholar] [CrossRef]
  18. Midilli, A.; Kucuk, H.; Yapar, Z. A New Model for Single-Layer Drying. Dry. Technol. 2002, 20, 1503–1513. [Google Scholar] [CrossRef]
  19. O’Callaghan, J.; Menzies, D.; Bailey, P. Digital Simulation of Agricultural Drier Performance. J. Agric. Eng. Res. 1971, 16, 223–244. [Google Scholar] [CrossRef]
  20. Guo, X.-H.; Xia, C.-Y.; Tan, Y.-R.; Chen, L.; Ming, J. Mathematical Modeling and Effect of Various Hot-Air Drying on Mushroom (Lentinus Edodes). J. Integr. Agric. 2014, 13, 207–216. [Google Scholar] [CrossRef]
  21. Raffalli, J. Community-Based Outbreaks of Tuberculosis. Arch. Intern. Med. 1996, 156, 1053–1060. [Google Scholar] [CrossRef] [PubMed]
  22. Aghbashlo, M.; Kianmehr, M.H.; Khani, S.; Ghasemi, M. Mathematical modeling of carrot thin-layer drying using new model. Int. Agrophysics 2009, 23, 313–317. [Google Scholar]
  23. Bruce, D. Exposed-Layer Barley Drying: Three Models Fitted to New Data up to 150 °C. J. Agric. Eng. Res. 1985, 32, 337–348. [Google Scholar] [CrossRef]
  24. Diamante, L.M.; Munro, P.A. Mathematical Modelling of Hot Air Drying of Sweet Potato Slices. Int. J. Food Sci. Technol. 2007, 26, 99–109. [Google Scholar] [CrossRef]
  25. Srikiatden, J.; Roberts, J.S. Moisture Transfer in Solid Food Materials: A Review of Mechanisms, Models, and Measurements. Int. J. Food Prop. 2007, 10, 739–777. [Google Scholar] [CrossRef]
  26. Fick, A. Ueber Diffusion. Ann. Der Phys. Und Chem. 1855, 170, 59–86. [Google Scholar] [CrossRef]
  27. Crank, J. The Mathematics of Diffusion; Oxford University Press: Oxford, UK, 1975. [Google Scholar]
  28. Içier, F.; Baysal, T.; Taştan, Ö.; Özkan, G. Microwave Drying of Black Olive Slices: Effects on Total Phenolic Contents and Colour. Gıda 2014, 39, 323–330. [Google Scholar] [CrossRef]
  29. Zhao, H.; Li, Y.; Song, Q.; Wang, X.; Shu, X. Drying, Re-Adsorption Characteristics, and Combustion Kinetics of Xilingol Lignite in Different Atmospheres. Fuel 2017, 210, 592–604. [Google Scholar] [CrossRef]
  30. Li, L.; Jiang, X.; Qin, X.; Yan, K.; Chen, J.; Feng, T.; Wang, F.; Song, Z.; Zhao, X. Experimental Study and Energy Analysis on Microwave-Assisted Lignite Drying. Dry. Technol. 2019, 37, 962–975. [Google Scholar] [CrossRef]
  31. Freire, F.; Figueiredo, A.; Ferrão, P. PH—Postharvest Technology. J. Agric. Eng. Res. 2001, 78, 397–406. [Google Scholar] [CrossRef]
  32. Putra, R.N.; Ajiwiguna, T.A. Influence of Air Temperature and Velocity for Drying Process. Procedia Eng. 2017, 170, 516–519. [Google Scholar] [CrossRef]
  33. Gómez-de la Cruz, F.J.; Casanova-Peláez, P.J.; López-García, R.; Cruz-Peragón, F. Review of the Drying Kinetics of Olive Oil Mill Wastes: Biomass Recovery. BioResources 2015, 10, 6055–6080. [Google Scholar] [CrossRef]
  34. Toscano, P.; Cutini, M.; Di Giacinto, L.; Di Serio, M.G.; Bisaglia, C. Development of a Lab-Scale Prototype for Validating an Innovative Pitting Method of Oil Olives. AgriEngineering 2021, 3, 622–632. [Google Scholar] [CrossRef]
  35. Sadi, T.; Meziane, S. Mathematical modelling, moisture diffusion and specific energy consumption of thin layer microwave drying of olive pomace. Int. Food Res. J. 2015, 22, 494–501. [Google Scholar]
  36. Koukouch, A.; Idlimam, A.; Asbik, M.; Sarh, B.; Izrar, B.; Bostyn, S.; Bah, A.; Ansari, O.; Zegaoui, O.; Amine, A. Experimental Determination of the Effective Moisture Diffusivity and Activation Energy During Convective Solar Drying of Olive Pomace Waste. Renew. Energy 2017, 101, 565–574. [Google Scholar] [CrossRef]
  37. Baysan, U.; Koç, M.; Güngör, A.; Ertekin, F.K. Investigation of Drying Conditions to Valorize 2-Phase Olive Pomace in Further Processing. Dry. Technol. 2020, 40, 65–76. [Google Scholar] [CrossRef]
  38. Akpinar, E.K. Determination of Suitable Thin Layer Drying Curve Model for Some Vegetables and Fruits. J. Food Eng. 2006, 73, 75–84. [Google Scholar] [CrossRef]
  39. Amiri Chayjan, R.; Amiri Parian, J.; Esna-Ashari, M. Modeling of Moisture Diffusivity, Activation Energy and Specific Energy Consumption of High Moisture Corn in a Fixed and Fluidized Bed Convective Dryer. Span. J. Agric. Res. 2011, 9, 28–40. [Google Scholar] [CrossRef]
  40. Sitorus, A.; Putra, S.A.; Cebro, I.S.; Bulan, R. Modelling Drying Kinetics of Paddy in Swirling Fluidized Bed Dryer. Case Stud. Therm. Eng. 2021, 28, 101572. [Google Scholar] [CrossRef]
  41. Meziane, S. Drying Kinetics of Olive Pomace in a Fluidized Bed Dryer. Energy Convers. Manag. 2011, 52, 1644–1649. [Google Scholar] [CrossRef]
  42. Göğüş, F.; Maskan, M. Air Drying Characteristics of Solid Waste (pomace) of Olive Oil Processing. J. Food Eng. 2006, 72, 378–382. [Google Scholar] [CrossRef]
  43. Kingsly, R.P.; Goyal, R.K.; Manikantan, M.R.; Ilyas, S.M. Effects of Pretreatments and Drying Air Temperature on Drying Behaviour of Peach Slice. Int. J. Food Sci. Technol. 2007, 42, 65–69. [Google Scholar] [CrossRef]
  44. Van Meel, D. Adiabatic Convection Batch Drying With Recirculation of Air. Chem. Eng. Sci. 1958, 9, 36–44. [Google Scholar] [CrossRef]
  45. Ait Mohamed, L.; Ethmane Kane, C.; Kouhila, M.; Jamali, A.; Mahrouz, M.; Kechaou, N. Thin Layer Modelling of Gelidium Sesquipedale Solar Drying Process. Energy Convers. Manag. 2008, 49, 940–946. [Google Scholar] [CrossRef]
  46. Touil, A.; Chemkhi, S.; Zagrouba, F. Modelling of the Drying Kinetics of Opuntia Ficus Indica Fruits and Cladodes. Int. J. Food Eng. 2010, 6, 11. [Google Scholar] [CrossRef]
  47. Doymaz, İ. Effect of Pre-Treatments Using Potassium Metabisulphide and Alkaline Ethyl Oleate on the Drying Kinetics of Apricots. Biosyst. Eng. 2004, 89, 281–287. [Google Scholar] [CrossRef]
  48. Lahsasni, S.; Kouhila, M.; Mahrouz, M.; Idlimam, A.; Jamali, A. Thin Layer Convective Solar Drying and Mathematical Modeling of Prickly Pear Peel (Opuntia Ficus Indica). Energy 2004, 29, 211–224. [Google Scholar] [CrossRef]
  49. Aghbashlo, M.; Kianmehr, M.H.; Arabhosseini, A.; Nazghelichi, T. Modelling the Carrot Thin-Layer Drying in a Semi-Industrial Continuous Band Dryer. Czech J. Food Sci. 2011, 29, 528–538. [Google Scholar] [CrossRef]
  50. Meziane, S.; Mesbahi, N. Determination of Moisture Diffusivity and Activation Energy in Thin Layer Drying of Olive Pomace. Int. J. Food Eng. 2012, 8, 34. [Google Scholar] [CrossRef]
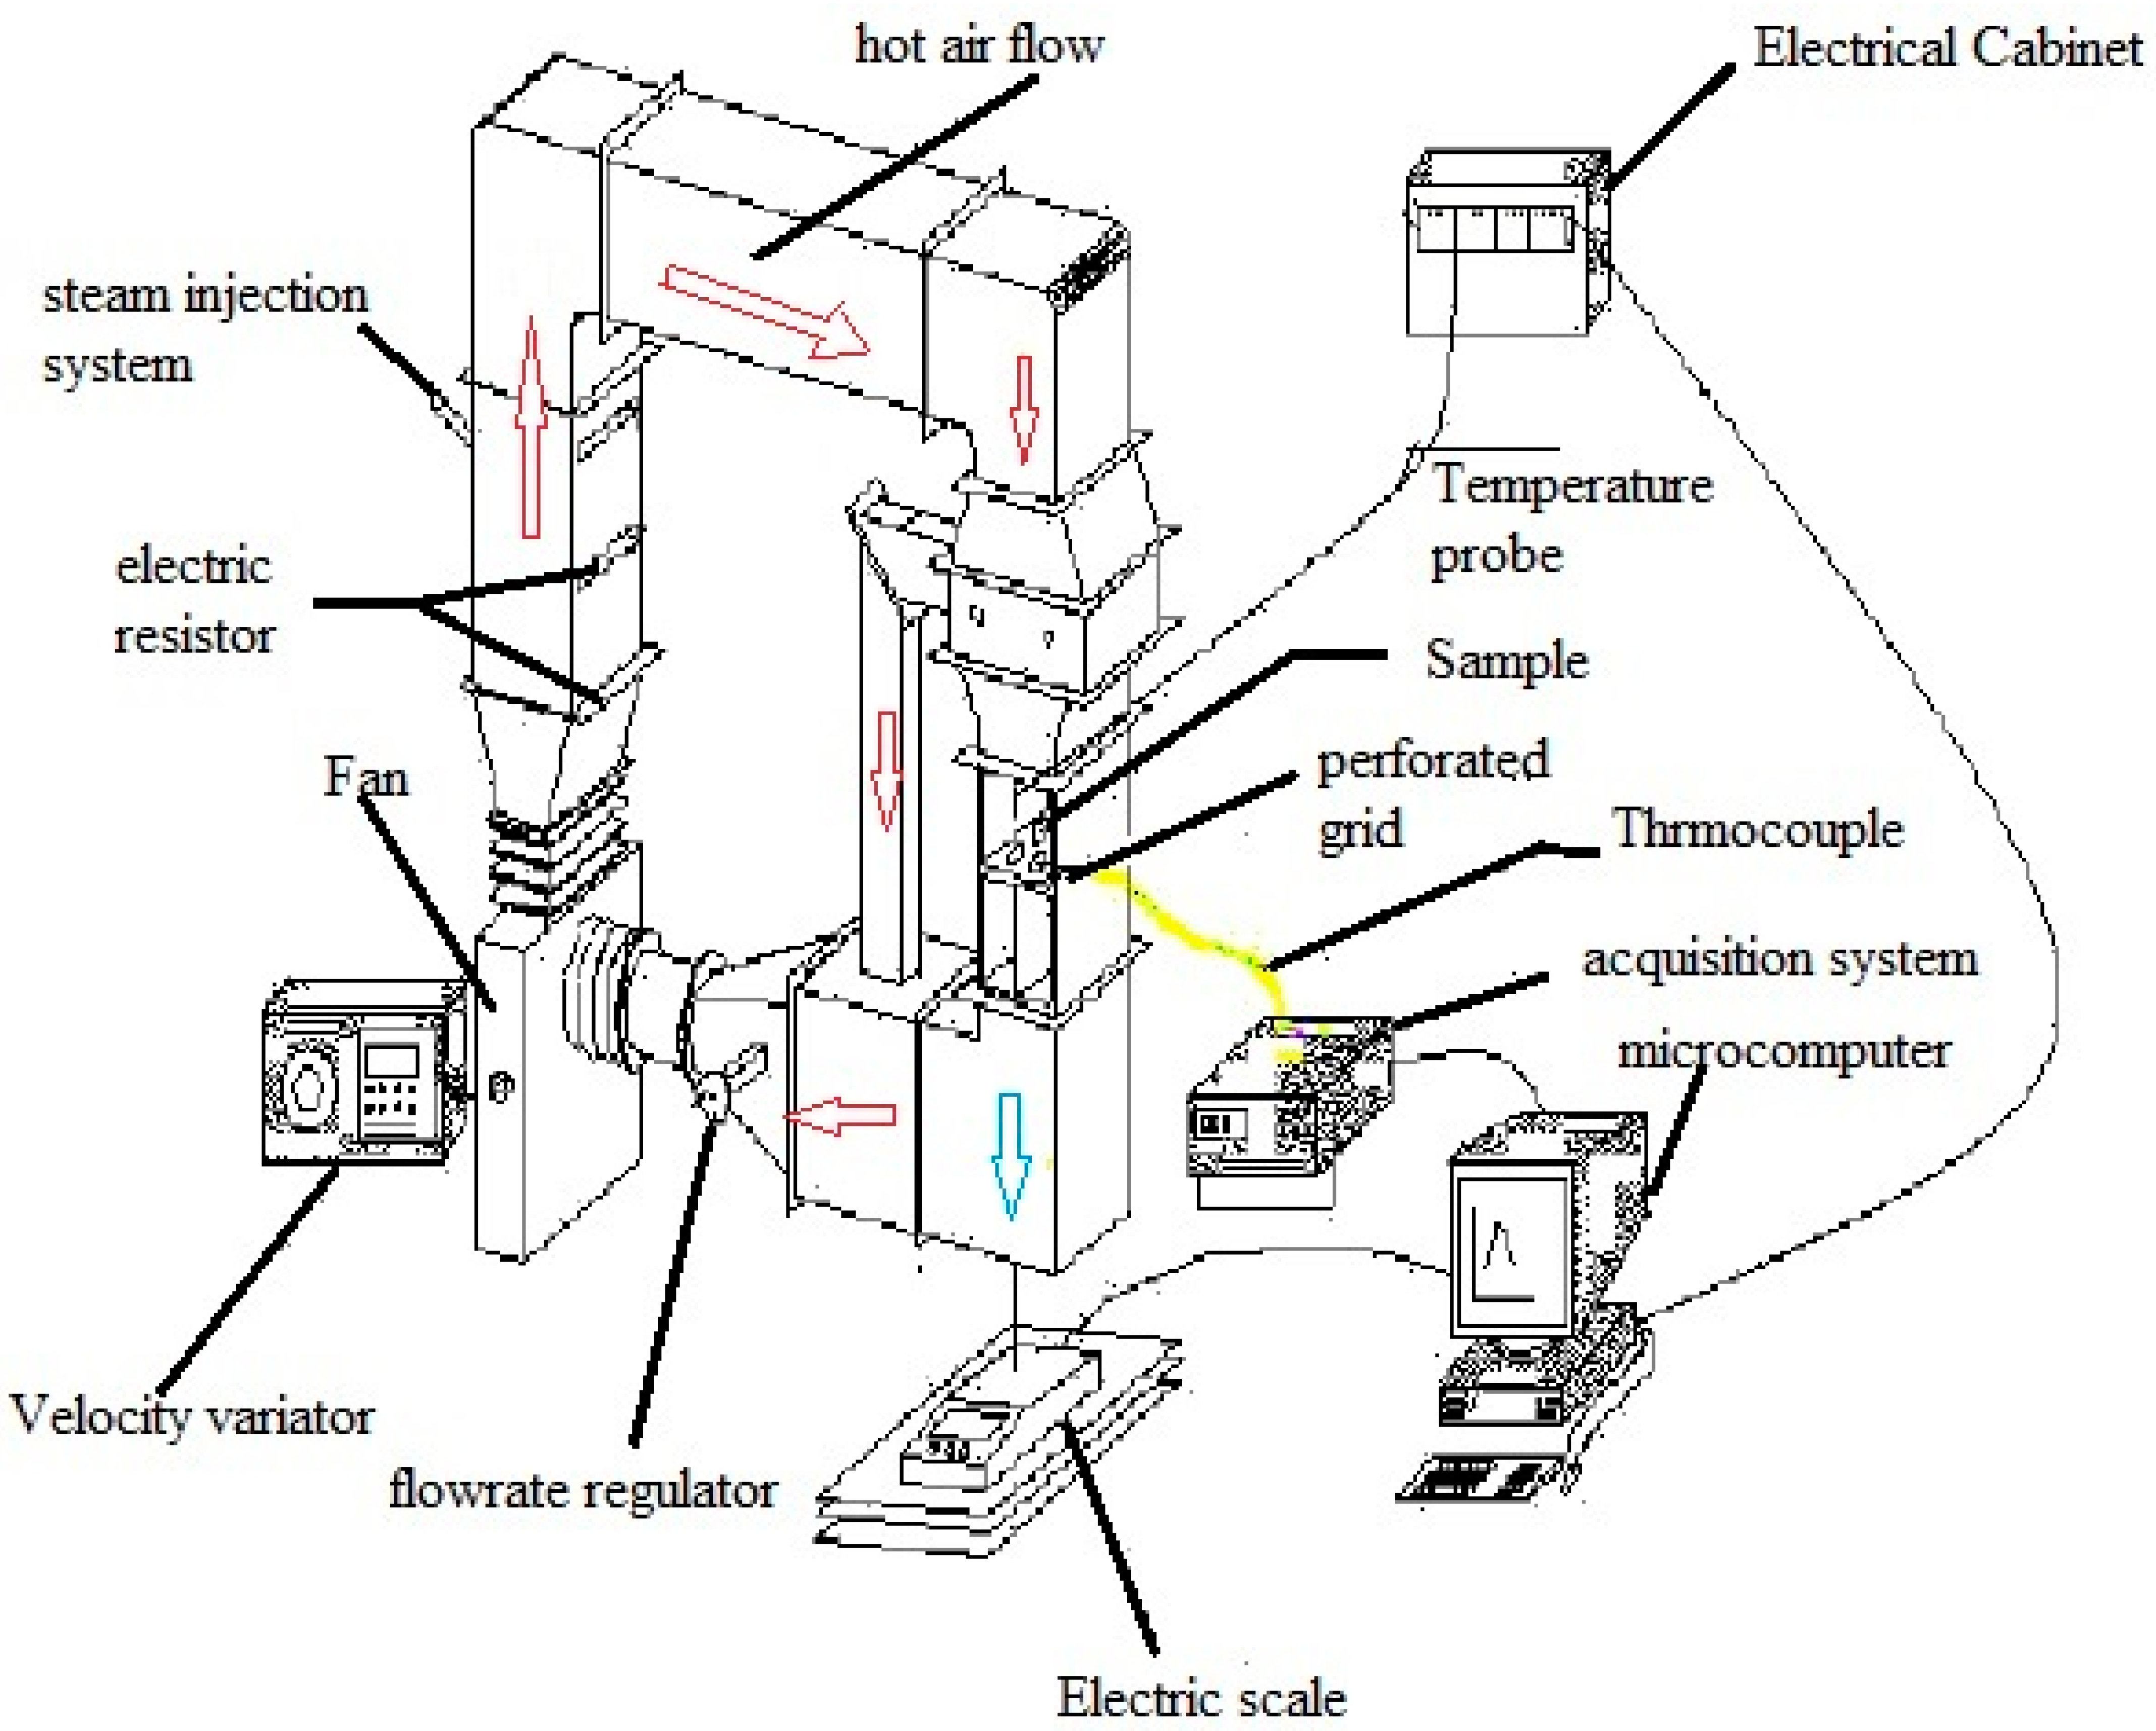
Figure 1. Experimental convective drying device. Red arrow represents hot air, whereas blue arrow represents cooled air.
Processes 11 02513 g001
Figure 2. Influence of gas temperature (T) on drying time.
Processes 11 02513 g002
Figure 3. Variation of drying rate as a function of time for different air temperatures.
Processes 11 02513 g003
Figure 4. Evolution of moisture ratio as a function of time for two velocities of drying air (at T = 60 °C and T = 100 °C).
Processes 11 02513 g004
Figure 5. Impact of thin-layer thickness on drying time (T = 60 °C and V = 1.5 ms−1).
Processes 11 02513 g005
Figure 6. Impact of the initial moisture content on the variation of the moisture ratio and drying rate for same conditions: V = 1.5 ms−1, T = 60 °C and e = 2 cm.
Processes 11 02513 g006
Figure 7. The variation of the moisture ratio versus the drying time (T = 60 °C, V = 1 ms−1 and e = 2 cm).
Processes 11 02513 g007
Figure 8. Experimental drying data compared to the mathematical model of Midilli et al. [18] (V = 1.5 ms−1 and V = 1 ms−1 and e = 2 cm).
Processes 11 02513 g008
Figure 9. Representation of experimental values of moisture ratio and those given by the model at different temperatures and velocities of drying air.
Processes 11 02513 g009
Figure 10. Characteristic drying curve.
Processes 11 02513 g010
Figure 11. Prediction of experimental results using polynomial model (T = 100 °C and V = 2 ms−1).
Processes 11 02513 g011
Figure 12. The logarithm of the effective diffusivity as a function of the inverse of the temperature for two drying air velocities.
Processes 11 02513 g012
Table 1. Expressions and references of mathematical models.
Model NameModel ExpressionReferences
Midilli et al. X r = a exp k t n + b t [18]
Newton X r = exp ( k t ) [19]
Wang and Singh X r = 1 + a t + b t 2 [20]
Henderson and Pabis X r = a exp ( k t ) [21]
Aghabashlo model X r = exp ( k 1 t 1 + k 2 t ) [22]
Yagcioglu et al. X r = a exp k t + c [23]
Simplified.Fick’s. diffusion X r = a exp k ( t L 2 ) [24]
Table 2. Statistical results of the different drying models (V = 1.5 ms−1 and e = 2 cm).
ModelTemperature (°C) R 2 χ 2
Midilli et al.
[18]
600.9990.31 × 10−4
700.9990.91 × 10−4
800.9990.26 × 10−4
900.9990.64 × 10−4
1000.9990.07 × 10−4
Newton
[19]
600.96333.90 × 10−4
700.94751.81 × 10−4
800.96928.00 × 10−4
900.95742.80 × 10−4
1000.9889.34 × 10−4
Wang and Singh
[20]
600.9926.58 × 10−4
700.98712.40 × 10−4
800.9926.63 × 10−4
900.98910.30 × 10−4
1000.9944.85 × 10−4
Henderson and Pabis
[21]
600.98018.30 × 10−4
700.96929.80 × 10−4
800.98414.40 × 10−4
900.97524.20 × 10−4
1000.9944.81 × 10−4
Aghabashlo model
[22]
600.9944.80 × 10−4
700.9936.44 × 10−4
800.9917.74 × 10−4
900.9927.52 × 10−4
1000.9926.18 × 10−4
Yagcioglu et al.
[23]
600.9926.99 × 10−4
700.98910.90 × 10−4
800.9908.93 × 10−4
900.98812.40 × 10−4
1000.9944.87 × 10−4
Simplified.Fick’s.diffusion
[24]
600.98018.30 × 10−4
700.97029.80 × 10−4
800.98414.40 × 10−4
900.97624.20 × 10−4
1000.9944.81 × 10−4
Table 3. Determination of constants in the Midilli et al. model using this case study.
V (ms−1)T (°C)akbn
1600.98901.45 × 10−3−40.60 × 10−41.3847
800.97580.99 × 10−32.13 × 10−41.5637
1000.97811.30 × 10−3−39.60 × 10−41.5054
1.5600.97750.73 × 10−31.11 × 10−41.5292
700.97350.46 × 10−31.17 × 10−41.6642
800.98141.35 × 10−32.78 × 10−41.5284
900.97601.07 × 10−32.02 × 10−41.6231
1000.99626.69 × 10−33.61 × 10−41.3074
Table 4. Effective diffusivity coefficient values.
Drying Air Velocity (ms−1)T (°C) D e f f 10 7 m 2 s 1 R 2
11008.240.958
806.180.988
605.180.982
1.51008.530.979
908.290.980
806.500.987
705.880.977
604.880.989
210011.010.949
807.810.975
Table 5. Determination of the activation energy and pre-exponential factor of Arrhenius law.
Air Drying Velocity (ms−1) E a   ( k J m o l 1 ) D 0   ( m 2 s 1 ) R 2
125.3−28.15 × 10−40.951
1.515.1−115.20 × 10−40.954
Disclaimer/Publisher’s Note: The statements, opinions and data contained in all publications are solely those of the individual author(s) and contributor(s) and not of MDPI and/or the editor(s). MDPI and/or the editor(s) disclaim responsibility for any injury to people or property resulting from any ideas, methods, instructions or products referred to in the content.