Article

Energy Variation Features during the Isothermal Adsorption of Coal under High-Temperature and High-Pressure Conditions

1
School of Civil Engineering, Liaoning Petrochemical University, Fushun 113001, China
2
Liaoning Key Lab of Petro-Chemical Special Building Materials, Fushun 113001, China
3
College of Geoscience and Surveying Engineering, China University of Mining and Technology, Beijing 100083, China
4
State Key Laboratory of Petroleum Resources and Prospecting, China University of Petroleum, Beijing 102249, China
*
Author to whom correspondence should be addressed.
Processes 2023, 11(9), 2524; https://doi.org/10.3390/pr11092524
Submission received: 18 July 2023 / Revised: 9 August 2023 / Accepted: 15 August 2023 / Published: 23 August 2023
(This article belongs to the Section Chemical Processes and Systems)

Abstract

:
This paper aims to describe methane adsorption in coal under the conditions of high temperature and high pressure, as well as quantitatively decipher the change rule of energy in the isothermal adsorption process. The isothermal adsorption test was carried out with four groups of middle-rank coals from the Linxing area with different degrees of metamorphism. The impacts of the degree of deterioration of coal, temperature, and pressure on adsorption were analyzed with regard to the adsorption amount, adsorption potential, and adsorption space. Additionally, the energy change during the adsorption of methane by the coal was considered. The results show that the coal adsorption capacity hinges on the degree of deterioration of the coal, as well as the pressure and temperature. Additionally, the impact of temperature upon coal methane adsorption under depth conditions is highlighted. Like the adsorption space, the adsorption potential is an important parameter used to quantitatively characterize the adsorption ease and adsorption capacity; furthermore, the adsorption potential of millipores exceeds that of mesopores, as they are capable of offering a larger specific surface area for adsorption. The total decrease in the surface free energy during adsorption increases as the pressure increases; simultaneously, the increase rate is fast and then slow. The total decrease in the above-described free energy diminishes as the temperature escalates. Under the same pressure, the total decrease in the aforementioned free energy increases as the reflectance of the specular body of the coal increases. The decrease in the aforementioned free energy at each point of pressure lessens as the pressure grows; notably, when the pressure is comparatively low, the reduction is very fast. As the pressure escalates continuously, the decrease speed is slow. Regarding the effect of pressure and temperature upon adsorption, the adsorption gas volume of coal exists in a conversion depth from 1200 m to 1500 m; at the same time, the impact of pressure upon adsorption is dominant up to this depth. Additionally, beyond this depth, temperature gradually comes to have the greatest impact on adsorption.

1. Introduction

A coal system is a porous medium, and the adsorption of methane by coal is a process in which methane molecules collide with the surface of the coal’s pore structure through thermal movement. As for adsorption, it essentially constitutes the reduction in the surface tension by coal in order to reduce the surface free energy, which explains different adsorption phenomena on the basis of energy changes during the adsorption process [1,2]. Regarding the isothermal adsorption of coals with disparate coal body structures, experimental analysis shows that the changes in the total decrease of the above-described free energy, adsorption capacity, and adsorption potential were affected by the coal body structures; moreover, the disparate levels of the coal body fragmentation control the adsorption amount and the energy exchanged during adsorption [3]. Wu et al. discussed the adsorption behavior, adsorption characteristic curve, and the change rule of the equal amount of adsorption heat from coalbed methane under supercritical conditions [4]. Guo et al. studied the effect of water on the adsorption characteristics of low-rank coal, and the results showed that the methane adsorption isotherm of low-rank coal was consistent with those of Langmuir’s adsorption law. Water significantly inhibits the gas adsorption capacity of low-rank coal, and the degree of inhibition increases with the increase in the water content. However, with the increase in the water content, the growth rate of the inhibition effect decreases gradually [5]. Xie et al. used quantum chemical calculation methods to study the interaction energy between methane molecules and coal-based molecules with disparate levels of metamorphism. Furthermore, they discovered that, as the coal-based diameter increased, the interaction energy between the methane molecules and coal-based molecules escalated gradually [6]. Li et al. conducted adsorption experiments with five different grades of coal and concluded that the maximum adsorption capacity was significantly positively correlated with the specific surface area and pore volume of micropores smaller than 2 nm, and the adsorption heat was significantly positively correlated with the specific surface area and pore volume of micropores in the range of 0.38~0.76 nm, and the micropores in this range played a major role in determining the methane adsorption heat [7]. Nie et al. and Li et al. analyzed the nature of energy change during adsorption based on molecular dynamics and thermodynamic theory, and derived the heat of adsorption calculation formula [8,9].
The isothermal adsorption test is a crucial research tool for analyzing coal adsorption characteristics. These characteristics can be discussed based on various aspects, including coal physical properties (such as coal grade, pore properties, and particle size), material composition (including microcomponents, industrial components, and mineralogical components) and experimental conditions (such as temperature, pressure, and aqueous content) [10,11,12,13]. Previous studies have primarily concentrated on shallow coal bed methane (CBM). These studies have primarily focused on analyzing the factors that influence the adsorption capacity of CBM. They have typically employed lower experimental temperatures and pressures. However, there have been relatively few studies on the adsorption characteristics of CBM under high-temperature and high-pressure conditions. By analyzing experimental data of coal isothermal adsorption under high pressure and high temperature, we analyze the comprehensive influence of pressure, temperature and coal metamorphism upon coal adsorption capacity during isothermal adsorption and calculate the theoretical “depth conversion point” of the change in coal adsorption capacity with the depth of coal seam in the joint action of pressure and temperature with the background of the pressure and temperature gradients of a coal reservoir within the Linxing area. The “depth conversion point” refers to the calculation of the coal adsorption gas volume with respect to the depth of the coal seam, considering the combined influence of pressure and temperature. In this context, the changes in adsorption potential, adsorption space, and free energy associated with variations in coal grade, pressure, and temperature are examined. The objective is to provide a reference for future research on coal adsorption and gas in deep coal reservoirs.

2. Samples and Experimental Methods

2.1. Sample Collection

The coal specimens used in the test were sourced from the Linxing area and the Xiegou coal mining, as depicted in Figure 1b. The research area is located in the Jinxi flexural fold belt, situated at the eastern boundary of the Ordos Basin. The region is characterized by a monoclinic structure, with a generally uniform stratigraphic dip [14]. In the late Paleozoic period, several east–west extended anticline structures were formed, and faults with a small scale in the N-W and N-E directions were developed locally, as shown in Figure 1a,c [15]. Affected by the early Cretaceous tectonic thermal events of North China, the east Linxing area is the Purple Mountain rock mass uplift area, as shown in Figure 1c. The No. 8 + 9 coal seam developed within the Benxi Formation of the Upper Carboniferous System is the main coal seam for investigation and advancement of deep coalbed methane within the Linxing area [16]. Except for the rock mass uplift area, the coal seam burial depth is 1700~2200 m, the coal reservoir temperature is 46~64 °C, the reservoir pressure is 15.5~21.5 MPa, and the vitrinite reflectivity (Ro,max) of coal is between 1.0 and 1.8%. In the Purple Mountain uplift area, the coal seam burial depth becomes shallow to about 1000 m. The maturity of coal increases significantly, and the reflectivity of vitrinite reaches more than 3%. The depth of coal seams within the Xiegou coal mine area inside the northeast of the Linxing area becomes shallow, generally 400~1100 m; additionally, gas coal is dominant in the coal rank.

2.2. Experimental Methods

Experimental tests were implemented for four coals with disparate levels of deterioration. (1) Coal industrial analysis, specular body reflectance and microcomponent testing. The specular body reflectance and quantitative statistics of coal components were counted on the optical microscope under oil-immersed reflected light conditions ([17], GB/T6948-2008). For industrial analysis, refer to [18], GB/T212-2008. (2) Isothermal adsorption experiment. The experimental instrument was the ISO-300 isothermal adsorption experimental device produced by Terratek; the temperature of adsorption was set at 4 temperatures (30 °C, 45 °C, 60 °C and 75 °C) with a difference gradient of 15 °C. The pressure of adsorption balance was set based upon the actual reservoir pressure from the coal seam in the field of the research, with the maximum pressure of about 25 MPa and 11 pressure points set. During the test, the coal specimens were first squashed to 60~80 mesh; synchronously, the balance humidity treatment was implemented at 30 °C. Methane concentration of 99.9% was used for the experiment. (3) N2 adsorption–desorption and CO2 adsorption experiments. The specimens were pulverized into a 60~80 mesh coal powder; additionally, 48 h was required to dry them for processing. The adsorption instrument was the Micromeritics ASAP2020 Specific Surface Area Analyzer. Regarding the N2 adsorption–desorption experiment, its temperature reached 77.15 K. Moreover, as for the CO2 adsorption experiment, its temperature reached 273.15 K.

3. Experimental Data and Analysis

As shown in Table 1, the maximal vitrinite reflectance of the tested coals reaches 0.77~1.78%. The maceral composition analysis of the coal specimens indicates that the coal is predominantly composed of vitrinite, followed by inertinite, and then exinite. The vitrinite is chiefly desmocollinite and telocollinite; we observe telinite occasionally. The mineral composition is mainly pyrite, as shown in Figure 2. The vitrinite content is 76.45~85.20%, the inertinite component content is 5.40~10.20%. The ash component reaches 7.85~14.64%, and the mean value is 11.03%. The volatile component reaches 12.66~35.12%, the mean value reaches 23.72%, and the moisture content is relatively low at 0.63~2.41%.
During the N2 adsorption tests, the sizes of the pores were found to range between 1.7 nm and 300 nm. For the CO2 adsorption tests, the pore sizes ranged from 0.489 nm to 1.083 nm. Pores with sizes smaller than 2 nm were classified as ultramicropores [19]. The specific surface area of the tested ultramicropores ranged from 44.90 to 72.31 m2/g, and the specific surface area of the pores tested for N2 adsorption ranged from 0.26 to 0.89 m2/g. The effect of the ultramicropores on the adsorption was decisive.
The molecular kinetic diameter of nitrogen is 0.36 nm, and it is generally accepted that the range of tested pore sizes is 1.7~300 nm. The molecular kinetic diameter of carbon dioxide is 0.33 nm, and the molecular kinetic energy of CO2 is higher and diffusion is faster compared to liquid nitrogen adsorption at a temperature of 273.15 K. It is used to investigate the distribution of micropores with sizes below 2 nm. In the mixed carbon dioxide and nitrogen adsorption test analysis, the comparison of adsorption separation coefficients suggested that CO2 had the highest adsorption capacity, whereas N2 had the lowest capacity. When the CO2 concentration in the gas mixture was high, the adsorption amount was large and the adsorption separation coefficient was small [20].
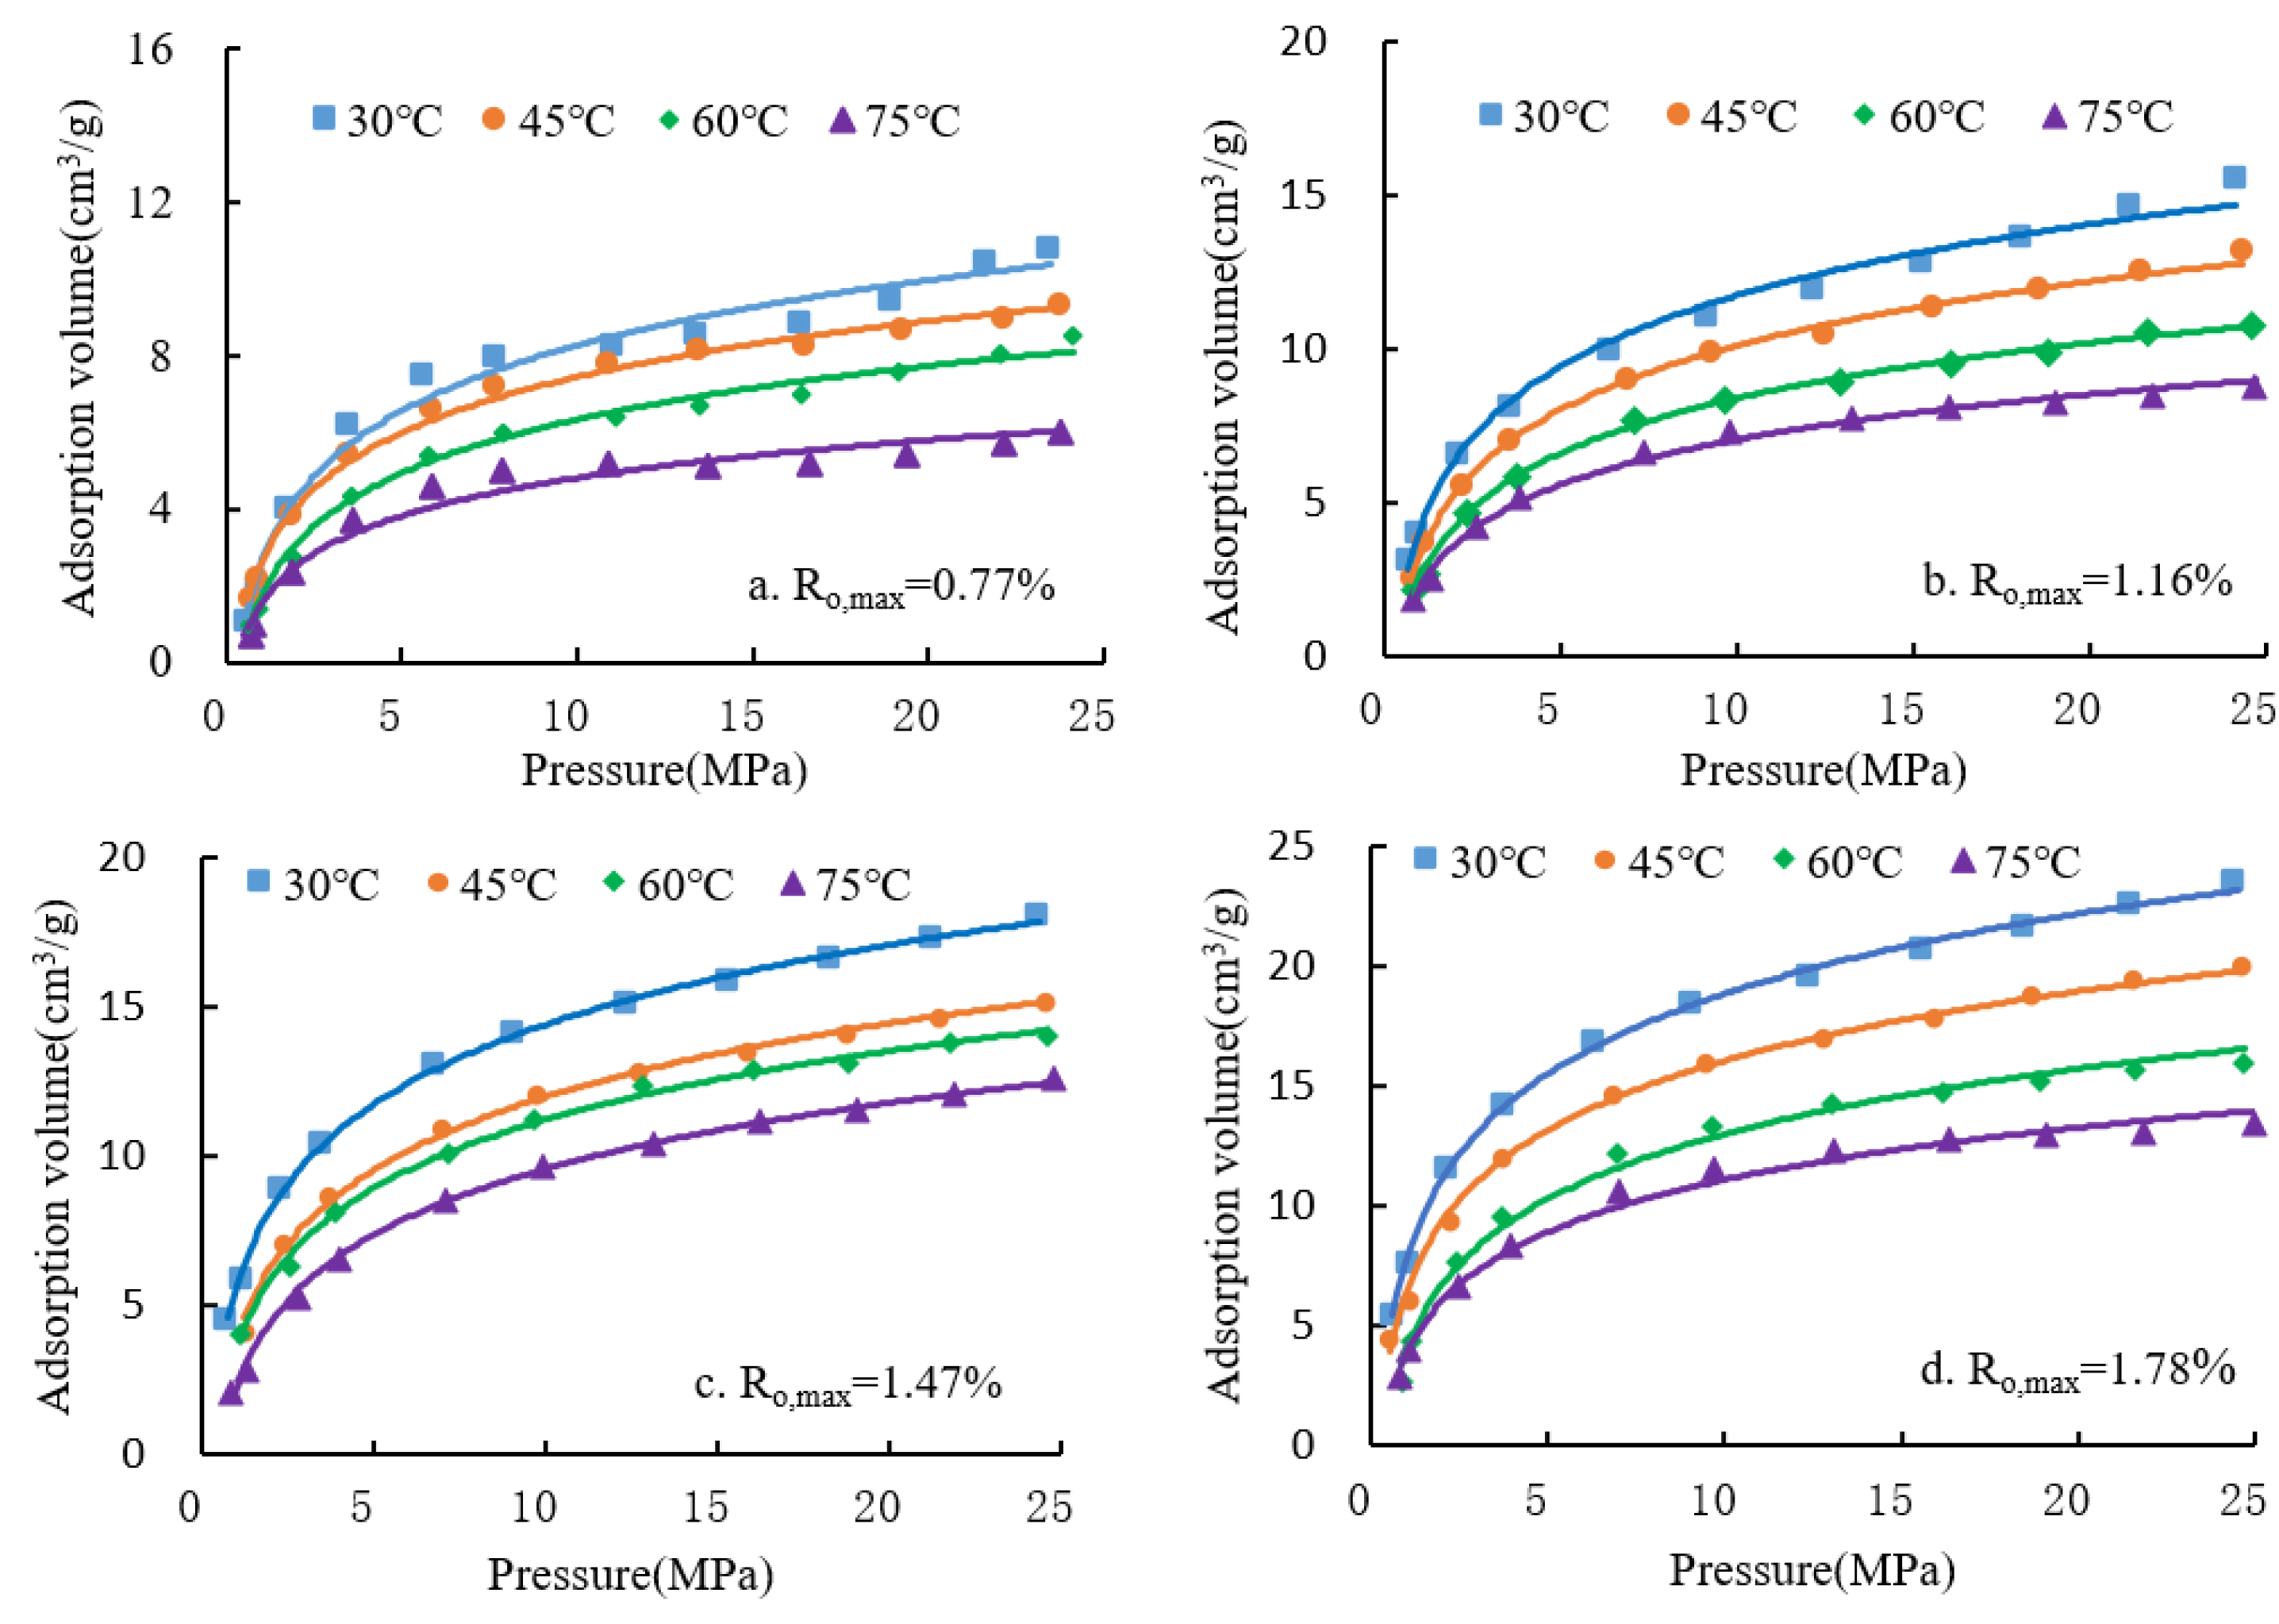
The results of the isothermal adsorption tests indicate that the adsorption of coal-bed methane in coaly coal is influenced by factors such as adsorption pressure, the degree of coal deterioration, and temperature. As depicted in Figure 3, this impact of adsorption pressure upon adsorption was analyzed with the degree of coal deterioration and temperature as quantitative. At adsorption pressures ranging from 0 MPa to 5 MPa, the volume of the adsorbed gas escalates speedily as the adsorption pressure grows, which is an express adsorption stage. When the adsorption pressure reached 5~25 MPa, the adsorption gas volume increased slowly as the pressure escalated, which was just a slow adsorption stage. We analyzed the effect of temperature on adsorption by quantifying the degree of coal deterioration and adsorption pressure. On account of the escalating temperature, the volume of the adsorption gas decreased, and the escalating temperature was unfavorable to adsorption. Taking the L8 coal of RO,max as an example, when comparing the adsorption isotherms at four different temperatures, it was observed that the difference of adsorption amount increased gradually as the adsorption pressure escalated, which indicated that during the rapid adsorption phase, the effect of temperature on adsorption was limited, while the effect of adsorption pressure was significant. In the slow adsorption stage, the impact of adsorption pressure decreases step by step. Simultaneously, this effect of temperature on adsorption becomes more pronounced.
The maximal adsorption capacity of coal is characterized by the Langmuir volume, as shown in Figure 4, and the effect of coal metamorphism on adsorption was analyzed on the part of the temperature as a quantitative measure, and the temperature of 30 °C was used as an example. As the vitrinite reflectance of coal RO,max for 0.77% increases to 1.78%, the Langmuir volume increases from 12.23 cm3/g to 30.64 cm3/g. By quantifying the degree of deterioration of coal, we can analyze its adsorption characteristics. Taking coal with a maximum reflectance of vitrinite (RO,max) of 1.78% as an example, as the temperature increases from 30 °C to 75 °C, the Langmuir volume of coal decreases from 30.64 cm3/g to 20.78 cm3/g. This suggests that temperature has a passive influence on adsorption. Additionally, as the degree of coal deterioration increases, the coal adsorption capacity becomes stronger. This indicates that deteriorated coal has a higher capacity for adsorption compared to less deteriorated coal.
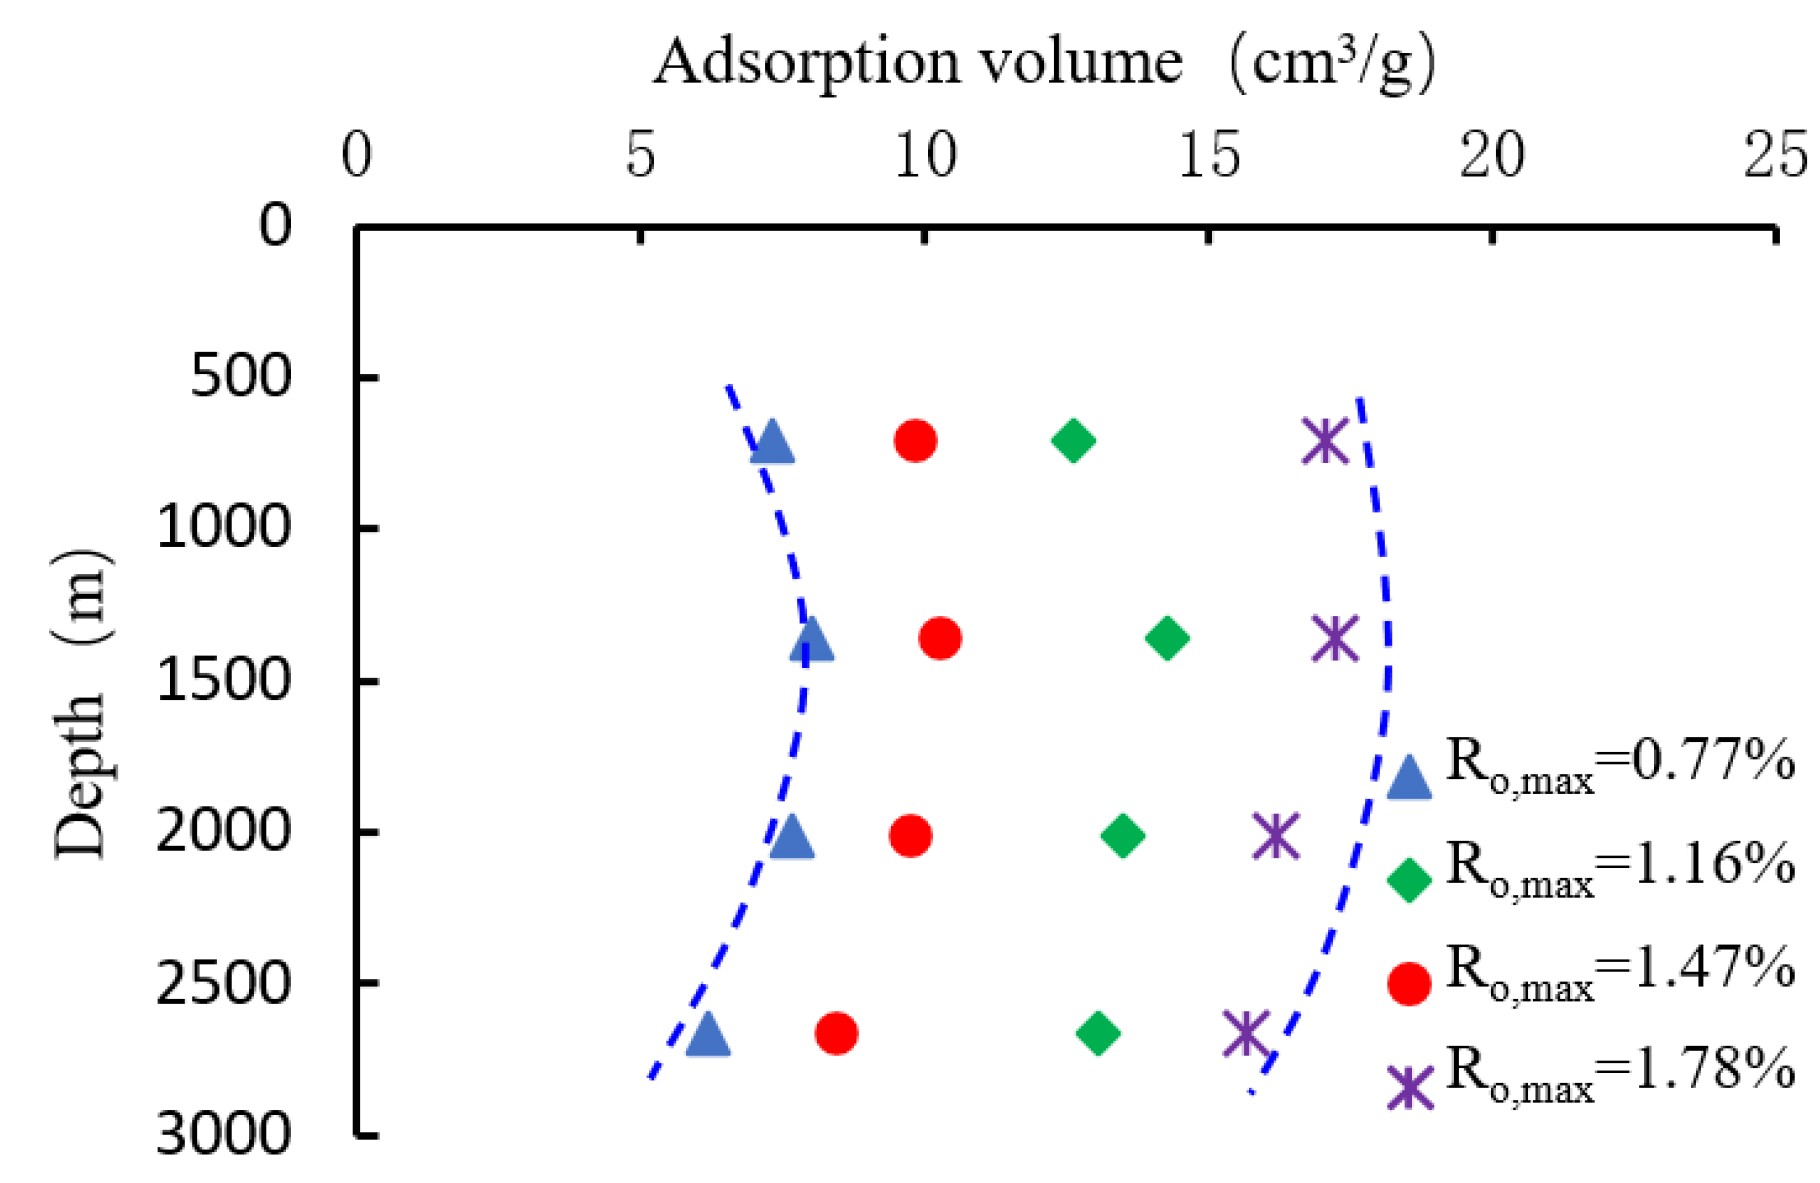
In fact, the temperature, adsorption equilibrium pressure and coal maturity in the experimental tests all contribute to controlling the adsorption amount of gases in coal reservoirs. This understanding can be employed to predict or assess the gas component in coal reservoirs. The study shows that the variation of gas component with the increase in coal buried depth does not become a single positive or negative correlation, but a tendency of initial ascending and subsequent descending [21]. Based on the statistical dissection of suitable temperature logging and great experiment figures, the ground temperature gradient becomes 2.3 °C/100 m, and the formation pressure gradient is determined to be 0.98 MPa/100 m. By converting the temperature and adsorption equilibrium pressure conditions from the previous isothermal adsorption experiments to depth, we can establish characteristic curves that depict the correlation relationship between the theoretical adsorption gas quantity (Figure 5) and the depth at which the coal seam is buried. These curves provide valuable information on the potential gas content and distribution within the coal seam as a function of depth. Upon analysis, it is observed that the adsorption gas quantity displays an “inflection point” around 1200~1500 m. In a shallow depth, the adsorption gas quantity increases as the above-described depth escalates. The adsorption gas quantity decreases as the burial depth beyond this depth escalates. According to the Langmuir equation, shallow coal reservoirs are strongly influenced by reservoir pressure; as depth (i.e., hydrostatic pressure) increases, the ability to absorb methane increases significantly. However, with the increase in depth, the temperature also increases, which is unfavorable to the adsorption, and the negative effect of temperature becomes the main factor controlling the adsorption amount, which leads to the decrease in the gas content [22].
It has to be noted that the depth at which the adsorbed gas volume is converted is different within different CBM regions. Qin et al. consider the eastern edge of the Ordos Basin to be one instance, and find that the conversion depth is in the range of 600~700 m through the measured CBM content and theoretical analysis [23]. The reason for the difference in the depth is that, on the one hand, the ground temperature gradient used in the calculation is different, and Qin et al. used 3.0 °C/100 m as the ground temperature gradient. On the other hand, the reason is the difference between the measured gas component and the theoretical gas adsorption.
Consequences of desorption tests illuminate that the measured gas content of deep coal reservoirs in the Linxing area is 7.18~21.64 cm3/g, and the gas component of coal reservoirs within the Xiegou coal mine field is 3~8 cm3/g. As depicted in Figure 6, When the depth of the coal seam is less than 1200 m, the gas content tends to increase with the depth of the coal seam.. When the above-described depth is 1700~2100 m, the gas component of the coal reservoir does not have any obvious change rule with that depth as the variable. The gas component has a close correlation with the level of coal metamorphism, which shows that with the escalating coal metamorphism, the gas content of coal reservoirs becomes higher. The gas component of coal beds is influenced by various factors, including geological and tectonic conditions, coal bed methane preservation cover conditions and coal material composition. Therefore, the critical conversion depth of coal reservoir gas content is controlled not only by pressure and temperature. When predicting deep coalbed methane resources, it is essential to identify the dominant elements that control the gas.

4. Energy Changes during Isothermal Adsorption Process

4.1. Adsorption Potential and Adsorption Space

The conception of adsorption potential is applied to the thermodynamic theory to describe the adsorption process. It represents the change in the Gibbs free energy of the methane surface after methane adsorption is accomplished on the coal pore surface per unit of molar mass [24]. The equipotential surface is the surface formed by each point of equal adsorption potential energy on the coal matrix surface, and the adsorption space is between the equipotential surface and the adsorbent surface, which is used for storing adsorbed methane molecules. Coal is highly inhomogeneous, and equipotential surfaces on the coal matrix surface are capable of forming potential wells of varying depths. The quantity of coal methane adsorbed depends upon the depth of potential wells and the quantity of potential wells. Moreover, the adsorption potential can be used to express the adsorption amount, so the coal adsorption capacity can be analyzed by adsorption potential. The adsorption potential and pressure are presented below:
ε = P i P 0 T R P d P = R T l n P 0 P i ,
in which ε refers to the adsorption potential, J/mol; P0 refers to the pressure of the saturated vapor, MPa.
The critical methane temperature reaches −82.6 °C; synchronously, the critical pressure reaches 4.6 MPa. Since the temperature at which methane is adsorbed by coal surpasses the critical temperature greatly, the pressure of the saturated vapor at this point is not applicable to the calculation of the adsorption potential. As for the saturated vapor, its virtual pressure in supercritical circumstances can be applied for calculation [25]
P 0 = P c ( T T c ) k ,
where Pc refers to the methane critical pressure, which reaches 4.62 MPa; Tc refers to the methane critical temperature, which reaches 190.6 K; k refers to the coefficient related to the adsorption system, which is 2 for the D-R equation.
The adsorption space becomes a characteristic parameter characterizing the microporous construction and could be employed with the objective to expressing the quantity of content of methane adsorbed by coal (adsorption capacity), which is calculated as
w = V a d M ρ a d ,
in which w refers to the volume of the adsorption space, cm3/g; Vad refers to the absolute adsorption capacity, cm3/g; M refers to the methane molecular weight, g/mol; ρad refers to the adsorption phase density, g/cm3.
The adsorbed phase density is the ratio of the total amount of adsorbed gas to the volume of the adsorbed phase, which cannot be measured directly through the existing experimental means [26,27]. It could be calculated by Formula (4). This calculation assumes that the adsorbed phase can be considered as a superheated liquid. Further, the value of the thermal expansion is assumed to be independent of the species of the adsorbate [28].
ρ a d = ρ b e x p 0.0025 × T - T b ,
in which ρad refers to the adsorption phase density, g/cm3; ρb refers to the density of methane at boiling point, g/cm3, its value is 0.4224, and Tb refers to the boiling point temperature of methane, and its value is 111.7 k.
The amount of adsorption at the pressure and temperature of an isothermal adsorption experiment is the apparent amount of adsorption, which is also known as the Gibbs adsorption quantity or added adsorption quantity. When applying the adsorption quantity to calculate the adsorption space, it is necessary that the apparent adsorption quantity is converted to the absolute adsorption quantity. The equation for the absolute adsorption amount is listed under the premise that the adsorption amount in the standardized state is altered to a molar volume:
V a d = V a p 1 ρ g ρ a d ,
where Vab denotes the absolute capacity of adsorption, cm3/g; Vap denotes the excess adsorption capacity, cm3/g.
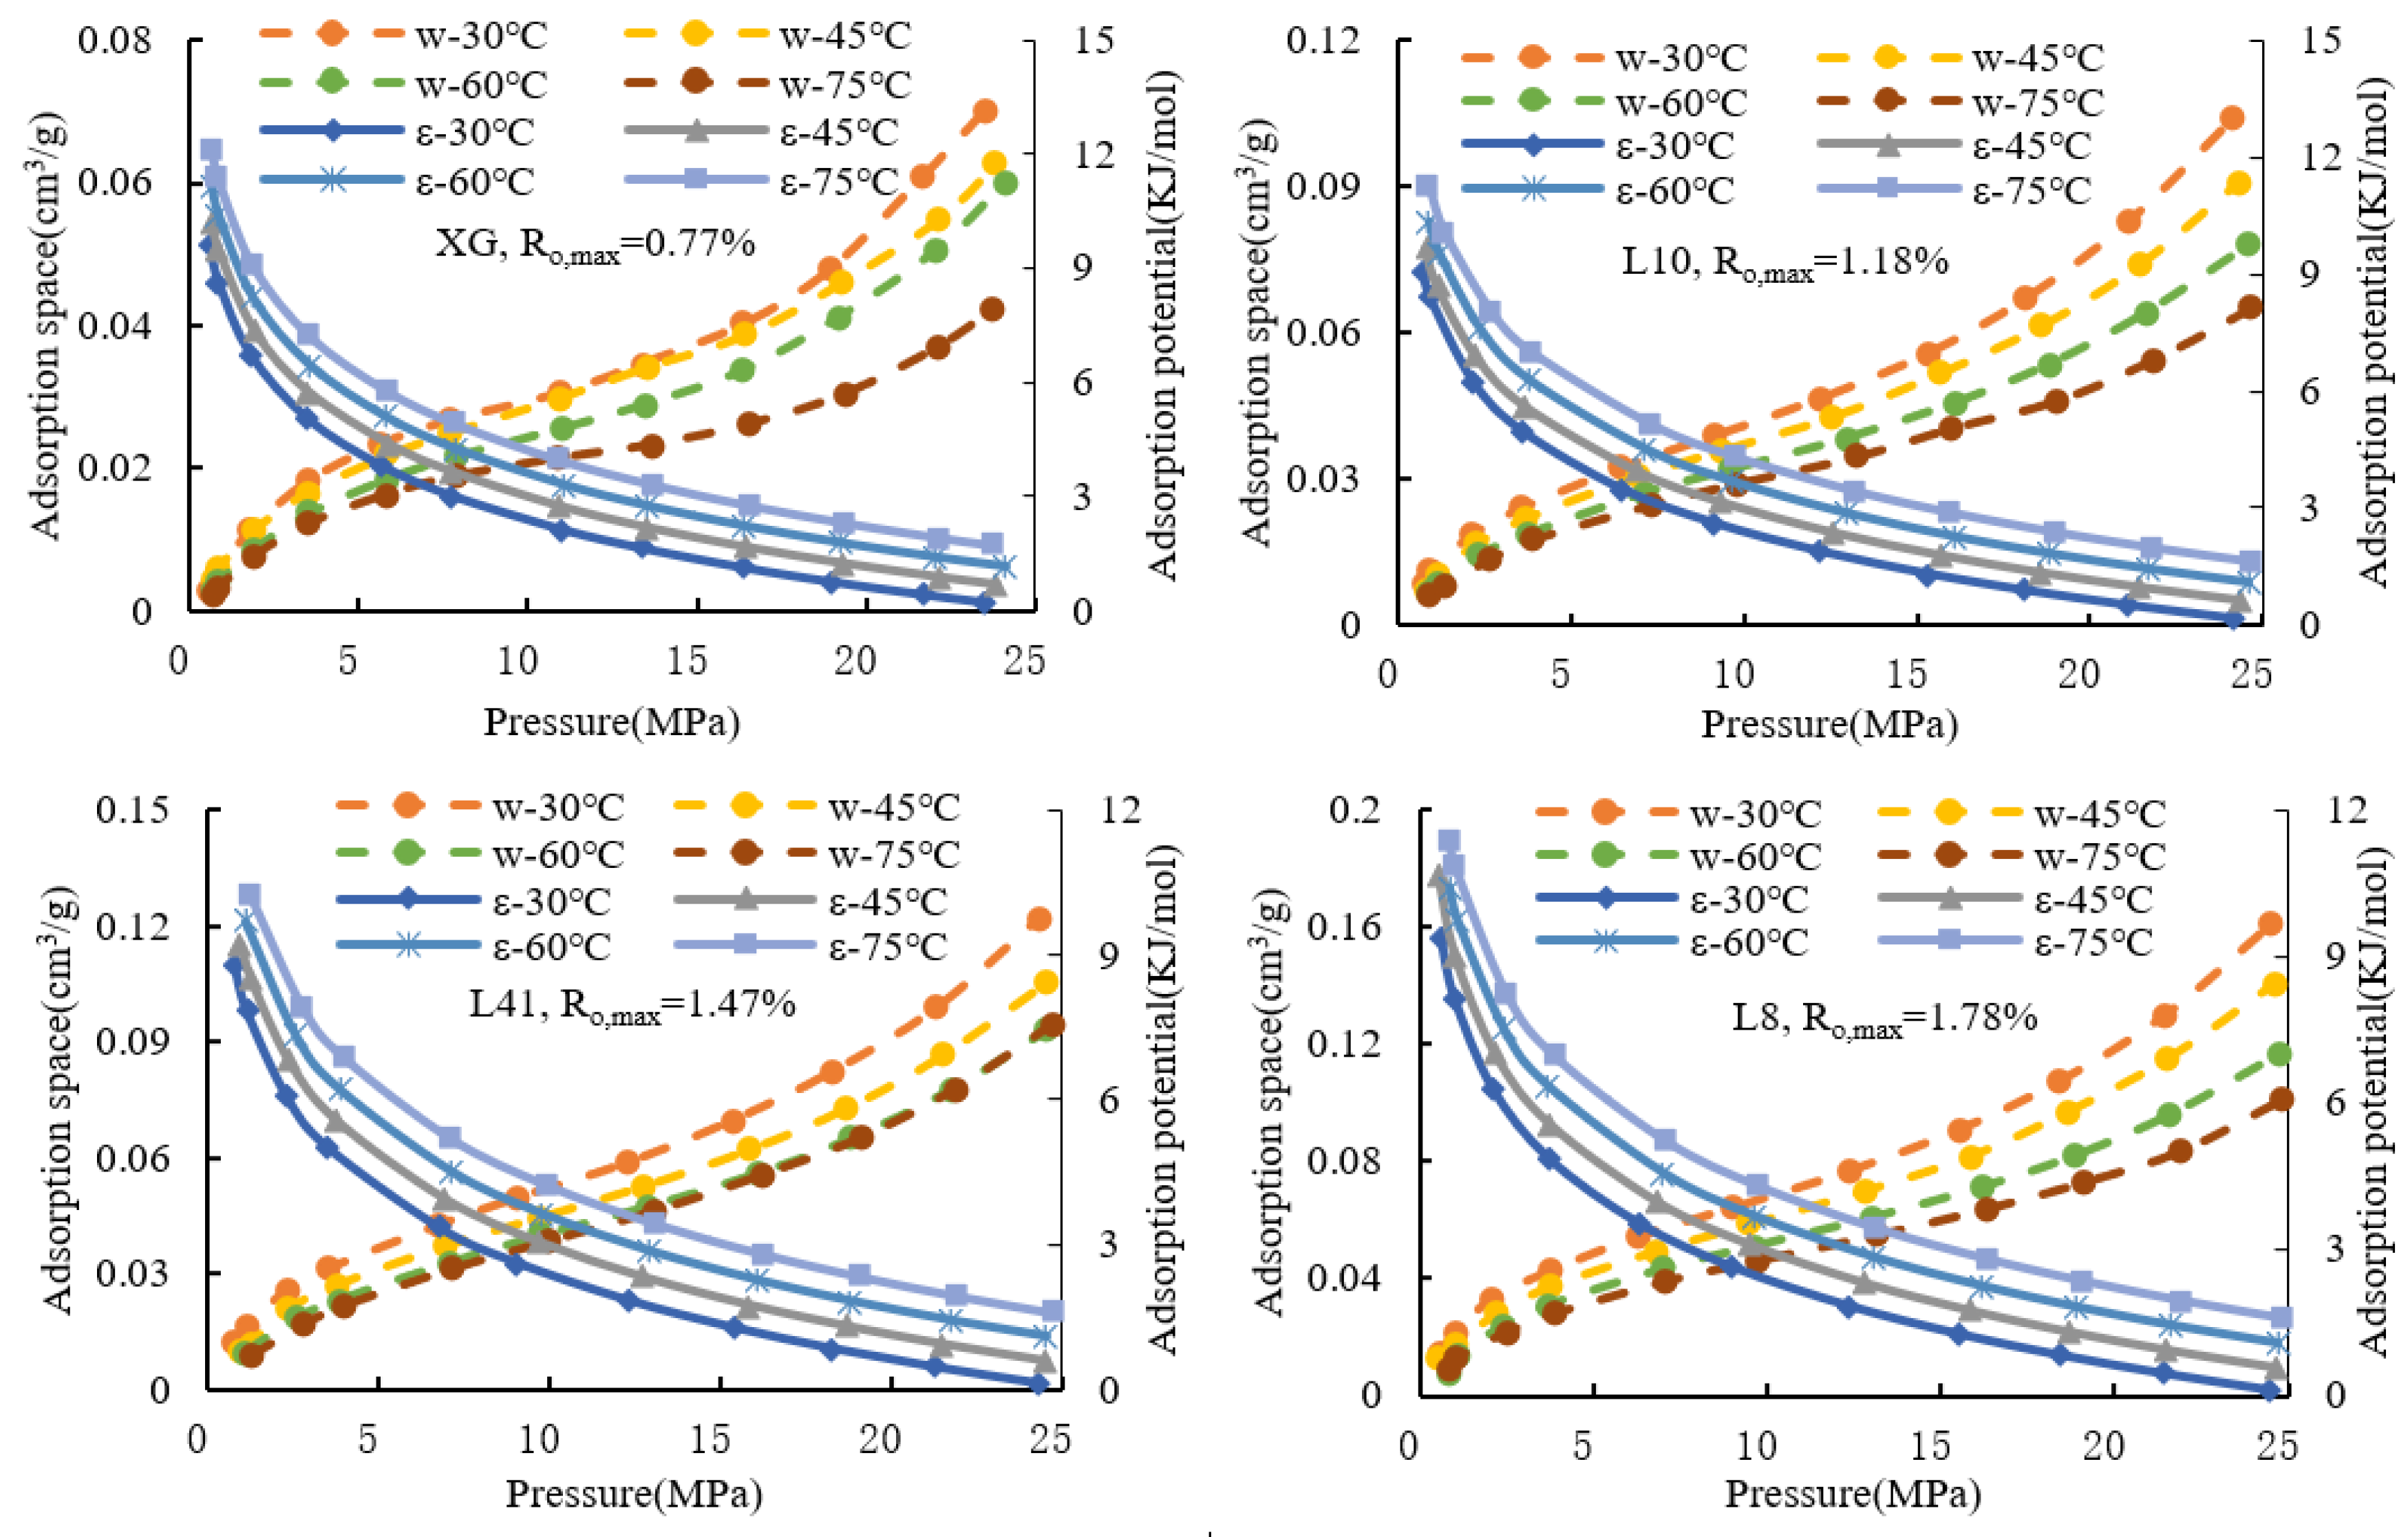
Based on Equations (1)–(5), these theoretical characteristic parameters of adsorption potential at four temperatures are calculated for four categories of coals with four levels of metamorphism. In the calculation process, pi in Equation (1) corresponds to the adsorption equilibrium pressure in isothermal adsorption experiments. T in Equation (2) is the adsorption experimental temperature, which needs to be converted from °C to k. As shown in Figure 7, the control of temperature on the adsorption potential was analyzed using coal specular plasma reflectivity and pressure as quantitative measures, and it can be concluded that the adsorption potential increases with the increase of temperature.. It is determined through analysis that with the escalating temperature, methane molecule movements intensify, resulting in a growing difficulty of adsorption. The effect of pressure on the adsorption potential is analyzed using the reflectance of coal mirror plasmas and temperature as quantitative measures. It can be concluded that adsorption potential and adsorption balance pressure are negatively correlated; in addition, the adsorption potential descends rapidly as pressure increases when the pressure is in a range from 0 to 5 MPa. While the pressure ascends, the adsorption potential decreases slowly. The analysis shows that the methane molecules prefer to choose the position exhibiting a higher adsorption energy potential for adsorption. First, the adsorption is carried out on the inner wall of the pore, and gradually, from monolayer to multilayer, the adsorption potential generated by the first adsorption is larger [29].
The influence of temperature on adsorption capacity is analyzed by quantifying the reflectivity and pressure of coal mirror plasmas. The analysis indicates that temperature and adsorption capacity are negatively correlated, and this negative correlation becomes more pronounced as pressure increases. As an example, the distinction between adsorption space at 30 °C and 60 °C for XG coal samples is 0.004 cm3/g at a pressure of 3.5 MPa. When the pressure reaches 11 MPa, this distinction in adsorption space between the two temperatures is 0.005 cm3/g. Similarly, when the pressure reaches 19 MPa, this value is 0.007 cm3/g. The reason for analysis is just that as the adsorption pressure escalates, the adsorbed gas volume escalates; in addition, changes in temperature and pressure bring about the variations within the density of the adsorbed phase, which, in turn, impacts the adsorption space of the coal.
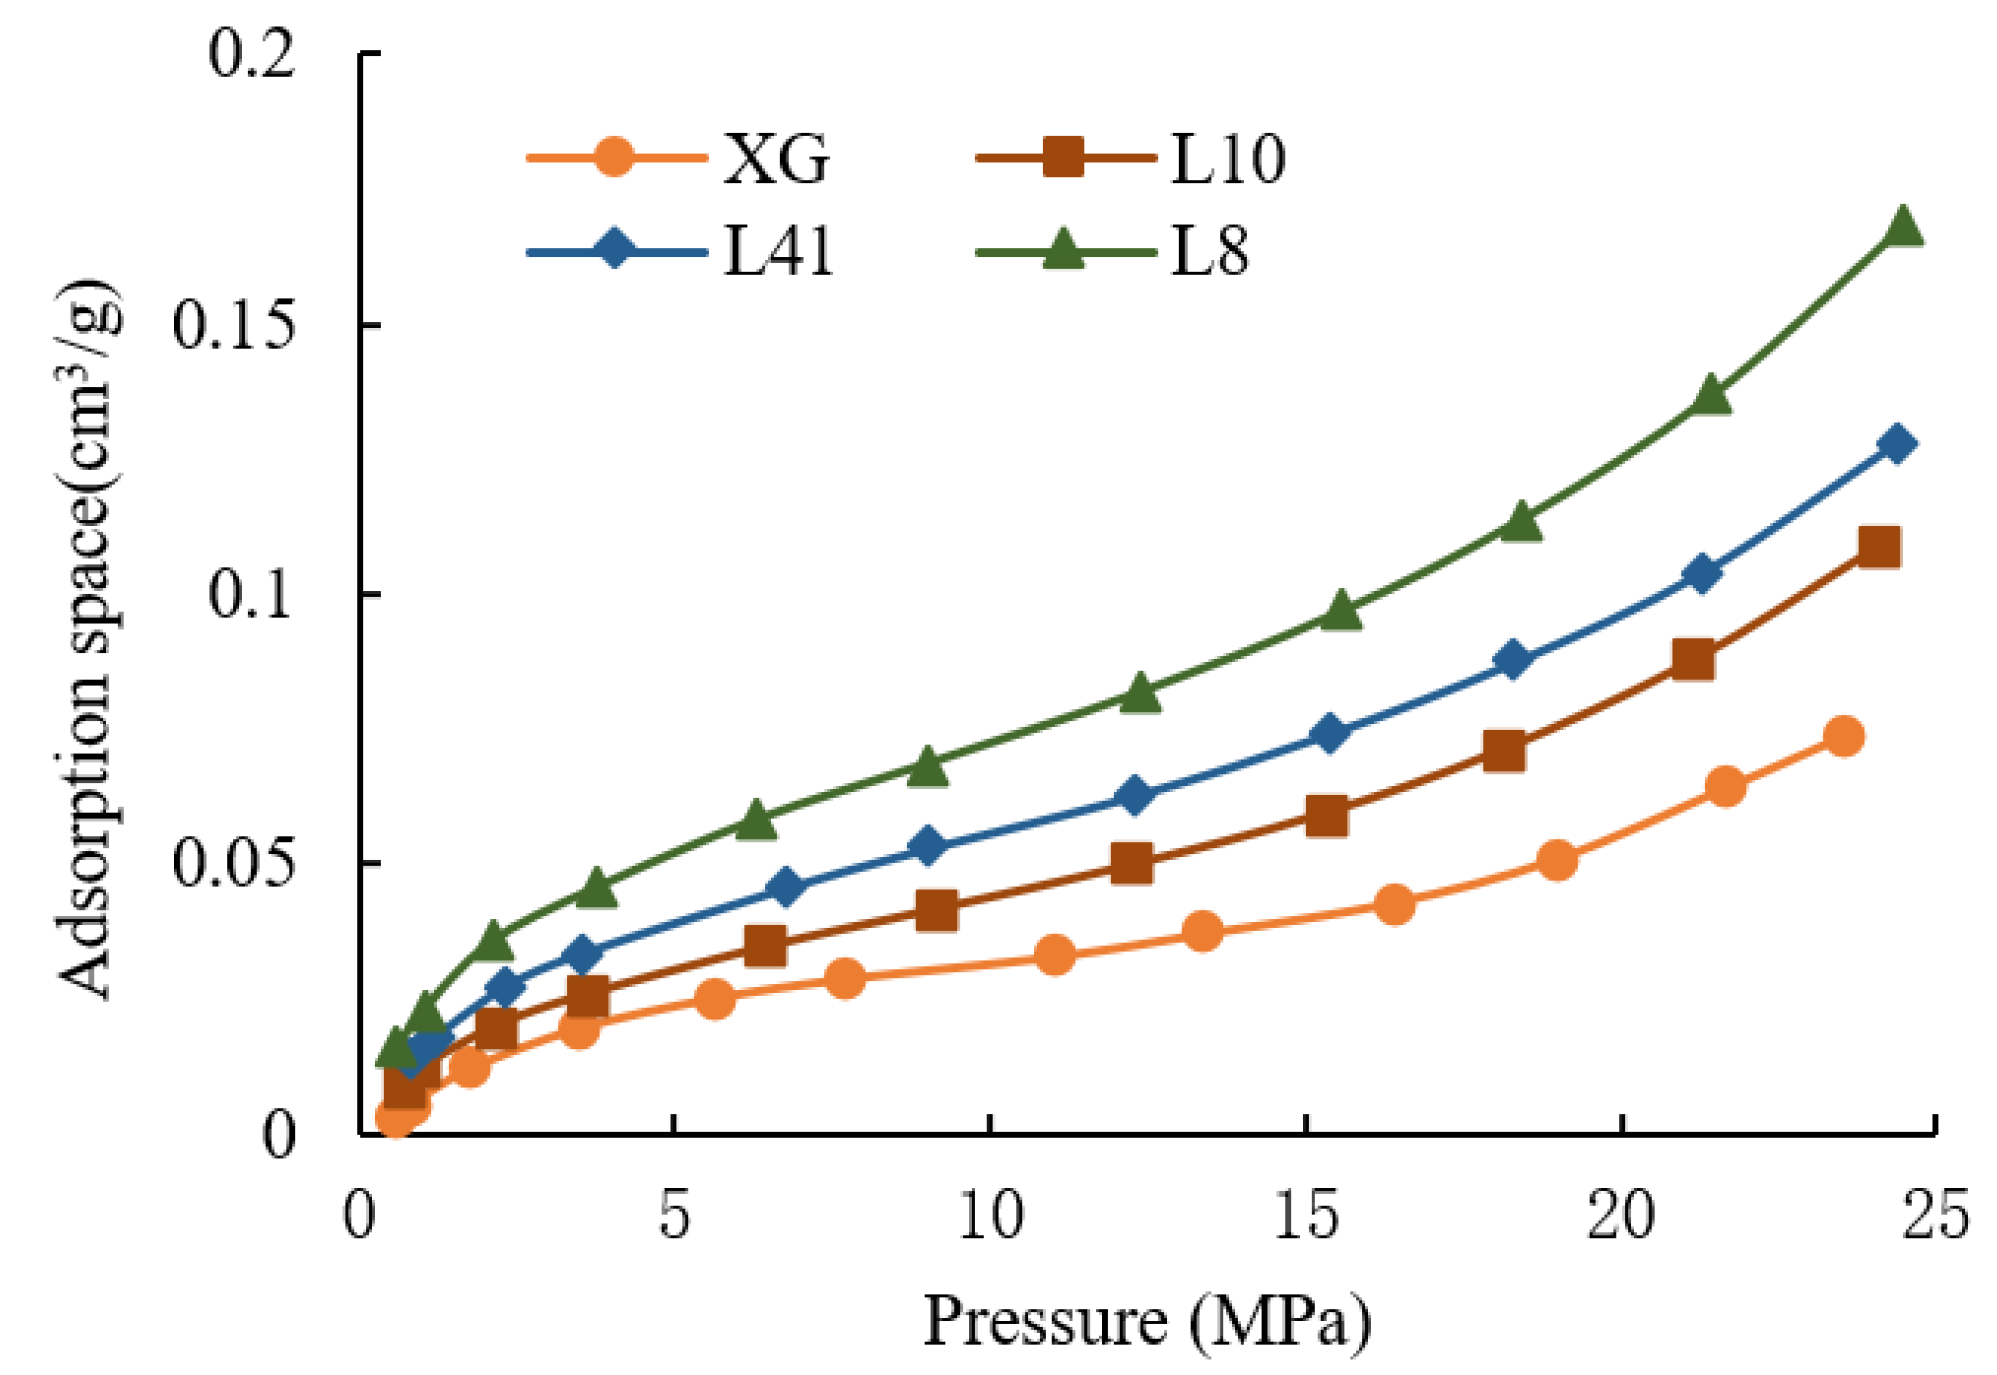
As depicted in Figure 8, taking adsorption equilibrium pressure as a quantitative parameter, the adsorption space gradually ascends as the reflectance of the coal specular plasma ascended, which is associated with the specific surface of coal pores, and the adsorption pores become more developed as the coal metamorphism level escalates. When the adsorption pressure increases, the difference between the adsorption spaces of coals with disparate levels of the metamorphism becomes more obvious. For example, at a temperature of 60 °C and an adsorption equilibrium pressure of 21.5 MPa, the pore specific surface area of the nitrogen adsorption test increases from 0.26 m2/g to 0.89 m2/g, the pore specific surface area of the carbon dioxide adsorption test increases from 44.90 m2/g to 72.31 m2/g, and the adsorption space increases from 0.064 m3/g to 1.137 m3/g as the deterioration degree of the coal increases, suggesting that the adsorption space and pore specific surface area show a positive correlation.
Previous studies have shown that the distinction between the capacity of the absolute adsorption and the capacity of the apparent adsorption becomes significant as the adsorption balance pressure grows. If the coal adsorption capacity is greater, the difference between the two is greater, too. The adsorption parameters derived from the absolute adsorption amount can more realistically reflect the quantity of methane adsorbed by coal at a high pressure [30,31,32].

4.2. Surface Free Energy

Coal consists of highly condensed aromatic rings or hydrogenated aromatic rings, linked by disparate forms of chemical bonding, and it is a macromolecular structure with carbon atoms as the backbone, containing an enormous quantity of branched chains with oxygen-containing functional groups or alkyl groups as the main components [33,34,35]. Carbon atoms on the coal pore surface can break equilibrium between the coal macromolecular skeleton, and vacancies on the side of the carbon atoms cause unbalanced forces. Methane molecules move towards the interior of the coal structure due to the gravitational pull of coal, and the energy gained by carbon atoms on the coal surface is the surface free energy [36,37]. The decrease in surface tension resulting from coal methane adsorption can be determined by the following equation:
d σ = R T Γ d ( ln P ) ,
in which σ denotes the surface tension, J/m2; Γ denotes the surface excess, mol/m2.
After the adsorption of a certain amount of methane molecules on the coal matrix surface, the methane concentration on the surface is higher than that in the interior of the matrix, and this concentration difference is known as the surface excess, which can be expressed as
Γ = V a p S V 0 ,
in which S denotes the specific surface of pores in coal, m2/g; V0 denotes the molar volume of the gas in the standardized condition, 22.4 L/mol.
In association with Equations (6) and (7), the overall reduction within surface free energy of coal during adsorption under supercritical conditions could be calculated as
Δ γ = R T V a p S V 0 ln ( P ) ,
in which Δγ denotes the total reduction value of the above-described free energy, J/m2, indicating the change in the surface freedom produced by coal adsorption of methane.
Differentiating P in Equation (8), the change value in the above-described free energy at different adsorption pressure points is obtained:
Δ γ p = R T V a p S V 0 P
in which Δγp denotes the reduction value of the aforementioned free energy at each point of pressure, J/m2.
In Equations (6)–(9) calculating the surface free energy, S is the specific surface area of pores, mainly adsorption pores, which can be obtained from the N2 and CO2 adsorption experiments in Table 1. P is the adsorption equilibrium pressure, and there are eleven adsorption equilibrium pressure points for each set of isothermal adsorption experiments.
Calculating the accumulated decrease in the aforementioned free energy at each point, when the adsorption pressure gradually increases, the accumulated decrease on the coal matrix surface exhibits a tendency of slow increase, but the increasing magnitude becomes smaller and smaller, which is similar to the variation rule of the adsorption quantity with pressure during the isothermal adsorption. The coal mechanism lessens its surface free energy through adsorbing methane molecules, and along with the adsorption process. As the free energy of coal pores decreases, more methane molecules will be adsorbed onto the coal surface, resulting in a larger volume of adsorbed gas. This is because a lower free energy indicates a more favorable environment for the adsorption process. As a result, if the accumulated decrease in free energy of coal pores is larger, it means that the overall conditions for adsorption are more favorable. Therefore, the strength of the coal adsorption for methane molecules could be judged using the magnitude of the accumulated change in the aforementioned free energy of coal. In addition, in the same pressure condition, the total decrease in the aforementioned free energy accelerates as the coal specular reflectance ascends, which corresponds to the strong coal adsorption with a large specular reflectance. Contrasting Figure 9a,b, it could be concluded that the aforementioned free energy decreases as temperature increases, which means that the energy that can be reduced by the system decreases. In accordance with the energy change, it also indicates that the rise in temperature is unfavorable to the coal adsorption of methane gas. From the information described in Figure 9, the variation law of surface free energy at each adsorption equilibrium pressure point can be obtained. It can be seen that as the pressure increases gradually, the surface free energy at each point of pressure decreases step by step; in addition, the decrease is faster at the start of adsorption. At first, there are more high-potential energy sites on the coal matrix surface; methane molecules are adsorbed on them preferentially; the adsorption amount changes greatly with pressure; and the speed of the above-described free energy decrease is fast. As the adsorption process proceeds, the high-potential energy sites decrease, coupled with more methane molecules adsorbed onto the coal matrix surface. The universal gravitation of the coal matrix to free methane molecules decreases, and the amount of adsorbed methane decreases by increasing the unit pressure. Additionally, the speed of the surface free energy reduction decreases slowly.

5. Conclusions

The adsorbability to coalbed methane is controlled by combining the degree of coal deterioration, pressure and temperature. As the burial depth of the coal seam is shallow, pressure is the main factor controlling adsorption. When the burial depth exceeds a certain value, the temperature gradually becomes the main factor affecting the adsorption. For the four coal samples tested, as the degree of coal deterioration increased, the number of developed coal ultra-micropores and micropores increased, the pore specific surface area of the coal increased, and thus the adsorption capacity of the coal became stronger. The gas theoretical adsorption in coal reservoirs changed with the depth of burial, and there was a “critical conversion depth”, which is between 1200 and 1500 m in the Linxing area.
During the isothermal adsorption process, there are several correlations worth noting. First, pressure and adsorption space are positively correlated. Conversely, an increase in temperature leads to a decrease in adsorption space. Second, pressure and adsorption potential are negatively correlated, and an increase in temperature makes the adsorption potential larger. Third, the total decrease in surface free energy of coal is positively correlated with the adsorption equilibrium pressure, but decreases with increasing temperature. Finally, the surface free energy at each pressure point decreases with increasing pressure. However, the rate of decrease slows down, reflecting that it becomes more difficult to adsorb methane molecules onto the coal surface as the pressure increases.

Author Contributions

Investigation, H.F.; Resources, H.M.; Data curation, M.X. and X.Z.; Writing—original draft, C.T. and T.J.; Writing—review and editing, Y.W. All authors have read and agreed to the published version of the manuscript.

Funding

This research was supported by the National Great Science and Technology Specific Project (2016ZX05066001-002, 2017ZX05064-005), National Science Foundation for Young Scientists of China (Grant No. 41702171), Program for Excellent Talents in Beijing (2017000020124G107), Project of Education Department of Liaoning Province (LJKMZ20220744), Doctoral research Start-up Project of Liaoning Petrochemical University (2021XJJL-025). We thank China United Coalbed Methane Co., Ltd. for providing the data and help for this paper.

Data Availability Statement

The data used to support the findings of this study are included within the article.

Conflicts of Interest

The authors declare no conflict of interest.

References

  1. Sun, F.R.; Liu, D.M.; Cai, Y.D.; Qiu, Y.K. Coal rank-pressure coupling control mechanism on gas adsorption/desorption in coalbed methane reservoirs. Energy 2023, 270, 126849. [Google Scholar] [CrossRef]
  2. Jean, R.; Francoise, R.; Philip, L. Adsorption by Powders and Porous Solids: Principles, Methodology and Applications; Academic Press: Pittsburgh, PA, USA, 2013. [Google Scholar]
  3. Liu, S.S.; Meng, Z.P. Study on energy variation of different coal-body structure coals in the process of isothermal adsorption. J. China Coal Soc. 2015, 40, 1422–1427. [Google Scholar]
  4. Wu, S.; Tang, D.Z.; Li, S.; Chen, H.; Wu, H.Y. Coalbed methane adsorption behavior and its energy variation features under supercritical pressure and temperature conditions. J. Pet. Sci. Eng. 2016, 146, 726–734. [Google Scholar] [CrossRef]
  5. Guo, H.J.; Cheng, Y.P.; Wang, L.; Lu, S.Q.; Jin, K. Experimental study on the effect of moisture on low-rank coal adsorption characteristics. J. Nat. Gas Sci. Eng. 2015, 24, 245–251. [Google Scholar] [CrossRef]
  6. Jiang, W.P.; Cui, Y.J.; Zhang, Q.; Zhong, L.W.; Li, Y.H. The quantum chemical study on different rank coals surface interacting with methane. J. China Coal Soc. 2007, 32, 292–295. [Google Scholar]
  7. Li, H.J.; Wang, S.C.; Zeng, Q.; Kang, J.H.; Guan, W.M.; Li, W.T. Effects of Pore Structure of Different Rank Coals on Methane Adsorption Heat. Processes 2021, 9, 1971. [Google Scholar] [CrossRef]
  8. Nie, B.S.; He, X.Q.; Wang, E.Y. Surface free energy of coal and its calculation. J. Taiyuan Univ. Technol. 2000, 31, 346–348. [Google Scholar]
  9. Li, X.J.; Lin, B.Q.; Xu, H. Monte Carlo simulation of methane molecule adsorption on coal with adsorption potential. Int. J. Min. Sci. Technol. 2014, 24, 17–22. [Google Scholar] [CrossRef]
  10. Xie, J.; Liang, Y.P.; Zou, Q.L.; Wang, Z.H.; Li, X.L. Prediction Model for Isothermal Adsorption Curves Based on Adsorption Potential Theory and Adsorption Behaviors of Methane on Granular Coal. Energy Fuels 2019, 33, 1910–1921. [Google Scholar] [CrossRef]
  11. Li, S.; Tang, D.Z.; Pan, Z.J.; Xu, H.; Guo, L.L. Evaluation of coalbed methane potential of different reservoirs in western Guizhou and eastern Yunnan, China. Fuel 2015, 139, 257–267. [Google Scholar] [CrossRef]
  12. Ji, L.M.; Zhang, T.W.; Milliken, K.L.; Qu, J.L.; Zhang, X.L. Experimental investigation of main controls to methane adsorption in clay-rich rocks. Appl. Geochem. 2012, 27, 2533–2545. [Google Scholar] [CrossRef]
  13. Baran, P.; Zarebska, K.; Bukowska, M. Expansion of Hard Coal Accompanying the Sorption of Methane and Carbon Dioxide in Isothermal and Non-isothermal Processes. Energy Fuels 2015, 29, 1899–1904. [Google Scholar] [CrossRef]
  14. Shen, J.; Zhang, C.J.; Qin, Y.; Zhang, B. Effect factors on comining of sandstone gas and coalbed methane in coal series and threshold of parameter in Linxing block, Ordos Basin. Nat. Gas Geosci. 2017, 28, 479–487. [Google Scholar]
  15. Xie, Y.G.; Meng, S.Z.; Gao, L.J.; Zhang, X.Y.; Duan, C.J.; Wang, H.P. Assessments on potential resources of deep coal bed methane and compact sandstone has in Linxin Area. Coal Sci. Technol. 2015, 43, 21–24+28. [Google Scholar]
  16. Tao, C.Q.; Wang, Y.B.; Ni, X.M.; Wu, X. Key accumulation period for coal series gas reservoir in upper carboniferous Benxi Formation, Linxing block. J. China Univ. Min. Technol. 2018, 47, 531–537. [Google Scholar]
  17. GB/T 6948-2008; Method of Determining Microscopically the Reflectance of Vitrinite in Coal. Standardization Administration of the People’s Republic of China: Beijing, China, 2008.
  18. GB/T212-2008; Proximate Analysis of Coal. Standardization Administration of the People’s Republic of China: Beijing, China, 2008.
  19. Chen, S.D.; Tao, S.; Tang, D.Z.; Xu, H.; Li, S.; Zhao, J.J.; Jiang, Q.; Yang, H.X. Pore Structure Characterization of Different Rank Coals Using N2 and CO2 Adsorption and Its Effect on CH4 Adsorption Capacity: A Case in Panguan Syncline, Western Guizhou, China. Energy Fuels 2017, 31, 6034–6044. [Google Scholar] [CrossRef]
  20. Long, H.; Lin, H.F.; Yan, M.; Chang, P.; Li, S.G.; Bai, Y. Molecular simulation of the competitive adsorption characteristics of CH4, CO2, N2, and multicomponent gases in coal. Powder Technol. 2021, 385, 348–356. [Google Scholar] [CrossRef]
  21. Shen, J.; Qin, Y.; Fu, X.H.; Chen, G.; Chen, R. Properties of Deep Coalbed Methane Reservoir-forming Conditions and Critical Depth Discussion. Nat. Gas Geosci. 2014, 25, 1470–1476. [Google Scholar]
  22. Moore, T.A. Coalbed methane: A review. Int. J. Coal Geol. 2012, 101, 36–81. [Google Scholar] [CrossRef]
  23. Qin, Y.; Moore, T.A.; Shen, J.; Yang, Z.B.; Shen, Y.L.; Wang, G. Resources and geology of coalbed methane in China: A review. Int. Geol. Rev. 2018, 60, 777–812. [Google Scholar] [CrossRef]
  24. Polanyi, M. The potential theory of adsorption. Science 1963, 141, 1010–1013. [Google Scholar] [CrossRef] [PubMed]
  25. Amankwah, K.A.G.; Schwarz, J.A. A modified approach for estimating pseudovapor pressure in the application of the Dubinin-Astakhov equation. Carbon 1995, 33, 1313–1319. [Google Scholar] [CrossRef]
  26. Mosher, K.; He, J.J.; Liu, Y.Y.; Rupp, E.; Wilcox, J. Molecular simulation of methane adsorption in micro- and mesoporous carbons with applications to coal and gas shale systems. Int. J. Coal Geol. 2013, 109–110, 36–44. [Google Scholar] [CrossRef]
  27. Perez, F.; Devegowda, D. Estimation of adsorbed-phase density of methane in realistic overmature kerogen models using molecular simulations for accurate gas in place calculations. J. Nat. Gas Sci. Eng. 2017, 46, 865–872. [Google Scholar] [CrossRef]
  28. Ozawa, W.; Kusumi, S.; Ogino, Y.J. Physical adsorption of gases at high pressure. Ⅳ. An improvement of the Dubinin-Astakhov adsorption equation. J. Colloid Interface Sci. 1976, 56, 83–91. [Google Scholar] [CrossRef]
  29. Li, Q.Z.; Lin, B.Q.; Wang, K.; Zhao, M.Z.; Ruan, M.L. Surface properties of pulverized coal and its effects on coal mine methane adsorption behaviors under ambient conditions. Powder Technol. 2015, 270, 278–286. [Google Scholar] [CrossRef]
  30. Yang, Z.B.; Qin, Y.; Gao, D.; Chen, R. Differences between apparent and true adsorption quantity of coalbed methane under supercritical conditions and their geological significance. Nat. Gas Ind. 2011, 31, 13–16+122. [Google Scholar]
  31. Lu, S.Q.; Wang, L.; Qin, L.M. Analysis on Adsorption Capacity and Adsorption Thermodynamic Characteristics of different Metamorphic Degree Coals. Coal Sci. Technol. 2014, 42, 130–135. [Google Scholar]
  32. Meng, Z.P.; Liu, S.S.; Li, G.Q. Adsorption capacity, adsorption potential and surface free energy of different structure high rank coals. J. Pet. Sci. Eng. 2016, 146, 856–865. [Google Scholar] [CrossRef]
  33. Wang, Z.Z.; Fu, X.H.; Pan, J.N.; Deng, Z. Effect of N2/CO2 injection and alternate injection on volume swelling/shrinkage strain of coal. Energy 2023, 275, 127377. [Google Scholar] [CrossRef]
  34. Zou, W.J.; Cao, Y.J.; Sun, C.B. Adsorption of anionic polyacrylamide onto coal and kaolinite: Changes of surface free energy components. Part. Sci. Technol. 2017, 35, 233–238. [Google Scholar] [CrossRef]
  35. Tao, C.Q.; Wang, Y.B.; Li, Y.; Ni, X.M.; Gao, X.D. Adsorption Mechanism and Kinetic Characterization of Bituminous Coal under High Temperatures and Pressures in the Linxing-Shenfu Area. Acta Geol. Sin. 2020, 94, 399–408. [Google Scholar] [CrossRef]
  36. Du, X.D.; Cheng, Y.G.; Liu, Z.J.; Yin, H.; Wu, T.F.; Huo, L.; Shu, C.X. CO2 and CH4 adsorption on different rank coals: A thermodynamics study of surface potential, Gibbs free energy change and entropy loss. Fuel 2021, 283, 11886. [Google Scholar] [CrossRef]
  37. Wang, Z.Z.; Fu, X.H.; Hao, M.; Li, G.F.; Pan, J.N.; Niu, Q.H.; Zhou, H. Experimental insights into the adsorption-desorption of CH4/N2 and induced strain for medium-rank coals. J. Pet. Sci. Eng. 2021, 204, 108705. [Google Scholar] [CrossRef]
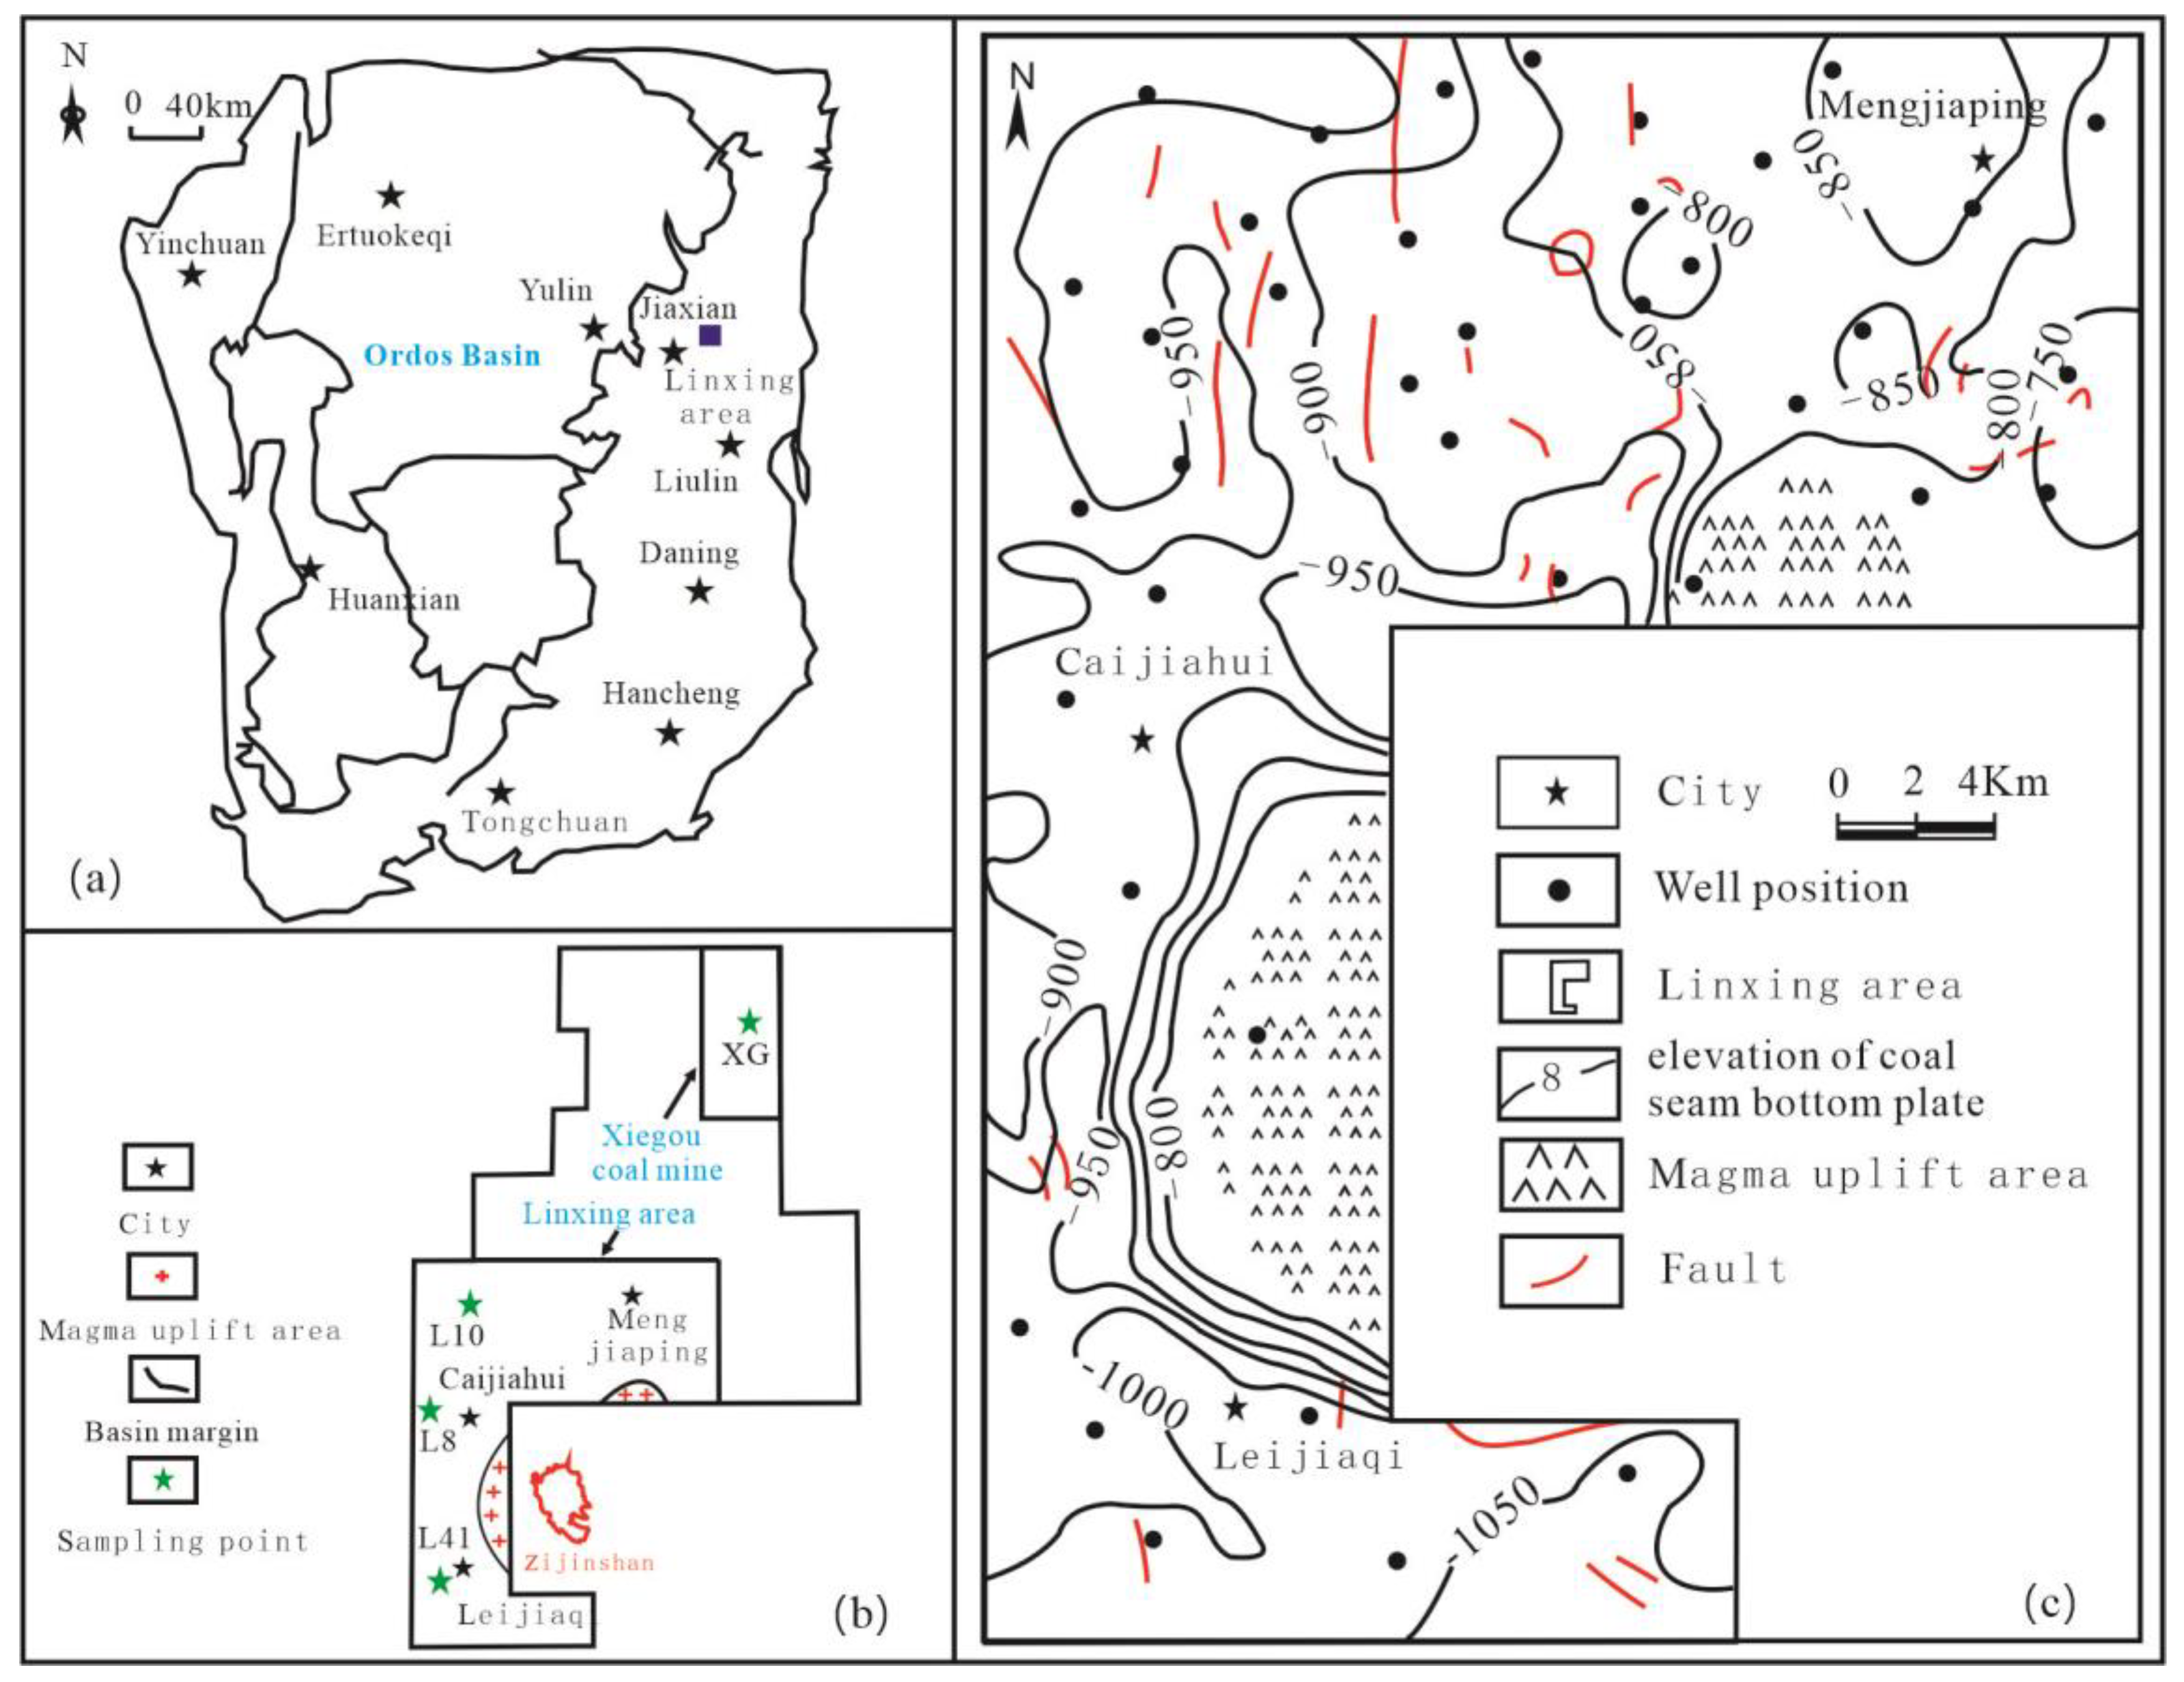
Figure 1. Geographical location of coal samples and structural outline of Linxing area. (a) Study area location in the Ordos Basin; (b) sample location; (c) structural outline map of the study area.
Processes 11 02524 g001
Figure 2. Photos of maceral constitution of coal specimens. (a) The vitrinite and fuinite of sample XG (burial depth of 450.0 m). (b) The telocollinite of sample L10 (burial depth of 1636.6 m). (c) The telinite and pytite of sample L41 (burial depth of 2458.0 m). (d) The semifuinite of sample L8 (burial depth of 1888.0 m).
Processes 11 02524 g002
Figure 3. Methane adsorption isotherms with the equilibrating water for disparate coal ranks.
Processes 11 02524 g003
Figure 4. Relationship between Langmuir volume and vitrinite reflectance under different temperature conditions.
Processes 11 02524 g004
Figure 5. Correlation between theoretical adsorption gas volume and the depth at which coal seam is buried.
Processes 11 02524 g005
Figure 6. Vertical variation of gas content inside coal reservoirs within Linxing and Xiegou coal mine.
Processes 11 02524 g006
Figure 7. Curves of adsorption characteristic parameters versus temperature, pressure and degree of coal deterioration (w is the adsorption space; ε is the adsorption potential).
Processes 11 02524 g007
Figure 8. Adsorption space versus pressure at 60 °C adsorption temperature.
Processes 11 02524 g008
Figure 9. Surface free energy changes in coal systems under pressure and temperature.
Processes 11 02524 g009
Table 1. Sample information and test results.
Sample InformationMaceral CompositionProximate AnalysisPore Specific Surface Area
Sample NumbersDepth
(m)
Ro,max
(%)
Coal RankVitrinite (%)Inertinite
(%)
Moisture
(%)
Ash
(%)
Valitile
(%)
N2
(m2/g)
CO2
(m2/g)
XG450.00.77gas coal78.327.862.4110.5035.120.2644.90
L101636.61.16fat coal76.458.500.9511.1226.850.2754.62
L412158.01.47coking coal85.2010.201.127.8520.240.6065.90
L81888.01.78thin coal82.425.400.6314.6412.660.8972.31
Disclaimer/Publisher’s Note: The statements, opinions and data contained in all publications are solely those of the individual author(s) and contributor(s) and not of MDPI and/or the editor(s). MDPI and/or the editor(s) disclaim responsibility for any injury to people or property resulting from any ideas, methods, instructions or products referred to in the content.